eu vehicle technology study: development of preliminary cost curves … · eu vehicle technology...
TRANSCRIPT

ICCT International Workshop on greenhouse gas reduction potential and costs of light-duty vehicle technologies
EU vehicle technology study: Development of preliminary cost curves for the EU market
Peter Mock April 27, 2012 Brussels
Agenda
Methodology for developing the curves 1
Preliminary results 2
Conclusions and outlook 3

3
Methodology The ICCT approach
Vehicle technology cost analysis
(FEV / University Aachen)
Vehicle CO2 reduction potential simulation
(Ricardo)
Phase II
EU vehicle market statistics
(ICCT, Ökopol)
CO2 reduction cost curves for EU vehicle segments (ICCT, Meszler Engineering Services)
Calculation of effects for society (macro level) (ICCT, tbd)
Phase I
accompanying workshops, briefings and publications

4
Methodology Data sources
Ricardo CO2 reduction potential analysis on
behalf of ICCT EPA / NHTSA 2017-25 proposed rulemaking
FEV cost analysis on behalf of ICCT
EU cost curves
only where no EU information available

C-segment (32% market, 38% diesel)
5
Methodology The baseline vehicles
Gasoline Ricardo EU-27 Ricardo EU-27
Vehicle model Ford Focus n/a Ford Focus n/a
Engine size 4 cyl., 1.6 l 4 cyl., 1.6 l 4 cyl., 1.6 l 4 cyl., 1.7 l
Engine power 88 kW 86 kW 75 kW 83 kW
Engine type PFI PFI (MS DI≈19%) n/a n/a
Vehicle weight 1,257 kg 1,270 kg 1,413 kg 1,360 kg
Transmission 6-MT MT (MS≈91%)* 6-AT MT (MS≈91%)*
Acceleration 0-100 km/h --- 11.3 s 10.0 s 11.6 s
CO2 in NEDC 139 g/km 156 g/km 124 g/km 131 g/km
Remarks Start-Stop/Reg. Euro 5 eq.
no Start-Stop Euro 4 (MS≈60%)
Start-Stop/Reg. Euro 5
no Start-Stop Euro 4 (MS≈60%)
Ricardo simulations baseline vehicle vs. EU-27 average new vehicle in 2010 Abbreviations: PFI (port fuel injection), DFI (direct fuel injection), MS (market share), AT (automatic transmission), MT (manual transmission), vehicle weight is given in mass in running order (includes 68 kg driver and 7 kg of luggage) * MS 5-MT: 49%, 6-MT: 42%
Diesel

6
Methodology Arriving at the starting point Ricardo baseline vehicles include start-stop and improved alternator
– Factoring out alternator efficiency improvement (55% vs. 70%) ≈ -3% effect
– Factoring out effect of start-stop system, taking into account idling times in European driving cycle ≈ -10% effect
Ricardo baseline vehicles include automatic transmissions in some cases – For all EU segments: manual transmission as starting point
– E.g. going from A6 to M6 ≈ 4% effect
Baseline, 1.6l, M5, 156 g/km, 6.4 l
SS, 1.6l, M5, 136 g/km, 5.6 l
SS+SGTDI, 0.8l, 8DCT, 97 g/km, 4.0 l
SS+CEGR, 0.8l, 8DCT, 93 g/km, 3.8 l
P2 AtkCPS, 1.9l, 8DCT, 77 g/km, 3.1 l
P2 AtkCPS, 1.6l, 8DCT, -13% mass, -10% RL, 66 g/km, 2.7 l
SS+SGTDI, 0.7l, 8DCT, -27% mass, -20% RL, 74 g/km, 3.0 l
P2 AtkCPS, 1.2l, 8DCT, -27% mass, -20% RL, 58 g/km, 2.4 l
0
1000
2000
3000
4000
5000
-65% -55% -45% -35% -25% -15% -5%
Ad
dit
ion
al
dir
ec
t m
an
ufa
ctu
rin
g c
os
ts [
EU
R]
rela
tive
to
20
10
ba
se
lin
e
CO2 reduction relative to 2010 baseline 7
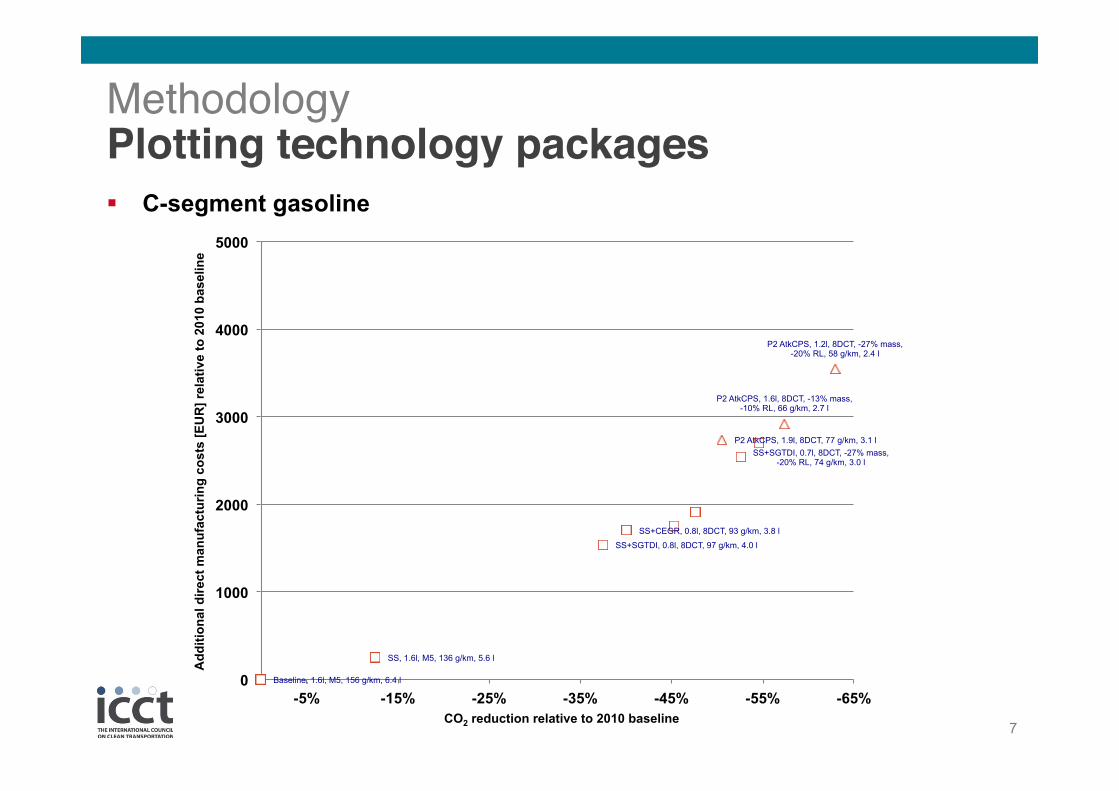
Methodology Plotting technology packages C-segment gasoline
Baseline, 1.6l, M5, 156 g/km, 6.4 l
SS, 1.6l, M5, 136 g/km, 5.6 l
SS+SGTDI, 0.8l, 8DCT, 97 g/km, 4.0 l
SS+CEGR, 0.8l, 8DCT, 93 g/km, 3.8 l
P2 AtkCPS, 1.9l, 8DCT, 77 g/km, 3.1 l
P2 AtkCPS, 1.6l, 8DCT, -13% mass, -10% RL, 66 g/km, 2.7 l
SS+SGTDI, 0.7l, 8DCT, -27% mass, -20% RL, 74 g/km, 3.0 l
P2 AtkCPS, 1.2l, 8DCT, -27% mass, -20% RL, 58 g/km, 2.4 l
0
1000
2000
3000
4000
5000
-65% -55% -45% -35% -25% -15% -5%
Ad
dit
ion
al
dir
ec
t m
an
ufa
ctu
rin
g c
os
ts [
EU
R]
rela
tive
to
20
10
ba
se
lin
e
CO2 reduction relative to 2010 baseline 8
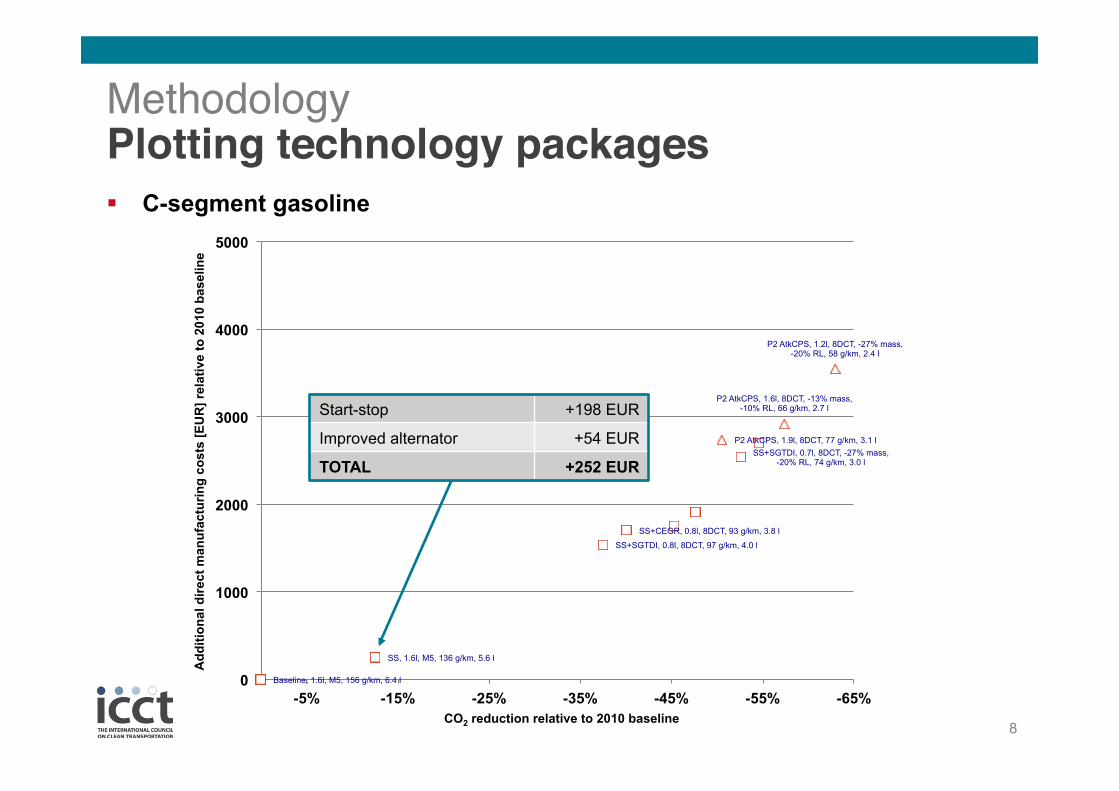
Methodology Plotting technology packages C-segment gasoline
Start-stop +198 EUR
Improved alternator +54 EUR
TOTAL +252 EUR

Baseline, 1.6l, M5, 156 g/km, 6.4 l
SS, 1.6l, M5, 136 g/km, 5.6 l
SS+SGTDI, 0.8l, 8DCT, 97 g/km, 4.0 l
SS+CEGR, 0.8l, 8DCT, 93 g/km, 3.8 l
P2 AtkCPS, 1.9l, 8DCT, 77 g/km, 3.1 l
P2 AtkCPS, 1.6l, 8DCT, -13% mass, -10% RL, 66 g/km, 2.7 l
SS+SGTDI, 0.7l, 8DCT, -27% mass, -20% RL, 74 g/km, 3.0 l
P2 AtkCPS, 1.2l, 8DCT, -27% mass, -20% RL, 58 g/km, 2.4 l
0
1000
2000
3000
4000
5000
-65% -55% -45% -35% -25% -15% -5%
Ad
dit
ion
al
dir
ec
t m
an
ufa
ctu
rin
g c
os
ts [
EU
R]
rela
tive
to
20
10
ba
se
lin
e
CO2 reduction relative to 2010 baseline 9
Methodology Plotting technology packages C-segment gasoline
Spray-guided DI +106 EUR
Turbo (two stage series sequential)
+453 EUR
Downsizing -150 EUR
Gasoline particulate filter +50 EUR
…
8DDCT instead of M5 +329 EUR
TOTAL +1540 EUR
Baseline, 1.6l, M5, 156 g/km, 6.4 l
SS, 1.6l, M5, 136 g/km, 5.6 l
SS+SGTDI, 0.8l, 8DCT, 97 g/km, 4.0 l
SS+CEGR, 0.8l, 8DCT, 93 g/km, 3.8 l
P2 AtkCPS, 1.9l, 8DCT, 77 g/km, 3.1 l
P2 AtkCPS, 1.6l, 8DCT, -13% mass, -10% RL, 66 g/km, 2.7 l
SS+SGTDI, 0.7l, 8DCT, -27% mass, -20% RL, 74 g/km, 3.0 l
P2 AtkCPS, 1.2l, 8DCT, -27% mass, -20% RL, 58 g/km, 2.4 l
0
1000
2000
3000
4000
5000
-65% -55% -45% -35% -25% -15% -5%
Ad
dit
ion
al d
irect
man
ufa
ctu
rin
g c
osts
[E
UR
] re
lati
ve t
o 2
010 b
aselin
e
CO2 reduction relative to 2010 baseline
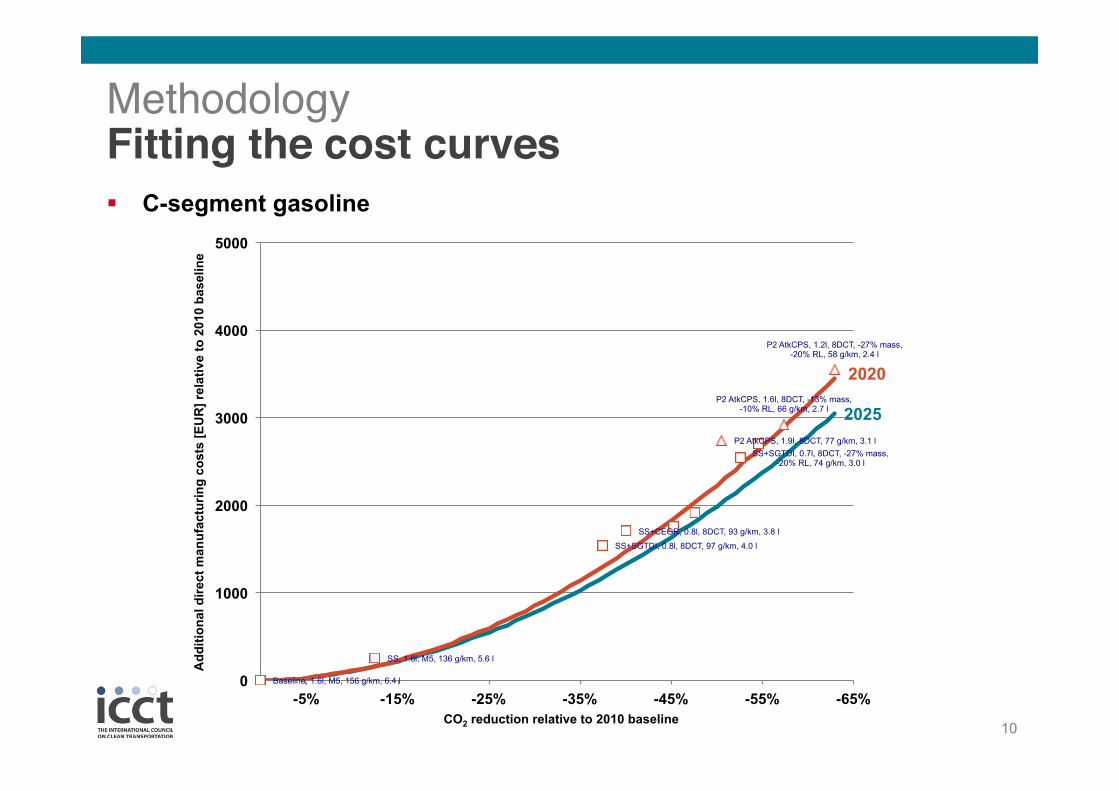
2020
2025
10
Methodology Fitting the cost curves C-segment gasoline

Baseline, 1.6l, M5, 156 g/km, 6.4 l
SS, 1.6l, M5, 136 g/km, 5.6 l
SS+SGTDI, 0.8l, 8DCT, 97 g/km, 4.0 l
SS+CEGR, 0.8l, 8DCT, 93 g/km, 3.8 l
P2 AtkCPS, 1.9l, 8DCT, 77 g/km, 3.1 l
P2 AtkCPS, 1.6l, 8DCT, -13% mass, -10% RL, 66 g/km, 2.7 l
SS+SGTDI, 0.7l, 8DCT, -27% mass, -20% RL, 74 g/km, 3.0 l
P2 AtkCPS, 1.2l, 8DCT, -27% mass, -20% RL, 58 g/km, 2.4 l
0
1000
2000
3000
4000
5000
-65% -55% -45% -35% -25% -15% -5%
Ad
dit
ion
al d
irect
man
ufa
ctu
rin
g c
osts
[E
UR
] re
lati
ve t
o 2
010 b
aselin
e
CO2 reduction relative to 2010 baseline
2015
2020
2025
11
Methodology 2015 curve for illustrating purposes C-segment gasoline

Baseline, 1.6l, M5, 156 g/km, 6.4 l
SS, 1.6l, M5, 136 g/km, 5.6 l
SS+SGTDI, 0.8l, 8DCT, 97 g/km, 4.0 l
SS+CEGR, 0.8l, 8DCT, 93 g/km, 3.8 l
P2 AtkCPS, 1.9l, 8DCT, 77 g/km, 3.1 l
P2 AtkCPS, 1.6l, 8DCT, -13% mass, -10% RL, 66 g/km, 2.7 l
SS+SGTDI, 0.7l, 8DCT, -27% mass, -20% RL, 74 g/km, 3.0 l
P2 AtkCPS, 1.2l, 8DCT, -27% mass, -20% RL, 58 g/km, 2.4 l
0
1000
2000
3000
4000
5000
-65% -55% -45% -35% -25% -15% -5%
Ad
dit
ion
al d
irect
man
ufa
ctu
rin
g c
osts
[E
UR
] re
lati
ve t
o 2
010 b
aselin
e
CO2 reduction relative to 2010 baseline
95 g/km
(3.9 l/100km)
80 g/km
(3.3 l/100km)
70 g/km
(2.9 l/100km)
corresponding
fleet targets
2015
2020
2025
12
Methodology The final result C-segment gasoline

Agenda
Methodology for developing the curves 1
Preliminary results 2
Conclusions and outlook 3
Baseline, 1.6l, M5, 156 g/km, 6.4 l
SS, 1.6l, M5, 136 g/km, 5.6 l
SS+SGTDI, 0.8l, 8DCT, 97 g/km, 4.0 l
SS+CEGR, 0.8l, 8DCT, 93 g/km, 3.8 l
P2 AtkCPS, 1.9l, 8DCT, 77 g/km, 3.1 l
P2 AtkCPS, 1.6l, 8DCT, -13% mass, -10% RL, 66 g/km, 2.7 l
SS+SGTDI, 0.7l, 8DCT, -27% mass, -20% RL, 74 g/km, 3.0 l
P2 AtkCPS, 1.2l, 8DCT, -27% mass, -20% RL, 58 g/km, 2.4 l
0
1000
2000
3000
4000
5000
-65% -55% -45% -35% -25% -15% -5%
Ad
dit
ion
al d
irect
man
ufa
ctu
rin
g c
osts
[E
UR
] re
lati
ve t
o 2
010 b
aselin
e
CO2 reduction relative to 2010 baseline
95 g/km
(3.9 l/100km)
80 g/km
(3.3 l/100km)
70 g/km
(2.9 l/100km)
corresponding
fleet targets
2015
2020
2025
14
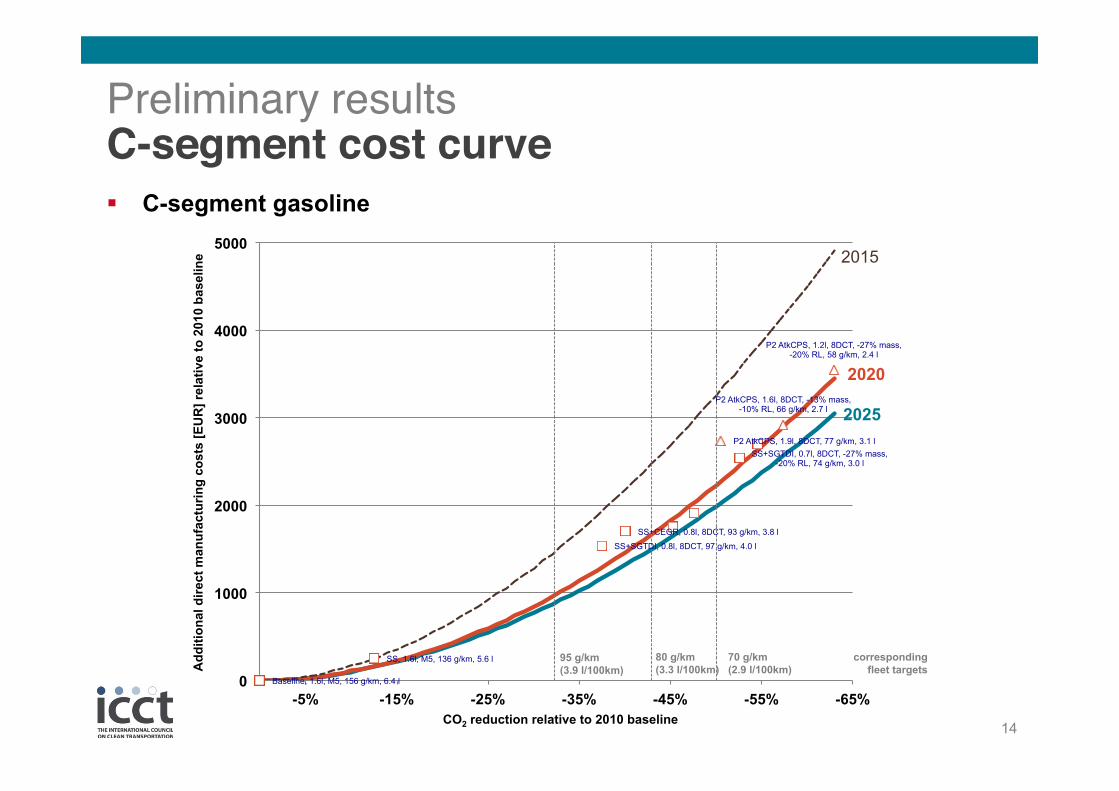
Preliminary results C-segment cost curve C-segment gasoline

Baseline, 1.6l, M5, 156 g/km, 6.4 l
SS, 1.6l, M5, 136 g/km, 5.6 l
SS+SGTDI, 0.8l, 8DCT, 97 g/km, 4.0 l
SS+CEGR, 0.8l, 8DCT, 93 g/km, 3.8 l
P2 AtkCPS, 1.9l, 8DCT, 77 g/km, 3.1 l
P2 AtkCPS, 1.6l, 8DCT, -13% mass, -10% RL, 66 g/km, 2.7 l
SS+SGTDI, 0.7l, 8DCT, -27% mass, -20% RL, 74 g/km, 3.0 l
P2 AtkCPS, 1.2l, 8DCT, -27% mass, -20% RL, 58 g/km, 2.4 l
� �
����
����
�����
�����
����
�� �� � �� �� �� �� �� � �� � �� � ��
��
�!
*!
&%
�#
��
!(
��
*�
$�
%+
��
�*
+(
!%
�
�&
)*
)�
��
��
��
(�
#�
*!
,�
�*
&�
�
�
��
�)
�#
!%
��
� �� ( � � + � * ! & % � ( � # � * ! , � � * & � � � � � � ) � # ! % � �
� � �"$�� � � � � # � � � " $ � �
��� �"$�� � � � � # � � � " $ � �
��� �"$�� � � � # � � � " $ � �
� & ( ( � ) ' & % � ! % �� # � � * � * � ( � * ) �
2015
���
� �
15
Preliminary results Comparison with vehicles on the market C-segment gasoline
Ford Focus EcoBoost
1.0L, 3 cyl., 74 kW
SS+SGTDI
1,195 kg
M5, 12.5 s
109 g/km
Ford Focus
1.6L, 4 cyl., 74 kW
---
1,175 kg
M5, 11.9 s
159 g/km
2010 2012
-31%
Data source for technical data: Automobil Revue

Baseline, 1.6l, M5, 156 g/km, 6.4 l
SS, 1.6l, M5, 136 g/km, 5.6 l
SS+SGTDI, 0.8l, 8DCT, 97 g/km, 4.0 l
SS+CEGR, 0.8l, 8DCT, 93 g/km, 3.8 l
P2 AtkCPS, 1.9l, 8DCT, 77 g/km, 3.1 l
P2 AtkCPS, 1.6l, 8DCT, -13% mass, -10% RL, 66 g/km, 2.7 l
SS+SGTDI, 0.7l, 8DCT, -27% mass, -20% RL, 74 g/km, 3.0 l
P2 AtkCPS, 1.2l, 8DCT, -27% mass, -20% RL, 58 g/km, 2.4 l
� �
� � � �
� � � �
� � � � �
� � � � �
� � � �
� � � �� � �� � � �� � � �� � �� � �� � �
��
�!
*!
&%
�#
��
!(
��
*�
$�
%+
��
�*
+(
!%
�
�&
)*
)�
��
��
��
(�
#�
*!
,�
�*
&�
�
�
��
�)
�#
!%
��
� �� ( � � + � * ! & % � ( � # � * ! , � � * & � � � � � � ) � # ! % � �
� � � " $ �� � � � � # � � � " $ � �
� � � � " $ �� � � � � # � � � " $ � �
� � � � " $ �� � � � # � � � " $ � �
� & ( ( � ) ' & % � ! % �� # � � * � * � ( � * ) �
2015
� � �
� �
16
Preliminary results Comparison with vehicles on the market C-segment gasoline
Audi A3
1.2L, 4 cyl., 77 kW
SS+SGTDI+7DCT
1,150 kg
7DCT, 10.4 s
116 g/km
Audi A3
1.6L, 4 cyl., 75 kW
---
1,185 kg
M5, 11.8 s
162 g/km
2010 2012
-29%
Data source for technical data: Automobil Revue

Baseline, 1.6l, M5, 156 g/km, 6.4 l
SS, 1.6l, M5, 136 g/km, 5.6 l
SS+SGTDI, 0.8l, 8DCT, 97 g/km, 4.0 l
SS+CEGR, 0.8l, 8DCT, 93 g/km, 3.8 l
P2 AtkCPS, 1.9l, 8DCT, 77 g/km, 3.1 l
P2 AtkCPS, 1.6l, 8DCT, -13% mass, -10% RL, 66 g/km, 2.7 l
SS+SGTDI, 0.7l, 8DCT, -27% mass, -20% RL, 74 g/km, 3.0 l
P2 AtkCPS, 1.2l, 8DCT, -27% mass, -20% RL, 58 g/km, 2.4 l
��
����
����
�����
�����
����
�� �� � �� �� �� �� �� � �� � �� � ��
��
�!
*!
&%
�#
��
!(
��
*�
$�
%+
��
�*
+(
!%
�
�&
)*
)�
��
��
��
(�
#�
*!
,�
�*
&�
�
�
��
�)
�#
!%
��
� �� ( � � + � * ! & % � ( � # � * ! , � � * & � � � � � � ) � # ! % � �
� � �"$������#���"$��
��� �"$������#���"$��
��� �"$�����#���"$��
�&((�)'&%�!% ��#��*�*�( �*)�
2015
� � �
� �
17
Preliminary results Comparison with vehicles on the market C-segment gasoline
Toyota Prius
1.8L, 4 cyl., 100 kW
HEV
1,370 kg
CVT, 10.4 s
89 g/km
2012
Data source for technical data: Automobil Revue
Baseline, 1.6l, M5, 156 g/km, 6.4 l
SS, 1.6l, M5, 136 g/km, 5.6 l
SS+SGTDI, 0.8l, 8DCT, 97 g/km, 4.0 l
SS+CEGR, 0.8l, 8DCT, 93 g/km, 3.8 l
P2 AtkCPS, 1.9l, 8DCT, 77 g/km, 3.1 l
P2 AtkCPS, 1.6l, 8DCT, -13% mass, -10% RL, 66 g/km, 2.7 l
SS+SGTDI, 0.7l, 8DCT, -27% mass, -20% RL, 74 g/km, 3.0 l
P2 AtkCPS, 1.2l, 8DCT, -27% mass, -20% RL, 58 g/km, 2.4 l
� �
� � � �
� � � �
� � � � �
� � � � �
� � � �
� � � �� � �� � � �� � � �� � �� � �� � �
��
�!
*!
&%
�#
��
!(
��
*�
$�
%+
��
�*
+(
!%
�
�&
)*
)�
��
��
��
(�
#�
*!
,�
�*
&�
�
�
��
�)
�#
!%
��
� �� ( � � + � * ! & % � ( � # � * ! , � � * & � � � � � � ) � # ! % � �
� � � " $ �� � � � � # � � � " $ � �
� � � � " $ �� � � � � # � � � " $ � �
� � � � " $ �� � � � # � � � " $ � �
� & ( ( � ) ' & % � ! % �� # � � * � * � ( � * ) �
2015
� � �
� �
18
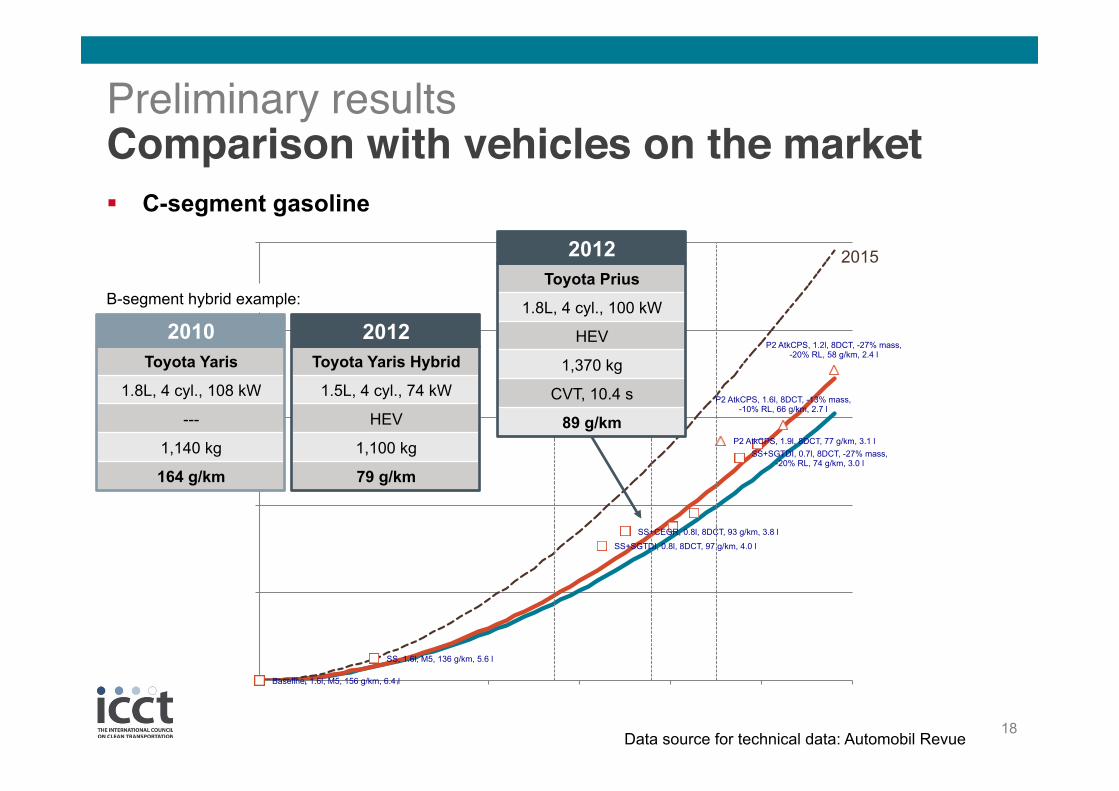
Preliminary results Comparison with vehicles on the market C-segment gasoline
Toyota Prius
1.8L, 4 cyl., 100 kW
HEV
1,370 kg
CVT, 10.4 s
89 g/km
2012
Data source for technical data: Automobil Revue
Toyota Yaris Hybrid
1.5L, 4 cyl., 74 kW
HEV
1,100 kg
79 g/km
Toyota Yaris
1.8L, 4 cyl., 108 kW
---
1,140 kg
164 g/km
2010 2012 B-segment hybrid example:

Baseline, 1.7l, M5, 131 g/km, 4.9 l
SS, 1.7l, M5, 111 g/km, 4.2 l
SS+AdvDie, 1.3l, 8DCT, 90 g/km, 3.4 l
SS+AdvDie P2, 1.4l, 8DCT, 74 g/km, 2.8 l
SS+AdvDie, 1.2l, 8DCT, -13% mass, -10% RL, 78 g/km, 3.0 l
SS+AdvDie P2, 1.2l, 8DCT, -13% mass, -10% RL, 64 g/km, 2.4 l
SS+AdvDie, 1.0l, 8DCT, -27% mass, -20% RL, 68 g/km, 2.5 l
SS+AdvDie P2, 1.0l, 8DCT, -27% mass, -20% RL, 55 g/km, 2.1 l
0
1000
2000
3000
4000
5000
-60% -50% -40% -30% -20% -10% 0%
Ad
dit
ion
al d
irect
man
ufa
ctu
rin
g c
osts
[E
UR
] re
lati
ve t
o 2
010 b
aselin
e
CO2 reduction relative to 2010 baseline
95 g/km
(3.9 l/100km) 80 g/km
(3.3 l/100km)
70 g/km
(2.9 l/100km)
corresponding
fleet targets
2015
2020
2025
19
Preliminary results C-segment cost curve C-segment diesel

Baseline, 1.7l, M5, 131 g/km, 4.9 l
SS, 1.7l, M5, 111 g/km, 4.2 l
SS+AdvDie, 1.3l, 8DCT, 90 g/km, 3.4 l
SS+AdvDie P2, 1.4l, 8DCT, 74 g/km, 2.8 l
SS+AdvDie, 1.2l, 8DCT, -13% mass, -10% RL, 78 g/km, 3.0 l
SS+AdvDie P2, 1.2l, 8DCT, -13% mass, -10% RL, 64 g/km, 2.4 l
SS+AdvDie, 1.0l, 8DCT, -27% mass, -20% RL, 68 g/km, 2.5 l
SS+AdvDie P2, 1.0l, 8DCT, -27% mass, -20% RL, 55 g/km, 2.1 l
0
1000
2000
3000
4000
5000
-60% -50% -40% -30% -20% -10% 0%
Ad
dit
ion
al d
irect
man
ufa
ctu
rin
g c
osts
[E
UR
] re
lati
ve t
o 2
010 b
aselin
e
CO2 reduction relative to 2010 baseline
95 g/km
(3.9 l/100km) 80 g/km
(3.3 l/100km)
70 g/km
(2.9 l/100km)
corresponding
fleet targets
2015
2020
2025
20
Preliminary results Comparison with vehicles on the market C-segment diesel
Data source for technical data: Automobil Revue
Audi A3
1.6L, 4 cyl., 77 kW
SS
1,225 kg
M5, 11.4 s
99 g/km
Audi A3
1.6L, 4 cyl., 66 kW
---
1,280 kg
M5, 12.9 s
114 g/km
2010 2012
-14%
Baseline, 1.7l, M5, 131 g/km, 4.9 l
SS, 1.7l, M5, 111 g/km, 4.2 l
SS+AdvDie, 1.3l, 8DCT, 90 g/km, 3.4 l
SS+AdvDie P2, 1.4l, 8DCT, 74 g/km, 2.8 l
SS+AdvDie, 1.2l, 8DCT, -13% mass, -10% RL, 78 g/km, 3.0 l
SS+AdvDie P2, 1.2l, 8DCT, -13% mass, -10% RL, 64 g/km, 2.4 l
SS+AdvDie, 1.0l, 8DCT, -27% mass, -20% RL, 68 g/km, 2.5 l
SS+AdvDie P2, 1.0l, 8DCT, -27% mass, -20% RL, 55 g/km, 2.1 l
0
1000
2000
3000
4000
5000
-60% -50% -40% -30% -20% -10% 0%
Ad
dit
ion
al d
irect
man
ufa
ctu
rin
g c
osts
[E
UR
] re
lati
ve t
o 2
010 b
aselin
e
CO2 reduction relative to 2010 baseline
95 g/km
(3.9 l/100km) 80 g/km
(3.3 l/100km)
70 g/km
(2.9 l/100km)
corresponding
fleet targets
2015
2020
2025
21
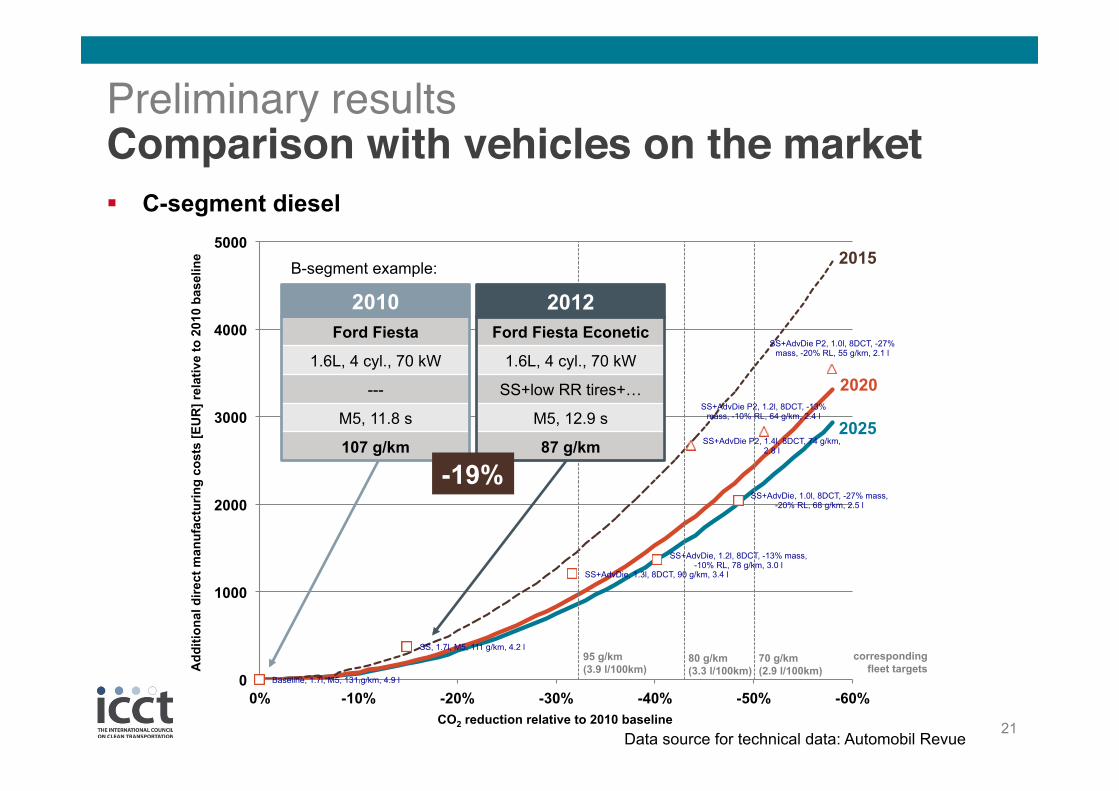
Preliminary results Comparison with vehicles on the market C-segment diesel
Data source for technical data: Automobil Revue
Ford Fiesta Econetic
1.6L, 4 cyl., 70 kW
SS+low RR tires+…
M5, 12.9 s
87 g/km
Ford Fiesta
1.6L, 4 cyl., 70 kW
---
M5, 11.8 s
107 g/km
2010 2012
-19%
B-segment example:
Baseline, 1.7l, M5, 131 g/km, 4.9 l
SS, 1.7l, M5, 111 g/km, 4.2 l
SS+AdvDie, 1.3l, 8DCT, 90 g/km, 3.4 l
SS+AdvDie P2, 1.4l, 8DCT, 74 g/km, 2.8 l
SS+AdvDie, 1.2l, 8DCT, -13% mass, -10% RL, 78 g/km, 3.0 l
SS+AdvDie P2, 1.2l, 8DCT, -13% mass, -10% RL, 64 g/km, 2.4 l
SS+AdvDie, 1.0l, 8DCT, -27% mass, -20% RL, 68 g/km, 2.5 l
SS+AdvDie P2, 1.0l, 8DCT, -27% mass, -20% RL, 55 g/km, 2.1 l
0
1000
2000
3000
4000
5000
-60% -50% -40% -30% -20% -10% 0%
Ad
dit
ion
al d
irect
man
ufa
ctu
rin
g c
osts
[E
UR
] re
lati
ve t
o 2
010 b
aselin
e
CO2 reduction relative to 2010 baseline
95 g/km
(3.9 l/100km) 80 g/km
(3.3 l/100km)
70 g/km
(2.9 l/100km)
corresponding
fleet targets
2015
2020
2025
22
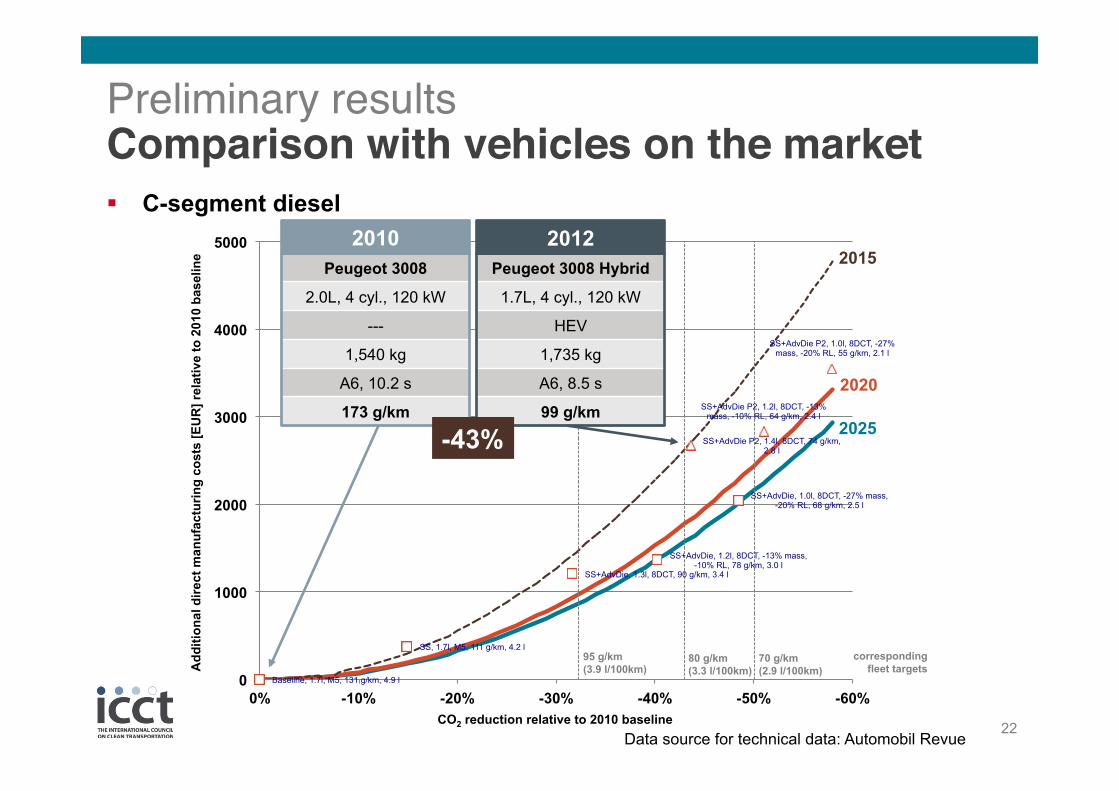
Preliminary results Comparison with vehicles on the market C-segment diesel
Data source for technical data: Automobil Revue
Peugeot 3008 Hybrid
1.7L, 4 cyl., 120 kW
HEV
1,735 kg
A6, 8.5 s
99 g/km
Peugeot 3008
2.0L, 4 cyl., 120 kW
---
1,540 kg
A6, 10.2 s
173 g/km
2010 2012
-43%
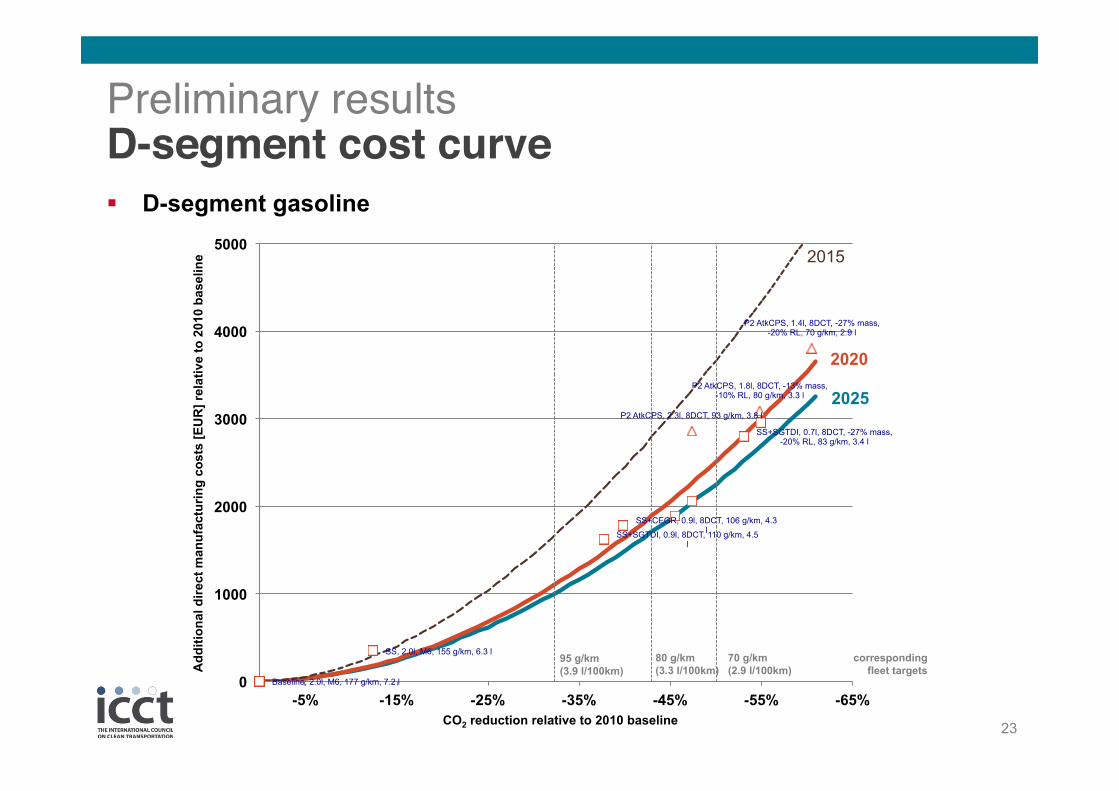
Baseline, 2.0l, M6, 177 g/km, 7.2 l
SS, 2.0l, M6, 155 g/km, 6.3 l
SS+SGTDI, 0.9l, 8DCT, 110 g/km, 4.5 l
SS+CEGR, 0.9l, 8DCT, 106 g/km, 4.3 l
P2 AtkCPS, 2.3l, 8DCT, 93 g/km, 3.8 l
P2 AtkCPS, 1.8l, 8DCT, -13% mass, -10% RL, 80 g/km, 3.3 l
SS+SGTDI, 0.7l, 8DCT, -27% mass, -20% RL, 83 g/km, 3.4 l
P2 AtkCPS, 1.4l, 8DCT, -27% mass, -20% RL, 70 g/km, 2.9 l
0
1000
2000
3000
4000
5000
-65% -55% -45% -35% -25% -15% -5%
Ad
dit
ion
al d
irect
man
ufa
ctu
rin
g c
osts
[E
UR
] re
lati
ve t
o 2
010 b
aselin
e
CO2 reduction relative to 2010 baseline
95 g/km
(3.9 l/100km)
80 g/km
(3.3 l/100km)
70 g/km
(2.9 l/100km)
corresponding
fleet targets
2015
2020
2025
23
Preliminary results D-segment cost curve D-segment gasoline

Baseline, 2.0l, M6, 148 g/km, 5.6 l
SS, 2.0l, M6, 126 g/km, 4.7 l
SS+AdvDie, 1.7l, 8DCT, 115 g/km, 4.3 l
SS+AdvDie P2, 1.8l, 8DCT, 99 g/km, 3.7 l
SS+AdvDie, 1.5l, 8DCT, -13% mass, -10% RL, 100 g/km, 3.8 l
SS+AdvDie P2, 1.6l, 8DCT, -13% mass, -10% RL, 86 g/km, 3.2 l
SS+AdvDie, 1.3l, 8DCT, -27% mass, -20% RL, 86 g/km, 3.2 l
SS+AdvDie P2, 1.3l, 8DCT, -27% mass, -20% RL, 74 g/km, 2.8 l
0
1000
2000
3000
4000
5000
-60% -50% -40% -30% -20% -10% 0%
Ad
dit
ion
al d
irect
man
ufa
ctu
rin
g c
osts
[E
UR
] re
lati
ve t
o 2
010 b
aselin
e
CO2 reduction relative to 2010 baseline
95 g/km
(3.9 l/100km) 80 g/km
(3.3 l/100km)
70 g/km
(2.9 l/100km)
corresponding
fleet targets
2015
2020
2025
24
Preliminary results D-segment cost curve D-segment diesel
Baseline, 1.3l, M5, 136 g/km, 5.6 l
SS, 1.3l, M5, 118 g/km, 4.8 l
SS+SGTDI, 0.6l, M6, 92 g/km, 3.7 l
SS+CEGR, 0.6l, M6, 88 g/km, 3.6 l
P2 AtkCPS, 1.6l, 6DCT, 86 g/km, 3.5 l
P2 AtkCPS, 1.3l, 6DDCT, -13% mass, -10% RL, 76 g/km, 3.1 l
SS+SGTDI, 0.6l, M6, -27% mass, -20% RL, 70 g/km, 2.9 l
P2 AtkCPS, 1.1l, 6DDCT, -27% mass, -20% RL, 67 g/km, 2.7 l
0
1000
2000
3000
4000
5000
-60% -50% -40% -30% -20% -10% 0%
Ad
dit
ion
al d
irect
man
ufa
ctu
rin
g c
osts
[E
UR
] re
lati
ve t
o 2
010 b
aselin
e
CO2 reduction relative to 2010 baseline
95 g/km
(3.9 l/100km) 80 g/km
(3.3 l/100km)
70 g/km
(2.9 l/100km)
corresponding
fleet targets
2015
2020
2025
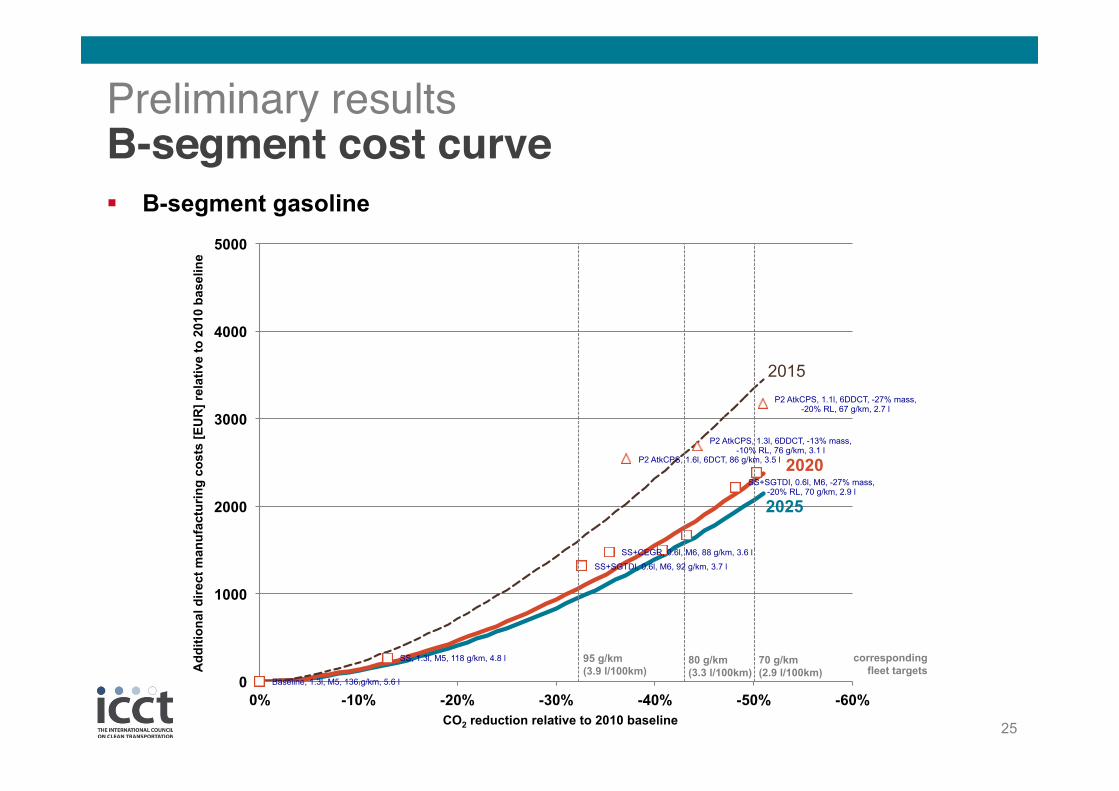
25
Preliminary results B-segment cost curve B-segment gasoline

Baseline, 1.5l, M5, 113 g/km, 4.3 l
SS, 1.5l, M5, 96 g/km, 3.6 l
SS+AdvDie, 1.4l, M6, 84 g/km, 3.2 l
SS+AdvDie P2, 1.5l, 6DCT, 82 g/km, 3.1 l
SS+AdvDie, 1.3l, M6, -13% mass, -10% RL, 74 g/km, 2.8 l
SS+AdvDie P2, 1.3l, 6DCT, -13% mass, -10% RL, 72 g/km, 2.7 l
SS+AdvDie, 1.1l, M6, -27% mass, -20% RL, 64 g/km, 2.4 l
SS+AdvDie P2, 1.1l, 6DCT, -27% mass, -20% RL, 62 g/km, 2.3 l
0
1000
2000
3000
4000
5000
-60% -50% -40% -30% -20% -10% 0%
Ad
dit
ion
al d
irect
man
ufa
ctu
rin
g c
osts
[E
UR
] re
lati
ve t
o 2
010 b
aselin
e
CO2 reduction relative to 2010 baseline
95 g/km
(3.9 l/100km) 80 g/km
(3.3 l/100km)
70 g/km
(2.9 l/100km)
corresponding
fleet targets
2015
2020
2025
26
Preliminary results B-segment cost curve B-segment diesel
0
1000
2000
3000
4000
5000
-60% -50% -40% -30% -20% -10% 0%
Ad
dit
ion
al d
irect
man
ufa
ctu
rin
g c
osts
[E
UR
] re
lati
ve t
o 1
30 g
/km
baselin
e
CO2 reduction relative to 130 g/km baseline
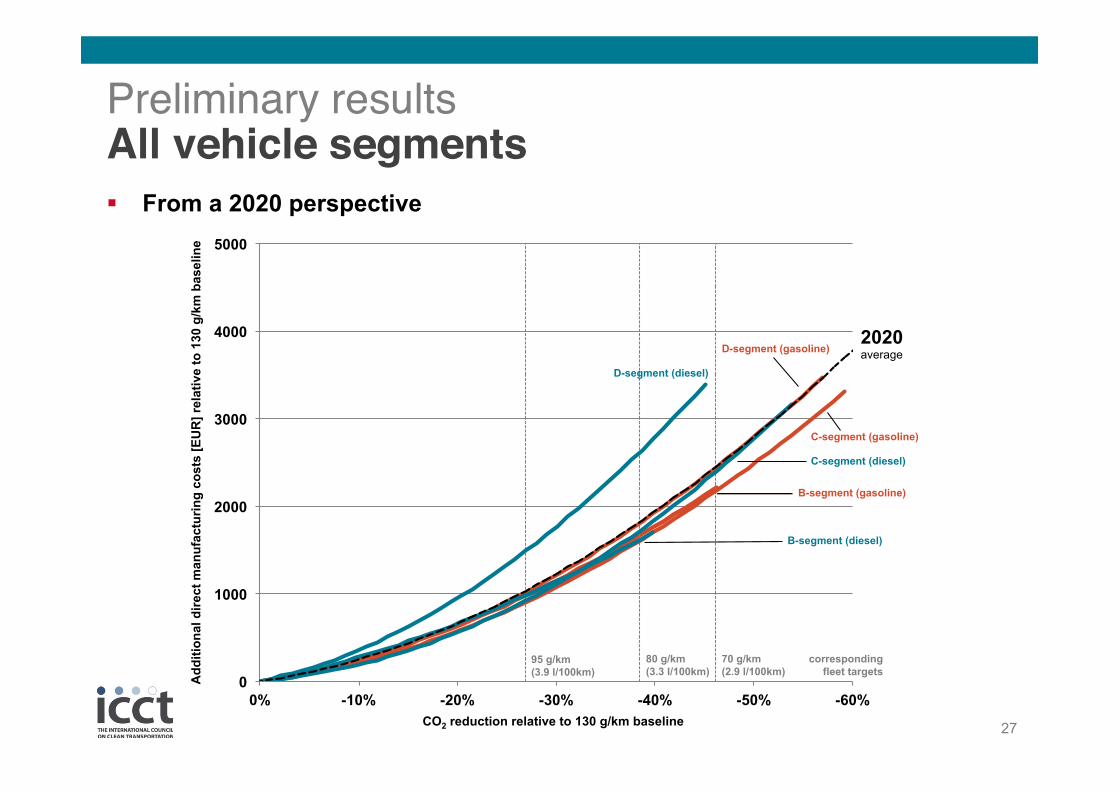
95 g/km
(3.9 l/100km)
80 g/km
(3.3 l/100km)
70 g/km
(2.9 l/100km)
corresponding
fleet targets
2020 average
B-segment (gasoline)
B-segment (diesel)
C-segment (gasoline)
C-segment (diesel)
D-segment (gasoline)
D-segment (diesel)
27
Preliminary results All vehicle segments From a 2020 perspective
0
1000
2000
3000
4000
5000
-60% -50% -40% -30% -20% -10% 0%
Ad
dit
ion
al d
irect
man
ufa
ctu
rin
g c
osts
[E
UR
] re
lati
ve t
o 1
30 g
/km
baselin
e
CO2 reduction relative to 130 g/km baseline
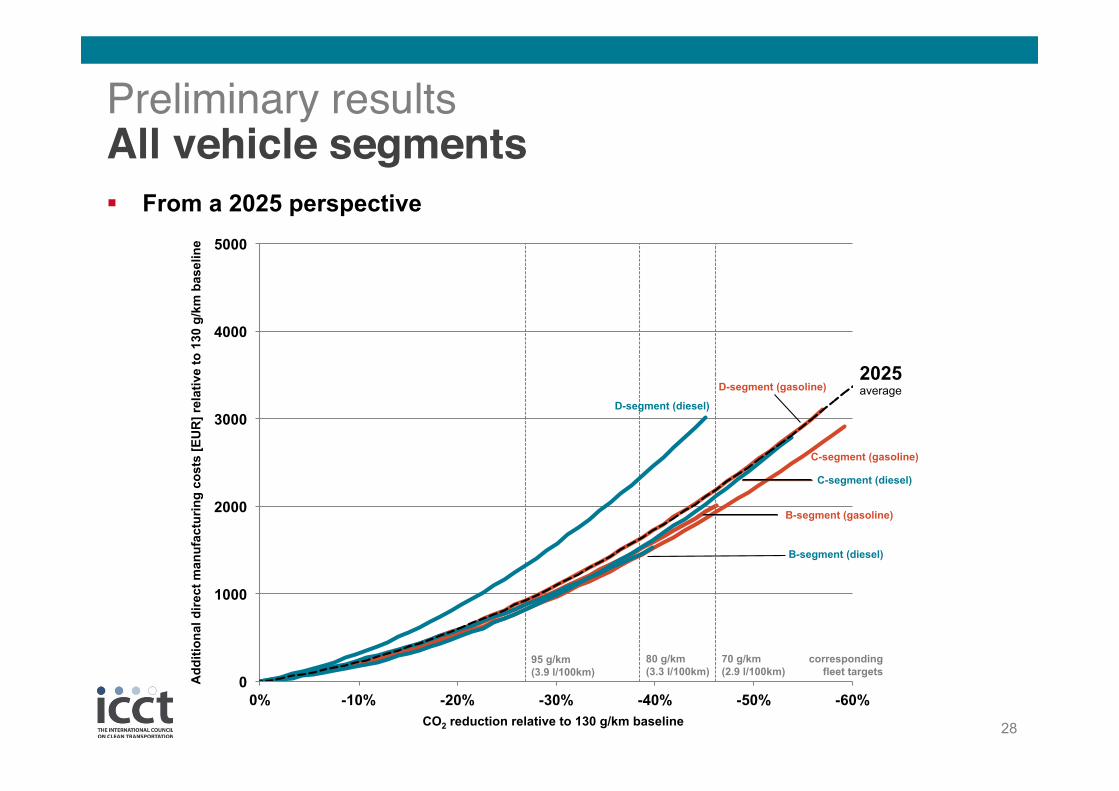
95 g/km
(3.9 l/100km)
80 g/km
(3.3 l/100km)
70 g/km
(2.9 l/100km)
corresponding
fleet targets
2025 average
B-segment (gasoline)
B-segment (diesel)
C-segment (gasoline)
C-segment (diesel)
D-segment (gasoline) D-segment (diesel)
28
Preliminary results All vehicle segments From a 2025 perspective
Agenda
Methodology for developing the curves 1
Preliminary results 2
Conclusions and outlook 3
30
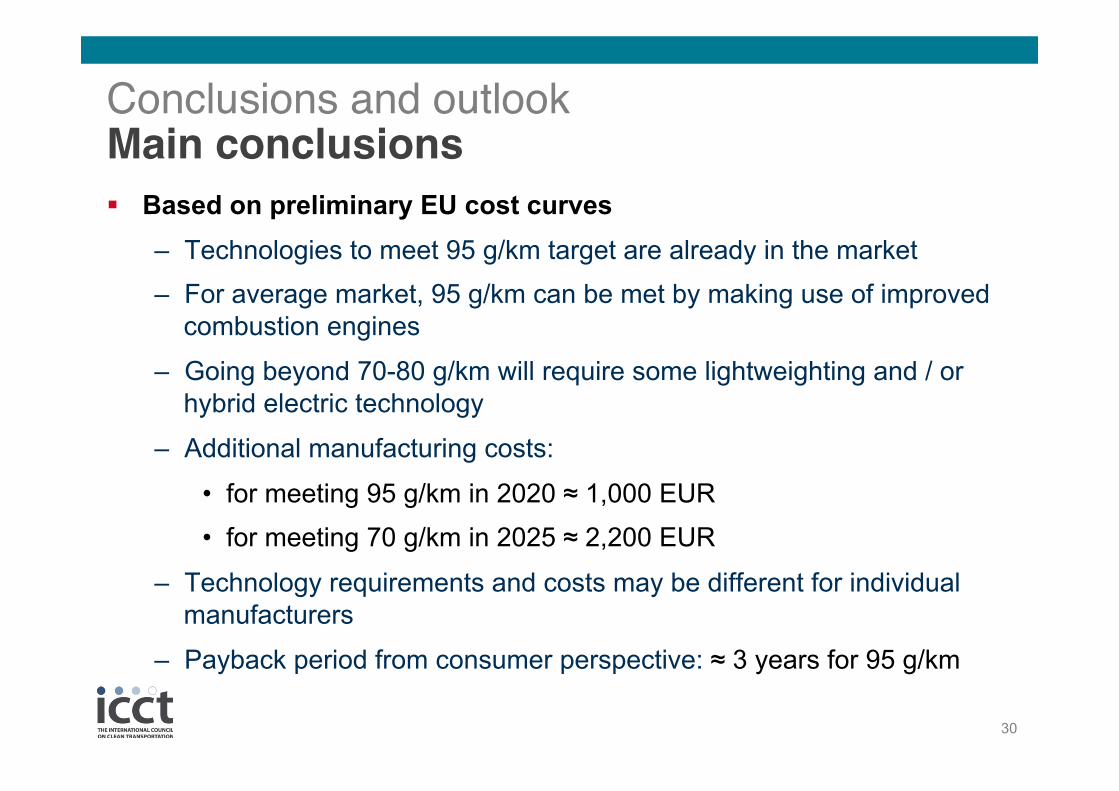
Conclusions and outlook Main conclusions Based on preliminary EU cost curves
– Technologies to meet 95 g/km target are already in the market – For average market, 95 g/km can be met by making use of improved
combustion engines
– Going beyond 70-80 g/km will require some lightweighting and / or hybrid electric technology
– Additional manufacturing costs:
• for meeting 95 g/km in 2020 ≈ 1,000 EUR • for meeting 70 g/km in 2025 ≈ 2,200 EUR
– Technology requirements and costs may be different for individual manufacturers
– Payback period from consumer perspective: ≈ 3 years for 95 g/km
31
Conclusions and outlook Outlook Additional results to come soon
– Cost curves for N1 (vans) vehicles – New lightweighting cost results from FEV
Next steps – Summarizing report on methodology and results
– Macro-economic modeling
32
Contact details
John German Senior Fellow, Regional Lead US [email protected] Peter Mock Senior Researcher, Regional Lead EU [email protected]