eu andean trade sustainability impact...
TRANSCRIPT

EU‐Andean Trade Sustainability Impact Assessment
A project financed by:
European Commission
DG Trade
Draft Interim Technical
Report
May 2009


A project financed by:
European Commission DG Trade
EU‐Andean Trade Sustainability Impact Assessment
DRAFT INTERIM TECHNICAL REPORT MAY 2009
Implemented by:
This report was commissioned and financed by the Commission of the
European Communities. The views expressed herein are those of the
Consultant, and do not represent any official view of the Commission.


Table of Contents
EXECUTIVE SUMMARY ............................................................................................................................................. 1 1. INTRODUCTION ................................................................................................................................................... 5
1.1 EU Andean Trade SIA ......................................................................................................................................... 5 1.2 Methodology of the EU‐Andean Trade SIA ...................................................................................................... 7
2. BASELINE CONDITIONS ........................................................................................................................................ 9
2.1 Introduction ..................................................................................................................................................... 9 2. 2 Baseline Economic Conditions ....................................................................................................................... 10 2. 2 Baseline Economic Conditions ....................................................................................................................... 10
2.2.1 Real Income .............................................................................................................................................. 10 2.2.2 Trade ........................................................................................................................................................ 12 2.2.3 Fixed Capital Formation ........................................................................................................................... 17
2.3 Baseline Social Conditions ................................................................................................................................... 19 2.3.1 Poverty ................................................................................................................................................... 19 2.3.2 Inequality ............................................................................................................................................... 22 2.3.3 Health and Education ............................................................................................................................. 22 2.3.4 Poverty, inequality and rural livelihood strategies ................................................................................. 25
2.4 Baseline Environmental Conditions .................................................................................................................... 30 2.4.1 Context ................................................................................................................................................... 30 2.4.2 Natural Resource Stocks ........................................................................................................................ 31 2.4.3 Environmental Quality ........................................................................................................................... 32 2.4.4 Biodiversity ............................................................................................................................................ 34 2.4.5 Climate Change ...................................................................................................................................... 35
2.5 Baseline Regulation Characteristics .................................................................................................................... 37 2.5.1 Introduction ........................................................................................................................................... 37 2.5.2 Environmental Regulation ...................................................................................................................... 37 2.5.3 The Effectiveness of Environmental Regulation and Policy ................................................................... 42 2.5.4 Labour Regulation .................................................................................................................................. 44 2.5.5 Regulatory Quality and Governance ...................................................................................................... 46 2.5.6 Summary ................................................................................................................................................ 47
3. SUSTAINABILITY IMPACT ASSESSMENT .............................................................................................................. 49
3.1 Economic Modelling ............................................................................................................................................ 49 3.1.1 The CGE Model ....................................................................................................................................... 49 3.1.2 Macro Level Results ............................................................................................................................... 51 3.1.3 Economic Modelling and Sustainability Assessment .............................................................................. 55
3.2 Agricultural and Processed Agricultural Goods ................................................................................................... 56 3.2.1 Economic Impacts .................................................................................................................................. 56 3.2.2 Social Impacts ........................................................................................................................................ 58 3.2.3 Environmental Impacts .......................................................................................................................... 60
3.3 Industrial Products .............................................................................................................................................. 63 3.3.1 Economic Impacts .................................................................................................................................. 63 3.3.2 Social Impacts ........................................................................................................................................ 67 3.3.3 Environmental Impacts .......................................................................................................................... 68
3.4 Services ............................................................................................................................................................... 69 3.4.1 Economic Impacts .................................................................................................................................. 69 3.4.2 Social Impacts ........................................................................................................................................ 74 3.4.3 Environmental Impacts .......................................................................................................................... 74 3.4.4 Selected Services Sub‐Sectors .................................................................................................................. 75
3.5 Other Trade Areas under Negotiation ................................................................................................................. 78 3.5.1 Investment ............................................................................................................................................. 78 3.5.2 Public Procurement ................................................................................................................................ 81 3.5.3 Trade Facilitation ................................................................................................................................... 85
4. CONSULTATION ACTIVITIES ............................................................................................................................... 89
4.1 SIA Website ................................................................................................................................................. 89 4.2 Electronic SIA‐Trade Newsletter ................................................................................................................. 90 4.3 Consultation Workshops ............................................................................................................................. 90 4.4 Interviews .................................................................................................................................................... 91

4.5 Questionnaires ............................................................................................................................................ 91 4.6 Stakeholder consultation network .............................................................................................................. 92
5. REFERENCES ...................................................................................................................................................... 97 6. ANNEXES ......................................................................................................................................................... 103
Annex 1: Environmental Baseline Indicators ........................................................................................................... 103 Annex 2. Technical Annex ....................................................................................................................................... 106 Annex 3: Territorial dynamics in Andean countries ................................................................................................ 118
Tables
Table 1: Core Sustainability Indicators ......................................................................................................................... 9 Table 2: EU goods exports to Andean countries 2003 ‐ 2007 .................................................................................... 14 Table 3: EU goods exports to Andean countries by commodity group, 2007 ............................................................ 15 Table 4: EU goods imports from Andean countries 2003 ‐ 2007 ............................................................................... 16 Table 5: EU goods imports from Andean countries, by commodity group. ............................................................... 16 Table 6: Share of Gross Capital Formation in GDP (%) ............................................................................................... 17 Table 7: Foreign Direct Investment Inflows, 2005‐07 ($million) ................................................................................. 17 Table 8: Inward FDI as share of Gross Fixed Capital Formation (%) ........................................................................... 17 Table 9: Poverty incidence in ANDEAN countries ...................................................................................................... 19 Table 10: Gini coefficient of income inequality ........................................................................................................... 22 Table 11: Selected indicators on health conditions (2006 or latest available year) .................................................... 22 Table 12: Selected indicators on health conditions of children (2006 or latest available year) .................................. 23 Table 13: Births attended by skilled health personnel (%) .......................................................................................... 23 Table 14: Literacy and school enrolment in Andean countries .................................................................................... 24 Table 15: Population with sustainable access to improved drinking water sources and sanitation, 2006 .................. 24 Table 16: Agrarian Structure of selected Andean countries ........................................................................................ 26 Table 17: Change in the structure of the total employed population, by sector of economic activity ........................ 27 Table 18. Urban unemployment rate (ECLAC) ............................................................................................................. 28 Table 19: Environmental Performance Indicators, 2008 ............................................................................................ 43 Table 20: EPI Sub Component Scores, 2008 ................................................................................................................ 44 Table 21: Government Effectiveness Indicators .......................................................................................................... 46 Table 22: Rule of Law Indicators .................................................................................................................................. 47 Table 23: Change in GDP (%) ....................................................................................................................................... 51 Table 24: Real Income Effects, Millions of 2007 Euros ................................................................................................ 51 Table 25: Effects on European and Andean wages, Unskilled workers, Percent change ............................................. 52 Table 26: Effects on European and Andean wages, Skilled workers, Percent change ................................................. 52 Table 27: Shifts in Total Employment (%) .................................................................................................................... 52 Table 28: Effect on European and Andean Labour displacement for unskilled and skilled workers, percent ............. 53 Table 29: Percent change in Value of National Exports ............................................................................................... 53 Table 30: Percent change in Value of National Imports .............................................................................................. 53 Table 31: Summary of Global Effects, Static and Dynamic setting for Ambitious Scenario ......................................... 54 Table 32 (a) : Agriculture goods: Sectoral Changes (%) ................................................................................................. 56 Table 32 (b) : Primary products and processed agricultural goods: Sectoral Changes (%) ............................................ 56 Table 33: Industrial Sector in Andean countries ......................................................................................................... 63 Table 34: Manufactured goods: Sectoral changes in output (per cent), (share of value added in brackets) .............. 64 Table 35: Skilled labour employment effect per sector, % change .............................................................................. 65 Table 36: Unskilled labour employment effect per sector, % change ......................................................................... 66 Table 37: Change in Wages (%) .................................................................................................................................... 67 Table 38 Change in Services Output (%) and (percentage value added in brackets) for Scenario 2b......................... 71 Table 39: Foreign Direct Investment Inflows, 2005‐07 ($million) ................................................................................ 79 Table 40: Indicators of Trade Costs ............................................................................................................................. 86

Draft Interim Technical Report
1
EXECUTIVE SUMMARY
The objective of this Draft Interim Sustainability Impact Assessment report is to provide an initial
assessment of the likely economic, environmental and social impacts of an EU‐Andean trade
agreement. The assessment covers the four Andean countries of Bolivia, Colombia, Ecuador and
Peru. Although Bolivia is not an official party to the trade negotiations with the EU, Bolivia is
included in the report for analysis.
The preliminary assessment findings presented in this report form the basis for further consultation
with the project steering committee and members of civil society in the Andean countries and the
European Union. The results will be combined with the findings of the investigations undertaken by
local teams in the Andean countries to undertake deeper analysis in the final phase of the study and
to provide the basis for the analysis of preventative, mitigation and enhancement measures.
There are six sections to this report. Section one of this report outlines the background to the
EU‐Andean trade SIA and provides an overview of the study methodology. The methodology is
based on the Handbook for Trade SIAs.
The EU‐Andean SIA uses a multi‐region computable general equilibrium model to measure the static
and long run dynamic effects of two potential liberalisation scenarios:
Scenario 1: ‘Modest liberalisation’
90% reduction of tariffs, 50% liberalisation of services, 1% reduction of
trade transaction costs.
Scenario 2: ‘Ambitious liberalisation’
97% reduction of tariffs, 75% liberalisation of services, 3% reduction of
trade transaction costs.
Section two analyses the baseline conditions in the Andean Counties. The baseline scenario serves
to describe the likely economic, social and environmental effects in the absence of a bilateral trade
agreement between the EU and its respective partners, and identifies the major economic and social
implications (including poverty, gender impacts, potential changes in wage and unemployment, and
adjustment costs) as well as environmental effects.
The baseline scenario takes into account existing WTO commitments of each country or region
under consideration and to what extent these commitments have been implemented. Section two
also describes the existing regulatory framework as it affects economic, environmental and social
outcomes.
Building on the baseline and broad macroeconomic analysis results, Section three provides the
interim sustainability assessment. This section examines the dynamic effects of trade liberalisation
on four sectors of strategic importance using nine core indicators of economic, social and

EU‐Andean Trade SIA
2
environmental sustainability: Real income, fixed capital formation, employment, biodiversity,
environmental quality, natural resource stocks, poverty, equity and health and education.
Section four of this report outlines project consultation activities with the network of SIA
stakeholders from civil society, including past and future consultation workshops, email
correspondence, the SIA website and newsletters.
Section five contains references used in the report and section six contains technical annexes.
Key findings of the Draft Interim Technical Report includes:
Macro
analysis
At the macro level, short run and long run analysis of both scenarios indicate that by
2018, a trade liberalising agreement between the EU and Andean countries would
result in a net increase in GDP of between 0.2 and 2.1 per cent across the four
Andean countries (Bolivia, Colombia, Ecuador and Peru). In contrast, there will be
no measureable change in the EU.
Agriculture
and
processed
agricultural
products
Agriculture and other primary products (excluding mineral fuels and oils) represent
more than fifty per cent of exports from Andean countries to the European Union.
Major products include bananas, coffee, nuts, copper, iron and steel. On average,
agriculture contributes to 10 per cent of GDP in Andean countries and between 8
per cent (Ecuador) and 40 per cent (Bolivia) of employment.
The results of long‐run ‘ambitious’ scenario modelling predicts mixed results across
the agriculture and mining sub‐sectors. Primary mining and horticulture (edible
fruits, nuts and vegetables) are the two sub‐sectors expected to increase production
across all four Andean countries as a result of the proposed trade agreement.
While this may have positive social and economical impacts in terms of rural
employment and incomes, increased mono‐culture production, land clearing and
chemical use pose environmental risks to Andean biodiversity. Output of grains,
forestry, fisheries and processed food and beverages will see both declines and
increases according to the individual Andean country.
Industrial
products
The industrial sector accounts for approximately one third of GDP in Andean
countries and between 18.8 and 23.8 per cent of employment. Exports of industrial
manufactured goods to the EU represent 10 per cent of total exports. Imports from
EU‐27 Member States are mainly high value machinery, vehicles, chemicals and
pharmaceuticals.
The interim modelling indicates that by 2018, output of light‐industrial goods
(textiles, clothing, leather products) will generally increase among Andean countries
as a result of trade liberalisation. In particular, output of textiles and leather goods in
Bolivia is predicted to increase by 20 per cent and 7 per cent respectively.

Draft Interim Technical Report
3
Output of heavy‐industrial goods (motor vehicles and transport equipment,
machinery and electronics) will increase on average over all the Andean countries,
with declines in certain sub‐sectors in some countries (eg. motor vehicle output is
predicted to fall by 24 per cent in Ecuador). This overall net increase in industrial
production is predicted to raise both skilled and unskilled wages in the Andean
countries by up to 1.3 per cent. Industrial air and water pollution will also increase
correspondingly unless mitigated by regulation or technology.
Services
Other trade
areas under
negotiation
The services sector, including tourism, is the most economically important sector in
the Andean countries, accounting for more than 50 per cent of the combined
Andean GDP. Among individual countries, the sector employs between 42 and 72
per cent of the workforce.
As barriers to trade in services are difficult to quantify, modelling the potential
impacts of trade liberalisation can be unreliable. Based on estimates of non‐tariff
barriers to the services trade of between 24 and 30 per cent in the Andean
countries, an ambitious scenario would result in general decreases in the output of
the financial, insurance, business and recreation services sub‐sectors. Output in the
utilities, construction, distribution and communication sub‐sectors is predicted to
increase in most Andean countries.
It is estimated that controlled opening up of the services sector to foreign
competition under an EU‐ Andean trade agreement may lead to improved social
welfare outcomes for the poor and greater resource use efficiency in the
environment.
An investment agreement with the EU is expected to have a positive impact on
inbound capital flow and long term employment trends for Andean countries, with
associated flow on social benefits (tax revenue, training). While improved openness
and transparency in public procurement in Andean countries is considered to bring
positive economic benefits, there remains insufficient data to support this assertion.
As Andean countries are shown to have some of the highest trade costs in the world,
enhanced measures on trade facilitation are expected to improve business
efficiency and facilitate growth and investment.

EU‐Andean Trade SIA
4

Draft Interim Technical Report
5
1. INTRODUCTION
1.1 EU Andean Trade SIA
Negotiations between the EU and the Andean Community for a region‐to‐region association
agreement, including political dialogue, cooperation and trade, were launched in June 2007, but
were suspended in June 2008 after disagreement between Andean countries on approaches to a
number of key trade issues. New negotiations for a multiparty trade agreement were launched in
January 2009 between the EU and Colombia, Ecuador and Peru. This trade agreement will provide
for progressive and reciprocal liberalisation of goods and services by means of a free trade area
compliant with the rules and obligations of the WTO, and establish common disciplines in all trade
related areas.
The EU is committed to supporting regional integration in the Andean Community through its trade
related technical assistance in the region, including institutional support to the Secretariat of the
Community of Andean Nations (CAN) and capacity building for the development of common policies.
The EC’s current Regional Strategy Paper for the Andean Community, covering the period 2007‐2013,
identifies three focal sectors for cooperation activities at CAN sub‐regional level: to assist the
Andean Community to strengthen its economic integration, thereby giving it a stronger position in
the world economy; to support initiatives to enhance social and economic cohesion within the
Andean Community; and to assist the Andean countries in their difficult fight against illicit drugs, in
line with the principle of shared responsibility that governs EU‐Andean relations in this area.1
The European Commission has been engaged in conducting Trade SIAs as part of its trade
policy‐making process since 1999. The purpose of the Trade SIA programme is to inform trade
negotiators and other interested parties on the potential economic, social and environmental
impacts of the EU’s trade negotiations, in both the EU and Europe’s trading partners. The SIA
programme is also intended to make proposals on preventing, enhancing and mitigation measures to
maximise positive effects arising from a trade agreement and minimise negative ones.
1 EC, 2007

EU‐Andean Trade SIA
6
The European Commission has defined the objective of its SIA studies (European Commission, 2002)
as a means of integrating sustainability into European trade policy:
• by analysing the issues of a trade negotiation with respect to sustainable development;
• by informing negotiators of the possible social, environmental, and economic consequences
of a trade agreement; and
• by providing guidelines to help in the design of possible flanking measures, the sphere of
activity of which can exceed the commercial field (internal policy, capacity building,
international regulation), and which makes it possible to maximise the positive impact and
to reduce the negative impact of the trade negotiations in question.
The Trade SIA programme applies a standard approach in conducting the assessment. This
framework has two complementary elements:
• Trade sustainability impact assessment, comprising a balanced and integrated assessment of
potential economic, social and environmental impacts.
• Consultation process, whereby consultation with, and dissemination of results to, partners
and key stakeholders is an integral part of the assessment process. Consultation and
transparency are essential processes for ensuring the credibility and legitimacy of the Trade
SIA.
The objective of the EU‐Andean SIA programme is to assess what impact a multi‐party trade
agreement could affect sustainable development in the EU and the Andean countries. The first stage
of the project involved the preparation of the Inception Report, available on the project website,
which outlined how the research and consultation of the Trade SIA will be carried out.
This Draft Interim Technical Report represents the mid‐way point of the project’s research and
consultations. The qualitative impact research on the scenarios developed for the assessment, in
preparation for civil society consultation in both the EU and Andean counties, reviews current
environmental, social, economic and trade characteristics and trends. It also reviews the interim
findings of the project consortium’s research on the likely impacts of the proposed trade
agreement. These findings will be reviewed at a local workshop in Lima, Peru on 26 May 2009 and at
a second civil society meeting in Brussels. Feedback from these events, and comments received via
the website, will be incorporated into the final report, which will propose measures for avoiding,
preventing or mitigating adverse impacts and enhancing beneficial ones.

Draft Interim Technical Report
7
1.2 Methodology of the EU‐Andean Trade SIA
Trade SIAs are based on the analysis of a causal chain which identifies the significant cause‐effect
link between a proposed change in trade policy and its economic, social (including gender and
poverty), and environmental impacts. This analysis should as far as possible combine qualitative and
quantitative approaches, use sustainability indicators and be based on the principle of proportionate
analysis. Primarily, the analysis focuses on the core indicators identified in the EC Trade SIA
Handbook2. In addition and where data are available, indicators used in the assessment covers
aspects of quality in work and decent work and Millennium Development Goals (MDG) according to
the various themes used in a Trade SIA study.
The models to be used build on the latest developments in trade modelling in areas of goods and
services trade, and are able to analyse dynamic effects, short and long term implications; imperfect
competition; heterogeneous households; and with social and environmental indicators inclusive
where required. The modelling methodology builds on those used in previous Trade SIAs, and
focuses on quantitative economic (and, where possible, social and environmental) factors and
outputs. Where discrete data is not available, qualitative sources relating to, for example, labour
conditions, impacts on quality of health, biodiversity, water quality impacts and other economic
issues such as regulatory and non‐tariff barriers will be used to derive indirect measures. Application
of a multi‐region computable general equilibrium (CGE) model is used to derive the core economic
impacts of the proposed multi‐party trade agreement. These scenarios have been developed in
consultation with the EC.
Results from the quantitative equilibrium modelling identify the expected magnitude of the increase
or decrease in production in each economic sector. In turn, this provides the basis for the
environmental and social assessment of liberalisation of trade in agricultural, non‐agricultural
products, services and other trade related areas. The results obtained from the economic analysis
will be used in conjunction with information on the regulatory regime. The latter is important since
the impact of social and environmental regulation has a significant influence on how economic
changes in turn affect social and environment issues.
2 http://trade.ec.europa.eu/doclib/docs/2006/march/tradoc_127974.pdf

EU‐Andean Trade SIA
8
PROJECT WEBSITE AND FEEDBACK
Feedback and comments on the Draft Interim Technical Report and on the project in general can be sent to enquiries@euandean‐sia.org
Information regarding the project and access to project documents is available at www.euandean‐sia.org.
Draft Interim Technical Report
9
2. BASELINE CONDITIONS
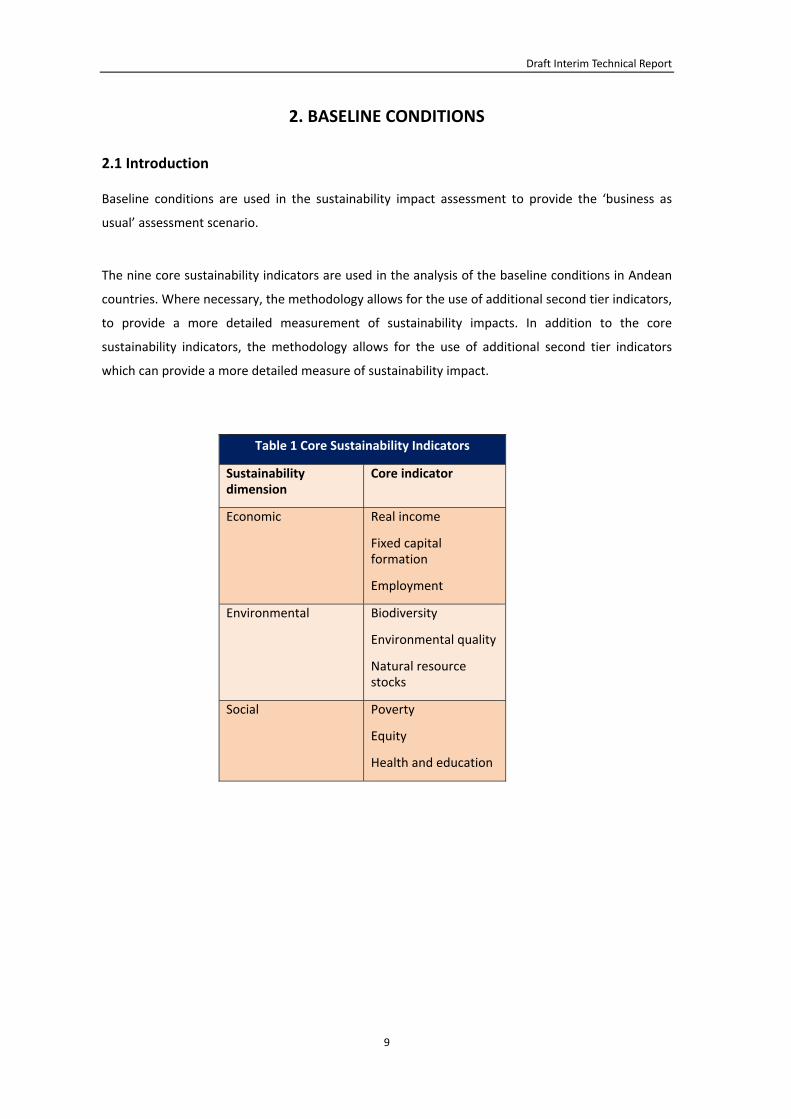
2.1 Introduction
Baseline conditions are used in the sustainability impact assessment to provide the ‘business as
usual’ assessment scenario.
The nine core sustainability indicators are used in the analysis of the baseline conditions in Andean
countries. Where necessary, the methodology allows for the use of additional second tier indicators,
to provide a more detailed measurement of sustainability impacts. In addition to the core
sustainability indicators, the methodology allows for the use of additional second tier indicators
which can provide a more detailed measure of sustainability impact.
Table 1 Core Sustainability Indicators
Sustainability dimension
Core indicator
Economic Real income
Fixed capital formation
Employment
Environmental Biodiversity
Environmental quality
Natural resource stocks
Social Poverty
Equity
Health and education

EU‐Andean Trade SIA
10
2. 2 Baseline Economic Conditions
2.2.1 Real Income
After a period of economic crisis and decline beginning at the end of the 1990s, the economies of
the Andean countries recovered in 2004, recording growth in GDP between 4.9% and 6.8%3 and
progress in practically all the principal economic indicators: investment, domestic savings,
employment, trade balance, inflation and external debt.
In 2007 the Andean countries combined GDP totalled approximately €222 billion. Divergence
between aggregate GDP levels between individual countries is much greater, with Colombia
accounting for the majority of total output, as revealed in figure 1.
Figure 1: 2007 Andean countries GDP Share and Real Growth Rate by Member
Bolivia has the most marginal economic impact of the group, despite having a labour force roughly
equal to that of Peru in size (4.38 million versus 4.51 million, 2007). Bolivia’s position as the least
developed of the group is contributed by its landlocked status.
3 EU Trade with the Andean Community, European Commission DG Trade, 1 August 2008

Draft Interim Technical Report
11
Figure 2: Andean countries – Per Capita GDP (PPP, 2007)
GDP per capita figures provide a further means of identifying characteristics of the regional
economic picture. As revealed in figure 2, Peruvians enjoy the highest relative living standards, while
Bolivians are the poorest, even when the purchasing power parity method is applied.
In terms of sector breakdown, matching its status as the poorest of the Andean member countries,
Bolivia’s economic dependence on agricultural is the highest, with 14% of output and 40% of
employment from that sector (see figure 3). In the rest of the region, on average, agriculture
contributes 10%, with the share of total employment in the sector, ranging from 8% to 22%. Peru has
the largest level of employment in the services sector, possibly most influenced by its large tourism
industry.
Figure 3: Labour Employment by Economic Sector

EU‐Andean Trade SIA
12
The aggregate production structure for the Andean countries and the EU is summarised in figure 4
below. As can be seen from the chart, roughly three quarters of the EU’s value added is attributable
to the service sectors and less than 20 percent to manufacturing. Production in the primary sectors
accounts for about 5 per cent of total European production.
Figure 4 ‐ Share of production in the Andean countries and EU27 by sector (2004)
0%10%20%30%40%50%60%70%80%90%100%
EU27 Bolivia Colombia Ecuador Peru
Primary Sectors Manufacturing Sectors Services
Source: GTAP database, version 7.
For the Andean countries, a smaller share of production is attributable to services. Meanwhile,
between one third and one fourth of overall production is attributable to the primary sectors.
2.2.2 Trade
Patterns of trade between the EU and Andean countries reveal significant growth during the past
decade ‐ bilateral flows have increased from €9.1 billion in 2000 to €15.8 billion by 2007, at an
average annual growth rate of 8.25%. The EU is the Andean countries’ second most important trade
partner behind the United States, accounting for 14.2 per cent of total trade in 2007. In contrast,
Andean countries accounts for 0.6 per cent of EU total trade, or approximately €10 billion of Extra
EU trade
Fifty per cent of total trade between the EU and the Andean countries is between the EU and
Colombia trade. Peru accounts for 27 percent, Ecuador for 19 and the remaining 5 per cent is
EU‐Bolivia trade. The shares of trade closely follow each country’s share of Andean GDP, which
implies similar shares of European trade per GDP across the Andean countries.
Draft Interim Technical Report
13
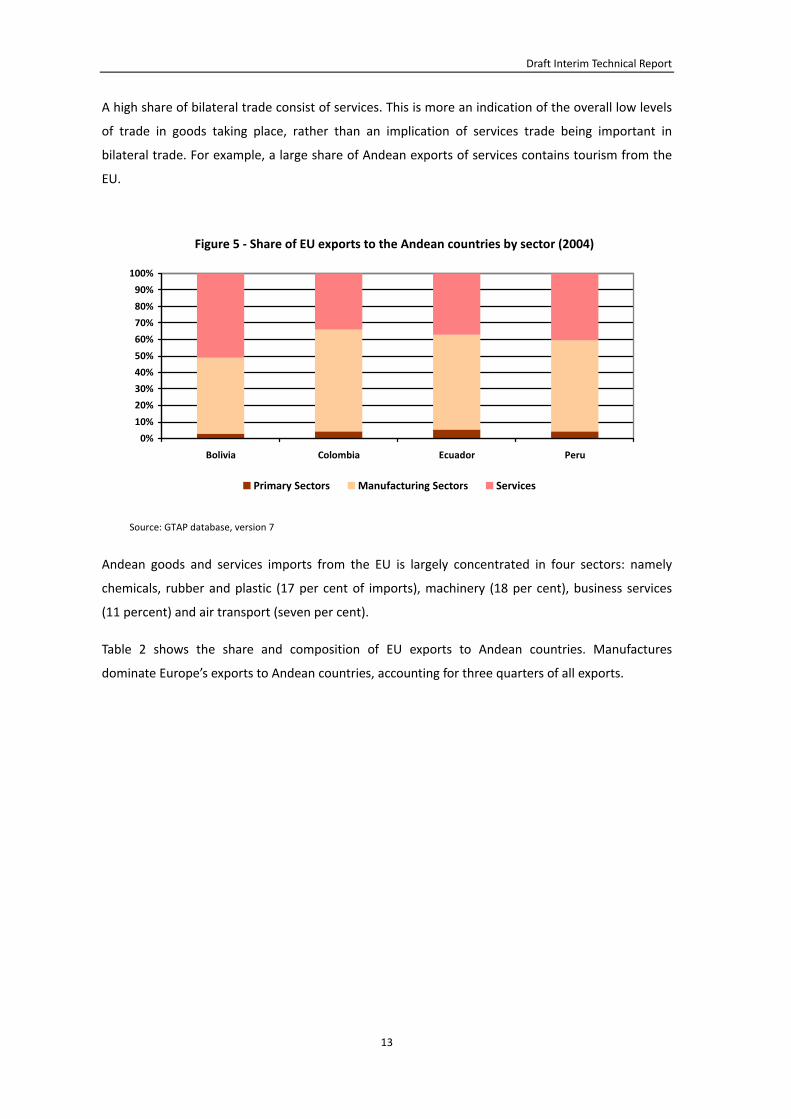
A high share of bilateral trade consist of services. This is more an indication of the overall low levels
of trade in goods taking place, rather than an implication of services trade being important in
bilateral trade. For example, a large share of Andean exports of services contains tourism from the
EU.
Figure 5 ‐ Share of EU exports to the Andean countries by sector (2004)
0%
10%
20%
30%
40%
50%
60%
70%
80%
90%
100%
Bolivia Colombia Ecuador Peru
Primary Sectors Manufacturing Sectors Services
Source: GTAP database, version 7
Andean goods and services imports from the EU is largely concentrated in four sectors: namely
chemicals, rubber and plastic (17 per cent of imports), machinery (18 per cent), business services
(11 percent) and air transport (seven per cent).
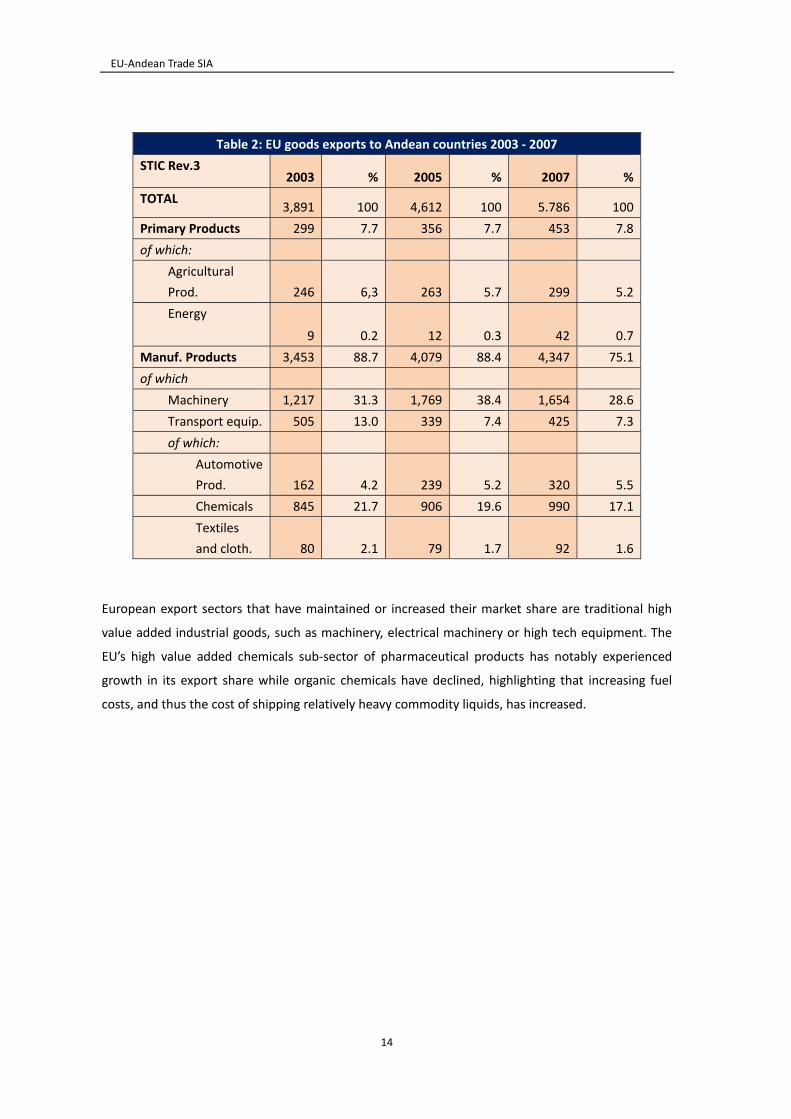
Table 2 shows the share and composition of EU exports to Andean countries. Manufactures
dominate Europe’s exports to Andean countries, accounting for three quarters of all exports.
EU‐Andean Trade SIA
14
Table 2: EU goods exports to Andean countries 2003 ‐ 2007
STIC Rev.3 2003 % 2005 % 2007 %
TOTAL 3,891 100 4,612 100 5.786 100
Primary Products 299 7.7 356 7.7 453 7.8
of which:
Agricultural
Prod. 246 6,3 263 5.7 299 5.2
Energy
9 0.2 12 0.3 42 0.7
Manuf. Products 3,453 88.7 4,079 88.4 4,347 75.1
of which
Machinery 1,217 31.3 1,769 38.4 1,654 28.6
Transport equip. 505 13.0 339 7.4 425 7.3
of which:
Automotive
Prod. 162 4.2 239 5.2 320 5.5
Chemicals 845 21.7 906 19.6 990 17.1
Textiles
and cloth. 80 2.1 79 1.7 92 1.6
European export sectors that have maintained or increased their market share are traditional high
value added industrial goods, such as machinery, electrical machinery or high tech equipment. The
EU’s high value added chemicals sub‐sector of pharmaceutical products has notably experienced
growth in its export share while organic chemicals have declined, highlighting that increasing fuel
costs, and thus the cost of shipping relatively heavy commodity liquids, has increased.

Draft Interim Technical Report
15
Table 3: EU goods exports to Andean countries by commodity group, 2007
Products (SITIC sections) by order of
importance Mio Euro %
Total 5.786 100,0
Machinery and transport equipment 2.091 36,1
Chemicals and related prod., n.e.s. 990 17,1
Manufactured goods 842 14,6
Miscellaneous manufactured articles 456 7,9
Food and live animals 166 2,9
Crude materials inedible, except fuels 105 1,8
Beverages and tobacco 92 1,6
Commodities and transactions n.e.c. 80 1,4
Mineral fuels, lubricants and rel. materials 42 0,7
Animal and vegetable oils, fats and waxes 15 0,3
Figure 6 ‐ Share of EU imports from Andean countries by sector (2004)
0%
10%
20%
30%
40%
50%
60%
70%
80%
90%
100%
Bolivia Colombia Ecuador Peru
Primary Sectors Manufacturing Sectors Services
Source: GTAP database, version 7.
EU imports of goods from the Andean countries is largely concentrated in goods originating in the
primary sector. Across all countries, nineteen percent of imports consist of Vegetables, Fruits and
Nuts. This sector accounts for close to fifty percent of imports from Ecuador. Mining accounts for 18
per cent of goods imported from Andean counties, with 25 per cent of imports from Colombia
coming from this sector.
Table 4 shows the composition and share of EU imports from the Andean countries. Primary
products account for 85 per cent of all imports.

EU‐Andean Trade SIA
16
Table 4: EU goods imports from Andean countries 2003 ‐ 2007
STIC Rev.3 Product
Groups 2003 % 2005 % 2007 %
TOTAL 6,094 100 7.41 100 10,255 100
Primary Products 4,452 73 6,643 89.6 8,783 85.6
of which:
Agricultural Prod. 3,074 50.4 3,973 53.1 4,328 42.2
Energy 782 12.8 1.3 17.5 1,675 16.3
Manuf. Products 751 12.3 742 10.0 1,048 10.2
of which:
Machinery 87 1.4 47 0.6 34 0.3
Transport equip. 92 1.5 17 0.2 5 0.1
of which:
Automotive
Prod. 1 0.0 1 0.0 1 0.0
Chemicals 89 1.5 94 1.3 155 1.5
Textiles and
cloth. 133 2.2 155 2.1 165 1.6
Source: DG Trade website
Table 5: EU goods imports from Andean countries, by commodity group.
Products (SITIC Sections) by order of importance Mio euro %
TOTAL 10,255 100,0
Food and live animals 4,017 39.2
Crude materials inedible, except fuels 1,764 17.2
Manufactured goods 1,747 17.0
Mineral Fuels, lubricants and related materials 1,675 16.3
Animal and vegetable oils, fats and waxes 226 2.2
Misc. manufactured articles 182 1.8
Chemicals and related prod., n.e.s. 155 1.5
Machinery and transport equipment 40 0.4
Beverages and tobacco 25 0.2
Commodities and transactions n.e.c. 15 0.1
Tables 3 and 5 reveal the product groupings that are most important to the EU and Andean countries
trading relationship: natural resources including mineral fuels, ores, slag and ash and copper have
maintained a strong proportion of Andean exports over this period, while other traditionally strong
sectors, such as fruits, coffee and pearls and precious metals have seen their relative share of trade
decline, in some cases significantly.

Draft Interim Technical Report
17
2.2.3 Fixed Capital Formation
With the exception of Bolivia, the share of fixed capital formation in GDP has risen since 2000 in the
Andean countries (table 6). This increase in investment has allowed capital formation to make a
stronger contribution to growth during the most recent growth period.
Table 6: Share of Gross Capital Formation in GDP (%)
2000 2005 2007
Bolivia 18 14 15
Colombia 16 22 24
Ecuador 20 24 24
Peru 20 18 23
There are significant differences in the total volume of foreign investment inflows to the Andean
countries, in part reflecting the differences in GDP. Table 7 shows the annual inflows of FDI over the
period 2005‐07.
Table 7: Foreign Direct Investment Inflows, 2005‐07 ($million)
2005 2006 2007
Bolivia ‐288 281 204
Colombia 10,240 6,464 9,028
Ecuador 493 271 178
Peru 2579 3467 5343
South America 44,305 43,102 71,699
Source: UNCTAD, 2008
Table 8shows similar cross country variation in the contribution that FDI makes to total gross fixed
capital formation.
Table 8: Inward FDI as share of Gross Fixed Capital Formation (%)
2005 2006 2007
Bolivia 23.2 17.2 9.6
Colombia 41.8 21.5 22.9
Ecuador 6.0 3.0 1.8
Peru 17.7 19.4 22.8
South America 16.0 13.1 15.4
Source: UNCTAD 2008

EU‐Andean Trade SIA
18
The differences in the contribution and volume of FDI shown in tables 9 and 10 reflects in part, the
differences in policy towards FDI in each of the Andean countries. After a decade of liberalisation
and market opening for FDI in the 1990s, the present decade has seen divergent policies adopted
towards FDI and integration with the global economy. These differences are particularly evident in
the hydrocarbon sector.
In Ecuador, oil and natural gas exports are an important source of foreign exchange accounting for
more than 40% of export earnings and approximately half of public sector proceeds.4 A new
hydrocarbons law of 2006 increased the share of revenue accruing to the Government from oil and
gas projects, prompting a series of contract renegotiations and disputes.
In Bolivia, natural gas provided an average of 34% of current revenue during the past decade.5 In
contrast to the liberalisation era of the 1990s, Bolivia introduced new restrictions on foreign
ownership in 2006. Discussions relating to ownership and fiscal arrangements in the oil and gas
industry were resolved by the signing of new service contracts which substantially raised the
Government’s revenues from production and returned ownership of all reserves to the State oil
company.6
In Peru, income taxes from the mining industry have increased dramatically in recent years in line
with metal price increase. Between 2000 and 2006, the annual income tax revenue from mining
companies rose from 10% to 42% of total government revenue. During the same period the annual
income tax revenue from the oil and gas industry rose from $35 million to $296 million,
corresponding to 5%‐7% of total government revenue.7 The mining industry employed over 100,000
people in 2006, accounting for less than 1% of the working population of the country.8
Colombia has substantial mineral reserves including one of the world’s largest deposits of oil
discovered in recent years (Cusiana fields), one of the world’s largest open coal mines and significant
deposits of emeralds, nickel and natural gas. In 2007, the extractive industries attracted more than
half the total FDI inflows. Foreign investment in oil and gas increased by 90% , totalling $3.4billion.9
In contrast to other Andean countries, Colombia has legislated for greater foreign participation in the
oil and gas industry, and in 2007 announced a plan to sell 20% of the shares on the State oil company,
Ecopetrol.10
4 Stanley 2008 5 Stanley, 2008 6 UNCTAD 2007 7 UNCTAD, 2007 8 UNCTAD 2007 9 UNCTAD 2008 10 UNCTAD 2008

Draft Interim Technical Report
19
2.3 Baseline Social Conditions
2.3.1 Poverty
Although poverty and indigence rates have decreased in the Latin American region in the last
decade11 poverty indicators are still significantly high in Andean countries. As a result of the current
world financial crisis, it is expected that poverty indicators will deteriorate further, as a result of the
rise in food prices, increasing rates of urban unemployment12 and weak (or lack of) social protection
schemes in most low‐income countries. It is predicted that the crisis will particularly affect poor
households whose income and livelihood strategies are based on the informal sector.13 It is also
expected that women will be among the more vulnerable to the labour market downturn cycle.
Table 9: Poverty incidence in ANDEAN countries
Country a/ National Urban Rural
Bolivia (2007) 54.0 42.4 75.8
Colombia (2005) 46.8 45.4 50.5
Ecuador (2007) 42.6 38.8 50.0
Peru (2006) 44.5 31.2 69.3
a/ Years are between parentheses.
Source: Based on ECLAC (Statistics and Economic Projections Division, Social Statistics Unit,
based on special tabulations of the respective country's household survey data).
Poverty is also a segmented phenomenon. Women and child poverty are recurrent problems across
Andean countries. As shown in Figure 7, from the early 1990s, until the beginning of the current
decade, child poverty increased more than 2 percent in Ecuador and Bolivia, whilst it decreased in
Peru. Furthermore, in all countries over half of all children below the relative poverty line live in
families which do not meet their basic needs. High income inequality and late demographic
transition would be among the significant factors that explain this pattern.14
11 ECLAC, 2008 12See also
www.eclac.cl/cgi‐bin/getProd.asp?xml=/prensa/noticias/comunicados/7/34747/P34747.xml&xsl=/prensa/tpl/p6f.xsl&base=/tpl/to
p‐bottom.xsl 13 ECLAC (2008) 14 UNICEF, 2005. Reduction in relative child poverty did not imply absolute child poverty reduction.

EU‐Andean Trade SIA
20
Figure 7
Changes in the incidence of relative child poverty,1990-2002
-2.72.4
2.7
-3 -2 -1 0 1 2 3
1
2
Changes in percentage points
Peru Ecuador b/ Bolivia
Based on UNICEF data. (No information available for Colombia).
Extreme poverty tends to be concentrated in rural areas and indigenous groups. Indeed, as shown in
Figures 8 and 9, the incidence of extreme poverty is significantly higher in rural areas, especially in
areas with a concentration of indigenous groups.
Figure 8
Evolution of urban indigence in Andean countries
0 5 10 15 20 25 30 35
Peru
Ecuador
Colombia
Bolivia
América Latina
Percentage
1990 1999 2006
Source: Based on ECLAC data.

Draft Interim Technical Report
21
Figure 9
Evolution of rural indigence in Andean countries
0 10 20 30 40 50 60 70
Bolivia
Ecuador
Colombia
Peru
América Latina
Percentage
1990 1999 2006
Source: Based on ECLAC data.
It is also important to highlight that the increased mobility of poor populations across urban and
rural spaces and the deployment of combined livelihood strategies15, combined with high rates of
urbanisation, make it difficult to clearly identify who the rural and the urban poor are. This includes
data on where they settle down, what their livelihood strategies are, and how they can be reached
more efficiently with public policies and programmes.
The territorial dynamics that one can observe in Andean countries is notoriously uneven. There are
some territories which show processes of growth, poverty reduction and social inclusion. However,
next to successful cases there are situations in which every indicator of development is changing in
the opposite direction, whereby the local economy is stagnant, people are leaving due to lack of
opportunities, poverty is widespread, governability is weak and sustainability is seriously threatened.
In between there are territories in which the dynamics of development show mixed outcomes.16
15 See at this respect Hinojosa (2009), Escobal (2001), and Reardon and others (2001). 16 Annex 2 provides detailed information on the territorial dynamics of poverty in the Andean Community countries.

EU‐Andean Trade SIA
22
2.3.2 Inequality
One of the striking features of Latin American countries is the widespread inequality observed in
terms of income, poverty rates and most related social indicators (for instance, access to health and
education services). Table 10 shows the disparities observed of income distribution.
Table 10: Gini coefficient of income inequality
Country National Urban Rural
Bolivia (2001) 0.335 0.341 0.328
Colombia (2005) 0.584 0.587 0.495
Ecuador (2007) 0.531 0.513 0.469
Peru (2005) 0.430 n.d. n.d.
Notes:
‐Years of reference are between parentheses.
‐ n.d. means no data.
Source: Based on ECLAC (Statistics and Economic Projections Division, Social Statistics Unit, based on
special tabulations of the respective country's household survey data), UDAPE (2006), Escobal and
Ponce (2008).
A higher number represents a noarrower distribution of income amoung the total population..
2.3.3 Health and Education
National health conditions indicators in Andean countries (shown in Table 11 and 12) suggest that
health standards are relatively low when compared to higher income countries in Latin America and
the developed world.
Table 11: Selected indicators on health conditions (2006 or latest available year)
Adult
mortality rate
a/
Incidence of
tuberculosis
(per 100000
population per
year)
Life
expectancy
at birth
(years)
Life expectancy
at birth (years)
female
Life
expectancy at
birth (years)
male
Maternal
mortality ratio
(per 100 000
live births)
Prevalence of
tuberculosis
(per 100 000
population)
Bolivia 208 198 66 67 64 290 266
Colombia 131 45 74 78 71 130 59
Ecuador 166 128 73 76 70 210 195
Peru 136 162 73 75 71 240 187
Notes:
a/ probability of dying between 15 to 60 years per 1000 population
Source: World Health Organisation (WHOSYS)

Draft Interim Technical Report
23
Table 12: Selected indicators on health conditions of children (2006 or latest available year)
Deaths
among
children
under five
years of age
due to
diarrhoeal
diseases (%)
Infant
mortality rate
(per 1 000 live
births) both
sexes
Infant
mortality rate
(per 1 000 live
births) female
Infant mortality
rate (per 1 000
live births) male
Children under
five years of
age stunted for
age (%)
Children under
five years of age
underweight for
age (%)
Bolivia 14.3 50 47 52 32.5 5.9
Colombia 10.3 17 14 20 16.2 5.1
Ecuador 11.0 21 18 23 29.0 6.2
Peru 12.2 21 20 23 31.3 5.2
Source: World Health Organisation (WHOSYS)
Rural populations in Andean countries are affected by a number of infectious diseases, which in turn
have impacts on poverty. The more recurrent are malaria, tuberculosis and dengue.
According to the WHO, the incidence of these illnesses is higher in Colombia and Bolivia, followed by
Peru. Malaria affects on average at least 2 out of 1000 people in Colombia, Bolivia and Peru. Dengue
affects rural population in a range of 20 to almost 80 people (per 100,000) and tuberculosis
approximately 20 (per 100,000).
Access to social services is segmented by sex and geography. Education still privileges men, and rural
areas continue to show lower standards of both education and health. Such a situation explains, at
least in part, the high percentages of adolescent fertility rates (100% in Ecuador, 97% in Bolivia, 92%
in Colombia and 59% in Peru) which, in combination with women’s lower access to education,
constrains the opportunities for women to integrate into labour markets. (See tables 13 and 14).
Table 13: Births attended by skilled health personnel (%)
National average Lowest wealth quintile Rural Urban
Bolivia 61 34.4 38.6 77.7
Colombia 96 72 76.8 97.1
Ecuador 80 n.d. n.d. n.d.
Peru 73 13 25.3 84.6
Source: World Health Organisation (WHOSYS)

EU‐Andean Trade SIA
24
On average, however, education levels in Andean countries are relatively high. Since the 1980s,
access to primary education has improved significantly. The two main concerning issues relate to
access to secondary and higher education, and the quality of education services. Whilst men from
urban areas are among those who have more access to secondary education, in rural areas the
situation is almost similar for men and women. In either case, the quality of public education in rural
areas is notably low.
Table 14: Literacy and school enrolment in Andean countries
Adult
literacy
rate (%)
Net primary school
enrolment ratio
female (%)
Net primary school
enrolment ratio
male (%)
Bolivia 86.7 95.0 94.0
Colombia 92.8 88.0 89.0
Ecuador 91.0 97.0 96.0
Peru 87.9 97.0 96.0
Note: Bolivia: 2001, Colombia: 2005, Ecuador: 2001, Peru: 2005.
Source: World Health Organisation (WHOSYS)
With regards to access to water distribution public services, as well as to sanitation infrastructure,
the disparities between urban and rural areas can clearly be perceived (see table 15).
Table 15: Population with sustainable access to improved drinking water sources and
sanitation, 2006 (percentage)
Water
(Rural)
Water
(Total)
Water
(Urban)
Sanitation
(rural)
Sanitation
(total)
Sanitation
(urban)
Bolivia 69 86 96 22 43 54
Colombia 77 93 99 58 78 85
Ecuador 91 95 98 72 84 91
Peru 63 84 92 36 72 85
Source: World Health Organisation (WHOSYS)
Draft Interim Technical Report
25
2.3.4 Poverty, inequality and rural livelihood strategies
In many ways, the poor in rural areas are more disadvantaged than the poor from urban areas.
Studies on rural livelihoods in Latin America show that individuals and households from rural areas
develop diversified strategies that combine farm, non‐farm and off‐farm activities (among them:
agriculture, cattle grazing, food processing, hand crafting, petty commerce, wage labour in
agriculture, as well as in temporary or even permanent urban employment, and so on). However,
insufficient productive and social infrastructure, limited access to public services and limited access
to technology reduce the opportunities for the rural population to supplement farming incomes
through salaried labour. It also makes it more difficult to develop small‐scale non‐farm and off‐farm
activities, and access to local and regional markets.17
More positively, the rural poor’s diversified livelihoods have produced incentives for specialisation
and more efficient use of available assets. As a consequence, positive processes of decreasing
poverty and local growth have been observed.18 The combination of livelihood strategies among
rural and urban areas implies that the rural–urban divide becomes a narrow line in regions where,
under certain conditions, both agriculture and non‐agricultural activities are profitable.19
The relationship between livelihood strategies and economic performance, both at the level of
households and of sub national regions, depends on two important factors: the characteristics of
local/regional markets and the agrarian structure.
Market characteristics that influence a farmer’s economic performance include size, direct and
indirect commercialisation costs and ongoing transaction costs. In regards to the agrarian structure,
a farmers’ ability to be part of economic growth processes and exploit commercial opportunities is
differentiated by their size, the type of crops and the degree of asset concentration. Table 16 shows
main features of the agriculture sectors in each of the Andean countries. Taking in account such a
structure, the chances of small farmers being included in trade integration‐led growth processes
based on specialisation seems to be low.20
17 See, Berdegue and others (2001); Bebbington (2004); Hinojosa (2006). 18 For examples of dynamic processes of growth and poverty reduction in rural areas see 19 For a characterisation of main factors for the success of some livelihood strategies see FIDA (2009) and Berdegue y otros (2008). 20 See, for instance, Escobal and Ponce (2007), Aramburu (2008).

EU‐Andean Trade SIA
26
Table 16: Agrarian Structure of selected Andean countries
Country
(a/) Main features
Size of exploitation
Small agriculture Medium scale Large scale
Bolivia Land tenure (Ha) < 50 > 50 > 2000
Percentage of farmers 53% 47% 13%
Main location
High plateau and
valleys Valleys Llanos (Orient)
Main crops
Staple food
Commercial
crops
(diversified)
Soy, girasol, cattle,
sugar cane, maize,
poultry
Ecuador Land tenure (Ha) < 5 5 to 20 > 100
Percentage of farmers 64% 36% 2%
Main location Highlands
Coast
Main crops
Potato, sugar
cane, maize
Maize, potato,
mora
Banana, sugar cane,
African palm
Peru b/ Land tenure (Ha) < 10 > 30
Percentage of farmers 85% 5%
Main location Highlands
Coast and
rainforest
Main crops Staple food
Cotton, rice,
sugar cane, palm
Notes:
a/ No information available for Colombia.
b/ 24% of the 85% of small agriculture has less than 1 Ha.
Source: Based on Inurritegui and others (2008).

Draft Interim Technical Report
27
2.3.5 Employment and Decent Work
Employment in the Andean countries increased on average at a rate close to 9 percent in the period
2000‐2006. Except for Peru, a common feature to the other three Andean countries is the changing
sectoral structure of the employed population, with a reducing contribution of the agriculture sector
and increasing contribution of industry in Bolivia and Colombia, and the services sector in Ecuador
(see table 17).
Table 17: Change in the structure of the total employed population, by sector of economic
activity a/ (Percentage of total employed population b/)
Bolivia Colombia c/ Ecuador Peru
Sectors b/ 2000 2006 2000 2006 2000 2006 2000 2006
Agriculture 36.8 32.3 22.0 20.9 28.5 29.6 32.0 37.5
Industry 19.5 21.6 19.0 19.8 20.1 18.6 14.0 13.4
Services 43.7 46.0 59.0 59.4 51.4 51.8 54.0 49.1
Total 100.0 99.9 100.0 100.1 100.0 100.0 100.0 100.0
Notes:
a/ Refers to employed population aged 15 years and over.
b/ In accordance with the International Standard Industrial Classification of All Economic Activities (ISIC), Rev. 2. Data refers to
the year nearest to the one heading the column.
c/ Municipality capitals for 2006.
Source: Based on ECLAC (Economic Development Division) data.
With regards to the distribution of employment by gender, access to employment has been more
favourable to men than women, with differences of about 10% in access to labour markets. On
average, during the period 2000 and 2007, the percentage of the male employed population in
Andean countries which were men ranged between 55.7 % to 60.4 % (Figure 10).

EU‐Andean Trade SIA
28
Figure 10
Source: Based on ECLAC data.
Despite the relatively low rates of unemployment recorded in all Andean countries (see Table 18),
underemployment is reported as widespread. Although the category of the informal sector is
amorphous, the share of unemployment hidden in the informal parts of all economic sectors seems
to be high21.
Table 18. Urban unemployment rate (ECLAC)
(Average annual rate)
Country 2000 2001 2002 2003 2004 2005 2006
Bolivia /a 7.5 8.5 8.7 9.2 6.2 8.1 8
Colombia /b,c 17.3 18.2 17.6 16.6 15.3 13.9 12.9
Ecuador /a,b 9 10.4 8.6 9.8 9.7 8.5 8.1
Peru /d 8.5 9.3 9.4 9.4 9.4 9.6 8.5
Source: Our elaboration based on ECLAC data.
Notes:
a/ Urban areas
b/ Includes hidden unemployment.
c/ Thirteen metropolitan areas.
d/ Metropolitan Lima.
21 Maajid 2001
General level of employment in Andean countries by gender
0
2000
4000
6000
8000
10000
12000
14000
16000
18000
Bolivia Colombia Ecuador Peru
thousands of workers
Women
Men

Draft Interim Technical Report
29
The high rates of informal employment observed for Andean countries leads to express concerns
about labour standards. Particularly critical is the situation of young people and women, for whom
unemployment and low labour standards are more adverse. According to ILO reports22 the young
population’s unemployment is ‘critical, dynamic and segmented.’ Unemployment among young
people is much higher than average unemployment overall (approximately twice of the overall
unemployment rate and three times the rate for adults).
Additionally, young people account for about 50 percent of all unemployed workers in nearly every
Andean country. The relationship between educational achievements and requirements in the work
environment of new production patterns is changing rapidly. The ratio of young women to men in
the economically‐active population is changing and the reforms being made to increase labour
flexibility are increasing the vulnerability of workers.
More highly‐educated young people have a better employment outlook in terms of wage and
working conditions. For example, while young professionals in the urban area are more often
integrated into labour markets in favourable conditions, there is a large number of young people in
urban and rural areas who hold insecure, low‐level jobs. That segmentation is also observed by
gender (with lower wages paid to women than men with the same level of education and skills).
Diversified livelihoods in the rural area also result in many economic units using low or unpaid
labour from household members. Although compensation mechanisms follow family and
community norms, this situation also opens space for unfair contracting practices and even
exploitation. Small scale and artisanal mining in Bolivia, small agriculture in all countries, and petty
commerce are the main sectors where these practices have been observed. This particularly critical
situation affects women (popularly named ‘palliris’) who collect mine residuals in the Bolivian high
plateau,23 the situation of young miners in the Peruvian gold panning areas; and that of children in
poor small‐farm households.
22 See, for instance, Maajid 2001 and ILO 2006. 23 CISEP (2005).

EU‐Andean Trade SIA
30
2.4 Baseline Environmental Conditions
2.4.1 Context
The geography of the Andean region is extremely varied. The Andes mountain range extends
through seven countries, including Bolivia, Ecuador, Colombia and Peru. Produced by the subduction
of the Nazca plate beneath the South American plate, the Andes form the longest mountain range in
the world, and the highest outside Asia. The northern (Colombia and Ecuador) and central (Peruvian
and Bolivian) Andes are wide and contain numerous plateaux and valleys. Bogotá, Quito and La Paz
are all situated in these areas. The northern Andes are typically rainy and warm, and the central
areas are drier. Climate within the Andean region varies according to location, altitude, and
proximity to the sea. To the west of the Andes, the climate ranges from the extreme wet of the
Colombian Chocó, to the extreme dry of the coastal desert strip. To the east of the Andes are
extensive lowlands, typified by savanna and forest with seasonal and heavy rainfall respectively.
The varied geography and climate of the Andean region is reflected by a high level of environmental
heterogeneity, with a wide range of ecosystems. These include forest systems, freshwater and
coastal wetlands, grasslands, mountains and dry ecosystems.
The environment of the Andean region is under pressure from numerous factors driven by the
economic development and modernisation of the Andean countries. Pressures include:
• Increasing urbanisation
• Population growth
• Intensification and expansion of agricultural production
• Industrial growth
• Climate change
• Resource extraction
These pressures have resulted in the following key environmental issues impacting on the Andean
region:
• Depletion and degradation of water resources
• Air pollution
• Industrial pollution
• Deforestation
• Soil erosion and desertification
• Biodiversity loss
The environmental core indicators for the SIA are natural resource stocks, environmental quality and
biodiversity.

Draft Interim Technical Report
31
2.4.2 Natural Resource Stocks
The Andean region is rich in water resources, but they are under increasing pressure. Urban
expansion, population growth and rising agricultural and industrial demand have increased water
resource depletion. Deforestation and urban expansion influence the water cycle, decreasing the
permeability of receiving zones, preventing rainwater from seeping into aquifers, and accelerating
run‐off in periods of high precipitation.24 In many coastal cities in the Andean region, local aquifers
have been over‐pumped, resulting in saltwater intrusion. Throughout the region, agriculture uses
the majority of water resources, followed by domestic and industrial consumption.25
Average annual rainfall in the Andean countries is 1,991 mm.26 While this is very high, the region
exhibits marked differences in water availability throughout different geographic areas. Water
extraction stress is not severe in the Andean region. It ranges from 0.4% in Bolivia and Colombia to
3.9% in Ecuador.27
Water quality reduction is a greater problem. It is caused by untreated sewage, excessive use of
fertilisers and pesticides,28 and industrial, mining and energy pollution.29 In 2002 some 95% of
Colombian municipalities did not treat raw sewage, instead depositing it into river systems.30 Access
to sewerage systems in the Andean states has improved31 over the last 15 years,32 although urban
areas are still much more comprehensively serviced than rural areas.33 However, much of this
sewage is not treated, and the pollution problems are merely transferred to other geographic areas.
Access to clean piped water is not universal in the Andean region. For example, a 1995 study of
Ecuador’s largest city, Guayaquil, showed that 35% of the 1.6 million population did not have access
to adequate piped water supplies,34 instead relying on water merchants who charged hugely
inflated prices. However, access to ‘improved’35 water sources increased markedly in the period
24UNEP GEO‐LAC (2003) 25 Table 2 (UNEP data) 26 UNEP GEO‐LAC (2003) 27 UNEP GEO‐LAC (2003) 28 Drug production (especially in Colombia) and the associated cultivation of opium poppy has also resulted in the spread of
chemical herbicides through river systems. 29 UNEP GEO‐LAC (2003) 30 Interim Environmental Review US‐Andean Free Trade Agreement (2005) 31With the exception of the Bolivian rural population 32 Table 3 (WHO/UNICEF data) 33 Ibid 34 Swyngedouw, E. (1995) 35 ‘Improved water sources include household connections, public standpipes, boreholes, protected dug wells, protected springs,
and rainwater collections. Unimproved water sources are unprotected wells, unprotected springs, vendor‐provided water, bottled

EU‐Andean Trade SIA
32
1970‐2004,36 although supply is still less widespread in rural than urban areas.37
2.4.3 Environmental Quality
Air
Air pollution from rapid and often unregulated urbanisation and industrialisation has caused a
deterioration of air quality in the Andean region. Urbanisation has resulted in a high number of
vehicles (typically with poor emissions controls), traffic congestion and increased industrial output. A
lack of regulation concerning the placement of pollutant‐emitting factories means that they are
often situated near or within large cities, resulting in high levels of localised air pollution.
Households burning solid fuels also contribute to reduced air quality.38 This is much more prevalent
in rural than urban areas in the Andean region.39 Therefore while external air pollution is worse in
urban areas, indoor air quality is often worse in rural areas.
Air pollution differs city to city. The impact of air pollution is dependent on city site (surrounding
topography) and weather conditions. For example, in Medellin and Cali (two of Colombia’s largest
cities) limited air circulation exacerbates the impact of air pollution.40 Air pollution also varies within
cities (concentrated in ‘hot spots’) and from season to season.
The effects of air pollution can be seen in high levels of chronic breathing problems amongst
children, and chronic bronchitis amongst adults.41 Three of the most relevant aerial pollutants are
particulate matter, nitrogen oxide and sulphur dioxide.
Particulate matter is emitted as part of the hydrocarbon combustion process, particularly by diesel
and two‐stroke engines. Particles less than 3 microns in diameter cause breathing problems and
irritation of the lung capillaries. This causes respiratory morbidity, deficiencies in pulmonary
functions and lung cancer. Chronically reduced lung capacity (emphysema) among the urban
population is a major risk.42
water (unless water for other uses is available from an improved source) and tanker truck‐provided water’
http://www.worldwater.org/data.html. 36 Table 2 (http://www.worldwater.org/data.html data) 37 Table 2 (UNEP data) 38 WHO – ‘The use of solid fuels in households is associated with increased mortality from pneumonia and other acute lower
respiratory diseases among children as well as increased mortality from chronic obstructive pulmonary disease and lung cancer
(where coal is used) among adults. It is also a Millennium Development Goal indicator.’ 39 Table 4 (WHO Data) 40 Hardoy & Satterthwaite (2007) 41 UNEP GEO‐LAC 2003 42 http://www.unep.org/tnt‐unep/toolkit/pollutants/facts.html

Draft Interim Technical Report
33
Nitrogen oxides are released by motor traffic, power production, and the burning of wood and
refuse. They result in respiratory irritation, headaches, pulmonary emphysema and oedema of the
lungs. Nitrogen oxides also contribute to the formation of acid rain, which can cause extensive
damage to vegetation, and terrestrial and aquatic ecosystems.43
Sulphur dioxide is produced by the combustion of fossil fuels that contain sulphur, including coal, oil
and diesel. Health effects include the aggravation of asthma and chronic bronchitis. Sulphur dioxide
also contributes to acid rain.44 A 1999 study found that emissions from copper foundries in the
Peruvian city of Ilo resulted in sulphur dioxide levels recorded at up to 30 times WHO guidelines.45
Urban environment and waste management
While population growth in the Andean region has slowed46 since 1990, urbanisation has
increased.47 Urbanisation has exerted pressure on the environment of the Andean region, and
resulted in concentrations of people in ‘megacities’ such as Lima and Bogota.48 Around a third of the
Andean population live in cities of 750,000 people or more.49 Unplanned urban growth in the
Andean countries has occurred without the necessary expansion of infrastructure and services, and
generally outside of a planning and regulatory context which would limit environmental costs and
protect natural resources. Environmental protection and sanitation services have failed to keep up
with the pace of urbanisation in the Andean region. Much land is occupied illegally ‐ either squatted,
or lived on without planning permission ‐ meaning that facilities for piped water and waste
collection are typically lacking.
Solid waste production has increased beyond collection capacity in many cities. In the Lima
metropolitan area just 60% of solid waste was collected in 2003, and in Quito 85% was collected,
compared to an average of 90% in the South America / Caribbean region.50 In Bogota, however, 99%
of solid waste was collected. Lack of collection often results in waste being deposited in the nearest
open area, causing increased disease vectors and pests (rats etc). Uncollected waste often blocks
drainage channels, with an ensuing impact on water facilities.
43 http://www.unep.org/tnt‐unep/toolkit/pollutants/Nitrogen.html 44 http://www.unep.org/tnt‐unep/toolkit/pollutants/Sulphurdioxide.html 45 Follegatti (1999) 46 Table 5 (WHO data) 47 Table 5 (WHO data) 48 UNEP GEO‐LAC (2003) 49 Table 5 (UNEP data) 50 UNEP GEO‐LAC (2003)

EU‐Andean Trade SIA
34
Urban development does not just alter the area which is being urbanised – the impacts of
productive activities responding to urban demands have a much greater reach, and pollution
produced by urban areas spreads far beyond urban boundaries.
2.4.4 Biodiversity
The Andean region is considered one of the most ecologically diverse areas in the world. The specific
location, elevation and geological youth of the Andes results in unique conditions of biodiversity.51
The tropical Andes are one of 25 worldwide ‘endemism hot spots’, containing 20,000 endemic plants,
6.7% of the world’s total52. The area also contains the largest variety of amphibians in the world,
with 664 distinct species, 450 of which are listed as threatened on the 2004 IUCN Red List.53
Colombia is one of the most biologically rich areas in the world, with 21 distinct bio‐vegetational
zones.54 Some 46% of the country is covered in forest. Ecuador is considered the world’s most
biodiverse country for its area55 and Peru, along with Colombia, has been declared by Conservation
International as one of 17 countries worldwide with ‘megadiversity’.56
A number of key ecosystems in the Andean region can be identified. The forest systems include the
Amazon forests, the montane forests of the Andes, and the Chocó forest which stretches along the
Pacific coasts of Colombia, Ecuador and north‐west Peru. They can be considered some of the most
important environmental areas in the Andean region, due to their valuable role as a carbon sink.
These areas are under threat from deforestation to clear land for agricultural use and livestock
grazing, reflecting national and international market demands. This causes a marked reduction in the
productive capacity of cleared land, due to processes such as erosion and acidification, the loss of
organic material, soil compacting, the loss of nutritive elements, chemical pollution and salinisation.
Deforestation causes sedimentation of water courses and deterioration of water resources. The
change in land use also typically increases emissions of carbon dioxide (due to deforestation),
methane (from increased livestock numbers) and nitrogen oxides (from fertilisers),57 with a resulting
impact on climate change. Peru had lost about 9.5 million hectares of its native forests by 2000, and
it is estimated that about a third of Colombia’s vegetative cover has been lost in the 30 or 40 years
51 Regional Biodiversity Strategy for the Tropical Andean Countries (2005) 52 UNEP GEO‐LAC 2003 p.64 53 www.biodiversityhotspots.org 54 Interim Environmental Review US‐Andean Free Trade Agreement Feb 2005 55 Interim Environmental Review US‐Andean Free Trade Agreement Feb 2005 56 http://www.conservation.org/documentaries/Pages/megadiversity.aspx 57 UNEP GEO‐LAC (2003)

Draft Interim Technical Report
35
before 2000.58
Deforestation in the Andean region is also caused by urbanisation, road building, infrastructure
assembly (electricity networks, dams etc), and resource extraction. Illegal logging is a well
documented problem throughout the area. For example, it is thought that about 70% of the timber
sold in Ecuador has been harvested illegally, and Ecuador’s deforestation rate is higher than
anywhere else in South America.59 Increasing oil exploration and development has occurred on the
eastern slopes of the Andes and the Amazonian lowlands of the Andean countries. Resource
extraction is economically important (for example, half of the Ecuadorian economy is based on the
extraction of oil and gas60), but exerts a strong environmental pressure.
The Andean region also has freshwater and coastal wetlands which are threatened by pollution, and
the growing exploitation of water resources for human use.61 The mangroves of Colombia and
Ecuador, which play an important role in coast stabilisation, are threatened by felling and the
development of aquaculture.62 Between Colombia, Peru and Bolivia, there are grassland ecosystems
which are used for cattle farming. These areas play a valuable role in the regulation of water
resources, but are under threat from overgrazing. The Andean region also contains dry ecosystems,
with desert extending from the south of Ecuador, and along the Peruvian coast. There are also dry
areas in the inter‐Andean valleys, and the Caribbean coast of Venezuela. These areas are all at risk
from increasing desertification.
2.4.5 Climate Change
In the Andean region, climate change is likely to have the most pronounced impact on coral systems,
sea level rises, and glacier dynamics in mountainous areas.63
The coral reefs of the Colombian Caribbean were affected by the El Niño events of 1982/3 and 1997/8,
resulting in widespread reef damage.64 Coral bleaching is also a problem as sea temperatures
increase. Sea level rises would impact low lying coastal areas of the Andean region. The Ecuadorian
coast is thought to be particularly vulnerable, and the concentration of the Andean population in the
coastal zones is a potential cause for concern.65
58 Interim Environmental Review US‐Andean Free Trade Agreement Feb 2005 59 Interim Environmental Review US‐Andean Free Trade Agreement Feb 2005 60 Interim Environmental Review US‐Andean Free Trade Agreement Feb 2005 61 Regional Biodiversity Strategy for the Tropical Andean Countries (2005) 62 Regional Biodiversity Strategy for the Tropical Andean Countries(2005) 63 Vergara (2007) 64 Regional Biodiversity Strategy for the Tropical Andean Countries 65 Vergara (2007)

EU‐Andean Trade SIA
36
Global circulation models project a disproportionately large temperature increase in the Andes
compared to surrounding lowlands,66 resulting in widespread glacier retreats. It is thought that
many lower‐altitude Andean glaciers could disappear within the next 10 to 20 years.67 Tropical
glaciers between Bolivia and Venezuela have retreated from over 2,940km² in 1970 to 2,490km² in
2002.68 An IPCC report claims that ‘Glaciers in the tropical Andes of Bolivia, Peru, Ecuador and
Colombia have decreased in area by amounts similar to global changes since the end of the Little Ice
Age.’69 As glaciers retreat, their regulatory ability to contribute to runoffs during dry warm periods
and store water during wet cold periods is reduced.70 This has the potential to cause considerable
impacts on the hydroelectric power sector, water supply for urban and agricultural areas, and
ecosystem integrity. The Andean states are heavily dependent on hydroelectric power for electricity
provision,71 which ranges from contributing 42% of Bolivian electricity consumption to 74% of
Peruvian electricity consumption.72 Large‐scale rainfall fluctuations due to El Niño and La Niña also
have a large impact on the viability of hydroelectric power generation.73
High mountain wetland ecosystems are extremely sensitive to climate change. The páramos
(Northern Andean wetlands) are thought to have already had their water vapour circulation patterns
influenced.74 Numerous large population areas, such as Bogotá and Quito depend on these
ecosystems for their water supply.75
There is a risk that the function of the Amazon basin as an ecosystem could be seriously impacted by
the effect of climate change on temperatures and precipitation cycles76. This could reduce the
Amazon basin’s capacity to store carbon, and result in a process of ‘savannization’ or
desertification.77 The Amazon basin plays an important role in the water cycle and water balance of
the whole continent, so changes to its function would have far‐reaching consequences.78
66 Ibid 67 Bradley et al (2006) 68 Vergara (2007) 69 IPCC Technical Paper VI Climate Change and Water 2008 p.96 70 Vergara (2007) 71 Table 1 (EIA and CIA data) 72 Table 1 73 IPCC Technical Paper VI Climate Change and Water 2008 74 Ruiz et al (2007) 75 Vergara (2007) 76 IPCC Special Report (1997) 77 Vergara (2007) 78 IPCC Technical Paper V Climate Change and Biodiversity

Draft Interim Technical Report
37
Precipitation increases have recently been observed in Bolivia, north‐west Peru and Ecuador, and
more frequent floods have occurred in the Mamore Basin of the Bolivian Amazon.79 There was an
increase of 2.4 times in the occurrence of climate‐related disasters in South America between
1970‐1999 and 2000‐2005.80 This clearly demonstrates the vulnerability of the Andean region to
climate change.
2.5 Baseline Regulation Characteristics
2.5.1 Introduction
The magnitude and significance of the direct and indirect sustainability impacts that result from
trade liberalisation will be affected by the status of the regulatory system and broader institutional
governance structures through which these sustainability pressures are managed. This section of the
baseline study therefore the regulatory policy and institutional framework in the Andean countries.
It also provides an evaluation of the effectiveness and quality of the regulatory framework in each of
the four countries.
The baseline regulatory conditions will provide part of the evidence base for later stages of the SIA
analysis. First, the assessment of impacts will be informed by what is known about the effectiveness
of the regulatory regime to prevent or mitigate potential negative (and enhance any positive effects)
of market opening and trade rules changes. Second, evidence of the strengths and weaknesses of
the regulatory framework will inform the recommendations for flanking measures, particularly in the
area of institutional strengthening and capacity building.
2.5.2 Environmental Regulation
Andean countries
The Andean countries have taken an active part in defining and developing legal, policy and
institutional measures for environmental policy. New environmental regulations have been
introduced and high level government bodies have been established to coordinate environmental
policies at the international, regional and national levels.
79 IPCC Technical Paper VI Climate Change and Water 2008 80 IPCC Technical Paper VI Climate Change and Water 2008

EU‐Andean Trade SIA
38
In the Andean sub‐region, the Andean Community of Nations and its Andean Committee of
Environmental Authorities have attempted to promote consensus and collaboration mechanisms in
sustainable development areas. Recent achievements include the Carabobo Accord (June 2001) and
the Guidelines for Environmental Management and Sustainable Development in the Andean
countries. The guidelines analyse priority themes and commitments assumed by member countries
in international fora.81
The first meeting of the Andean Community Council of Ministers of the Environment and Sustainable
Development, in Paracas, Peru, in 2005 mandated the Andean Committee of Environmental
Authorities (CAAM) with updating the Andean Environmental Agenda and reinforcing institutional
capacities so that the targets established in the Andean Environmental Agenda could be met.
The Andean Environmental Agenda 2006‐ 2010 is a guiding document framed in a long term vision
which proposes short and medium‐term actions. Sub‐regional actions are established in order to add
value to national efforts and build capacity of the member countries on environmental and
sustainable development matters.82 The Andean Environmental Agenda has two sections. The first
contains three Thematic Issues (biodiversity, climate change and water resources), and three
Crosscutting Issues (capacity building for trade, environment and sustainable development;
environmental education; and sustainable production and consumption). The second section
contains issues proposed by one or more countries that will be the subject of analysis and debate
before becoming part of the operating agenda.
Bolivia
Economic growth and income earning opportunities for the majority of the population is strongly
dependant on natural resources. This is why the Morales government assigned the sustainable
exploitation of natural resources a central place in the new Constitution (approved in January 2009),
reinforcing the role of state intervention in the sector.
The new constitution (CPE) is a very ambitious, complex and at times vague document that includes
the recognition of 36 indigenous “nations”, a wide range of social, economic and political rights,
state interventions in the economy (including the control over natural resources), and a reform of
the judiciary (with direct election of Supreme Court judges and a parallel system for indigenous
peoples). Particularly contentious is the creation of four levels of autonomy without a clear
definition of the distribution of competences and resources. The most important and controversial
aspects of the constitution (autonomies, decentralization, electoral system, judicial reform) have yet
to be clarified and implemented through secondary legislation.
81 UNEP, 2007
82 Comumidad Andina (2007)
Draft Interim Technical Report
39
The sound management of the revenues from finite natural resources is a key challenge for
sustainability and good governance. The land reform process stands out as crucial for reduced
inequality and poverty reduction, but involves a risk for accelerating the already high rate of
deforestation. There is a strong need to strengthen the capacity of public institutions, including the
land reform authorities, to integrate environmental considerations as a cross cutting issue as
stipulated in the CPE.
The National Development Plan (NDP) outlines an ambitious plan for public investments, including
support to micro‐ and small enterprises as well as large scale industrial projects with significant
potential environmental effects involved. In this context it is of concern that Bolivia does not have a
well working system for environmental assessments. It took the government more than a year to
decide which ministry should be assigned the role of being the Competent Environmental Authority
with the responsibility for environmental assessments. The central role assigned to the state in the
management of natural resources is one of the most important features of the CPE and the NDP.
However, the capacity of the public administration to play this central role has been weakened by
the large replacement of experienced staff from earlier administrations as well as by the reduction in
public sector salaries.
This weakening of public administrative capacity continues to be an obstacle to effective
environmental management. A clear division of responsibilities between different government
entities is crucial, not least due to the increasing involvement of the state in industries with vast
environmental impacts. A key explanation behind the lack of progress in implementing laws and
reforms for sustainable and equitable natural resources management is the conflicting interests
around these issues in Bolivian society. Social and political conflicts related to access and control of
key resources such as land, forests, water and gas are likely to continue as government reforms faces
fierce opposition by powerful groups. Reforms aiming at strengthening the legal system, dispute
settling mechanisms and democracy at large are thus important for addressing the pressing
environmental problems facing Bolivia.
Ecuador
Environmental protection is embodied in Ecuador’s 2008 Constitution, which even states rights for
nature (chapter seven). Although the Constitution guarantees environmental protection, Ecuador’s
environmental laws are recent – many dating only from 2000 or later – that implementation of a
legal regime has been uneven.
Examples include the Environmental Management Law and Environmental Secondary Laws, which
were designed, in part, to ensure coordination within a National Decentralized System of
Environmental Management. The Environment Ministry has the lead role in coordinating all agency
efforts. However, the number of agencies involved in environmental management, combined with

EU‐Andean Trade SIA
40
overlapping responsibilities, has produced inefficiency and conflict. Ecuador also has a series of
national laws aimed at prevention and control of pollution, protection of forests, protecting and
providing for clean water, controlling air emissions from fixed sources and other laws aimed
specifically at protecting public health. A special law exists for the conservation and sustainable
development of the ecologically sensitive Galapagos Islands.
All environmental laws in Ecuador are legally enforceable through administrative, civil and criminal
procedures, and Ecuador’s Environment Ministry has the ability to refer cases to the Ecuadorian
Attorney General for criminal prosecution. However, enforcement in most areas of environmental
law has been weak, and fines and penalties are rarely imposed. Controls on the environmental
impacts of some key industries, most notably oil exploration and extraction, are weak, ineffective or
absent. Regulatory issues affecting the oil industry are handled by the Ministry of Mines, not the
Ministry of Environment. In addition, PetroEcuador, the state oil company, has a special legal status
that has been used to avoid certain environmental responsibilities.
Colombia
Colombia has some of the most comprehensive and up‐to‐date environmental regulations in Latin
America, and its environmental laws have been used as a model by a number of developing
countries. Nevertheless, civil war, inadequate budgets, recession and a weak tax base have slowed
advances in implementing and enforcing environmental regulations. Additionally, because of
distance and weak government political presence, environmental enforcement in rural and frontier
zones has been weak. The enforcement situation is better in major urban areas, where the state is
able to exercise more authority.
Colombia has had environmental programs and regulations in place for several decades. Between
1968 and 1993, the federal government’s environmental responsibilities were carried out by the
National Institute of Renewable Natural Resources (INDERENA). During this period Colombia also set
up a regional governing network, the Corporaciones Autonomas Regionales (Regional Autonomous
Corporation‐‐CAR), whose responsibility included, but was not limited to, environmental matters. In
1974, Colombia implemented a National Renewable Resources and Environmental Protection Code,
which was one of the world’s first comprehensive environmental protection acts. Under that act,
INDERENA shared environmental responsibilities with the ministries of Health, Public Works,
Defence, Energy, the National Planning Department, government departments and municipal
authorities. In 1993, Colombia passed a law that established the Ministry of Environment, and
created 15 new corporaciones autonomas regionales that were dedicated solely to environmental
matters.
The 1993 law also established a National Environmental Council to coordinate environmental
programs among the various ministries that form the government. The Colombian Constitution was

Draft Interim Technical Report
41
approved in 1991 and contains 23 articles related to environmental protection. The Constitution also
sets up a structure for regional and local participation in environmental management. Despite these
advances in environmental legislation and administration, concerns have been raised that
restructuring and changing priorities may weaken Colombia’s environmental legal regime.
Peru
The concept of environmental protection is embodied in Title III, Chapter II, (“Environment and
Natural Resources”) of Peru’s 1993 Constitution. Article 200 outlines various government obligations
to provide citizens with legal tools they can use to pursue legal remedies for environmental wrongs.
Additionally, Chapter II of the Constitution reserves the right to develop all of Peru’s natural
resources to the national government, promotes the use of natural resources, obligates the
government to promote conservation of biological diversity and protected natural areas and
obligates the government to promote sustainable development of the Amazon Region through
appropriate legislation. The Constitution is more recent than the 1990 Peruvian Environment and
Natural Resources Code, which set responsibility for administration of environmental policies across
several ministries. As a result, a Peruvian Congressional Commission is in the process of preparing a
comprehensive update of Peru’s Environment and Natural Resources Code in order to establish a
new environmental framework law for the country.
Peru has recently created an environmental ministry (Ministerio del Ambiente)83 which integrates
all environmental programs dispersed before across several ministries and special cross‐sectoral
programs, and is called to coordinate with other ministries and regional and local governments on
environmental matters. The Ministerio del Ambiente took over the National Council of the
Environment (CONAM) which was the coordinating body between the government, the private
sector and civil society. Due to its recent creation this ministry is still in process of administrative
implementation and is carrying out a consultation process to define an environmental national
policy.84
Throughout the 1990s, Peru took several legislative steps that were designed to broaden the scope
of natural resource and environmental protection. The law creating the CONAM was implemented in
1994, about the same time that Peru implemented a framework law on private investment that
contained some environmental components. A 1990 law established a System of Natural Areas
Protected by the State. In the period 1997‐2001, laws were passed to address the sustainable
development of natural resources and biological diversity, protection of natural areas and water
resources, solid waste disposal and national environmental impact assessment. The nation’s
Supreme Court also has issued decrees establishing strategic regulations on biodiversity and 83 Created by Legislative Decree No. 1013 on May 14th 2008. 84 A document outlining the environmental policy for 2009‐2021 was made available for discussion on March 2009.
It can be found at http://www.minam.gob.pe/index.php?option=com_content&view=article&id=123&Itemid=65.

EU‐Andean Trade SIA
42
regulations to implement the 1997 law establishing protected natural areas.
Peru has a highly decentralised form of environmental enforcement based on regulations that are
specific to industries or industry or sectors of the economy. Several sectoral offices have their own
individual sets of administrative sanctions. These include authorities for forestry, mining,
hydrocarbons, electricity and manufacturing. With enforcement occurring over such a wide variety
of government agencies, it has been difficult for the Peruvian government to coordinate institutions
responsible for law enforcement, judicial and environmental program management. The national
government is taking steps to improve coordination among these various institutions. Peru’s 1990
Environment and Natural Resources Code gave Peruvian citizens some access to civil courts to
address environmental issues. The 1990 Code gave citizens the right to file injunctions (amparos) in
civil court that can result in legal actions to stop environmental law violations. However, the
amparos do not address issues of compensation for damages or issues of environmental remediation.
The 1990 Code also established discovery processes (procesos de conocimiento) that are somewhat
similar to filing civil lawsuits addressing environmental concerns.
Article 200 of the new Peruvian Constitution gave citizens four new legal tools that include: a
governmental obligation to provide legal remedies for infractions of environmental law; a similar
governmental obligation to force government authorities to comply with relevant environmental
laws; a governmental obligation to provide “popular action” to more generally correct violations of
environmental law; and a guarantee that violations of the environmental provisions of the
Constitution will be considered by Peru’s Constitutional Court. In circumstances where there is no
governing sectoral agency, the environment ministry can apply administrative sanctions. Ministry
and other government officials with environmental powers can impose administrative fines, but the
fines are generally very modest and do not act as a deterrent. Additionally, administrative judicial
proceedings allow environmental offenders a large number of appeals.
2.5.3 The Effectiveness of Environmental Regulation and Policy
Previously, it was widely believed that environmental quality would inevitably decline with economic
growth in lower income economies as poorer countries lacked the institutional capacity and political
commitment to implement effective environmental regulation. However, this conventional view –
known as the Kuznets curve hypothesis – has been challenged by new evidence that suggests that
environmental performance is positively related to the quality of environmental governance.85
85 The Kuznets curve disappears after controlling for the quality of environmental institutions and geographical vulnerability
(climate and terrain factors). See, for example, Dasgupta at al 2006
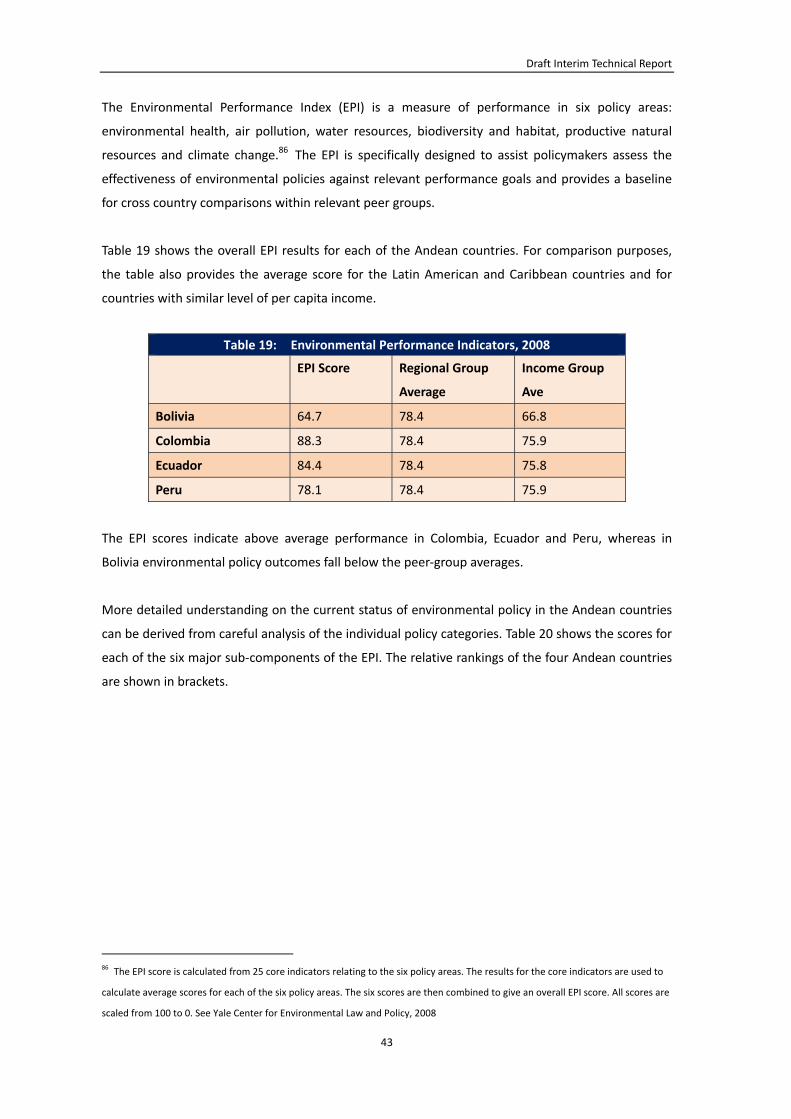
Draft Interim Technical Report
43
The Environmental Performance Index (EPI) is a measure of performance in six policy areas:
environmental health, air pollution, water resources, biodiversity and habitat, productive natural
resources and climate change.86 The EPI is specifically designed to assist policymakers assess the
effectiveness of environmental policies against relevant performance goals and provides a baseline
for cross country comparisons within relevant peer groups.
Table 19 shows the overall EPI results for each of the Andean countries. For comparison purposes,
the table also provides the average score for the Latin American and Caribbean countries and for
countries with similar level of per capita income.
Table 19: Environmental Performance Indicators, 2008
EPI Score Regional Group
Average
Income Group
Ave
Bolivia 64.7 78.4 66.8
Colombia 88.3 78.4 75.9
Ecuador 84.4 78.4 75.8
Peru 78.1 78.4 75.9
The EPI scores indicate above average performance in Colombia, Ecuador and Peru, whereas in
Bolivia environmental policy outcomes fall below the peer‐group averages.
More detailed understanding on the current status of environmental policy in the Andean countries
can be derived from careful analysis of the individual policy categories. Table 20 shows the scores for
each of the six major sub‐components of the EPI. The relative rankings of the four Andean countries
are shown in brackets.
86 The EPI score is calculated from 25 core indicators relating to the six policy areas. The results for the core indicators are used to
calculate average scores for each of the six policy areas. The six scores are then combined to give an overall EPI score. All scores are
scaled from 100 to 0. See Yale Center for Environmental Law and Policy, 2008

EU‐Andean Trade SIA
44
Table 20: EPI Sub Component Scores, 2008
Environmental
Health
Air
Pollution
Water
Resources
Biodiversity Productive
Natural
Resources
Climate
Change
Overall
Average
Rank
Bolivia 61.2
(1)
49.4
(1)
70.7
(1)
78.4
(3)
84.5
(3)
61.3
(1)
(1.6)
Colombia 91.4
(3)
98.3
(3)
98.3
(3)
75.0
(2)
94.8
(4)
87.1
(3)
(3)
Ecuador 91.7
(4)
98.9
(4)
98.9
(4)
79.6
(4)
61.8
(1)
80.1
(2)
(3.2)
Peru 78.3
(2)
96.9
(2)
96.9
(2)
58.1
(1)
80.6
(2)
87.1
(3)
(2)
The rankings shown in table 20 show variation in performance in different areas of environmental
policy. In Ecuador, for example, performance in the management of productive natural resources is
ranked below the other three countries, whereas its performance in the other five areas is superior
to that of the other Andean countries. The average of the ranks across the six areas confirms that
environmental policy is less effective in Bolivia than in the other three economies.
2.5.4 Labour Regulation
The four Andean countries have individually signed most of international agreements on labour
standards referred to protection against child labour, forced labour and labour discrimination, and to
protect free affiliation to unions, collective negotiation, labour inspection in many sectors and the
rights of indigenous people. Additionally, in 2004, at the Andean Community level, the countries
approved a legal system (the Andean Social Security Instrument) to adapt the Common Market
objectives to the current structure of the social security systems of the countries87. They also
approved Decision 584 "Andean Work Safety and Health Instrument" to promote and regulate the
activities to be developed at work centres in Member Countries, to reduce or eliminate any and all
damages to workers’ health through the implementation of control measures and the development
of activities required to prevent work related risks. Both decisions are now fully regulated.88
Notwithstanding the progress made in regulation, concerns have been raised about the weak
mechanisms to ensuring compliance with the basic decent work standards in all the four countries.
A number of adult labour rights issues affect individual countries. To this end, Ecuador’s poor track
record of supporting worker’s rights and preventing child labour was considered sufficiently
87 Decision 583 adopted on May 2004.
88 Details available at: http://www.comunidadandina.org/normativa/res/R957sg.htm

Draft Interim Technical Report
45
problematic and in 2005 US trade negotiators stated this as a reason for not concluding a trade
agreement.89 While workers do have the right of assembly, complex rules govern assembly and
protest rights, making doing so difficult without breaking the law. These rules for example include a
minimum size of 30 workers required for forming a union, a policy criticised by the ILO. Additionally,
forming unions across companies even within the same occupation is not permitted.
In Bolivia meanwhile, freedom of association in the workplace is generally respected. The
requirement to have at least 20 employees to form a union excludes approximately 70% of the
countries workforce from union activities. However the new Constitution significantly extends
labour rights.
Colombia has a poor history with the right to assembly, which unfortunately has persisted
throughout its economic growth this decade. In the first 5 months of 2008, 26 trade union officials
were killed, a 70% rise over the same period in 2007. Of a labour force of 20 million, only 1%, or
200,000 people, can exercise their legal right to strike, a result of tangible threats of violence.90 The
government has made labour rights an increasing priority, with funds to protect trade union officials
growing from US$ 1.7 million to US$ 34 million in 2007.
Forced labour is also a persistent concern. In Bolivia, up to 7,000 indigenous Guaranis work as
indentured servants in remote areas of Chuquisaca, and up to 30,000 indigenous people are in
forced work on agricultural operations in the Beni and Santa Cruz Departments of the country.91
Such patterns arise despite that the country’s national minimum wage of 436 Bolivianos per month
(2007) and maximum hours per week of 48, which are not effectively enforced.
Further, and driven largely by the endemic poverty levels, a large number of informal workers earn
wages below minimum levels, in turn undermining efforts to protect legal workers’ rights. In Bolivia’s
mining sector for example, workers earn an average of 21 Bolivianos per 12 hour days, with work
safety conditions having improved little in the last decade.92 In any case, in both Ecuador and
Colombia, typical wages amount roughly to merely half the necessary amount for daily living
expenses, capturing workers in a cycle of debt. Meanwhile, in agricultural areas injudicious pesticide
use contributes to high levels of premature births, congenital malformations and miscarriages.93 In
89 U.S.: Ecuador’s Labor Abuses Violate Trade Act, Human Rights Watch, 19 September 2005 90 Capdevila, Gustavo, COLOMBIA: ILO to Keep an Eye on Labour Rights, Inter Press Service, 13 June 2008 91 Enganche y servidumbe por deuda en Bolivia, International Labor Organisation, Geneva, January 2005 92 Bolivia, Country Report on Human Rights Practices, Bureau of Democracy, Human Rights, and Labor, US Dept of State, 11 March
2008 93 Worker Justice and Basic Rights on Flower Plantations in Colombia and Ecuador, International Labor Rights Forum, 13 February
2007

EU‐Andean Trade SIA
46
Ecuador alone, 55% of female workers also state they have been victims of on the job sexual
harassment.94
In addition, child labour is also a persistent yet not so widespread problem95. In cases where children
manage to be removed from worksites, they in any case usually lack sufficient assistance to resume a
normal lifestyle and end up returning to work. Among Peru’s 14 child labour inspectors all lack
appropriate training, logistical support and supplies, and even often lack a vehicle with which to
reach inspection sites. Given that Peru is not the poorest member of the Andean countries, the
situation in other member countries is not likely to be better. Child prostitution is also a problem,
but specific data is difficult to obtain. The Bolivian government has a Defender of Children and
Adolescents program, with a total of 260 offices in operation in 2007 to try to protect children from
such circumstances.96
2.5.5 Regulatory Quality and Governance
It is important to distinguish between the regulatory policies that a country has and the capacity to
implement these policies. A country’s regulatory framework is embedded in a wider institutional and
governance context and regulatory quality will include both the design and implementation of
regulatory instruments, and the broader aspects of good governance. The World Bank’s Governance
Indicators provide country rankings in terms of government effectiveness (covering competence of
the bureaucracy, quality of policymaking and quality of service delivery and rule of law (including
predictability and effectiveness of judicial system, respect for law and order and enforcement of
contracts).97 Tables 21 and 22 show the values for each indicator for the Andean countries, for 1998,
2003 and 2007.98
Table 21: Government Effectiveness Indicators
1998 2003 2007
Bolivia ‐0.04 ‐0.36 ‐0.83
Colombia ‐0.41 ‐.0.20 +0.01
Ecuador ‐0.49 ‐0.75 ‐1.04
Peru +0.07 ‐0.44 ‐0.44
94 Ibid 95 See, for instance, IREWORC’s (International Research on Working Children) reports on Andean countries
(http://www.childlabour.net/docs/Rural%20Child%20Labour%20in%20Andean%20Countries_summary%20bundle_final.pdf).
96 Bolivia, Country Report on Human Rights Practices, Bureau of Democracy, Human Rights, and Labor, US Dept of State, 11 March
2008 97 Kaufmann et al 2008 98 The scores rank from ‐2.5 to +2.5 with a higher score indicating a higher quality of governance.

Draft Interim Technical Report
47
Table 22: Rule of Law Indicators
1998 2003 2007
Bolivia ‐0.30 ‐0.47 ‐0.96
Colombia ‐0.75 ‐0.92 ‐0.57
Ecuador ‐0.66 ‐0.67 ‐1.04
Peru ‐0.67 ‐0.62 ‐0.71
Table 21 indicates that government effectiveness has declined over time in three of the four Andean
countries. Table 22 suggests that there has been deterioration in the rule of law indicators in each of
the Andean countries over the past decade.
2.5.6 Summary
The review of quantitative evidence and available indicators relating to regulation baseline
conditions suggests variations among the Andean countries in the effectiveness of environmental
regulation and environmental policy outcomes, with some countries achieving results that exceed
that of their income‐group peers while others fail to keep up. Environmental outcomes are strongly
correlated with the quality of overall governance, as measured in terms of government effectiveness
and the rule of law. The lack of improvement in the quality of governance in the Andean countries
over the past decade suggests that all countries will continue to be challenged in ensuring effective
implementation and compliance with environmental regulatory measures.

EU‐Andean Trade SIA
48

Draft Interim Technical Report
49
3. SUSTAINABILITY IMPACT ASSESSMENT
3.1 Economic Modelling
3.1.1 The CGE Model
Application of a multi‐region computable general equilibrium (CGE) model99 has been used to
derive the core economic impacts of the proposed multi‐party trade agreement. The CGE model
incorporates standard Walrasian assumptions: optimising behaviour on the part of economic agents
(consumers, producers and government); utility‐maximising consumers acting subject to a budget
constraint; producers maximising profits by minimising inputs; and primary factor costs for a set
level of technology.
In general, it is further assumed that the regional economy comprises firms producing output
through use of land, labour, capital and natural resources. This output, which itself may have utilised
intermediate products, is purchased by consumers, government, the investment sector, as well as by
other firms. Capital and labour move freely between production sectors. Land, labour and natural
resources are restricted in their movement between regions.
Given their significance to trade‐related studies, taxes are integrated in the model selectively and at
several levels, including applied most‐favoured national tariffs, antidumping duties, countervailing
duties, price undertakings, export quotas and other trade restrictions. Trade barrier estimates for the
services sector are slightly more complicated to arrive at owing to frictional trading costs, to account
for which the model is appropriately augmented. The model provides output on the expected
changes in a number of economic indicators: the percentage change in bilateral export, output,
value added and employment will be estimated for example.
The study undertaken by the economic modelling team examines two potential liberalisation
scenarios:
‘Modest liberalisation’ scenario: 90% reduction of tariffs, 50% liberalisation of services, 1%
reduction of trade transaction costs (‘scenario 1’)
‘Ambitious liberalisation’ scenario: 97% reduction of tariffs, 75% liberalisation of services, 3%
reduction of trade transaction costs (‘scenario 2’)
99 For more information on the model, please refer to the technical annex.

EU‐Andean Trade SIA
50
For each scenario, two sets of results are produced: ‘short run’ and ‘long run’. In the ‘short run’
capital is fixed. In the ‘long run’ investment is allowed to occur resulting in a change in capital
formation. In both cases, the results are projected to 2018.
In the following sections we use the following terms to describe the four sets of model results:
Scenario 1a
Short run modest liberalisation scenario
Scenario 1b
Long run modest liberalisation scenario
Scenario 2a
Short run ambitious liberalisation scenario
Scenario 2b
Long run ambitious liberalisation scenario

Draft Interim Technical Report
51
3.1.2 Macro Level Results
The model results indicate that all four Andean countries gain in terms of an increase in GDP by 2018.
However, as Table 23 shows, the change expressed as a percentage of baseline GDP is small, ranging
from 0.7% in Peru to 2.1% in Bolivia, under the ‘ambitious’ liberalisation scenario and allowing for an
increase in fixed capital formation.
For the EU27 countries, there is no change in GDP resulting from the trade liberalisation scenarios.
Table 23: Change in GDP (%)
Country Scenario 1a Scenario 1b Scenario 2a Scenario 2b
EU 27 0.0 0.0 0.0 0.0
BOLIVIA 0.5 1.0 1.1 2.1
COLOMBIA 0.2 0.6 0.5 1.3
ECUADOR 1.2 1.2 1.8 1.9
PERU 0.2 0.3 0.5 0.7
In absolute terms, the estimated real income effect is biggest for the EU, ranging from € 1000 billion
in the static setting for the comprehensible trade agreement up to € 4 000 million in the dynamic
setting for the very comprehensive trade agreement. Among the Andean countries, the increase in
real income is expected to be biggest for Colombia, the largest economy being studied, and smallest
for Bolivia. Looking at the relative changes in real income, real income effects as percent change in
GDP, the effect for the EU is less than 0.1 percentage of GDP.
Table 24: Real Income Effects, Millions of 2007 Euros
Country Scenario 1a Scenario 1b Scenario 2a Scenario 2b
EU 27 1043 2754 1571 4055
BOLIVIA 100 195 222 406
COLOMBIA 394 1229 1034 2761
ECUADOR 551 541 834 868
PERU 277 436 696 940
As can be seen from the table above, the relative income gain is expected to be biggest for Bolivia
and Ecuador, where real income is expected to increase between 0.5 and 2 percent of GDP.
Wage Effects
Wage effects for unskilled and skilled labour are shown in Table 25 and 26. As can be seen from
Table 25, there are no effects in wages for unskilled workers in the EU under all of the scenarios. For
all Andean countries the effects are very small for the short term. The long term changes in unskilled
wages are also very small with the effects being the highest for Bolivia with a 1.3% increase in

EU‐Andean Trade SIA
52
unskilled workers’ wages under the ambitious long term trade agreement scenario.
Table 26 provides estimates of the adjustment process as the economy moves from the
pre‐liberalisation equilibrium to the new post–liberalisation equilibrium.
Table 25: Effects on European and Andean wages, Unskilled workers, Percent change
Country Scenario 1a Scenario 1b Scenario 2a Scenario 2b
EU 27 0.0 0.0 0.0 0.0
BOLIVIA 0.2 0.6 0.5 1.3
COLOMBIA ‐0.1 0.3 0.1 0.9
ECUADOR ‐0.1 ‐0.2 0.0 0.0
PERU 0.2 0.3 0.5 0.7
Source: ICE Model Simulations.
Changes in wages for skilled workers are even smaller than changes for unskilled workers. Similarly
to unskilled wages, no changes occur in the EU. Changes in wages for skilled workers in the Andean
countries are all around or below 0.5%, indicating a very small change.
Table 26: Effects on European and Andean wages, Skilled workers, Percent change
Country Scenario 1a Scenario 1b Scenario 2a Scenario 2b
EU 27 0.0 0.0 0.0 0.1
BOLIVIA ‐0.2 0.3 ‐0.3 0.6
COLOMBIA ‐0.5 ‐0.1 ‐0.5 0.3
ECUADOR ‐0.3 ‐0.4 ‐0.5 ‐0.5
PERU 0.0 0.2 0.1 0.3
Source: ICE Model Simulations.
Employment Effects
Table 27 provides estimates of the adjustment process as the economy moves from the
pre‐liberalisation equilibrium to the new post–liberalisation equilibrium. The table shows the scale
of labour force shifts (in percentage terms) between sectors during the transition period.100 The
estimates indicate that close to 3% of the employed labour force in Bolivia and Ecuador would be
involved in inter‐sectoral shifts in employment, giving rise to accompanying adjustment costs.
Table 27: Shifts in Total Employment (%)
Country Scenario 1a Scenario 1b Scenario 2a Scenario 2b
Unskilled Skilled Unskilled Skilled Unskilled Skilled Unskilled Skilled
EU27 0.03 0.01 0.03 0.01 0.04 0.02 0.04 0.02
BOLIVIA 1.03 1.45 0.99 1.40 2.11 3.02 2.O5 2.93
COLOMBIA 1.3 0.9 0.9 1.3 2.0 1.8 2.0 1.8
ECUADOR 2.2 1.7 1.7 2.2 2.7 2.9 2.7 2.8
PERU 0.7 0.6 0.6 0.7 1.1 1.2 1.1 1.2
100 The model assumes that the total level of employment remains unchanged.

Draft Interim Technical Report
53
Table 28: Effect on European and Andean Labour displacement for unskilled and skilled workers,
percent
Country Scenario 1a Scenario 1b Scenario 2a Scenario 2b
Unskille
d
Skilled Unskille
d
Skilled Unskille
d
Skilled Unskille
d
Skilled
EU27 0.03 0.01 0.03 0.01 0.04 0.02 0.04 0.02
BOLIVIA 1.03 1.45 0.99 1.40 2.11 3.02 2.O5 2.93
COLOMBIA 1.3 0.9 0.9 1.3 2.0 1.8 2.0 1.8
ECUADOR 2.2 1.7 1.7 2.2 2.7 2.9 2.7 2.8
PERU 0.7 0.6 0.6 0.7 1.1 1.2 1.1 1.2
Source: ICE Model simulations
As can be seen from the above tables, there are limited changes occurring in the EU, with less that
0.5% of the labour force affected. Moreover, the changes in the Andean countries are also very small.
The highest changes occur in Bolivia and are mostly for skilled workers.
National Trade Effects
Tables 29 and 30 below summarise the changes in the EU and Andean countries’ global trade flows.
Table 29: Percent change in Value of National Exports
Country Scenario 1a Scenario 1b Scenario 2a Scenario 2b
EU 27 0.0 0.1 0.1 0.1
BOLIVIA 2.7 3.5 4.9 6.5
COLOMBIA 5.8 6.2 9.0 9.9
ECUADOR 5.8 5.9 7.8 7.9
PERU 3.6 4.0 6.6 7.2
Source: ICE Model Simulations.
Table 30: Percent change in Value of National Imports
Country Scenario 1a Scenario 1b Scenario 2a Scenario 2b
EU 27 0.0 0.1 0.1 0.1
BOLIVIA 3.5 3.7 6.4 6.8
COLOMBIA 6.0 6.3 9.5 10.2
ECUADOR 6.0 6.1 8.3 8.3
PERU 4.8 4.7 8.3 8.3
Source: ICE Model Simulations.
As can be seen from the tables, there are minimal effects on the EU’s global trade flows. On the
other hand, the Andean countries, being small countries, experience changes in both export and
import flows. Colombia’s trade is affected the most, with an approximately 6% increase in both
exports and imports in the short run and around a 9‐10% increase taking place in the long run. All
other Andean countries experience important increases in both export and imports. Smaller changes

EU‐Andean Trade SIA
54
occurring on the short run and under the less comprehensive trade agreement scenarios. The
increase in export and imports is around 7% for Bolivia in the long run, deep trade agreement
scenario, and around 8% for Ecuador. For Peru under the same scenario, imports would increase by
8.3% while exports by 7.2%.
Global Effects
A bilateral trade agreement between EU27 and Andean is expected to have repercussions on other
economies as well, through both trade creation and trade diversion. Table 31 below contains a
summary of the global effects of a potential trade agreement. This is based on the estimations of the
Ambitious scenario. The effects of the other liberalisation scenarios, which are even smaller, are
available in more detail in the appendix.
Table 31: Summary of Global Effects, Static and Dynamic setting for Ambitious Scenario
Region National
Income
Effect
(Millions of
2007 €)
Income
Effect %
Change in
GDP
% Change in
Value of
Exports
National
Income
Effect
(Millions of
2007 €)
Income
Effect %
Change in
GDP
% Change
in Value of
Exports
Mercosur ‐115.7 0.0 ‐0.1 ‐582.2 0.0 ‐0.2
USA ‐269.4 0.0 ‐0.1 ‐756.3 0.0 ‐0.1
Other LDCs 6.4 0.0 0.0 55.0 0.0 0.0
Rest of the
World ‐449.5 0.0 0.0 ‐1972.3 0.0 0.0
Source: ICE Model Simulations. Note: All results are reported for a baseline including expected effects of a successful completion of
the Doha‐round, and a projection of baseline to 2018.
As can be seen from the table, the global effects of even the most ambitious scenario are very small.
The national income effects for Mercosur, USA and the rest of the world are negative, positive for
the LDCs, nevertheless these effects are small for both short and long run. This is also reflected in
the second and fifth column of table 34, showing the percentage change in GDP for the short and
the long run. None of these regions experience a change in their GDP after the implementation of
the trade agreement. There are some very small changes occurring in both exports and imports of
the two regions which are more economically linked to the Andean countries, with a minor drop in
exports occurring under both the short and the long run. These changes are nevertheless close to
zero.

Draft Interim Technical Report
55
3.1.3 Economic Modelling and Sustainability Assessment
Results from the quantitative equilibrium modelling identify the expected magnitude of the increase
or decrease in production in each economic sector. In turn, this forms the starting point for the
economic, environmental and social assessment of EU‐Andean trade liberalisation.
In this Draft Interim Technical Report, the sustainability assessment is undertaken at the sectoral
level and covers agricultural and processed agricultural goods, industrial products, services and
other trade issues (investment, public procurement and trade facilitation).
Following the stakeholder consultations and the further work of the local teams, detailed economic,
social and environmental assessment will be carried out at the subsector level for the sectors
selected for deeper analysis.
For ease of presentation, the long‐run ambitious scenario (2b) has
been selected for inclusion in the sectoral economic modelling
data tables. A full dataset covering all scenarios is contained in the
technical annex to this report. An ambitious liberalisation scenario
is also assumed in the social and environmental assessment.
However, where appropriate, a distinction is made between short
term adjustment effects and long term equilibrium outcomes.

EU‐Andean Trade SIA
56
3.2 Agricultural and Processed Agricultural Goods
3.2.1 Economic Impacts
Real output
Table 32(a) shows the estimated changes in output for grains, vegetables, fruit and nuts, other
primary foods and other agriculture, for scenario 2b, (which assumes 97% reduction of tariffs in all
sectors, including sensitive sectors such as bananas and sugar).101
Table 32 (a) : Agriculture goods: Sectoral Changes (%)
(share in total value added brackets)
EU27 Bolivia Colombia Ecuador Peru
Grains 0.198 (0.2) 1.244 (2.7) ‐4.449 (0.8) ‐2.581 (1.4) 0.181 (1.8)
Vegetables,
fruit and nuts
‐1.481 (0.5) 0.756 (5.4) 11.245 (2.9) 8.722 (6.7) 0.662 (2.1)
Other primary
foods
0.104 (0.9) 0.491 (8.5) ‐1.467 (3.9) ‐1.899 (2.8) 0.486 (2.8)
Other
agriculture
0.236 (0.6) ‐0.498 (1.2) ‐5.086 (1.8) ‐9.764 (2.5) 0.257 (3.0)
Totals ‐1.178 (2.2) 1.993 (17.8) 0.243 (9.4) ‐5.522 (13.4) 1.586 (9.7)
Table 32(b) : Primary products and processed agricultural goods: Sectoral Changes (%)
(share in total value added in brackets)
EU 27 Bolivia Colombia Ecuador Peru
Forestry 0.012 (0.2) 0.574 (1.3) ‐0.994 (0.3) ‐0.619 ( 1.9) 0.019 (0.7)
Primary
fishing
0.002 (0.2) 0.162 (0.6) ‐0.045 (0.8) ‐0.065 (3.4) 0.089 (2.7)
Primary
mining
‐0.022 (0.7) 0.262 (10.7) 0.419 (5.9) 0.195 (16.0) 0.452 (3.9)
Processed
foods,
beverages and
tobacco
0.066 (2.9) 1.025 (2.9) ‐0.836 (3.4) ‐1.834 (4.2) 0.567 (7.4)
Totals 0.058 (4) 2.023 (15.5) ‐1.456 (10.4) ‐2.323 (25.5) 1.127 (14.7)
101 ie long run ambitious scenario. The results for the other three scenarios give similar changes although the magnitude of the
changes is smaller, reflecting the lower level of liberalisation and fixed stock of capital. For a complete list of products included in
each subsector, refer to annex 2.

Draft Interim Technical Report
57
While there is some heterogeneity on the effects of the different scenarios on sectoral output in the
Andean countries, for the EU27 the liberalisation of trade with the Andean countries has a negligible
impact on primary products and processed foods sub‐sectors. There are only very small changes in
the agriculture and agricultural processed goods sector and a small decline in vegetables, fruit and
nuts subsector, but this subsector accounts for less than half a percentage of total output in 2018.
For the EU 27 countries the total decline in agricultural goods resulting from scenario 2b is 1.12%.
Andean countries experience more pronounced changes in the output of some of the sectors. Table
32(a) shows a significant decline in agriculture products in Ecuador and small increases in the other
three Andean countries. The vegetables, fruit and nuts subsector is predicted to increase its output
significantly in Colombia (11.2%) and Ecuador (8.7%). In both countries, this subsector accounts for a
significant share of total national value added. This is almost entirely due to banana production102.
At present the EU market is heavily protected with applied tariffs. Hence, the large reduction in
tariffs that is assumed in the ‘ambitious’ scenario results in a large increase of banana exports to
Europe from Colombia and Ecuador.
Both Bolivia and Peru experience small increases across all sectors, with the exception of a half
percent decrease in Bolivia in output of ‘other agriculture’, which includes cotton and wool. Both
countries have overall net increases in agriculture output, particularly Bolivia.
Table 32(b) shows the changes in primary sectors (forestry, fishing and mining) and processed foods,
beverages and tobacco.103 The EU 27 countries show a marginal decline in mining. The importance
of the mining sector, particularly in Bolivia and Ecuador, results in a significant expansion in this
sector under scenario 2b, in table 32(b). The growth in mining output is linked to the growth in
capital stock through investment that is assumed to occur under scenario 2b. However, this growth
assumes that the political conditions and negotiations with local population regarding mining
expansion in the rural area are favourable to further large‐scale mining development. The processed
foods, beverages and tobacco subsectors account for between 7.2% (Colombia) and 10.2% (Peru) of
total national output in the Andean countries. In two of the four countries, liberalisation scenario 2b
is predicted to result in an increase in production and exports.
103 The figures are for scenario 2b and assume 97% liberalisation.

EU‐Andean Trade SIA
58
3.2.2 Social Impacts
Poverty and Inequality
As discussed in section 2, the baseline conditions for poverty (and inequality) in the Andean
countries are below the levels prevailing in most other Latin American countries. Poverty is more
pronounced in the rural sector, although there are considerable intra‐rural differences in poverty
levels, depending on the income–generating opportunities open to households in formal and
informal employment.
Given that agriculture and extractive industries (mining and hydrocarbons) are in many cases
competing activities in the rural area, the growth in output from the mining sector can be expected
to have differential social impacts on different segments of the sector. In the large‐scale formal
mining sector, employment is expected to increase, however, the restrictions on workers’ rights will
restrain any significant increase in real wages or improvement in working conditions. As pointed out
in the preceding discussion of baseline labour conditions, a number of adult labour rights issues
affect individual countries.
Additional negative social impacts of further expansion of mining and hydrocarbons in rural
territories of the four Andean countries might arise from the local and national conflicts that have
emerged in the last five years. Although governments have been keen to set policies and promote
institutional change aiming to attract new FDI in the extractive industries, in many cases the local
population’s reaction has opposed such an expansion. Factors that explain tensions and conflicts are
related to competition over the resources involved (land and water), the negative effects of mineral
development (enclave economies, social problems, environmental damage) and the increased
awareness of desirable alternative strategies of development in rural – in particular indigenous –
territories.104 Given that European companies are involved in the mining and hydrocarbons sectors
in Andean countries and in initiatives for promoting social corporate responsibility,105 attention
needs to be paid to the fragile political conditions in which a mineral‐based growth strategy
develops.
The expansion of output in the banana sector in Colombia and Ecuador might have a positive impact
on household income through the increase in employment. However, long term growth in poor
household incomes and reduction in poverty will be dependent upon significant local reinvestment
on the part of the large foreign companies that dominate the agro‐export industries.106 In Ecuador,
104 Bebbington and others (2008). 105 For example the ICMM’s resource endowment initiative and DFID’s transparency initiative. 106 In past years, agro‐export firms have benefited from pro‐export subsidy policies and exchange‐rate differentials without any
clear impact on local economies (see the regional reports of the Red EU‐CAN).

Draft Interim Technical Report
59
for instance, the banana sector has represented an average of 16% of agriculture GDP between 2000
and 2008, and generated approximately 383,000 jobs (in direct and indirect employment), which
would have benefited nearly 12% of the country population.107 However, in the last 15 years, in
most of the provinces where the banana sector is concentrated (El Oro, Guayas y Los Ríos)
improvements on income, poverty reduction and inequality have not happened.108
The increase in processed foods is also likely to have a positive social impact through the increased
employment that it generates for previously unemployed labour from lower‐income households.
However, whilst the increase will benefit agriculture commodities such as Andean grains (quinoa,
amaranth, bean), flowers, fruits, cacao and potentially biofuels feedstock, it may impact negatively
on products such as sugar cane, potato and dairy (both milk and its derivatives).109 Given that the
promotion of the later products are an important component of the countries’ programmes of
poverty reduction,110 increased competition of food imports of European origin may produce
counter‐productive effects.111
Health and Education
Improved economic performance, particularly in agricultural and mining exports, should in principle
strengthen public finances and enable higher public expenditure on health and education. However,
pro‐poor fiscal policies have traditionally been given a low priority in the Andean countries and
where social expenditure and social protection programmes have been adopted; implementation
and targeting have been weak.112 These programmes show a large impact on the poverty gap, but
little impact on the poverty headcount. They also show a significant rise in school enrolments and
attendance of boys and girls among beneficiary households (but impact on child labour are less clear
cut), and large improvements in primary health care utilization.113 For instance, in Peru a 2004
report by the Controloria General de la Nacion (CGN) noted that only about half of resources
allocated under the Vaso de Leche (Glass of Milk programme) actually reached the targeted
population of young children and expecting and nursing mothers.114 It is not expected, therefore,
107Servicio de infomación agropecuaria del Ministerio de Agricultura y Ganadería del Ecuador. Banano Informe 2.
(http://www.sica.gov.ec/cadenas/banano/docs/informe2.html). 108 See Larrea and others (2008).
109 See Inurritegui and others (2008).
110 Long standing work of the ministries of agriculture and the NGO sector (many with European support) in Ecuador, Peru and
Bolivia has focused on technological improvement of those crops as part of a food security strategy as well as a way of improving
entry opportunities for the rural into regional and national markets.
111 Mendoza, 2008
(http://www.cop‐la.net/files/CIES‐COPLA‐ingles.pdf?q=en/system/files/var/www/copla/files/CIES‐COPLA‐ingles.pdf)
112 Barrientos and Hinojosa, 2009.
113 Barrientos and Santibañez, forthcoming.
114 IMF, 2007

EU‐Andean Trade SIA
60
that EU‐Andean trade liberalisation will have a significant impact on the existing levels of health and
education provision in the Andean countries.
There may be more specific health impacts associated with the expansion in agricultural and mining
activities. In agricultural areas, injudicious pesticide use contributes to high levels of premature
births, congenital malformations and miscarriages.115 The mining sector is a key source of water
pollution – acid water with high metal content ‐‐ which gives rise to health problems for local
communities. In Bolivia, for example, cooperative and small scale mining, in which more than 70,000
families work, is particularly polluting.116 In western Bolivia, the severe contamination of the
Pilcomayo River as well as the Poopo and Uru Uru lakes are examples where mining activities have
resulted in significant health problems.117
3.2.3 Environmental Impacts
Natural Resource Stocks and Environmental Quality
The predicted growth in the agriculture and processed products sector is expected to place
additional pressure on both land and water. Water pollution is a serious problem in each of the
Andean countries. Key sources of pollution are discharges from mining activities and agricultural
runoffs. One of the most obvious examples is the Pilcomayo river basin in Bolivia, where it has been
estimated that the contamination of this river, mainly caused by mining, creates annual losses of
millions of dollars to agriculture, cattle‐breeding and fishery.118 Due to uncontrolled use of
pesticides agricultural run‐offs often include organochlorinated compounds.
In the processed agricultural products subsector, few industries comply with industrial discharge
standards. In Santa Cruz, Bolivia, for example, out of the 600 largest industries which include sugar
refineries, tanneries and production of vegetable oil, only a few pre‐treat their wastes.119
Deforestation is an additional potential area of environmental pressure. Increased market access for
processed timber products can be expected to add to existing deforestation trends. Regulation of
illegal logging is weak. In Ecuador, it is estimated that forest loss is faster than anywhere else in
South America. Half the country’s forests have been degraded or destroyed in the past three
decades.
115 Worker Justice and Basic Rights on Flower Plantations in Colombia and Ecuador, International Labor Rights Forum, 13 February
2007 116 World Bank, 2006 117 World Bank, 2006 118 European Commission, 2005 119 Sludge and Jarden, 2007

Draft Interim Technical Report
61
Illegal logging is a significant contributor to this problem. Ecuador’s Wood Industry Association
estimates that 70 percent of all timber sold in the country is illegally harvested. Bolivia has about 10
percent of South America’s tropical forests. This asset is being rapidly reduced due to widespread
deforestation. Causes of the deforestation include the advance of the agriculture frontier, legal and
illegal logging, and expansion of large scale agro‐industry, including production of soya beans for
export and cattle ranging. Deforestation is particularly acute in Peru and is exacerbated by illegal
logging and subsistence agricultural practices. Peru’s national government has established a number
of protected forest areas, but these are threatened by weak regulation and illegal activity.120 Lack of
opportunities for alternative profitable agriculture for indigenous population whose livelihoods
depend on protected forest areas induce them to practicing illegal logging in conjunction with
outside loggers which, in addition to environmental effects, also weakens community organisations
and their ability to develop alternative activities.121
Biodiversity
The Andean region is considered one of the most ecologically diverse areas in the world and
contains more perhaps 20 percent of the world’s biodiversity. The adoption by the Community of the
‘Regional Biodiversity Strategy’ has provided a framework for joint and coordinated action to achieve
the goals of the Strategy.122
The expansion of production and trade in agricultural and agricultural processed products that
results from the proposed EU‐Andean trade agreement will have potentially adverse biodiversity
impacts. In particular, any additional pressure on the rate of deforestation represents an immediate
threat to biodiversity. Similarly, the conversion of pristine habitats and natural resources to
agricultural production and mining would also have significant negative implications for biodiversity.
If the expansion of commercial agriculture involves use of GMO and intensified use of scarce natural
resources (land and water), the impact of the EU‐Andean trade agreement is predicted to be
potentially negative for the rich biodiversity of Andean country members.123 Biodiversity is also
threatened by rapid changes in land use,124 which modifies not only land use but also water
120 OUSTR, 2005 121 See, for instance, P. Oliart’s presentation on the Amaraekeri reserve in Madre de Dios (Peru) at
www.manchester.ac.uk/sed/research/seminars 122 Andean Community, 2005 123 Inurritegui and others (2008, pp. 50). 124 Office of the U.S. trade representative (2005).

EU‐Andean Trade SIA
62
allocation, which in turn has territorial implications.125 A potential negative impact on biodiversity is
not only important because of ecological considerations but also for the impact on vulnerable
groups – often small farmers and indigenous groups whose food security and livelihoods depends on
a diversified crop portfolio. However, as it has also been suggested, a trade agreement that
facilitates the development of market niches for non‐traditional agriculture126 – together with
accompanying measures to help small farmers to enter into selective European markets (of organic
food, fair trade and the like) can produce positive impact on both biodiversity conservation and
improvement of rural population’s livelihoods.
125 In many areas of the Peruvian and Ecuadorian Andes, competition for natural resources oppose intensive to extensive
agriculture, as well as it does between mining and agriculture. The same can be said with regards to hydrocarbons and
gathering/hunting activities in the rainforests of Peru, Ecuador and Bolivia. 126 Inurritegui and others (2008), Camacho and others (2008).

Draft Interim Technical Report
63
3.3 Industrial Products
3.3.1 Economic Impacts
Real Output
The industrial sector accounts for about one third of GDP in the Andean countries. The share of total
employment ranges from 18% in Bolivia and Colombia to 24% in Peru. Industrial growth has been
rapid in recent years in all four countries (table 33).
Table 33: Industrial Sector in Andean countries
Bolivia Colombia Ecuador Peru
Industrial Sector
as % of GDP (2007)
31.5
29.3
34.9
35.2
Industrial
Employment as % of
Total Employment
(2007)
18.8
18.8
21.2
23.8
Industrial Sector
Growth (%)
3.3
4.3
4.0
4.2
Source: World Bank, 2009
Similarly to the results in agriculture, there are no major changes occurring in the sectoral output in
the EU. For most of the sectors output remains unchanged under the different scenarios.
For Bolivia the most pronounced change occurs in ‘machinery and equipment’. Although the change
is 31%, the sector’s total value‐added is only about 0.4%. Thus the 30% increase in the output in this
sector will only have a small effect. The textiles sector also experiences a rather high increase in
output, however, similarly to machinery and equipment, this sector is relatively minor, contributing
to total value added of only 0.2%.
In the case of Colombia, similarly to Bolivia, there are some sectors with important changes under all
the scenarios. In the case of Bolivia, these sectors are very small representing only a small fraction of
total value added. This is the case, for example of the sectoral output changes in the ‘motor vehicles
and parts’ in Colombia. The sector’s output increases by 25% under the most comprehensive
scenario, however, the sector’s share in total value added is smaller than 0.5%.
For Ecuador, important changes in sectoral output occur only in sectors which are small and
therefore these effects are only marginal.

EU‐Andean Trade SIA
64
There are no significant sectoral changes taking place in the manufacturing sectors in the Peruvian
economy. The output of ‘other machinery and equipment’ sector contracts by 4‐6% depending on
the scenario while metal production expands by about 3‐5%.
Table 34: Manufactured goods: Sectoral changes in output
(per cent), (share of value added in brackets)
Sectors EU 27 Bolivia Colombia Ecuador Peru
Textiles
‐0.0236
(0.5)
20.7646
(0.2)
7.1795
(0.4)
‐1.1642
(0.9)
3.2865
(2.6)
Wearing apparel
‐0.0616
(.5)
4.0994
(0.7)
2.0969
(0.7)
‐0.6445
(0.9)
3.4165
(1.4)
Leather products
‐0.0614
(0.2)
7.6686
(0.4)
‐1.975
(0.1)
1.0356
(0.3)
0.1128
(0.8)
Wood products
0.0248
(0.6)
1.267
(0.9)
‐5.7884
(0.1)
‐0.3782
(0.6)
‐0.5102
(1.9)
Paper products,
publishing
0.0658
(1.6)
‐0.3188
(0.5)
0.3412
(1.1)
‐0.3969
(0.6)
‐3.9977
(1.9)
Petroleum, coal
products
0.0495
(0.1)
1.9132
(0.4)
0.3107
(0.5)
1.0395
(1.1)
0.3998
(0.1)
Chemical, rubber,
plastic prods
‐0.0365
(2.6)
‐5.2163
(0.5)
8.1577
(2.8)
0.9876
(0.8)
5.4777
(4.5)
Mineral products
nec
0.0226
(0.9)
2.321
(1.2)
2.2029
(0.9)
‐1.5245
(0.6)
0.0292
(1.3)
Ferrous metals
‐0.0405
(0.5)
5.3528
(0.0)
5.9641
(0.8)
‐1.0257
(0.0)
0.4116
(0.0)
Metals nec
‐0.2066
(0.3)
6.9868
(0.0)
6.0387
(0.5)
3.4408
(0.0)
5.3078
(2.2)
Metal products
0.0123
(1.6)
3.0643
(0.1)
0.8076
(0.4)
‐1.3064
(0.2)
‐0.8471
(0.9)
Motor vehicles
and parts
0.0161
(1.7)
0.9965
(0.0)
24.5056
(0.4)
‐24.0723
(0.1)
‐1.2096
(1.1)
Transport
equipment nec
‐0.0792
(0.5)
6.8707
(0.1)
6.3844
(0.2)
‐0.6967
(0.1)
‐0.4346
(0.5)
Electronic
equipment
‐0.0509
(0.8)
0.5865
(0.0)
6.1907
(0.1)
2.2619
(0.1)
‐0.4993
(0.7)
Machinery and
equipment nec
0.0346
(3.6)
31.1406
(0.4)
‐1.4746
(0.8)
‐4.2777
(0.3)
‐5.5556
(2.4)
Manufactures nec
0.0753
(0.8)
3.9209
(0.7)
‐2.6214
(0.5)
‐3.2143
(0.6)
‐1.1497
(3.0)

Draft Interim Technical Report
65
Employment
Table 35 shows the percentage changes in employment (skilled and unskilled) for the comprehensive
long run scenario (scenario 2b). The employment changes mirror the changes in output shown in
table 34. In Bolivia, employment increases in most manufacturing sectors, particularly in textiles and
other manufactures, although these sectors are small in terms of share of national value added.
Chemicals and rubber products show a decline in employment. Colombia shows a significant
increase in motor vehicles and parts. In Ecuador, motor vehicles and parts record a decline of more
that 20 percent. In Peru, there are small increases in employment in textiles, chemicals and other
metal products.
Table 35: Skilled labour employment effect per sector, % change
Skilled labour
Sectors EU 27 Bolivia Colombia Ecuador Peru
Textiles ‐0.0385 18.5189 6.23 ‐0.8356 3.1489
Wearing apparel ‐0.0739 3.7462 1.8487 ‐0.376 2.8049
Leather products ‐0.0736 6.9322 ‐1.7128 1.1283 0.2772
Wood products 0.003 1.1884 ‐5.4199 ‐0.1338 ‐0.2819
Paper products,
publishing 0.0417 ‐0.3491 ‐0.1638 ‐0.1493 ‐3.5351
Petroleum, coal
products 0.0207 1.123 ‐0.2969 0.8459 0.3283
Chemical, rubber,
plastic prods ‐0.0504 ‐4.6262 6.1878 1.004 4.8484
Mineral products
nec 0.0025 2.0474 1.4169 ‐1.1628 0.1328
Ferrous metals ‐0.0539 4.4723 4.992 ‐0.6854 0.4873
Metals nec ‐0.2046 5.8253 5.0509 3.3509 4.7378
Metal products ‐0.0051 2.2008 0.5279 ‐0.9312 ‐0.6098
Motor vehicles
and parts ‐0.0003 0.4955 21.3241 ‐22.1366 ‐0.9341
Transport
equipment nec ‐0.0888 5.3501 5.3757 ‐0.37 ‐0.183
Electronic
equipment ‐0.0629 0.124 5.729 2.1142 ‐0.3389
Machinery and
equipment nec 0.0171 24.6098 ‐1.6236 ‐3.6437 ‐4.8834
Manufactures nec 0.05 3.8013 ‐2.3907 ‐2.6632 ‐0.8929
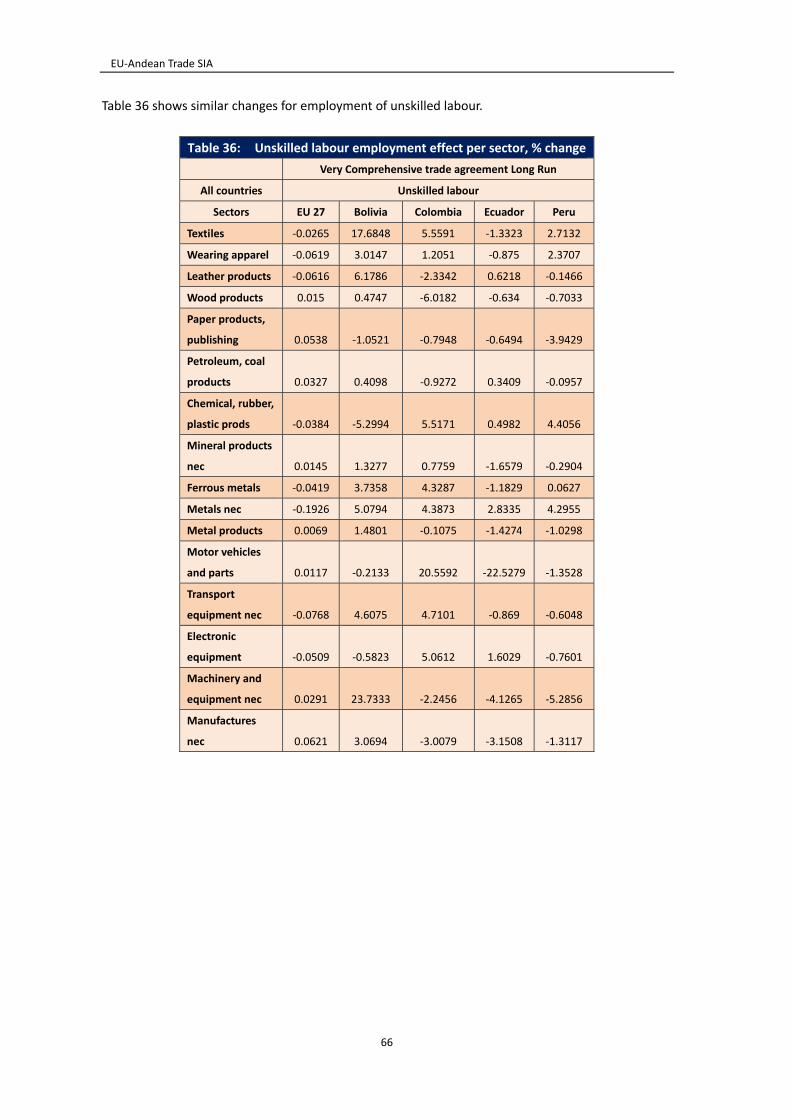
EU‐Andean Trade SIA
66
Table 36 shows similar changes for employment of unskilled labour.
Table 36: Unskilled labour employment effect per sector, % change
Very Comprehensive trade agreement Long Run
All countries Unskilled labour
Sectors EU 27 Bolivia Colombia Ecuador Peru
Textiles ‐0.0265 17.6848 5.5591 ‐1.3323 2.7132
Wearing apparel ‐0.0619 3.0147 1.2051 ‐0.875 2.3707
Leather products ‐0.0616 6.1786 ‐2.3342 0.6218 ‐0.1466
Wood products 0.015 0.4747 ‐6.0182 ‐0.634 ‐0.7033
Paper products,
publishing 0.0538 ‐1.0521 ‐0.7948 ‐0.6494 ‐3.9429
Petroleum, coal
products 0.0327 0.4098 ‐0.9272 0.3409 ‐0.0957
Chemical, rubber,
plastic prods ‐0.0384 ‐5.2994 5.5171 0.4982 4.4056
Mineral products
nec 0.0145 1.3277 0.7759 ‐1.6579 ‐0.2904
Ferrous metals ‐0.0419 3.7358 4.3287 ‐1.1829 0.0627
Metals nec ‐0.1926 5.0794 4.3873 2.8335 4.2955
Metal products 0.0069 1.4801 ‐0.1075 ‐1.4274 ‐1.0298
Motor vehicles
and parts 0.0117 ‐0.2133 20.5592 ‐22.5279 ‐1.3528
Transport
equipment nec ‐0.0768 4.6075 4.7101 ‐0.869 ‐0.6048
Electronic
equipment ‐0.0509 ‐0.5823 5.0612 1.6029 ‐0.7601
Machinery and
equipment nec 0.0291 23.7333 ‐2.2456 ‐4.1265 ‐5.2856
Manufactures
nec 0.0621 3.0694 ‐3.0079 ‐3.1508 ‐1.3117

Draft Interim Technical Report
67
3.3.2 Social Impacts
Poverty and Inequality
The CGE model results are not well suited for social impact assessment due to their lack of
disaggregated information at the household level. However, the model does give estimates of the
equilibrium effects on skilled and unskilled labour wages in each of the Andean countries. The
estimates for scenario 2b are shown in Table 37.
Table 37: Change in Wages (%)
Unskilled Skilled
Bolivia 1.3 0.6
Colombia 0.9 0.3
Ecuador 0.0 0.5
Peru 0.7 0.3
The figures in table 37 indicate that unskilled wages are predicted to increase more rapidly than
skilled wages, which suggests a positive impact on lower income households and on intra‐sectoral
inequality.127 The longer term impact on poverty by increased of output and employment in the
manufacturing sector may be more positive as trade liberalisation raises investment and the longer
term growth trajectory, allowing for improvements in poor household income. However, economic
growth does not guarantee poverty reduction, and a pro‐poor growth outcome is dependent on the
quality and focus of public policy and governance. Positive effects on the textiles and leather sectors
of Bolivia, Colombia and Peru may help to reduce urban poverty because of the extensive presence
of SME. It can also be expected that higher output of Colombia’s textiles and motor vehicles sectors
will produce positive chain effects on other manufacturing sectors composed mainly by SME and,
therefore, reduce vulnerability of urban workers. By the same token, output reduction in Peru’s
machinery and equipment sector, and Ecuador’s automotive sector would increase urban
unemployment and rise the risks of increasing poverty.
Health and Education
Cross country evidence indicates that trade liberalisation is typically associated with a marked
decline in trade tax revenue.128 The lowering of tariffs on imported manufactures from the EU
would be expected to reduce import revenues, unless mitigated by an offsetting increase in other
taxes. A reduction in social expenditure could then occur.
127 These estimates are derived from the assumption that overall employment remains constant. If we allow for the lengthy
adjustment period (until 2018) and the number of workers who will be required to shift between industrial sectors (shown in table
23), it is likely that significant income losses will be incurred during the adjustment period, as workers are forced to join the pool of
unemployed. Many urban households are already close to the poverty level and a lengthy period of unemployment will push the
affected households closer to or below the poverty level. 128 IMF 2005
EU‐Andean Trade SIA
68
Untreated water discharge will increase in those industries that are expected to expand their
production following trade liberalisation. The textiles sector is a heavy polluter of water, if regulation
is weak, and is likely to have a significant negative impact in Bolivia. In Peru, significant increases are
predicted for chemicals, rubber and plastics and metals, again traditionally heavy polluting industries.
Air pollution from industry (particularly metal foundries, brick production and oil refineries) can also
be expected to increase as a result of industrial sector growth. Any increase in air and water
pollution will impact negatively on health standards, particularly in urban areas.
There may be offsetting positive impacts in so far as air and water pollution will fall in those
industries that are expected to reduce their output levels as a result of EU‐Andean trade
liberalisation.
3.3.3 Environmental Impacts
Environmental Quality
Production levels are expected to increase in some industries and decline in others (Table 25). In the
absence of detailed sub‐sector studies, it is difficult to assess the overall environmental impact of
the changes in the industrial sector that follow from EU‐Andean trade liberalisation. The principal
environmental effects will occur through any consequential changes in water and air pollution, both
of which are already at already at high levels in the Andean countries.
In the longer term, improved access to environmental goods and services as a result of the trade
negotiations for goods and services, is expected to contribute to improvements in pollution control.
But the potential gains to be made in this area will be conditional on accompanying improvements in
the enforcement and compliance with environmental regulation and controls.
Natural Resources
Any expansion in natural resource based industries will increase demand for raw materials and
highlights the need for effective regulation and management to ensure the long term sustainability
of natural resource stocks.
Biodiversity
The impact of industrial sector changes in output on biodiversity will be transmitted through the
pressure on natural resources. Any expansion of wood and paper products can be expected to
impact on biodiversity, if increased demand for timber is supplied from non‐sustainable sources.

Draft Interim Technical Report
69
3.4 Services
3.4.1 Economic Impacts
The performance of the services sector is an important contributor to economic growth. The
availability of efficient financial services, for example, has been shown to be a key input to economic
advancement. Infrastructural services are also an essential factor for rapid economic growth.
Environmental services are increasingly important in managing environmental outcomes of
economic growth. Similarly, the competitiveness of firms in open economies is determined in part by
access to low‐cost and high‐quality telecommunications, transport and distribution services, and
financial intermediation.
The lowering of barriers to trade in services can contribute significant static efficiency gains in terms
of allowing foreign suppliers to provide lower cost services to the domestic market. Increased
openness to international trade in services also offers large potential benefits through dynamic
effects on overall economic performance. Services liberalisation can also deliver significant gains in
terms of sustainable development and poverty reduction, by raising investment in basic
infrastructure and improving the quality of the services delivered.129
The EU has adopted a GATS approach to services liberalisation in its regional and bilateral trade
negotiations.130 In principle, GATS covers all commercial tradable services, with the exception of
some aspects of air transport such as traffic rights, and services supplied under government
authority. The WTO Secretariat has drawn up a list of twelve groups of service sectors, which is used
in the negotiation of commitments by most WTO member countries.131 These are:
• business (including professional and computer) services
• communication services
• construction and related engineering services
• distribution services
• educational services
• environmental services
• financial (insurance and banking) services
• health‐related and social services
• tourism and travel‐related services
• recreational, cultural and sporting services
• transport services
• other services not included elsewhere
129 Adlung 2007 130 As opposed to a NAFTA approach which is based on a negative list scheduling modality. 131 WTO (1999)

EU‐Andean Trade SIA
70
The CGE model used in this study uses a similar but not identical categorisation of service
sub‐sectors and provides estimates of the impact of the different scenarios, for the following
sub‐sectors:
- Utilities
- Construction
- Distribution
- Other Transport
- Maritime
- Air transport
- Communications
- Financial services
- Insurance
- Business services
- Recreational and other services
- Public service and dwellings
CGE modelling of services liberalisation faces a number of challenges. Many of the barriers to trade
in services are hard to quantify and this increases the unreliability of the resulting estimates of the
effects of trade liberalisation. Also, the debates about liberalisation in services concentrate on rule
changes, such as the removal of particular regulations, rather than the lowering of trade barriers by
a given percentage. A further complication is that the impacts of a particular measure extends
beyond the trade effects and can have significant impacts on domestic policy and national
autonomy.
Modelling studies are not well suited to take into account the highly differentiated nature of services
and the linkages to domestic regulatory policy. The nature of liberalisation in services is
fundamentally different to liberalisation in goods. In the latter case, the discussion centres on
changes in the level of effective trade barriers expressed in quantitative terms. In the case of services,
liberalisation is mainly about qualitative measures, such as regulation changes, which have to be
converted to quantitative equivalents in order to be modelled. Second, most services are consumed
at the point of production, which means that trade in services is closely linked to movement of
capital and labour.132
The modelling study estimates NTBs for services trade as part of the experiment baseline definition.
The basic methodology for estimation of services barriers involves the estimation of a bilateral
gravity equation for services trade, where country importer fixed effects terms are used (once
controlled for GDP, income etc) to estimate potential trade cost reductions linked to services NTBs.
132 Stiglitz and Charlton (2006)
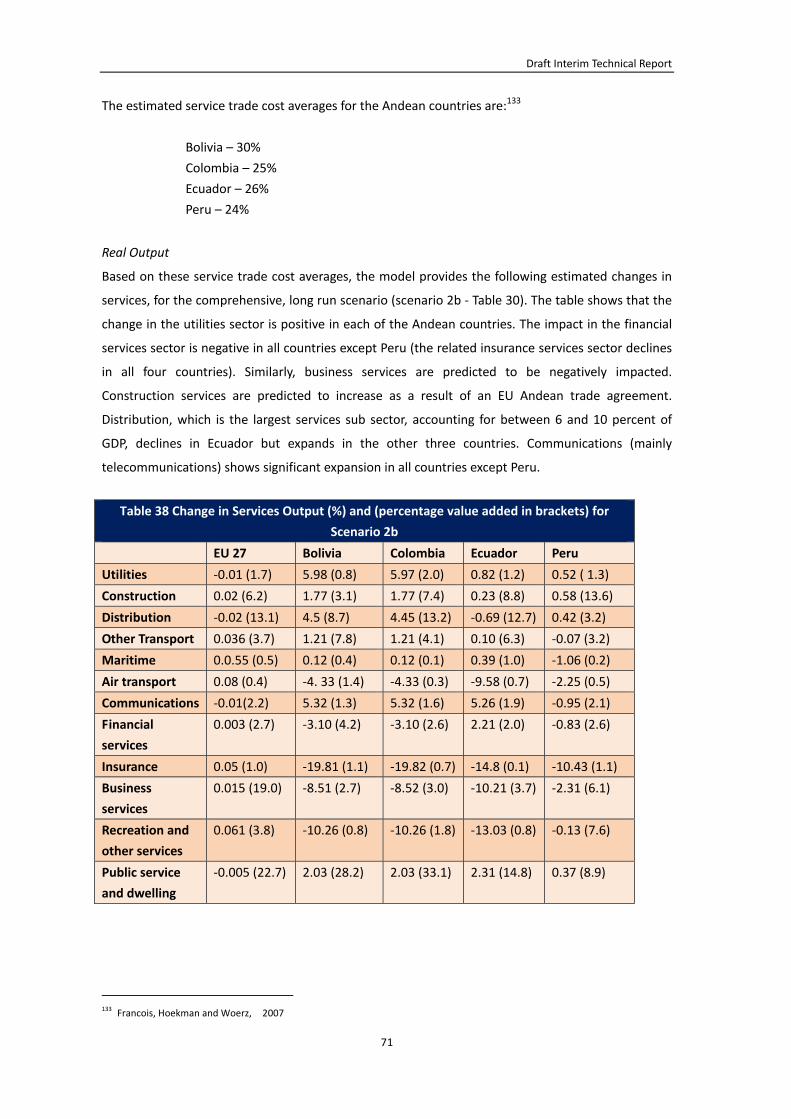
Draft Interim Technical Report
71
The estimated service trade cost averages for the Andean countries are:133
Bolivia – 30%
Colombia – 25%
Ecuador – 26%
Peru – 24%
Real Output
Based on these service trade cost averages, the model provides the following estimated changes in
services, for the comprehensive, long run scenario (scenario 2b ‐ Table 30). The table shows that the
change in the utilities sector is positive in each of the Andean countries. The impact in the financial
services sector is negative in all countries except Peru (the related insurance services sector declines
in all four countries). Similarly, business services are predicted to be negatively impacted.
Construction services are predicted to increase as a result of an EU Andean trade agreement.
Distribution, which is the largest services sub sector, accounting for between 6 and 10 percent of
GDP, declines in Ecuador but expands in the other three countries. Communications (mainly
telecommunications) shows significant expansion in all countries except Peru.
Table 38 Change in Services Output (%) and (percentage value added in brackets) for
Scenario 2b
EU 27 Bolivia Colombia Ecuador Peru
Utilities ‐0.01 (1.7) 5.98 (0.8) 5.97 (2.0) 0.82 (1.2) 0.52 ( 1.3)
Construction 0.02 (6.2) 1.77 (3.1) 1.77 (7.4) 0.23 (8.8) 0.58 (13.6)
Distribution ‐0.02 (13.1) 4.5 (8.7) 4.45 (13.2) ‐0.69 (12.7) 0.42 (3.2)
Other Transport 0.036 (3.7) 1.21 (7.8) 1.21 (4.1) 0.10 (6.3) ‐0.07 (3.2)
Maritime 0.0.55 (0.5) 0.12 (0.4) 0.12 (0.1) 0.39 (1.0) ‐1.06 (0.2)
Air transport 0.08 (0.4) ‐4. 33 (1.4) ‐4.33 (0.3) ‐9.58 (0.7) ‐2.25 (0.5)
Communications ‐0.01(2.2) 5.32 (1.3) 5.32 (1.6) 5.26 (1.9) ‐0.95 (2.1)
Financial
services
0.003 (2.7) ‐3.10 (4.2) ‐3.10 (2.6) 2.21 (2.0) ‐0.83 (2.6)
Insurance 0.05 (1.0) ‐19.81 (1.1) ‐19.82 (0.7) ‐14.8 (0.1) ‐10.43 (1.1)
Business
services
0.015 (19.0) ‐8.51 (2.7) ‐8.52 (3.0) ‐10.21 (3.7) ‐2.31 (6.1)
Recreation and
other services
0.061 (3.8) ‐10.26 (0.8) ‐10.26 (1.8) ‐13.03 (0.8) ‐0.13 (7.6)
Public service
and dwelling
‐0.005 (22.7) 2.03 (28.2) 2.03 (33.1) 2.31 (14.8) 0.37 (8.9)
133 Francois, Hoekman and Woerz, 2007
EU‐Andean Trade SIA
72
Similarly to results in the other sectors, there are no important changes occurring in the services
sectors’ output in the EU.
In Bolivia, a number of the services sectors experience a drop in their output which is mainly due to
increased competition from EU service providers.
For Colombia, changes in the output of services sector is very limited with the exception of business
services and recreation services. Output in both of these sectors drop by 4‐9% depending on the
scenarios which is due to increased competition from EU service providers. However, both of these
sectors are relatively small in Colombia, business services represent about 3% of value added and
recreation services about 2%.
In Ecuador, the changes in the output of services sector is very limited with the exception of business
services, insurance, and recreation services. Output in all three of these sectors drop, the biggest
decrease occurring in insurance services, in which sector output drops by 15% under the long run
scenarios. Nevertheless, both the insurance and recreation service sectors are small in Ecuador, with
less than 1% of total value added. Only the business services sector is a bigger sector with about 4%
of total value added in total value added of Ecuador. These decreases in the sectoral output are due
to the increasing competition resulting from reduction in barriers in the service sectors.
Finally, there are no significant output changes taking place in Peru after the different trade
agreement scenarios. The only high change occurs in the insurance sector, which represents 1.1% of
value added.
Fixed capital formation
Liberalisation within the EU‐Andean agreement is expected to lead to greater competition from EU
providers in the Andean countries, particularly in banking, insurance, telecommunications,
computer and related services, distribution services, and construction and engineering services.
The EU is the leading investor in the Andean countries, accounting for more than a quarter of total
foreign direct investment in the region. EU direct investment in the Andean countries has
significantly increased in the last few years, with EU companies taking part in privatisation processes
of services, in the financial system, manufacturing, mining and oil activities. The opening of services
sectors to EU companies can be expected to encourage further European investment in establishing
a commercial presence in the Andean economies.

Draft Interim Technical Report
73
Employment
The changes in employment will follow the change in output shown in table 30. There is likely to be
some growth in demand for more skilled labour in the telecommunications and financial services
whereas an expansion in construction and tourism will be reflected in increased demand for less
skilled labour.
For the EU, the benefits from services liberalisation are likely to be related mainly to the increased
European investment in the Andean economies. This will generate increased profits for European
investors and may also create employment opportunities for skilled European employees in
establishing and managing a commercial presence in the Andean region.
Services Liberalisation and Regulation
There are close linkages between international trade rules to liberalise trade in services and
regulatory frameworks for services (telecommunications, transport, water, electricity, financial
services).134 There is an inherent tension between services trade liberalisation and services
regulation. The GATS recognises governments’ rights to regulate ‘for services supplied in the exercise
of government authority’, although there is uncertainty on the interpretation of the requirement
that a service is provided ‘neither on a commercial basis’ nor ‘in competition with one or more
services providers’.
An example of this potential conflict between services trade liberalisation and domestic regulatory
objectives is found in the utilities services sector, particularly water services. Private sector
involvement may result in increased prices (to ensure financial viability) or a concentration of
investment and provision in areas of high population or income. As a result, if policies to ensure
universal service at affordable prices are not put in place as part of the regulatory framework, the
access of the poor to essential services may not improve with increased private sector
participation.135 Fears that privatisation would produce negative effects on local population are a
potential source of conflict, as the “war of water” in Bolivia illustrates.136
134 UNCTAD 2009
135 Kirkpatrick et al (2007); Kirkpatrick and Parker (2005)
136 Perreault 2006

EU‐Andean Trade SIA
74
3.4.2 Social Impacts
Poverty and Equity
With effective domestic regulatory control, market opening in the basic utilities sector improves
access for the poor to affordable and reliable services in water, energy, communications and
transportation.
Liberalisation of distribution may result in some reduction in prices for consumers. An accompanying
increase in food retailing concentration may have a damaging effect on small scale family owned
shops.
Heath and Education
There is a substantial body of evidence showing that such improvements in the quality and access to
basic water and sanitation services leads to positive impacts on the health of the consumer. In
addition, the expansion of water utilities and increased access to clean water in rural areas would
have a direct impact on women’s and children’s workload.
3.4.3 Environmental Impacts
Environmental quality
Services liberalisation is expected to increase the utilisation of environmentally efficient
technologies and management techniques. It may also raise pressure on government authorities to
improve environmental regulation and enforcement, however, liberalisation of distribution services
could lead to goods being sourced from a wider area, with consequent adverse impacts on local
pollution and climate change associated with increased transportation.
Natural resources
Greater use of environmentally efficient management techniques and technologies will tend to
reduce pressures on consumption of water and other resources. The impact is not expected to be
significant in relation to other effects in this area.
Biodiversity
No significant impacts on biodiversity have been identified from services liberalisation.

Draft Interim Technical Report
75
3.4.4 Selected Services Sub‐Sectors
The project terms of reference require the analysis to depict the current situation of service sectors
such as telecom, financial services, construction services and distribution services and to identify the
potential for development of these services to business and private consumers, the potential for
increased FDI, the potential impact on the development of the economy and to identify potential
bottlenecks for development.
This section of the report provides a preliminary analysis for telecommunications, financial services,
construction services and distribution services.
Telecommunications
The Andean Committee of Telecommunications Authorities (CAATEL) agreed to liberalize all
telecommunications services, except for sound broadcasting and television, starting on January 1,
2002.
Communications services, particularly telecommunications, play an increasingly important role in
enhancing business competitiveness in the Andean countries. As suggested by the Mattoo et al
(2001) study on growth rates, improving communications can make a major contribution to
economic development. Significant gains can be made either though liberalisation or private
investment. The international evidence suggests that the liberalization of telecommunications sector
will be most successful when it is accompanied by effective regulatory institutions.137 Additional
efficiency gains may be available from regulatory convergence with the EU, however, careful
management would be needed to ensure that the potential convergence benefits outweigh the
costs of negotiation, transition and compliance.
Financial services
GATS defines financial services as insurance and insurance‐related services, and banking and other
financial services (excluding insurance). The estimates in Table 38 show that, with the single
exception of Ecuador, financial services liberalisation would have a negative impact on the output of
financial services industries in the Andean countries . The impact on insurance services is negative in
all four countries. The EU‐Andean negotiations aim for additional commitments for liberalisation of
trade in financial services beyond those that have been made through the WTO under GATS.
Within the EU, the integration of financial services markets has been progressing across the board,
but at a very different pace for different products and end‐users. Wholesale markets are generally
characterised by a high level of integration, while retail financial markets remain nationally
fragmented.
137 Wallsten, 2001
EU‐Andean Trade SIA
76
A Commission White Paper of 2005 set out objectives in financial services policy for the period to
2010, with emphasis on financial integration and increased coherence and consistency in regulation
and supervision. A review carried out in 2007 recognised that greater integration can strengthen
competition and offer better opportunities for financing and risk diversification, but identifies risks
associated with corresponding structural changes in the financial system. In parallel with measures
for increased convergence within the EU, the review calls for the development of adequate
safeguards to ensure financial stability.
The Andean countries have suffered from several financial crises in the past decade. These have had
significant consequences for their financial systems, which vary from country to country. The
opening of the financial services market to European banks and finance institutions is expected to
produce an initial decline in domestic financial services, except in Ecuador, but in the longer term
there may be positive impacts from the contribution of the financial sector to economic growth.
Financial services liberalisation can have either a beneficial or adverse effects on the risk of financial
instability, depending on the effectiveness of regulatory mechanisms. The potential benefits of
liberalisation, however, could be outweighed if the risk of instability were allowed to rise. Effective
mitigation measures may therefore be necessary in order to avoid major adverse effects in all the
Andean countries.
Construction services
The impact of EU Andean services liberalisation is predicted to be positive in all four countries.
Construction and civil engineering are essential components of many aspects of development and
can help to generate large economic benefits. Gains would come largely from productivity
improvements or reduced economic rents as a result of increased competition in the domestic
market. Relaxed entry requirements may result in a small loss of employment of Andean
professionals, but salary differentials would limit this effect. Given that this sector concentrates an
important share of unskilled urban labour force, which also absorbs temporary migrants from rural
areas,138 the expected impact of its expansion is likely to have positive effects on poverty reduction.
Distribution services
Distribution services account for a significant share of GDP in all four Andean countries (Table 30).
Market opening is predicted to have a positive impact in all countries except Ecuador, where a
decline of less that percent is predicted.
The scenario for services would expand the ability of EU distribution companies to establish outlets
in the Andean countries, which would experience welfare gains from increased economic efficiency
and potential reductions in consumer prices. 138 Roderick et al 2008

Draft Interim Technical Report
77
The number of small traders in the Andean countries can be expected to decline, with a smaller
number of jobs becoming available in new, less labour intensive, outlets. The welfare gain will come
mainly from lower consumer prices, particularly for higher income urban communities.139 Effective
competition policy may be needed to prevent cartelisation and anti‐competitive behaviour.
Significant reduction of recreation and services to business sectors in Ecuador, Bolivia and Colombia
may impact negatively urban unemployment. A reduction of the insurance sector in all countries
may reduce the opportunities of the poor to access to this service, already restricted to middle and
higher income segments.
In the longer term, liberalisation can be expected to improve the effectiveness of those distribution
services which supply modern industrial and commercial equipment to other sectors of the economy.
This may have a significant beneficial long term effect on Andean growth rates.
139 Arkell and Johnson 2005

EU‐Andean Trade SIA
78
3.5 Other Trade Areas under Negotiation
3.5.1 Investment
The inclusion of investment in trade negotiations is intended to minimise the conditions and
regulations on foreign investors entering and operating in the host countries, improve the
transparency and consistency of the regulations that are applied to foreign investors, and to grant
them national treatment.140 The underlying premise in favour of an investment agreement is that
it will increase the flow of foreign investment. In addition, by improving investor protection and
confidence, domestic investment may also be stimulated.141 Proponents of investment agreements
argue, therefore, that the improvement of the investment ‘climate’ and the liberalisation of
investment would be of mutual benefit to both parties in the trade agreement. The empirical
evidence on the economic impact of investment provisions in regional trade agreements is generally
positive.142
The inclusion of investment provisions in trade agreements can be contentious, as it may limit
domestic policy autonomy if it includes legally binding protection for foreign investment.143 Latin
America received record levels of foreign direct investment in 2007, exceeding the previous record
set in 1999 (in the context of one‐off privatisations). This surge in FDI was mainly fuelled by
transnational corporations seeking to take advantage of the growth in local market demand and gain
access to natural resources. in light of buoyant world demand. 144 Hydrocarbons and mining have
been among the main sources of investment. There is sizeable variation, however, in both the scale
and trend in FDI flows to individual countries, reflecting differences in domestic market potential,
natural resource endowments and government policy towards foreign investment.
Improving the quality of investment inflows and harnessing the benefits of FDI for local development
through capacity building in the area of regulation and competition policy and the development of
the institutional conditions necessary to maximise the spillover from FDI activity has been identified
140 Te Velde and Fahnbulleh, (2006) identify the following areas that can be covered in an investment agreement: Investment
promotion and cooperation, liberalisation and market access, and investment protection.
141 However,the evidence in support of the ‘crowding in’ effect of FDI on domestic investment is weak (Agosin, 2008) 142 Dee and Gali (2003) find that FDI responds positively to the non‐trade provisions within RTAs. Similarly, Te Velde and Bezemer
(2006) find that regions with more investment provisions provide US and UK investors with positive signals about how different
regions will treat them. Furthermore, the type of regional grouping matters for attracting FDI (i.e. whether or not the RTA includes
certain trade and investment provisions). The OECD (2006) finds that investment provisions in RTAs are positively associated with
both trade and investment flows. 143 UNCTAD, 2006 144 ECLAC, 2008a
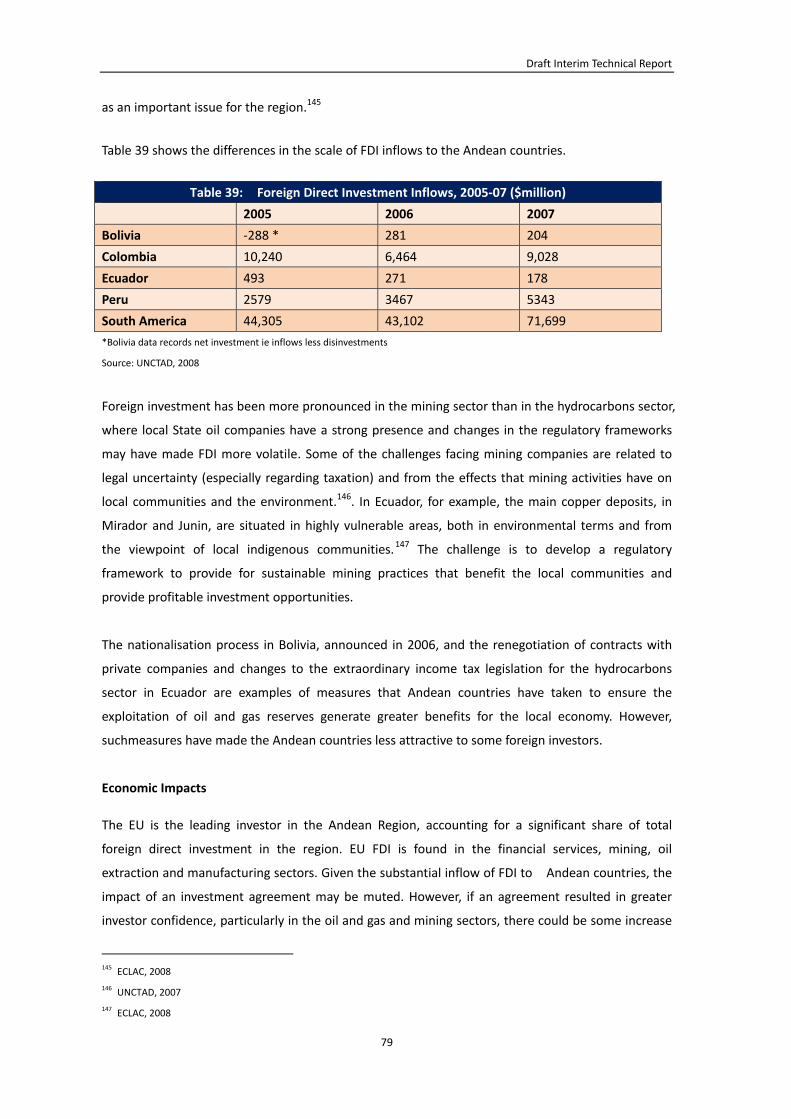
Draft Interim Technical Report
79
as an important issue for the region.145
Table 39 shows the differences in the scale of FDI inflows to the Andean countries.
Table 39: Foreign Direct Investment Inflows, 2005‐07 ($million)
2005 2006 2007
Bolivia ‐288 * 281 204
Colombia 10,240 6,464 9,028
Ecuador 493 271 178
Peru 2579 3467 5343
South America 44,305 43,102 71,699
*Bolivia data records net investment ie inflows less disinvestments
Source: UNCTAD, 2008
Foreign investment has been more pronounced in the mining sector than in the hydrocarbons sector,
where local State oil companies have a strong presence and changes in the regulatory frameworks
may have made FDI more volatile. Some of the challenges facing mining companies are related to
legal uncertainty (especially regarding taxation) and from the effects that mining activities have on
local communities and the environment.146. In Ecuador, for example, the main copper deposits, in
Mirador and Junin, are situated in highly vulnerable areas, both in environmental terms and from
the viewpoint of local indigenous communities.147 The challenge is to develop a regulatory
framework to provide for sustainable mining practices that benefit the local communities and
provide profitable investment opportunities.
The nationalisation process in Bolivia, announced in 2006, and the renegotiation of contracts with
private companies and changes to the extraordinary income tax legislation for the hydrocarbons
sector in Ecuador are examples of measures that Andean countries have taken to ensure the
exploitation of oil and gas reserves generate greater benefits for the local economy. However,
suchmeasures have made the Andean countries less attractive to some foreign investors.
Economic Impacts
The EU is the leading investor in the Andean Region, accounting for a significant share of total
foreign direct investment in the region. EU FDI is found in the financial services, mining, oil
extraction and manufacturing sectors. Given the substantial inflow of FDI to Andean countries, the
impact of an investment agreement may be muted. However, if an agreement resulted in greater
investor confidence, particularly in the oil and gas and mining sectors, there could be some increase
145 ECLAC, 2008 146 UNCTAD, 2007 147 ECLAC, 2008

EU‐Andean Trade SIA
80
in European investment into these sectors. An investment agreement might also act as a signal to
non‐ EU investors. The additional inflow of FDI that can be attributed to the agreement is unlikely to
be significant, but any agreement can be expected to stabilise the long term flow of FDI. Over time,
the inflow of new FDI is expected to contribute to economic growth.
An investment agreement is expected to have positive impact on foreign direct investment and may
also have a ‘crowding in’ effect on domestic investment. The increase in growth resulting from FDI
inflows is expected to have a positive long term impact on employment
Social Impacts
In the long run, the increase in real income attributable to higher FDI inflows may have an indirect
trickle down effect on poverty. Better fiscal redistribution mechanisms could improve the poverty
status of local communities adjacent to mining and oil projects. An inflow of FDI into the basic
utilities sector is also likely to contribute to poverty reduction, provided that domestic regulatory
offices are able to regulate for accessibility and affordability criteria in the delivery of services by
private utility operators.148 An investment agreement is not expected to have a significant impact
on equity.
If FDI results in ‘learning by doing’ and skills enhancement externalities, the quality of the labour
force may be positively affected. Similarly, if the health safety standards in foreign owned
enterprises are superior to domestic enterprises, there may be some marginal improvements in
health for employees.
Environmental Impacts
The impact of increased FDI on the environment has been widely discussed in the literature,
particularly in the context of pollution havens and a ‘race to the bottom.’149 It is evident an increase
in FDI inflows which increases output will give rise to negative environmental impacts unless these
are mitigated or prevented by an effective environmental regulatory capacity. As described in the
baseline conditions section, environmental regulation enforcement is weak in the Andean countries.
It can be predicted that any increase in FDI that is attributable to an investment agreement, will have
adverse environmental consequences.
FDI in manufacturing activities can be expected to increase air and water pollution, the scale of
which will be determined by the investment‐induced increase in production levels. There is also
148 See, Kirkpatick and Parker 2007 149 Kirkpatrick and Shimomoto, 2007

Draft Interim Technical Report
81
evidence to suggest that FDI can introduce improved environmental control technology, thereby
contributing to improvements in environmental quality. FDI in environmental services can also
contribute positively to environmental quality.150
An investment agreement is not expected to have any significant impacts on biodiversity.
3.5.2 Public Procurement
Government procurement is arguably the largest trade sector sheltered from multilateral disciplines.
It was initially excluded from the GATT; Article III (national treatment) does not apply to
procurement. With the completion of the Tokyo Round on multinational trade negotiations in 1979,
a code of conduct for central government procurement, known as the Agreement on Government
Procurement (GPA), was introduced into the GATT. The code bound only its signatories and most
GATT contracting parties did not join. During the Uruguay Round the coverage of the agreement was
expanded to include services and additional government entities. Transparency in government
procurement was re‐introduced as part of the WTO negotiation agenda at the Singapore Ministerial
meeting in December 1996, as one component of the so‐called ‘Singapore issues’ (the other
‘behind‐the‐border’ Singapore issues related to multilateral rules for competition, trade facilitation
and investment). In July 2004, the World Trade Organization (WTO) General Council decided not to
launch negotiations on new multilateral rules on transparency in government procurement (or
competition and investment). Multilateral disciplines on government procurement remain subject,
therefore, to the amended plurilateral Government Procurement Agreement (GPA) which came into
force in 1996. The agreement regulates public tenders in a way to guarantee the transparency of
procedures and to ensure equal treatment for domestic and foreign suppliers. None of the Andean
Countries are parties to the GPA.
The European Union has identified the absence of multilateral disciplines in the field of public
procurement as a serious constraint on the ability of EU companies to compete for government
contracts in areas such as transport equipment, public works and utilities, and seeks to improve the
terms of access to procurement markets outside the EU for EU exporters.151 To achieve this, the EU
aims to negotiate access to procurement markets through its bilateral trade agreements and free
trade agreements (FTAs), by encouraging third countries to negotiate substantial commitments with
the EU.
150 George, Kirkpatrick and Scrieciu, 2006 151 http://ec.europa.eu/trade/issues/sectoral/gov_proc/index_en.htm

EU‐Andean Trade SIA
82
Estimates of the size of public procurement by state bodies in goods and service in a sample of 106
developed and developing countries find that for the OECD countries, the total value of government
procurement market is estimated at USD$4,733 billion and for the non‐OECD countries it is
estimated at USD $816 billion .152 The role of government procurement of goods and services
typically accounts for 10‐15 per cent of GDP of developing countries and around 20 per cent of GDP
in developed countries. In the EU, the procurement market is worth €1600 bn or over 16% of GDP.153
Developing countries have in the past consistently opposed the inclusion of government
procurement in the WTO negotiation agenda on the grounds that the scope of the issues is unclear
and that they lack the technical and institutional capacity to comply with international tendering
procedures. However, that position has more recently begun to shift, possibly in recognition of that
fact that every country in the world already has some rules governing public expenditure, and also
on account of the potential benefits in terms of governance and money saved which enhanced
transparency may generate. A number of developing countries have therefore engaged in
negotiations on transparency, if not also coverage.
Resistance to GPA compliance may also be based on more fundamental concerns about the potential
damaging effects on the development process. Procurement policies may be part of an industrial
policy or an instrument to attain social objectives (e.g. support for small and medium sized
enterprises, minority‐owned businesses, disadvantaged ethnic groups, or certain geographic regions)
through set‐asides and preference policies.154 In addition, a government’s ability to procure from
firms of its own choice can be an instrument of macroeconomic management. There is the
concern that premature or over‐rapid opening of government procurement markets will allow large
foreign firms to drive out local firms before increasing prices, similar to predatory dumping. However,
there is also growing awareness that it may be possible to address these issues within a
procurement chapter, to the mutual satisfaction of all Parties involved.
Furthermore, most developing countries are unlikely to gain a significant share of the government
procurement market in the developed country partner’s market. Many developing countries’
competitive advantage continues to lie in the provision of labour intensive services. However, as
emerging economies increasingly diversify, their exporting interests grow more varied. Developing
countries can compete in the supply of goods required by hospitals, defence and other public
organisations (eg, office furniture and equipment, textile products, shoes, tyres and other rubber
products) , however the lack of information and experience in responding to tender invitations can
prevent suppliers in developing countries from accessing this market.
152 OECD, 2003 153 EC (2004) 154 Stiglitz and Charlton, 2005

Draft Interim Technical Report
83
On the other hand, as tender information is increasingly published in several languages in central
databases free of charge on the internet, access becomes easier for smaller companies. Suppliers
from developing countries are increasingly active in the EU procurement market.
Liberalisation of government procurement remains a complex issue, and a move towards a rule
based agreement may be perceived by some stakeholders as a potential weakening of domestic
policy autonomy. However, as an increasing number of developing countries are engaging in public
procurement reform, there is likely to be an increasing opportunity to test the validity of these
arguments.
Public Procurement Policies in the Andean countries
Bolivia enacted a new law on public procurement in 2004, aimed in particular at making public
procurement a more efficient and transparent process. However, the new regime continues to give
Bolivian companies and products preferences, which in some cases is linked to national content.
Foreign companies wishing to bid for government consulting contracts must do so in association
with a Bolivian company.155
Colombia’s public procurement regime does not differentiate between domestic and foreign firms.
However, certain provisions require a more favourable evaluation of offers that contain Colombian
goods and services, or foreign goods and services that incorporate Colombian added value.156
Ecuador’s current legislation enables it to limit tendering to domestic companies and restricts the
participation of foreign consulting firms, except when the necessary expertise and capacity is not
available locally. Efforts are being made to enhance transparency in government procurement.157
Since 2000, important policy changes have been made to the regulatory framework on government
procurement in Peru. Peruvian legislation grants a 20% preference margin to bidders that use
Peruvian goods, and certain programmes (eg food aid) specify that only domestic food products be
acquired.158
155 WTO, 2005 156 WTO, 2007 157 WTO, 2005a 158 WTO, 2007a

EU‐Andean Trade SIA
84
Economic Impacts
There are two potential sources of benefit from liberalisation of government procurement (Evenett,
2003). First, as a result of the transparency requirements the government will be required to
demonstrate better value for money in its contracting and purchases. More generally, greater
transparency will contribute to improved governance. It is estimated that the introduction of the
Internal Market reforms in the EU significantly improved the performance of public procurement
markets over the past decade. Public procurement directives have effectively increased transparency
and resulted in an estimated saving of 30% or more in public finances, despite the fact that direct
cross border procurements remain low. Second, exports could expand as a result of purchases of
goods and services by governments in the partner countries.
Ideally, there would be a robust evidence base to substantiate the claims made regarding the
potential negative and positive impacts associated with government procurement reform in
developing countries. Unfortunately, with the notable exception of the study published in 2004 by
the European Commission demonstrating significant potential for cost savings (some 30%), to date,
there is not enough solid evidence on the effect of liberalising government procurement markets.
This being said, there is a widely held view that opaque procurement practices are a significant
source of corruption, and a key obstacle to a sustainable management of public finances.
An agreement on greater transparency in Andean governments’ procurement procedures may
generate gains from increased competition for government contracts. Further economic efficiency
gains might be expected to result from the improvement in the quality of public sector governance.
The ‘demonstration effect’ of improvements in transparency and accountability in government
procurement may spillover in improvements in other areas of public regulation and policy affecting
the private sector. Consumers are likely to benefit from an improvement in the quality of goods and
services provided by the state.
There may be additional gains to Andean exporting firms if an agreement assists these firms in
competing for public sector contracts for the supply of goods and labour services, in the EU
countries. These economic gains would need to be compared to any benefits foregone in terms of
developing domestic productive and technological capacity through the use of government long
term contracting with local producers as an instrument of industrial strategy. In addition, a
procurement framework which is perceived as more reliable and transparent by operators could also
be a driver to attract more innovative inward investments.

Draft Interim Technical Report
85
Social Impacts
The liberalisation of government procurement could have an impact on the use of procurement to
support SME development or regional development. However, it is unlikely that the economic gains
from the liberalisation of government procurement could immediately be secured by the fiscal
system and redistributed to support these goals. On the other hand, the money saved on more
efficient procurements would become available for other important policy objectives such as social
policy issues. Over time, tax revenues from corporate taxation could increase as the dynamic effects
of liberalisation of government procurement are realised in terms of increased economic
performance and growth in the private sector. On the other hand, those groups who depend heavily
on goods and services provided by the state are likely to benefit from the improvement in the
quality of these goods that is engendered by the liberalisation of public procurement rules. However,
given the restrictions for SME to access to government procurement bids159 competition from larger
foreign firms may hinder employment in the SME sector and increase the risks of the potential
displaced labour force to fall in poverty.
Environmental Impacts
The reforms to government procurement procedures are not expected to have any significant
environmental impacts.
3.5.3 Trade Facilitation
The CGE model explicitly involves trade costs, which include both trade and transportation services.
These trading costs reflect the transaction costs involved in international trade, as well as the costs
of the physical activity itself. In addition, there are frictional trading costs that represent real
resource costs associated with producing a service for sale in an export market instead of the
domestic market. The modelling results are derived from an assumed reduction of overall trade costs,
1% of the comprehensive scenario, 3% for the very comprehensive scenario. The model results show
significant welfare gains for trade facilitation reforms that result in a reduction in trade costs.
Other modelling studies of trade facilitation as part of trade liberalisation also indicate significant
gains .160
There is a broad consensus that trade facilitation does have the potential to contribute significantly
to smoother and intensified trade between countries, particularly in terms of eliminating
burdensome trade procedures, increasing transparency, improving business opportunities and
159 Yeng and Cartier 2003
160 Engman (2005).

EU‐Andean Trade SIA
86
security, and generally enhancing competitiveness and economic development to the benefit of
both the government and the private sector.161 Landlocked countries in particular can expect to
benefit from reduced border delays and transit costs.
In order to reap the potential benefits, many developing countries have embarked on customs
modernisation unilaterally as part of a broader programme of reforms, with assistance from
international agencies such as the World Bank and UNCTAD162. Experience suggests that factors
essential for success includes ‘properly identifying problem areas and coherently designing reform
programs.’163
These considerations suggest that trade facilitation does offer significant potential economic
benefits although these cannot be quantified with any certainty. They are probably fairly small in the
short term, but may make a significant qualitative contribution to longer term development
processes. Effective technical assistance is likely to make an important contribution in ensuring that
the benefits outweigh the costs.
Recent data on the costs and constraints for trade across borders in the Andean countries suggests
that there are significant gains to be realised from a reduction in trade facilitation costs incurred by
exports and importers. Table 40 shows that all four countries are in the bottom half of country
rankings for costs of trading across borders, suggesting that there are likely to be significant gains
from trade facilitation reforms.
Table 40: Indicators of Trade Costs
Documents
for export
(number)
Time for
export
(days)
Cost to
Export
(US $ per
container
Documents
for import
(number)
Time for
Import
(days)
Cost to
import
(US$ per
container)
World
Bank
Ranking
( 1‐181)
Bolivia 8 19 1425 7 23 1747 117
Colombia 6 14 1690 8 15 1640 96
Ecuador 9 20 1345 7 29 1332 124
Peru 7 24 875 8 25 895 93
Source: World Bank, 2009
161 Hellqvist (2003),, Ivanow and Kirkpatrick (2007) 162 OECD (2005b) 163 OECD (2003)

Draft Interim Technical Report
87
Economic Impacts
The main economic benefit to the Andean countries will be in the efficiency gains from customs and
related procedural reforms. These gains can be expected to contribute to an improvement in the
business environment and will facilitate the growth of investment and employment in exports
production. An increase in imports could contribute to additional employment opportunities in port
handling and distribution activities. There could also be gains in economic efficiency associated with
a reduction in rent seeking activities. The size of these gains will be lower, however, in the short run,
as in terms of employment retrenchment and as financial costs are incurred in implementing the
reforms. The potential gains from trade liberalisation will also be reduced if they are not
accompanied by a reduction in domestic regulatory barriers to private sector development.
Social Impacts
The social impacts associated with trade facilitation are unlikely to be significant and will be directly
related to the economic impacts. There will be some direct employment effects associated with the
stimulation of trade flows, but the main social impacts are expected to occur in the long term from
the trickle‐down effects of trade expansion and accelerated economic growth in reducing poverty
levels and raising household incomes. Taking in account that in the last decade or so the significant
growth experienced in all Andean countries has had little impact on poverty reduction, for a
trickle‐down effect to happen social and pro‐poor growth policies will have to accompany trade
policies.
Environmental Impacts
The environmental impacts of trade facilitation reform are not expected to be significant. The
growth in trade movements may have some impact on air quality. Any secondary effect, through
induced expansion or upgrading or transport infrastructure can be expected to have a negative
impact on natural resources and biodiversity. In the long term, the increase in economic growth
linked to trade facilitation may improve access to, and adoption of, environmental goods and
services which would have an offsetting positive environmental impact.

EU‐Andean Trade SIA
88

Draft Interim Technical Report
89
4. CONSULTATION ACTIVITIES
4.1 SIA Website
The EU‐Andean Trade SIA project has
produced a project website to support
the project’s visibility and generate
stakeholder feedback. The website can
be accessed at www.euandean‐sia.org
and feedback can be sent to
enquiries@euandean‐sia.org.
The SIA website has received 6,954 hits
from 869 unique users over the period
February‐March 2009.
The website is available in both
English and Spanish and contains all
relevant information concerning the SIA’s progress, reports, minutes, background information,
current related news items, and contact information of the consortium partners. The website has
been designed to facilitate the SIA’s target audience and wider stakeholders’ access to the project’s
latest research in a user‐friendly version and encourage the provision of feedback.
As of the end of March 2009, in excess of 30 specific emails on areas involving substantial research
coverage had been received. The top five key issues raised in the correspondence include:
1. Clarification of research methodology, particularly the quantitative approaches to be
used for economic assessment
2. Impacts on the Andean agriculture sector from further trade liberalisation
3. Environmental circumstances in the Andean that should be considered by the study,
with a focus on biodiversity and climate change impacts
4. The current trade barriers in relation to banana exports between the two regions
5. Consultation processes with civil society, including details for the Local Workshop.
The feedback received to date represents a wide range of sources including research think tanks,
non‐government organisations, academic instuitions, industry groups and civil society actors. The
comments received have been collated by the project team for assessment and inclusion in
Figure 1 ‐ The Spanish language version of the EU‐Andean SIA website

EU‐Andean Trade SIA
90
assessment and evaluations where appropriate. The project team actively encourages feedback on
the Draft Interim Technical Report for consideration in the further assessment and policy work to be
included in the draft final report.
4.2 Electronic SIA‐Trade Newsletter
As part of the project’s consultation activities, an
EU‐Andean Trade SIA newsletter will be
disseminated electronically to the consultation
network at key points during the project,
coinciding with the release of each report and
other project deliverables. Downloadable from the
project website, the newsletter will include a
summary of the project’s progress and results, and
provide updates on notable economic, social or
environmental news events in the region.
Pending the release of the first edition of the
newsletter, an email was sent to the stakeholder
network encouraging users to register their
details online and provide feedback on the SIA
process and core sustainability issues from a
local perspective.
Following the publication of the Draft Interim Technical Report, a newsletter will be disseminated to
the stakeholder network prepared and contacted in the earlier stage of the project and continues to
be expanded through further consultations as the project’s research proceeds.
4.3 Consultation Workshops
The first civil society workshop was held in Brussels on 30 January 2009 to establish a dialogue and
to gather the views of interested parties (business, local public administrations and civil society in
particular). A copy of the minutes from this meeting is available online at www.euandean‐sia.org. In
addition, a full one‐day consultation workshop with local project stakeholders will be held in Lima,
Peru on 26 May 2009. The key outcomes and feedback from these workshops will be incorporated
into the development of impact enhancement and mitigation measures in the draft final report of
the study.
Figure 2 ‐ An email to the stakeholder network encouraging
stakeholders to subscribe to the newsletter and provide
comments on SIA

Draft Interim Technical Report
91
4.4 Interviews
A further round of interviews will be conducted in the final phase of the project, following
distribution of the Draft Interim Technical Report via email and the project website to the
stakeholder network. Stakeholders will be contacted for telephone or face‐to‐face interviews as
appropriate. The first round of interviews conducted in the early stages of Phase Two of the Project
were not as informative or authoritative as hoped by the research team, as many of the respondents
first wanted to examine the key research assessments prior to commenting on impacts. A key lesson
learnt in the project research to date is interviews based on the Inception Report are more process
related than substantive impact related. This will be corrected through follow‐up interview rounds.
The project team have maintained regular communication with key interviewees and will re‐engage
with these important stakeholders following the approval to publish the Draft Interim Technical
Report. This stage of the project is expected to constitute the most direct form of stakeholder
engagement in the project. Using a standard list of questions, the interviews will be the main form of
high‐level consultation with the business communities and governments of the Andean countries.
The interview responses to date have focused on feedback and recommendations on key issues to
cover which have been included where appropriate in the report, however, a further round on
impact considerations will be re‐launched.
4.5 Questionnaires
Following the analysis of consultation from the research team from the first round of interviews, it
was determined that a questionnaire would be most effective following the publication of the Draft
Interim Technical Report. This approach is designed to provide stakeholders with a key
understanding of the preliminary assessment for their feedback to be incorporated in the additional
research impacts to be undertaken by all research teams. In the latter stages of the study,
questionnaires will be distributed in both hard copy and electronically via the SIA website to coincide
with the public release of the Draft Interim Technical Report. The survey design will solicit both
quantitative and qualitative data from an expanded spectrum of industry, NGOs and civil society. The
project newsletter will also include a questionnaire for stakeholders to return.

EU‐Andean Trade SIA
92
4.6 Stakeholder consultation network
Below is a table of stakeholders for consultation by the project teams as part of the EU‐Andean SIA.
As the study progresses and the website generates publicity, additional stakeholders will be added to
the list.
Table 44 – Stakeholder consultation network
Horizontal issues Secotral Issues
Colombia Social Foundation The Colombian Confederation of
Chambers of Commerce ‐
CONFECAMARAS
Colombian Flower Export
Association
Colombian National Association
of Manufacturers
Social Foundation is a non‐for‐profit organization
which works on altering the structures which
cause poverty in Colombia. Its active research
fields such as local and regional integral
development, and human rights.
Network on Inequality and Poverty, Latin
America
The LACEA/IDB/World Bank Network on
Inequality and Poverty is a joint initiative that
aims to promote knowledge and expertise
regarding the causes and consequences of
poverty, inequality, and social exclusion, and the
whole range of policies, institutions, and social
structures that influence their dynamics as well
as the impact of public action. The network has
national chapters in fifteen countries in Latin
America.
Ser Investigation Institute
Instituto SER de Investigación (ISI) is a private,
non profit Colombian institution created in 1973.
It fights and resolves social problem and creates
new projects related with the services that the
state offers (education, health, justice
administration, public administration, regional
and urban development, assistance to local
governments). The multidisciplinary research;
the institute develops is specialized on
quantitative methodologies. Since the year 2002
ISI has worked along side with the Universidad
de los Andes. The institute’s mission is to inquire
on the social reality and promote changes and
innovations that will improve the welfare of the
population, and especially of those less
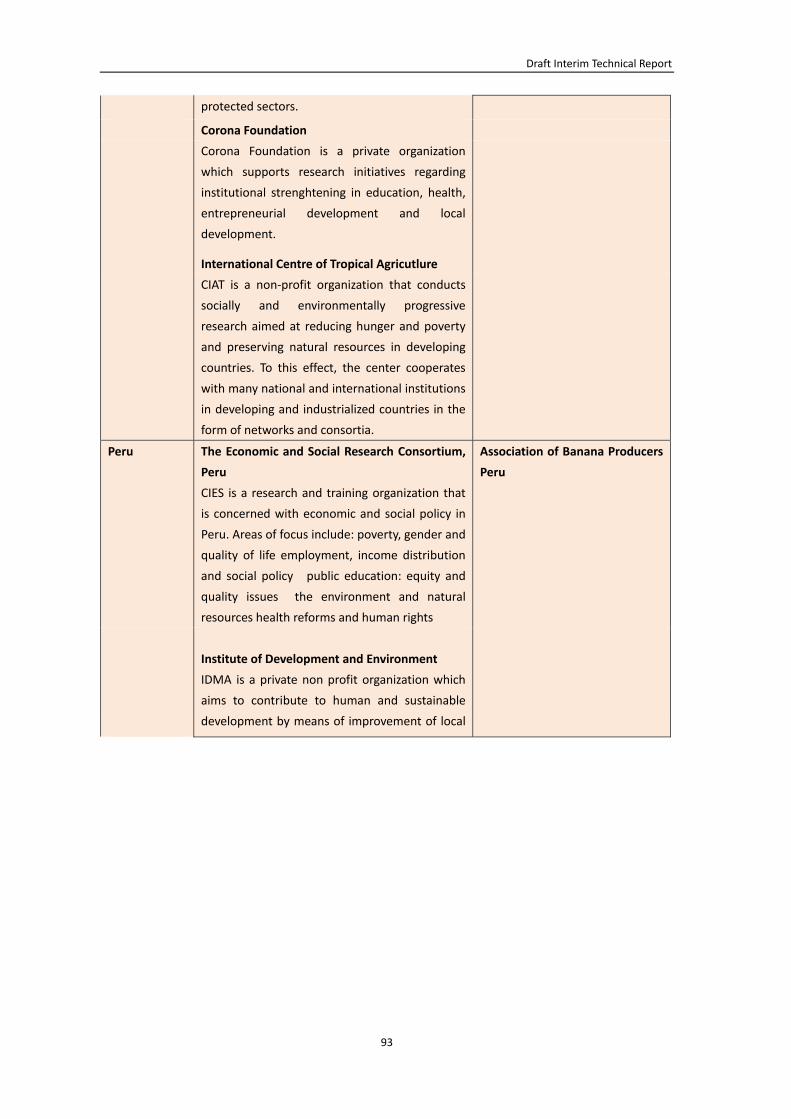
Draft Interim Technical Report
93
protected sectors.
Corona Foundation
Corona Foundation is a private organization
which supports research initiatives regarding
institutional strenghtening in education, health,
entrepreneurial development and local
development.
International Centre of Tropical Agricutlure
CIAT is a non‐profit organization that conducts
socially and environmentally progressive
research aimed at reducing hunger and poverty
and preserving natural resources in developing
countries. To this effect, the center cooperates
with many national and international institutions
in developing and industrialized countries in the
form of networks and consortia.
Peru The Economic and Social Research Consortium,
Peru
CIES is a research and training organization that
is concerned with economic and social policy in
Peru. Areas of focus include: poverty, gender and
quality of life employment, income distribution
and social policy public education: equity and
quality issues the environment and natural
resources health reforms and human rights
Association of Banana Producers
Peru
Institute of Development and Environment
IDMA is a private non profit organization which
aims to contribute to human and sustainable
development by means of improvement of local

EU‐Andean Trade SIA
94
and regional environments. The institute tries to
contribute from environmental perspective to
the following: improvement of the quality of
human life, democratization of the society,
decentralization of the country, social and
gender equity. On a more focused level, the
institute is concerned with small farmers and
aims to achieve: rural sustainable development,
poverty alleviation, cooperation between rural
and urban communities
Science and Technology Coordinator of the
Andes, Peru
CCTA is an NGO which works on networking
institutions dedicated to the promotion of
human development, with a focus on rural areas
in the Peruvian Andes. CCTA is involved mainly
with farm communities and small farmers in the
mountains, as well as rural and urban‐marginal
sectors of the Coast of Peru. CCTA works on two
central themes: science, technology and rural
development, and appropriate technologies for
Andean ecosystems.
Institute for Freedom and Democracy
ILD focuses on creating modern legal
frameworks that empower the poor of the
developing and ex‐communist world by
providing them with a legal property system
which allows them to turn their assets into
leverage‐able capital.
Citizens Proposal Group
Grupo Propuesta Ciudadana (GPC) is a
consortium of 11 NGOs working in 9 regions of
Peru. Its focus is State reform, with emphasis on
decentralization and participation. GPC´s work is
organized in four areas of activities: participation
in local and regional consensus building
mechanisms, legislative initiatives to the
Congress, monitoring of national, regional and
local government’s performance
communications

Draft Interim Technical Report
95
Research Center for Development and
Participation, Peru
CEDEP is a specialized civil association which
focuses on the articulation of social and
productive processes.
Ecuador Faro Group
Grupo Faro is a civil society organization that
creates spaces for action within the population
to influence public policies at local and national
level. Grupo FARO strives to become a diverse
forum that contributes to the dissemination and
implementation of ideas for the public
wellbeing. They work to bridge civil society and
policy‐makers and to disseminate information
necessary for a social, economic and political
transformation of Ecuador.
National Autonomous Institute
of Agriculture Inquiry
Bolivia Andean Centre for the Management and Use of
Water
This center is part of the Faculty of Agricultural
and Husbandry Sciences of the Universidad
Mayor San Simón, and it aims to contribute to
the formation of professionals in the fields of
irrigation and integrated management of water
resources, responding to the needs of the
Andean region and Bolivia as a whole.
Fundación TIERRA
TIERRA foundation is a private development
institution, founded in 1991, with a focus on
farming, specializing in alternative ideas and
proposals for sustainable rural development and
equitable access to natural resources. Its
activities include: research, formulation of
proposals, capacity building, communication,
management, technical support, promoting
participation of peasants and indigenous people
in political decision making, working with
government bodies and non‐government
organizations.
EU and
Multi‐country
Asociacion Latinoamericana de Organizaciones
de Promocion al Desarrollo a.c.
ALOP is an association of non‐governmental
development organisations from 20 countries of
Latin America and the Caribbean. Established in
Association of American
Chambers of Commerce in Latin
America (AACCLAL)
Chamber of the Americas

EU‐Andean Trade SIA
96
1979, ALOP is one of the most long‐lasting
efforts of integration of NGDOs in the region.
Within its objectives, ALOP aims at building and
facilitating meeting and exchange spaces for its
members in the perspective of mutual learning
in order to elaborate proposals for global, local
and sectorial development and work towards
establishing proactive relations with all actors on
the Latin‐American (LA) and Caribbean
development scenario.
Overseas Development Institute
ODI is Britain's leading independent think tank
on international development and humanitarian
issues. Our mission is to inspire and inform
policy and practice which lead to the reduction
of poverty, the alleviation of suffering and the
achievement of sustainable livelihoods in
developing countries.
Analysis Group of Development
In 1980, a team of Peru's social scientists formed
the Group for Analysis and Development
(GRADE), a private, nonprofit research center.
They strived to establish a think tank which
could contribute to Peruvian and Latin American
development through rigorous research and
analysis of key economic, environmental and
social issues.
European Fruit and Vegetable
Trade Association

Draft Interim Technical Report
97
5. REFERENCES
Adlung R. (2007) ‘The contribution of services liberalisation to poverty reduction: what role for the
GATS?’ Staff Working Paper ERSD 2007‐01. WTO Geneva
Agosin M (2008) ‘Is Foreign Investment Always Good for Development?’ Working Group on
Development and the Environment in the Americas. Discussion Paper no.9
AguirreF., T. Ammour, O. Díaz, E. Ramírez, R. Sarno. (2009) Aprendisajes Innovadores para la
Reducción de la Pobreza Rural. RIMISP, FIDA and FIDAMERICA. Santiago.
Andean Community General Secretariat (2005) Regional Biodiversity Strategy for Tropical Andean
Countries
Aramburu C. (2008) The FTA between Peru and the USA: what about Andean peasants? CIES.
Opinion Paper. Lima.
Arkell J. and M. Johnson (2005) ‘Sustainability Impact Assessment of Proposed WTO Negotiations:
Final Report for the Distribution Services Study’. International Trade and Services Policy and
University of Manchester.
Bebbington, A. (2004). ‘Livelihood transitions, place transformations: Grounding globalization and
modernity’. In: R. Gwynne & C. Kay (Eds.) Latin America Transformed: Globalization and Modernity.
London: Edward Arnold.
Berdegué J., A. Schejtman, M. Chiriboga, F. Modrego, R. Charnay and J. Ortega 2008). Agricultura
para el desarrollo: hacia una agenda regional para América Latina 2008. Debates y Temas
Rurales No. 12.
Berdegue, J.A., Ramirez, E., Reardon, T. and Escobar, G. (2001). ‘Rural nonfarm employment and
incomes in Chile’. World Development, 29(3),, 411‐425.
Bradley, R. S., Vuille, M., Diaz, H. F. and Vergara, W. (2006) Threats to water supplies in the tropical
Andes, Science, 312 (5781), 1755–1756
CISEP (2005) La mujer palliri in Bolivia. CISEP, Oruro.
Comunidad Andina (2007) Andean Environmental Agenda, 2006‐2110. 2nd Edition, August.
Dasgupta S. K Hamilton k Pandey (2007) ‘Environment during growth: accounting for governance
and vulnerability’ World Development, 34, 9.

EU‐Andean Trade SIA
98
Dee P. and J. Gali (2003) ‘The trade and investment effects of preferential trading arrangements’.
NBER Working Paper 10160, Cambridge MA.
Dee P. and J. Gali (2003) ‘The trade and investment effects of preferential trading arrangements’.
NBER Working Paper 10160, Cambridge MA.
ECLAC (2008), Social Panorama of Latin America 2008, Report, Washington DC: ECLAC.(2008a)
Foreign Investment in Latin America and the Caribbean, 2007 UN: Santiago
Engman, M. (2005) ‘The economic impact of trade facilitation’. OECD Trade Policy Working Papers,
no 21. Paris, OECD.
Escobal J. (2001) The determinants of nonfarm income diversification in rural Peru.World
Development, vol. 29, no. 3, pp. 497‐508.
Escobal J. and C. Ponce (2007) “Liberalización comercial, tratados de libre comercio y pobreza”, Lima:
GRADE.
Escobal J., Ponce C. (2008) Dinamicas provinciales de pobreza en el Peru. GRADE and RIMISP. Lima.
Unpublished report.
EC (2004) A Report on the Functioning of Public Procurement Markets in the EU: Benefits From the
Application of EU Directives and Challenges for the Future. Mimeo
(http://ec.europa.eu/internal_market/publicprocurement/docs/public‐proc‐market‐final‐repo
rt_en.pdf
European Commission (2007) Andean Community: Regional Strategy Paper, 2007‐13. E/2007/678.
Evenett S. (2002) ‘Multilateral Disciplines and Government Procurement’ in Hoekman B. et al, eds.
Development, Trade and the WTO. Washington D.C., World Bank.
Follegatti, J.L.L. (1999) Ilo: A city in transformation. Environment and Urbanization, Vol. 11, No. 2,
181‐202
Francois, Hoekman and Woerz (2007)
Kirkpatrick, C., C. George and S. Scrieciu (2006) ‘Trade Liberalisation in Environmental Services: Why
So Little Progress?’ Global Economy Journal, vol. 6(2).
Hardoy, J. and Satterthwaite, D. (2007) Environmental Impacts of Urbanisation. In Veblen, T.T,
Young, K.R, and Orme, A.R. (p322‐339) The Physical Geography of South America Oxford
University Press, Oxford

Draft Interim Technical Report
99
Hellqvist M. (2003) ‘Trade facilitation from a developing country perspective’. Sweden, National
Board of Trade.
Hinojosa L., J.P. Chumacero and M. Chumacero (2009) Dinámicas provinciales de pobreza en Bolivia.
RIMISP. Manchester y La Paz. Unpublished report.
Hinojosa, L. (2006). ‘Institutions, markets and economic development in the Southern Peruvian
Andes’. PhD thesis. University of Manchester.
ILO (2006), Panorama Laboral 2006, Lima: International Labour Organisation.
IMF (2007) Peru: Staff Report for the 2006 Article IV Consultation and Request for Stand‐By
Arrangement. Washington DC
Inurritegui M., I. Camacho, J. Ludena and others (2008). Acuerdo Asociacion UE‐CAN: quienes ganan
y quienes pierden? CEPES. Unpublished report.
IPCC Special Report (1997) The Regional Impacts of Climate Change: An Assessment of Vulnerability
IPCC Technical Paper V (2002) Climate Change and Biodiversity
IPCC Technical Paper VI (2008) Climate Change and Water
Iwanow T. and C. Kirkpatrick (2006) ‘Trade facilitation, regulatory quality and export performance: a
panel data gravity model approach’. IARC Working Paper, University of Manchester.
Kaufmann D. A. Kraay and M Masiruzzi (2008) Governance Matters VII: Governance Indicators for
1996‐2007 World Bank
Kirkpatrick, C., D. Parker and C. Figuera (2007) ‘Infrastructure regulation and poverty reduction in
developing countries’. Quarterly Review of Economics and Finance
Kirkpatrick, C. and D. Parker (2005) ‘Domestic Regulation and the WTO: The Case of Water Services
in Developing Countries’. World Economy, vol. 28(10), pp. 1491–1508.
Kirkpatrick, C. and K. Shimamoto (2007) ‘The Effect of Environmental Regulation on the Locational
Choice of Japanese Foreign Direct Investment’. Applied Economics.
Maajid N. (2001). Economic growth, social policy and decent work. Employment Paper 2001/19. ILO.
Geneva.
Mattoo, A., R. Rathindran and A. Subramanian (2001) ‘Measuring Services Trade Liberalization and

EU‐Andean Trade SIA
100
Its Impact on Economic Growth: An illustration’. World Bank Working Paper.
OECD (2006) Novel Features in OECD Countries’ Recent Investment Agreements; an Overview Paris
OECD (2002) ‘Business Benefits of Trade Facilitation’. TD/TD/WP(2001)21/FINAL.
OECD (2003a) ‘Quantitative Assessment of the Benefits of Trade Facilitation’.
TD/TD/WP(2003)31/FINAL.
OECD (2003b) ‘Trade Facilitation Reforms in the Service of Development’. TD/TD/WP(2003)11/FINAL.
OECD (2004a) ‘The Costs of Introducing and Implementing Trade Facilitation Measures: Interim
Report’. TD/TC/WP(2004)36/FINAL.
OECD (2005) National Strategies for Sustainable Development: Good Practices in OECD Countries.
SG/SD(2005)6, Paris, OECD.
OECD (2005a) ‘The Economic Impact of Trade Facilitation’. TD/TC/WP(2005)12/FINAL.
OECD (2005b) ‘Quantifying the trade and economic effects of non tariff measures’.
TD/TC/WP(2005)26/FINAL.
OECD (2005c) ‘Trade Facilitation Reforms in the Service of Development: Country Case Studies’.
TD/TD/WP(2004)4/FINAL.
Office of the US Trade Representative (2005) Interim Environmental Review: US‐Andean Free Trade
Agreement, February
Office of the US Trade Representative (2005) Interim Environmental Review: US‐Andean Free Trade
Agreement, February
Reardon T. J. Berdegué and G. Escobar (2001) Rural nonfarm employment and incomes in Latin
America: Overview and policy implications. World Development, vol. 29, no. 3, pp. 395‐409
Ruiz, D, Moreno, H.A Gutiérrez, M.E. Zapata P.A. (2007) Changing climate and endangered high
mountain ecosystems in Colombia. Exploratory analysis of changes in climate conditions –
Case study: Los Nevados Natural Park, Andean Central Mountain Range
Slunge D and R Jalden (2007) Bolivia Environmental Policy Brief: Environmental Sustainability,
Poverty and the National Development Plan. School of Economics and Commercial Law.
Gotenborg University
Stiglitz J. and A. Charlton (2006) Fair Trade for All: How Trade Can Promote Development. Oxford,

Draft Interim Technical Report
101
Oxford University Press.
Swyngedouw, E (1995) La Crisis del Abastecimiento de Agua en Guayaquil ILDIS, Quito
Te Velde D. W. and M. Fahnbulleh (2006) ‘Investment and Economic Partnership Agreements’.
EU‐ACP Negotiations in Focus, Capacity Building in Support for the Preparation of Economic
Partnership Agreements.
Te Velde D. W. and D. Bezemer (2006) ‘Regional integration and foreign direct investment in
developing countries’. Transnational Corporations, vol. 15(2).
UDAPE (2006) Pobreza y desigualdad en municipios de Bolivia. Segunda Edición. UDAPE, INE, La Paz.
UNCTAD (2006) Investment Provisions in Economic Integration Agreements. Geneva and New York,
UN.
UNCTAD (2007) World Investment Report.
UNCTAD (2008) World Investment Report
UNCTAD (2009) Services, Development and Trade: the Regulatory and Institutional Dimension.
TD/b/c.1/MEM.3/2
UNEP (2003) Global Environmental Outlook –Latin America and Caribbean
UNEP (2007) Global Environmental Outlook (GEO4).
UNICEF (2005) Child poverty in Latin America. Challenges No. 1.
Vergara, W. (2007) The Impacts of Climate Change in Latin America. World Bank Latin American and
Caribbean Region Sustainable Development Working Paper 30. Visualizing Future Climate in
Latin America: Results from the application of the Earth Simulator
World Bank (2006) Bolivia, Public Policy Options for the Well Being of All. Washington DC
World Bank (2009) Country Data and Statistics (www.worldbank.org)
World Bank (2009a) Doing Business Report: Trading Across Borders
WTO (2005) Bolivia Trade Policy Review. Geneva
WTO (2005a) Ecuador Trade Policy Review. Geneva
WTO (2007) Colombia Trade Policy Review. Geneva
WTO (2007a) Peru Trade Policy Review. Geneva
Yale Center for Environmental Law and Policy (2008) 2008 Environmental Performance Index

EU‐Andean Trade SIA
102
Websites:
http://www.conservation.org
World Bank Key Development Data & Statistics.
United Nations Environment Programme Early Warning and Assessment GEO Latin America and the
Caribbean Data Portal.
WHOSIS: World Health Organisation Statistical Information System
Energy Information Administration
CIA World Factbook
WHO/UNICEF Joint Monitoring Programme for Water Supply and Sanitation
http://www.unep.org/tnt‐unep/toolkit/pollutants/ http://www.worldwater.org/data.html

Draft Interim Technical Report
103
6. ANNEXES
Annex 1: Environmental Baseline Indicators
Table 1:
Source Bolivia Colombia Ecuador Peru
Surface Area (sq. Km) (Thousands) 1 1,098.6 1,141.8 283.6 1,285.2
Surface Area (1.000 hectares) 2 108438 110950 27684 128000
Forest Area (sq. Km) (Thousands)2005 1 587.4 607.3 108.5 687.4
Total Protected Area (1.000 hectares)
2004
2 11529 9647 18287 7832
Agricultural land (% of land area) 2005 1 34.8 38.4 27.3 16.6
Hydroelectric consumption (billion
KWH) 2006
5 2.14 39.9 7.06 19.4
Total electricity consumption (billion
KWH) 2007
6 5.092 52.8 12.9 28.97
Electricity consumption from
Hydroelectric (% total electricity
consumption)
‐ 42% 74.4% 54.7% 67%
Table 2 ‐ Water Data:
Source Bolivia Colombia Ecuador Peru
Water use agricultural (%) 2000 2 83.0 46.0 82.0 ‐
Water use domestic (%) 2000 2 13.0 50.0 12.0 ‐
Water use industrial (%) 2000 2 3.0 4.0 5.0 ‐
Rural population with access to drinking
water (%) 2004
2 68.0 71.0 89.0 ‐
Urban population with access to drinking
water (%) 2004
2 95.0 99.0 97.0 ‐
Access to Improved Drinking Water164 1970
(% of population)
4 33 63 34 35
Access to Improved Drinking Water165 2004
(% of population)
4 85 93 94 83
164 ‘Improved water sources include household connections, public standpipes, boreholes, protected dug wells, protected springs,
and rainwater collections. Unimproved water sources are unprotected wells, unprotected springs, vendor‐provided water, bottled
water (unless water for other uses is available from an improved source) and tanker truck‐provided water’

EU‐Andean Trade SIA
104
Table 3 ‐ Sewerage connections:
% of population with sewerage
connections
Source 1988 1989 1990 1992 2003 2005
Bolivia Urban 7 43.0 49.9
Bolivia Rural 7 4.0 3.0
Colombia Urban 7 89.0 92.0
Colombia Rural 7 17.0 25.0
Ecuador Urban 7 68.0 74.0
Ecuador Rural 7 7.0 54.0
Peru Urban 7 60.0 81.0
Peru Rural 7 3.0 8.0
Table 4 ‐ Air quality:
Source Bolivia Colombia Ecuador Peru
Rural population using solid fuels166
(%) 2003
3 80.0 48.0 8.0 90.0
Urban population using solid fuels167
(%) 2003
3 5.0 3.0 1.0 13.0
Table 5 – Urbanisation:
Source Bolivia Colombia Ecuador Peru
Population total (millions) 2007 1 9.52 46.12 13.34 27.90
Population growth (annual %) 1990 3 2.3 1.9 2.3 2.1
Population growth (annual %) 2006 3 1.9 1.4 1.1 1.1
Population living in urban areas (%) 1970 2 35.4 49.7 39.5 ‐
Population living in urban areas (%) 1990 3 56.0 69.0 55.0 69.0
Population living in urban areas (%) 2006 3 65.0 73.0 63.0 73.0
Urban population residing in urban
agglomerations with 750,000 or more
inhabitants (%) 2005
2 31.0 36.0 30.0 ‐
166 WHO – ‘The use of solid fuels in households is associated with increased mortality from pneumonia and other acute lower
respiratory diseases among children as well as increased mortality from chronic obstructive pulmonary disease and lung cancer
(where coal is used) among adults. It is also a Millennium Development Goal indicator.’

Draft Interim Technical Report
105
Source 1: World Bank Key Development Data & Statistics
Source 2: United Nations Environment Programme Early Warning and Assessment GEO Latin
America and the Caribbean Data Portal
Source 3: WHOSIS: World Health Organisation Statistical Information System
Source 4: http://www.worldwater.org/data.html
Source 5: Energy Information Administration
Source 6: CIA World Factbook
Source 7: WHO/UNICEF Joint Monitoring Programme for Water Supply and Sanitation

EU‐Andean Trade SIA
106
Annex 2. Technical Annex
2.1 Overview
The CGE model is based on Francois, van Meijl, and van Tongeren (2005), and is similar to World
Bank, CEPII, and CPB global models. It is a multi‐sector, multi‐region model of the global economy.
Estimated effects are based on a projected 2018 baseline. This baseline assumes a successful Doha
Round as well as implementation of major regional agreements.168 It is also built around
medium‐run macroeconomic forecasts from the World Bank, IMF, and OECD. From this baseline, we
have estimated the impact, both immediate and medium‐term (following investment responses) of
NTM liberalisation. The immediate impact (short‐run) estimates described below reflect the possible
impact, on the 2018 baseline, if the relevant trade agreement was only implemented in 2018. The
medium‐term, in contrast, provides an estimate of how the 2018 baseline would look if the
agreement had been implemented far enough in the past (approximately 7 to 10 years) so that the
full set of investment impacts have already been realised. Hence, the short‐run estimates are
immediate, while the long‐run give a sense of the difference in economic activity allowing for
investment responses.
An important feature of the model involves a savings‐investment‐capital link, whereby the static or
direct income effects of trade liberalisation induce shifts in the regional pattern of savings and
investment. These effects have been explored extensively in the trade literature, including Baldwin
and Francois (1999), Smith (1976, 1977), and Srinivasan and Bhagwati (1980). Several studies of
regional and multilateral trade agreements have also incorporated variations on this mechanism.
Such effects compound initial output welfare effects over the medium‐run, and can magnify income
gains or losses. How much these "accumulation effects" will supplement static effects depends on a
number of factors, including the marginal product of capital and underlying savings behaviour. In
the present application, we work with a classical savings‐investment mechanism (Francois et al
1996). This means we model medium‐ to long‐run linkages between changes in income, savings, and
168 Given the aggregation scheme of the model, the background implementation of regional
agreements into the baseline does not matter a great deal for the model, though full DDA
implementation as discussed below does.
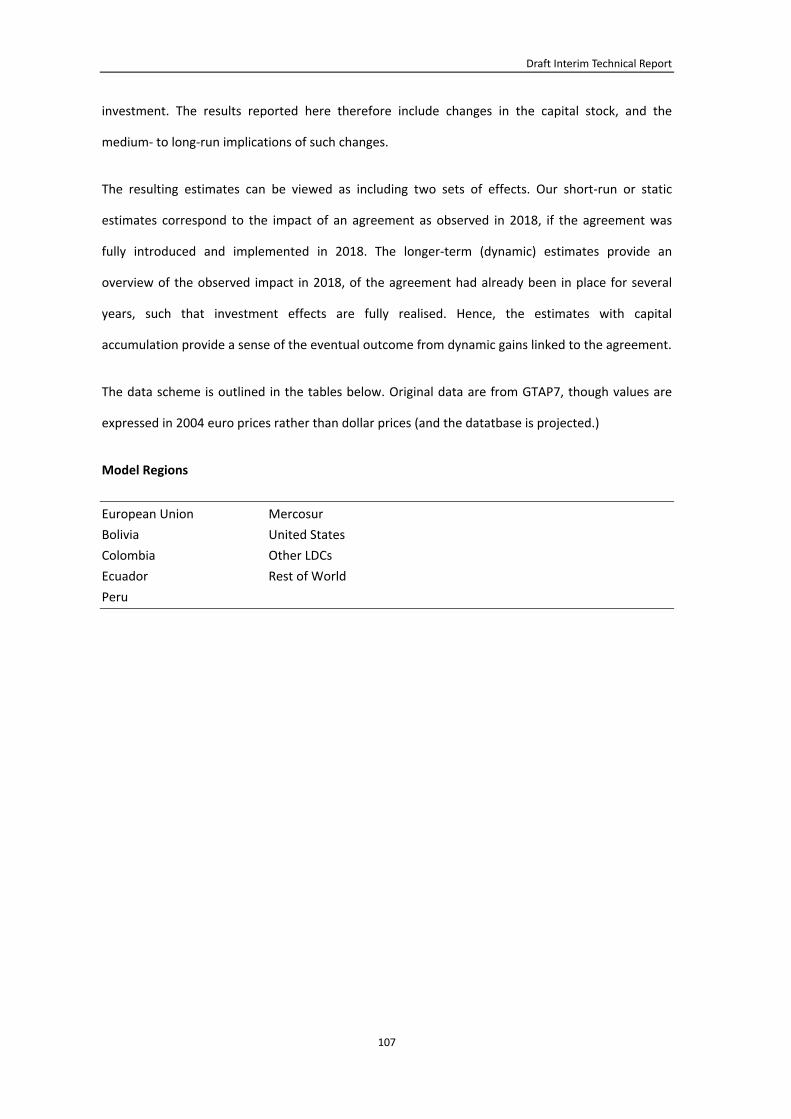
Draft Interim Technical Report
107
investment. The results reported here therefore include changes in the capital stock, and the
medium‐ to long‐run implications of such changes.
The resulting estimates can be viewed as including two sets of effects. Our short‐run or static
estimates correspond to the impact of an agreement as observed in 2018, if the agreement was
fully introduced and implemented in 2018. The longer‐term (dynamic) estimates provide an
overview of the observed impact in 2018, of the agreement had already been in place for several
years, such that investment effects are fully realised. Hence, the estimates with capital
accumulation provide a sense of the eventual outcome from dynamic gains linked to the agreement.
The data scheme is outlined in the tables below. Original data are from GTAP7, though values are
expressed in 2004 euro prices rather than dollar prices (and the datatbase is projected.)
Model Regions
European Union Mercosur
Bolivia United States
Colombia Other LDCs
Ecuador Rest of World
Peru
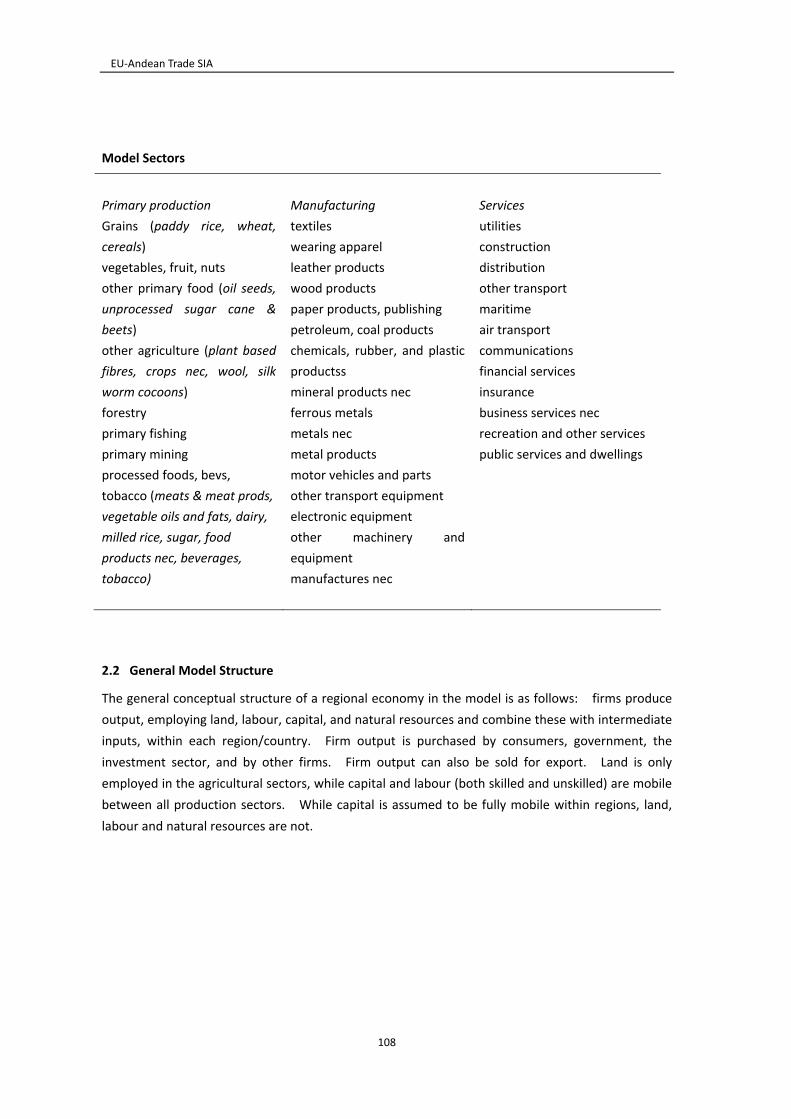
EU‐Andean Trade SIA
108
Model Sectors
Primary production
Grains (paddy rice, wheat,
cereals)
vegetables, fruit, nuts
other primary food (oil seeds,
unprocessed sugar cane &
beets)
other agriculture (plant based
fibres, crops nec, wool, silk
worm cocoons)
forestry
primary fishing
primary mining
processed foods, bevs,
tobacco (meats & meat prods,
vegetable oils and fats, dairy,
milled rice, sugar, food
products nec, beverages,
tobacco)
Manufacturing
textiles
wearing apparel
leather products
wood products
paper products, publishing
petroleum, coal products
chemicals, rubber, and plastic
productss
mineral products nec
ferrous metals
metals nec
metal products
motor vehicles and parts
other transport equipment
electronic equipment
other machinery and
equipment
manufactures nec
Services
utilities
construction
distribution
other transport
maritime
air transport
communications
financial services
insurance
business services nec
recreation and other services
public services and dwellings
2.2 General Model Structure
The general conceptual structure of a regional economy in the model is as follows: firms produce
output, employing land, labour, capital, and natural resources and combine these with intermediate
inputs, within each region/country. Firm output is purchased by consumers, government, the
investment sector, and by other firms. Firm output can also be sold for export. Land is only
employed in the agricultural sectors, while capital and labour (both skilled and unskilled) are mobile
between all production sectors. While capital is assumed to be fully mobile within regions, land,
labour and natural resources are not.

Draft Interim Technical Report
109
Leontief
Fig. A-1 Nested production structure
Output
Domestic supply
Exports
intermediate inputsendowmentsfactor inputs
CES
CES
CES
unskilled
skilled
landcapital
import domestic
r sources of imports
Fig. A‐2 Consumption Structure
2.3 Taxes and policy variables
Taxes are included in the theory of the model at several levels. Production taxes are either placed
on intermediate or primary inputs, or on output. Some trade taxes are modeled at the border.
There are also additional internal taxes that can be placed on domestic or imported intermediate
inputs, and may be applied at differential rates that discriminate against imports. Where relevant,
taxes are also placed on exports, and on primary factor income. Finally, where indicated by social
accounting data as being relevant, taxes are placed on final consumption, and can be applied
differentially to consumption of domestic and imported goods.
Composite
Private
Consumption
Government
Consumption
Private
Investment
Government
Investment
domestic domestic domestic domestic imported importedimportedimported

EU‐Andean Trade SIA
110
Policy data comes from many sources. In the GTAP database, tariffs are based on HS tariff line data,
from MacMAPS, the WTO, and WITS as implemented in the GTAP7 database. It also important to
note that many developing countries in the GTAP database receive significant preferences from
OECD countries. These preferences are included in the baseline data. The applied tariffs, based on
applied MFN and preferential rates, is implemented in the model on a trade‐weighted basis by
partner and sector.
Post‐Doha tariff estimates are based on the range of coefficients in the recent (2008) set of Doha
modalities texts (NAMA and agriculture. The problems in defining the post‐Doha baseline for tariffs
relate to agriculture rather than NAMA. Sensitive and special products are one of the most
complex issues in the WTO negotiations. WTO members are allowed to freely choose the products
they classify as sensitive, which causes considerable uncertainty about the outcome of this selection
process and makes them very difficult to handle in simulations. The data we work with for the DDA
in agriculture come from the German Federal Agriculture Research Institute ‐‐ the Johann Heinrich
von Thünen Institute (vTI). It follows the procedure outlined by Brockmeier and Pelikan (2008). 169
An advantage of the 2018 baseline is that it moves us past uncertainty about when the DDA will end,
and about short‐run assumptions about macroeconomic conditions. It also important to note that
all the countries involved already receive significant preferences from the EU. These preferences are
included in the baseline. Critically, we also assume the implementation of DDA tariff modalities on
sensitive products by the EU in agriculture (bananas and sugar in particular) based on consultations
with the EC on a likely outcome. The baseline scenario therefore represents a “most likely”
scenario.
Services barriers come from two sources. For the Andean countries, we have gravity estimates from
Francois, Hoekman, and Woerz (2007) for trade in commercial services. We have used this as the
benchmark rate of protection. For the EU, we have taken estimates of EU barriers against extra‐EU
partners from ongoing research with DG‐Trade on EU non‐tariff barriers affecting trade Canada,
Japan, and the United States. These estimates are more sector‐specific (unpublished source: “Draft
Study on EU‐US Non‐Tariff Measures,“ ECORYS led project consortium report, 2009). For the Andean
countries, average trade costs in services are Bolivia 40%, Columbia 33%, Ecuador 35%, Peru 32%.
2.4 Technical aspects of transport, trade facilitation, and services barriers
International trade is modeled as a process that explicitly involves trading costs, which include both
trade and transportation services. These trading costs reflect the transaction costs involved in
international trade, as well as the costs of the physical activity of transportation itself. Those
trading costs related to international movement of goods and related logistic services are met by
composite services purchased from a global trade services sector, where the composite
"international trade services" activity is produced as a Cobb‐Douglas composite of regional exports
of trade and transport service exports. Trade‐cost margins are based on reconciled f.o.b. and c.i.f.
trade data.
169 Brockmeier, M. and J. Pekikan (2008), "Agricultural market access: A moving target in the WTO
negotiations?" Food Policy 33: 250–259.

Draft Interim Technical Report
111
Frictional trading costs, is another form of trade costs known from the literature. These costs are
implemented in the service sector. They represent real resource costs associated with producing a
service for sale in an export market instead of the domestic market. Conceptually, we have
implemented a linear transformation technology between domestic and export services. This
technology is depicted in Annex Figure 1 below. The straight line AB indicates, given the resources
necessary to produce a unit of services for the domestic market, the feasible amount that can
instead be produced for export using those same resources. If there are not frictional barriers to
trade in services, this line has slope ‐1. This free‐trade case is represented by the line AC. As we
reduce trading costs, the linear transformation line converges on the free trade line, as indicated in
the figure. This approach is used for liberalization of non‐tariff measures, affecting both goods and
services, where they are modeled as increasing the cost of goods and services sold to trading
partners.
2.5 Market Structure
2.5.1 Demand for imports: Armington sectors
The basic structure of demand in constant returns sectors is Armington preferences. In Armington
sectors, goods are differentiated by country of origin, and the similarity of goods from different
regions is measured by the elasticity of substitution. Formally, within a particular region, we assume
that demand for goods from different regions is aggregated into a composite import according to
the following CES function:
(1) q j,r
M = α j,i,r M j ,i,rρ j
i=1
R
∑⎡
⎣ ⎢
⎤
⎦ ⎥
1/ρ j
In equation (1), Mj,i,r is the quantity of imports in sector j from region i consumed in region r. The
elasticity of substitution between varieties from different regions is then equal to σMj , where
σMj=1/(1‐ρj). Composite imports are combined with the domestic good qD in a second CES nest,
yielding the Armington composite q.
(2) qj ,r = Ω j .M .r qj ,rM( )β j + Ω j ,D,r q j ,r
D( )β j⎡⎣
⎤⎦
1/β j
The elasticity of substitution between the domestic good and composite imports is then equal to σDj,
where σDj=1/(1‐βj). At the same time, from the first order conditions, the demand for import Mj,i,r
can then be shown to equal

EU‐Andean Trade SIA
112
(5)
M j ,i ,r =α j ,i ,r
Pj ,i,r
⎡
⎣⎢⎢
⎤
⎦⎥⎥
σ im
α j ,i,rσ j
M
Pj ,i,r1−σ j
M
i=1
R
∑⎡
⎣⎢
⎤
⎦⎥
−1
Ej ,rM
=α j ,i ,r
Pj ,i,r
⎡
⎣⎢⎢
⎤
⎦⎥⎥
σ jM
Pj ,rM( )σ j
M −1Ej ,r
M
where EM j,r represents expenditures on imports in region r on the sector j Armington composite.
In practice, the two nests can be collapsed, so that imports compete directly with each other and
with the corresponding domestic product. This implies that the substitution elasticities in equations
(2) and (3) are equal.
2.5.2 Imperfect competition
As indicated in Annex Table 1, we model manufacturing sectors and service sectors as being
imperfectly competitive. The approach we follow has been used in the Michigan and the WTO
assessment of the Uruguay Round, and many recent studies of the Doha Round (see Francois et al
2005). Recent model testing work indicates that this approach works “best” vis‐à‐vis Armington
models, when tracked against actual trade patterns (i.e. Fox (1999), uses the U.S.‐Canada FTA as a
natural experiment for model testing).
Formally, within a region r, we assume that demand for differentiated intermediate products
belonging to sector j can be derived from the following CES function, which is now indexed over
firms or varieties instead of over regions.
(4)
j
jn
irijrijrj Xq
Γ
=
Γ⎥⎦
⎤⎢⎣
⎡= ∑
/1
1,,,,, γ
Where γj,i,r is the demand share preference parameter, Xj,i,r is demand for variety i of product j in
region r, and σj = 1/(1‐Γj) is the elasticity of substitution between any two varieties of the good.
Note that we can interpret q as the output of a constant returns assembly process, where the
resulting composite product enters consumption and/or production. Equation (4) could therefore
be interpreted as representing an assembly function embedded in the production technology of
firms that use intermediates in production of final goods, and alternatively as representing a CES
aggregator implicit in consumer utility functions. In the literature, and in our model, both cases are
specified with the same functional form. While we have technically dropped the Armington
assumption by allowing firms to differentiate products, the vector of γ parameters still provides a
partial geographic anchor for production (Francois and Roland‐Holst 1997, Francois 1998).

Draft Interim Technical Report
113
Firms in different regions/countries compete directly on a global level. Firms are assumed to exhibit
monopolistically competitive behaviour. This means that individual firms produce unique varieties
of good or service j, and hence are monopolists within their chosen market niche. Given the demand
for variety, reflected in equation (4), the demand for each variety is less than perfectly elastic.
However, while firms are thus able to price as monopolists, free entry (at least in the long‐run)
drives their economic profits to zero, so that pricing is at average cost. The joint assumptions of
average cost pricing and monopoly pricing, under Bertrand behaviour, imply the following
conditions for each firm fi in region i:
(5)
⎟⎟
⎠
⎞
⎜⎜
⎝
⎛⎟⎟⎠
⎞⎜⎜⎝
⎛⎟⎟⎠
⎞⎜⎜⎝
⎛ − −
∑∑PP
XX
= r f, j,
r k, j,1
r ,f j,
r k, j,n
1=k
1
f j,
r ,f j,R
1=rf j,
j
i
j
i
i
i
σσ
ααζ
(6)
AC=P i f,i f,
The elasticity of demand for each firm fi will be defined by the following conditions.
(7) ζσσε i f, j,jji f, j, )(1 + = −
(8)
ε i f,i f,
i f,i f, 1=PMCP
In a fully symmetric equilibrium, we would have ζ=n‐1. However, the calibrated model includes CES weights γ , in each regional CES aggregation function, that will vary for firms from different
regions/countries. Under these conditions, ζ is a quantity weighted measure of market share. To
close the system for regional production, we index total resource costs for sector j in region i by the
resource index Z. Full employment of resources hired by firms in the sector j in region i then implies
the following condition.
(9) TC = Z f i, j,
n
1=fi j,
i
∑

EU‐Andean Trade SIA
114
Cost functions for individual firms are defined as follows:
(10) P )x b + a( = )xC( Zi j,i j,i j,i j, i j,
This specification of monopolistic competition is implemented under the “large group” assumption,
which means that firms treat the variable n as "large", so that the perceived elasticity of demand
equals the elasticity of substitution. The relevant set of equations then collapses to the following:
(11)
X nn = x
n =
]x [ = q
r i, j,0i j,
i j,)/(1
rij
0i j,1
r i, j,rij
rijrij
R
1=i
1
r j,
jj
j
j j
⎟⎟⎠
⎞⎜⎜⎝
⎛ΓΓ−
Γ−
Γ Γ
∑
,,
,,
,,,,
αγ
γ
(12) X ZZ = x i j,
0i j,
1i j,)/(1
ij
jj
⎟⎟⎠
⎞⎜⎜⎝
⎛− ρρ
,
In equation (12), n0 denotes the number of firms in the benchmark. Through calibration, the initial
CES weights in equation (12) include the valuation of variety. As a result, the reduced form exhibits
external scale effects, determined by changes in variety based on firm entry and exit, and
determined by the substitution and scale elasticities.

Draft Interim Technical Report
115
2.6 The composite household and final demand structure
Final demand is determined by an upper‐tier Cobb‐Douglas preference function, which allocates
income in fixed shares to current consumption, investment, and government services. This yields a
fixed savings rate. Government services are produced by a Leontief technology, with
household/government transfers being endogenous. The lower‐tier nest for current consumption is
also specified as a Cobb‐Douglas. The regional capital markets adjust so that changes in savings
match changes in regional investment expenditures170.
2.7 Capital Accumulation and Investment
An important feature of the model involves a savings‐investment‐capital link, whereby the static or
direct income effects of trade liberalization induce shifts in the regional pattern of savings and
investment. These effects have been explored extensively in the trade literature, including Baldwin
and Francois (1999), Smith (1976, 1977), and Srinivasan and Bhagwati (1980). Several studies of
regional and multilateral trade agreements have also incorporated variations on this mechanism.
Such effects compound initial output welfare effects over the medium‐run, and can magnify income
gains or losses. How much these "accumulation effects" will supplement static effects depends on a
number of factors, including the marginal product of capital and underlying savings behavior. In the
present application, we work with a classical savings‐investment mechanism (Francois et al 1996).
This means we model medium‐ to long‐run linkages between changes in income, savings, and
investment. The results reported here therefore include changes in the capital stock, and the
medium‐ to long‐run implications of such changes.
References:
Antweiller, W. and D. Trefler (2002), “Increasing Returns and All That: A View from
Trade,” American Economic Review, 96: March.
Baldwin, R.E. and J.F. Francois (1999), Applied Issues in Dynamic Commercial Policy Analysis,
Cambridge: Cambridge University Press.
Ethier, W. (1982), “National and International Returns to Scale in the Modern Theory of
International Trade,” American Economic Review, 72 (June), 950‐959.
Finger, J.M., U. Reincke, and M. Ingco (1996), The Uruguay Round: Statistics on Tariff
Concessions Given and Received, World Bank: Washington.
170Note that the Cobb-Douglas demand function is a special case of the CDE demand function employed in the standard
GTAP model code. It is implemented through GEMPACK parameter files.

EU‐Andean Trade SIA
116
Fox, Alan K. (1999), "Evaluating the Success of a CGE Model of the Canada‐U.S. Free Trade
Agreement," presented at The Second Annual Conference in Global Economic Analysis, June 20‐22.
Francois, J.F., B. Hoekman, and J. Woerz (2007). “Does Gravity Apply to Nontangibles? estimates of
trade and FDI openness in services, plenary paper at ETSG 2007 annual meetings.
Francois. J.F., H. van Meijl and F. van Tongeren (2005), “Trade Liberalization in the Doha
Development Round,” Economic Policy April: 349‐391.
Francois, J.F., THE NEXT WTO ROUND: North‐South stakes in new market access negotiations , CIES
Adelaide and the Tinbergen Institute, CIES: Adelaide, 2001. ISBN: 086396 474 5.
Francois, J.F. (1998), "Scale economies and imperfect competition in the GTAP model," GTAP
consortium technical paper.
http://www.gtap.agecon.purdue.edu/resources/res_display.asp?RecordID=317
Francois, J.F., B. McDonald and H. Nordstrom (1996), "Trade liberalization and the capital stock in
the GTAP model," GTAP consortium technical paper.
http://www.gtap.agecon.purdue.edu/resources/res_display.asp?RecordID=310)
Francois, J.F. and D.W. Roland‐Holst (1997), "Scale economies and imperfect competition, in
Francois,J.F. and K.A. Reinert, eds. (1997), Applied methods for trade policy analysis: a handbook,
Cambridge University Press: New York.
Hall, R.E. (1988), "The relation between price and marginal cost in U.S. industry", Journal of Political
Economy, Vol. 96, No. 5, pp. 921‐947.
Hertel, T. and M. Tsigas (1996), “The Structure of GTAP,” in Hertel, T., ed., (1996), Global Trade
Analysis, Cambridge University Press: Cambridge MA.
http://www.gtap.agecon.purdue.edu/models/current.asp
Martins, J.O., Scarpetta, S. and D. Pilat (1996), " Mark‐Up Ratios In Manufacturing Industries
Estimates For 14 OECD Countries," OECD Economics Department Working Paper No. 162.
McDougall, R., ed. (2001). The GTAP database ‐‐ version 5, Global Trade Analysis Center: Purdue
University.
Roeger, W. (1995), "Can Imperfect Competition explain the Difference between Primal and Dual
Productivity Measures? Estimates for US manufacturing", Journal of Political Economy, Vol. 103, No. 2,
pp. 316‐330.
Smith, M.A.M (1977), "Capital Accumulation in the Open Two‐Sector Economy," The Economic
Journal 87 (June), 273‐282.

Draft Interim Technical Report
117
Smith, M.A.M. (1976), "Trade, Growth, and Consumption in Alternative Models of Capital
Accumulation," Journal of International Economics 6, (November), 385‐388.
Srinivasan, T.N. and J.N. Bhagwait (1980), "Trade and Welfare in a Steady‐State," Chapter 12 in J.S.
Chipman and C.P Kindelberger, eds., Flexible Exchange Rates and the Balance of Payments,
North‐Holland Publishing.

EU‐Andean Trade SIA
118
Annex 3: Territorial dynamics in Andean countries171
In a context of openness and globalisation, the territorial dynamics that one can observe in Andean
countries is notoriously uneven. There are some territories which show processes of growth,
poverty reduction and social inclusion. Those have evidently taken advantage of the opportunities
of globalisation. However, next to successful cases there are situations in which every indicator of
development is changing in the opposite direction. The local economy is stagnant, people are
leaving due to lack of opportunities, poverty is widespread, governability is weak and sustainability
is seriously threatened. In between there are territories in which the dynamics of development
show mixed outcomes.
Maps 1 to 4 show the situation of each one of Andean countries from such a territorial perspective,
that is taking in account that the occurrence of growth, poverty and inequality segments the
national space and set the conditions under which events such as trade liberalisation may impact
positively on some territories, while it might hinder others.
Map 1. Bolivia: typology of changes in consumption, poverty and inequality between
1992 and 2001
Note for the legend: from left to right each symbol indicates a positive (+) or negative (‐)
change in consumption, poverty or income distribution.
From: Hinojosa and others (2009).
171 This section builds on research findings of the Rural Territorial Dynamics Program (RTD), coordinated by RIMISP. RTD is a
research‐based policy advice and capacity‐development program for rural economic growth, social inclusion and environmental
sustainability in Latin America. (Maps reproduced with authors permission).

Draft Interim Technical Report
119
Map 3. Colombia: typology of changes in consumption, poverty and inequality
between 1993 and 2005
Note for the legend: from left to right each symbol indicates a positive (W) or negative
(L) change in consumption, poverty or income distribution.
From: Hernandez and others (2009).

EU‐Andean Trade SIA
120
Map 4a. Peru: Change in consumption between 1993
and 2005
Map 4b. Peru: Change in poverty between 1993 and
2005
From: Escobal and Ponce (2008)