ethnic minorities in - obv · pdf fileethnic minorities in politics and public life by lukas...
TRANSCRIPT

www.parliament.uk/commons-library | intranet.parliament.uk/commons-library | [email protected] | @commonslibrary
BRIEFING PAPER
Number SN01156, 4 March 2016
Ethnic Minorities in Politics and Public Life
By Lukas Audickas
Inside: 1. The population of the United
Kingdom 2. Parliament 3. The Government and Cabinet 4. Scottish Parliament and
Welsh Assembly 5. Local Councils and the
London Assembly 6. Civil Service 7. Other public sector
organisations

Number SN01156, 4 March 2016 2
Contents Summary and key statistics: 3
1. The population of the United Kingdom 4
2. Parliament 4 2.1 The House of Commons 4
Into the 20th Century 4 After 1945 5
2.2 Ethnic minority women in Parliament 7 2.3 The House of Lords 7 2.4 International comparisons 9
3. The Government and Cabinet 9
4. Scottish Parliament and Welsh Assembly 9
5. Local Councils and the London Assembly 10
6. Civil Service 10
7. Other public sector organisations 10 7.1 Police 10 7.2 Judges 11 7.3 Teachers 11 7.4 Armed forces 11 7.5 National Health Service 11 7.6 National Fire and Rescue Service 11 7.7 Ministerial Appointments 11
Contributing Authors: Richard Cracknell, John Wood, historic analysis
Cover page image copyright: Picture by Mark Dimmock, (Itiafa Akerejol from St Saviour’s and St Olave’s School, Southwark 2010) subject to parliamentary copyright.

3 Ethnic Minorities in Politics and Public Life
Summary and key statistics: Currently more than 6% MPs in the House of Commons and Members of the House of Lords are from an ethnic minority background1.
The latest available estimate from the Office for National Statistics (ONS) Annual Population Survey 2015 indicates that 13% of the UK population are from ethnic minority background.
The number of ethnic minority female MPs in the House of Commons nearly doubled after 2015, from 1.5% (11 of 650) in 2010, to 3.0% (20 of 650) in 2015.
Among Government agencies the non-white population is the most proportionally represented in the Civil Service. In 2015, 11% of Civil Servants were from minority ethnic groups. 2 This compares with 7% in the UK Armed Forces. 3
Among other public sector organizations the NHS has the largest share of ethnic minorities. 17% of all NHS staff and 40% of hospital medical and dental staff in England are from an ethnic minority background4. This compares with 5% of National Fire and Rescue service staff5.
Analysis of ethnic minority representation is difficult, because ethnicity is both sensitive, and difficult to define. Work such as this generally relies on self-definition. The UK Census includes an ‘Ethnicity’ section, as do most staff surveys within major public services. However, it is not a mandatory requirement to disclose such information. Data on the ethnicity of Members is not systematically gathered and is an estimate based upon multiple sources.
1 House of Commons Library, (2016) Briefing Paper – CBP-7483, January 2016; Operation Black Vote (2015) 'BME peers', 2015 2 ONS (2015) ‘Civil Service statistics 2015’, October 2015 3 Ministry of Defence, (2015) UK armed forces quarterly personnel report: 2015, May 2015 4 HSCIC, (2015)’NHS Workforce Statistics in England, Non-medical staff’, March 2015 HSCIC, (2015)’NHS Workforce Statistics in England, Non-medical staff’, March 2015 5 Department for Communities and Local Government (2015) ‘Fire and rescue authorities: operational statistics
bulletin for England 2014 to 2015’ September 2015
Notes: - Figures for ethnic minorities in the House of
Commons, House of Lords, Armed Forces and Civil services are UK wide.
- Figures for ethnic minorities in Police forces and judiciary cover England and Wales
- Estimates for Fire and Rescue Service, teachers, ministerial appointments and NHS staff are for England only.
0 5 10 15 20 25
UK population
Civil Service
Armed forces
House of Commons
House of Lords
%
Share of ethnic minorities
0 5 10 15 20
England Population
NHS
MinisterialAppointments
Teachers
Fire and Rescue Service
Local Councils (England)
%
0 5 10 15 20 25
Scotland population
Local Councils(Scotland)
Scottish Parliament
Wales population
Welsh Assembly
%
0 5 10 15 20 25
England & WalesPopulation
Judiciary
Police
%

Number SN01156, 4 March 2016 4
1. The population of the United Kingdom
The latest available estimate from the ONS Annual Population Survey 2015 indicates 13% of the UK resident population in non-white groups and 87% white ethnic group.6 (See table 1)
Table 1: Ethnic makeup of the United Kingdom (%), Q3 2015
Source: ONS, Annual Population Survey Q3 2015.
In recent years progress has been made in increasing the representation of black and minority-ethnic groups in many areas of public life. After the 2015 General Election there were 41 minority ethnic MPs, 14 more than in the previous Parliament. 6 % MPs are from ethnic minority background. This is 7 % less compared to overall share of ethnic minorities in the UK.
2. Parliament
2.1 The House of Commons Into the 20th Century Struggles by religious minorities to gain representation in Parliament in the 19th Century have parallels with minority ethnic groups’ efforts to increase their representation today. Daniel O’Connell was elected Member for County Clare in Ireland in 1828, but was unable to take his seat, as a Catholic. In 1829, the Catholic Emancipation Act was passed, which allowed Catholics to sit in the House of Commons.
Jews traditionally considered themselves a religious group rather than an ethnic one, and it was religion that stood in the way of them wishing to enter Parliament.7 Lionel Rothschild was the first practising Jew to sit in the House of Commons. He was first elected in 1847 but refused to take the traditional Christian oath of allegiance. Rothschild was elected five times but it was not until the House changed its rules and allowed him to swear on the Old Testament, as a Jew, that he finally took his seat.8
The history of non-white Members of Parliament probably begins with David Ochterlony Dyce Sombre, who was of mixed European and Indian descent. In 1841 he was elected as a Radical-Liberal to the seat of Sudbury, in Suffolk. In 1842, however, Parliament overturned the result citing 'gross, systematic, and extensive bribery' during the campaign, 6 ONS, Annual Population Survey Q3 2015. 7 This is controversial, however. A report of the Institute for Jewish Policy Research
recommended in 2005 that British Jews should present themselves as an ethnic minority. 8 For more information on Jews and Parliament, see The Greville Janner Jewish Tour of
Parliament
England Wales ScotlandNorthern Ireland
United Kingdom
White 85.3 95.6 95.8 98.6 87.0All ethnic minority groups 14.7 4.4 4.2 1.4 13.0
5 Ethnic Minorities in Politics and Public Life
and he and the other Member for the Sudbury division, Frederick Villiers, lost their seats.9 It is possible that John Stewart, elected as MP for Lymington in 1832, was also from a mixed ethnic background.10
Dadabhai Naoroji, born near Mumbai in 1825, was a partner in the first Indian firm established in Britain. He was elected Liberal MP for Finsbury Central from 1892 to 1895. Naoroji was a critic of British rule in India and prominent pro-British Indians decided to put up their own candidate, Mancherjee Bhownaggree (later Sir Mancherjee). He was elected and represented Bethnal Green North-East from 1895 to 1905: the second Indian of unmixed parentage and the first minority ethnic Conservative to sit in Parliament. They were followed by Shapurji Saklatvala who was a Parsi born in Bombay and represented Battersea North for Labour from 1922 to 1923 and as a Communist from 1924 to 1929.11
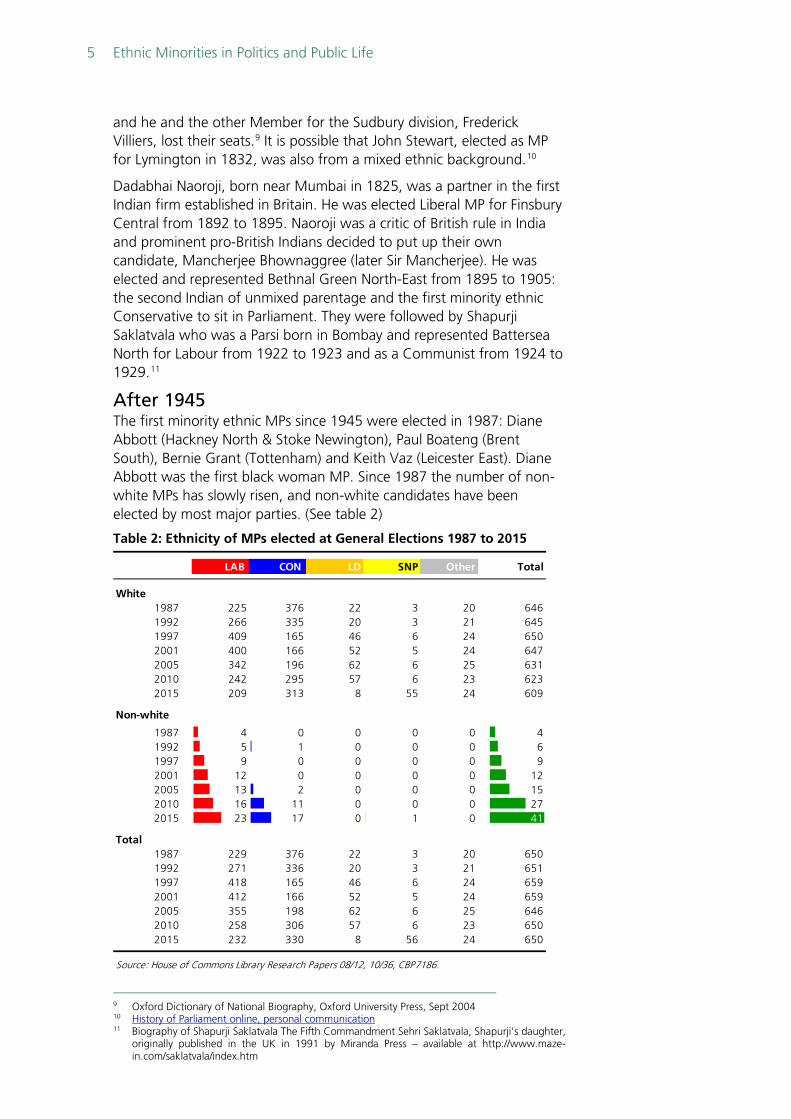
After 1945 The first minority ethnic MPs since 1945 were elected in 1987: Diane Abbott (Hackney North & Stoke Newington), Paul Boateng (Brent South), Bernie Grant (Tottenham) and Keith Vaz (Leicester East). Diane Abbott was the first black woman MP. Since 1987 the number of non-white MPs has slowly risen, and non-white candidates have been elected by most major parties. (See table 2)
Table 2: Ethnicity of MPs elected at General Elections 1987 to 2015
9 Oxford Dictionary of National Biography, Oxford University Press, Sept 2004 10 History of Parliament online, personal communication 11 Biography of Shapurji Saklatvala The Fifth Commandment Sehri Saklatvala, Shapurji's daughter,
originally published in the UK in 1991 by Miranda Press – available at http://www.maze-in.com/saklatvala/index.htm
LAB CON LD SNP Other Total
White1987 225 376 22 3 20 6461992 266 335 20 3 21 6451997 409 165 46 6 24 6502001 400 166 52 5 24 6472005 342 196 62 6 25 6312010 242 295 57 6 23 6232015 209 313 8 55 24 609
Non-white 5 5 5 5 5 51987 4 0 0 0 0 41992 5 1 0 0 0 61997 9 0 0 0 0 92001 12 0 0 0 0 122005 13 2 0 0 0 152010 16 11 0 0 0 272015 23 17 0 1 0 41
Total1987 229 376 22 3 20 6501992 271 336 20 3 21 6511997 418 165 46 6 24 6592001 412 166 52 5 24 6592005 355 198 62 6 25 6462010 258 306 57 6 23 6502015 232 330 8 56 24 650
Source: House of Commons Library Research Papers 08/12, 10/36, CBP7186.

Number SN01156, 4 March 2016 6
After the 2015 General Election 56% (23 of 41) of all ethnic minority MPs are Labour, followed by 41% (17 of 41) Conservative. The first BME SNP MP - Tasmina Ahmed-Sheikh was elected in 2015. No BME Liberal Democrat MPs have been elected at a General Election, although Parmjit Singh Gill won a by-election for them in 2004 in Leicester South; he lost the seat at the subsequent General Election.
At present there are 41 non-white MPs elected to the House of Commons12, 6.3% of all 650 MPs. If the non-white population were represented proportionally in the House of Commons, there would be around 84 minority ethnic MPs.
Table 3 Ethnic Minority Members of Parliament (February 2016)
Source: Operation Black Vote, 2016
12 Operation Black Vote (2016) OBV online data,
Name Constituency Party1 Adam Afriyie Windsor Conservative2 Alok Sharma Reading West Conservative3 Chi Onwurah Newcastle Central Labour4 Chuka Ummuna Streatham Labour5 David Lammy Tottenham Labour6 Diane Abbott Hackney North & Stoke Newington Labour7 Helen Grant Maidstone Conservative8 Keith Vaz Leicester East Labour9 Khalid Mahmood Birmingham, Perry Barr Labour
10 Kwasi Kwarteng Spelthorne Conservative11 Lisa Nandy Wigan Labour12 Mark Hendrick Preston Labour13 Nadhim Zahawi Stratford upon Avon Conservative14 Pritti Patel Witham Conservative15 Rehman Chishti Gillingham & Rainham Conservative16 Rushanara Ali Bethnal Green & Bow Labour17 Sadiq Khan Tooting Labour18 Sajid Javid Bromsgrove Conservative19 Sam Gyimah East Surrey Conservative20 Seema Malhotra Feltham & Heston Labour21 Shabana Mahmood Birmingham Ladywood Labour22 Shailesh Vara North West Cambridgeshire Conservative23 Valerie Vaz Walsall Labour24 Virenda Sharma Ealing Southall Labour25 Yasmin Qureshi Bolton Labour26 Alan Mak Havant Conservative27 Clive Lewis Norwich South Labour28 Dawn Butler Brent South Labour29 Imran Hussain Bradford East Labour30 James Cleverly Braintree Conservative31 Kate Osamor Edmonton Labour32 Naz Shah Bradford West Labour33 Nusrat Ghani Wealden Conservative34 Ranil Jayawardena North East Hampshire Conservative35 Rishi Sunak Richmond (Yorks) Conservative36 Rupa Huq Ealing Central and Acton Labour37 Seema Kennedy South Ribble Conservative38 Suella Fernandes Fareham Conservative39 Tasmina Ahmed-Sheikh Ochil and South Perthshire Scottish National40 Thangam Debbonaire Bristol West Labour41 Tulip Siddiq Hampstead and Kilburn Labour

7 Ethnic Minorities in Politics and Public Life
2.2 Ethnic minority women in Parliament
Chart 1 illustrates ethnic minority MPs distribution by gender and Party. After 2015 General Elections there are 3% (20 of 650) ethnic minority female MPs. This is almost double compared to 1.5% (11 of 650) in 2010. 60% (14 of 23) of non-white Labour MPs are women, compared to 29% (5 of 17) of Conservative MPs. Prior to 2010, there had only been two black female Members and no Asian woman had been elected. The 2010 General Election saw the first Asian women MPs13.
2.3 The House of Lords
Information for the House of Lords is difficult to collate, as no definitive list of ethnic origins exists. In February 2012 following a Freedom of Information request the House of Lords confirmed that information about ethnic origins of the Members is not held14.
There has been several cases when the ethnicity of the peers was identified on individual basis. The first Indian peer and probably the first non-white peer, was Sir Satyendra Sinha, created Baron Sinha of Raipur, an hereditary peerage, in 1919.15 The first peer of African descent is widely reported to have been the Trinidadian cricketer and lawyer Learie Constantine, created Baron Constantine of Maraval and Nelson in 1969.
Based on information from various unofficial sources, including Operation Black Vote, there are currently 51 minority ethnic members of the House of Lords, 6.3% of the total membership of 816 peers.16
Table 4: BME Members of House of Lords, by gender and group, 2015
13 House of Commons Library, (2016) Briefing Paper – CBP-7483, January 2016 14 House of Lords (2012) ‘Freedom of Information Request 796’, February 2012 15 Columbia Encyclopedia, 6th edition, Columbia University Press, 2008 16 Operation Black Vote (2015) 'BME peers', 2015;
0
12
9
21
1
5
14
20
SNP
CON
LAB
Total
Chart 1: Ethnic minority MPs by gender and Party:
2015
Male
Female
0
9
7
16
0
2
9
11
0 10 20 30 40
SNP
CON
LAB
Total
2010
Sources: House of Lords (2016) 'Lords by party, type of peerage and gender', February 2016
Operation Black Vote (2015) 'BME peers', 2015;
The Orator (2015) 'New peers, yet nothing new for black and minority ethnics', September 2015
House of Lords (2014) ‘Membership of the House of Lords: Ethnicity, Religion and Disability’, June 2014
% of Total
Party/group Total Male Female by group Total Male Female
Bishops 1 1 0 3.8% 26 24 2Conservative 8 5 3 3.2% 250 192 58Crossbench 13 8 5 7.3% 178 139 39Labour 15 9 6 7.0% 213 146 67Liberal Democrat 9 4 5 8.3% 108 70 38Non-affiliated 5 4 1 20.0% 25 21 4Other - - - 16 14 2
Total 51 31 20 6.3% 816 606 210
BME All Members of House of Lords
Number SN01156, 4 March 2016 8
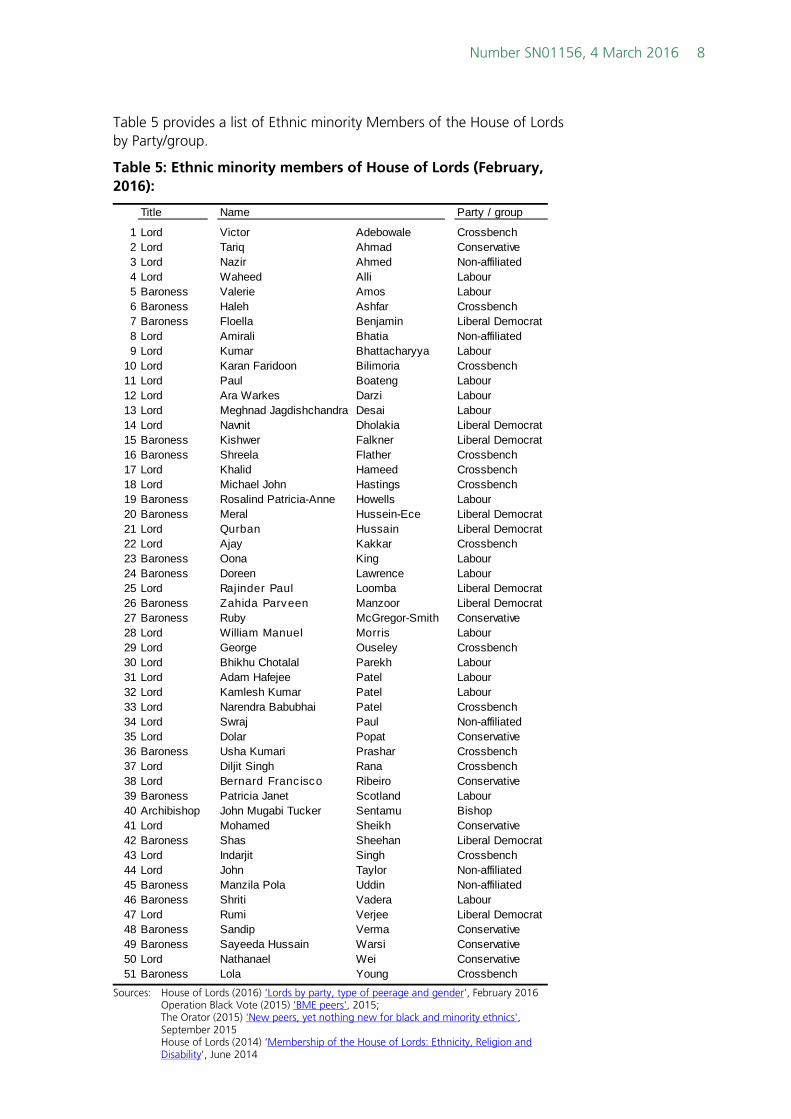
Table 5 provides a list of Ethnic minority Members of the House of Lords by Party/group.
Table 5: Ethnic minority members of House of Lords (February, 2016):
Sources: House of Lords (2016) 'Lords by party, type of peerage and gender', February 2016 Operation Black Vote (2015) 'BME peers', 2015;
The Orator (2015) 'New peers, yet nothing new for black and minority ethnics', September 2015
House of Lords (2014) ‘Membership of the House of Lords: Ethnicity, Religion and Disability’, June 2014
Title Name Party / group
1 Lord Victor Adebowale Crossbench2 Lord Tariq Ahmad Conservative3 Lord Nazir Ahmed Non-affiliated4 Lord Waheed Alli Labour5 Baroness Valerie Amos Labour6 Baroness Haleh Ashfar Crossbench7 Baroness Floella Benjamin Liberal Democrat8 Lord Amirali Bhatia Non-affiliated9 Lord Kumar Bhattacharyya Labour
10 Lord Karan Faridoon Bilimoria Crossbench11 Lord Paul Boateng Labour12 Lord Ara Warkes Darzi Labour13 Lord Meghnad Jagdishchandra Desai Labour14 Lord Navnit Dholakia Liberal Democrat15 Baroness Kishwer Falkner Liberal Democrat16 Baroness Shreela Flather Crossbench17 Lord Khalid Hameed Crossbench18 Lord Michael John Hastings Crossbench19 Baroness Rosalind Patricia-Anne Howells Labour20 Baroness Meral Hussein-Ece Liberal Democrat21 Lord Qurban Hussain Liberal Democrat22 Lord Ajay Kakkar Crossbench23 Baroness Oona King Labour24 Baroness Doreen Lawrence Labour25 Lord Rajinder Paul Loomba Liberal Democrat26 Baroness Zahida Parveen Manzoor Liberal Democrat27 Baroness Ruby McGregor-Smith Conservative28 Lord William Manuel Morris Labour29 Lord George Ouseley Crossbench30 Lord Bhikhu Chotalal Parekh Labour31 Lord Adam Hafejee Patel Labour32 Lord Kamlesh Kumar Patel Labour33 Lord Narendra Babubhai Patel Crossbench34 Lord Swraj Paul Non-affiliated35 Lord Dolar Popat Conservative36 Baroness Usha Kumari Prashar Crossbench37 Lord Diljit Singh Rana Crossbench38 Lord Bernard Francisco Ribeiro Conservative39 Baroness Patricia Janet Scotland Labour40 Archibishop John Mugabi Tucker Sentamu Bishop41 Lord Mohamed Sheikh Conservative42 Baroness Shas Sheehan Liberal Democrat43 Lord Indarjit Singh Crossbench44 Lord John Taylor Non-affiliated45 Baroness Manzila Pola Uddin Non-affiliated46 Baroness Shriti Vadera Labour47 Lord Rumi Verjee Liberal Democrat48 Baroness Sandip Verma Conservative49 Baroness Sayeeda Hussain Warsi Conservative50 Lord Nathanael Wei Conservative51 Baroness Lola Young Crossbench

9 Ethnic Minorities in Politics and Public Life
2.4 International comparisons
In the 114th US Congress (2015-2017) of 435 members of the House of Representatives, 85 (20%) are non-white. Only 6 (6%) of the 100 Senate members are minority ethnic.17 Following the 2010 US Census that 75% of US citizens identified themselves as white and 3% reported more than one race. Charts two and three visualize the non-white distribution in US and UK. 18
In 2013, around 6% of German Federal Parliament members were from migrant background, compared with 19% of total population19. In 2012, 1.5% of ethnic minority in the French National Assembly represented 12.6% of the general population20.
3. The Government and Cabinet Currently there is one BME Cabinet Minister, Sajid Javid (Secretary of State for Business). Priti Patel (Minister of State for Employment) attends the Cabinet. 21
The first minority ethnic minister was probably Baron Sinha, who, after being the first Indian to serve in the Indian government and the first Indian to take silk and become a QC, was made Parliamentary Under-Secretary of State for India in the House of Lords in 1919. The first black government minister was Paul Boateng, who went on to be the first black Cabinet Minister when he was appointed Chief Secretary to the Treasury in 2002. In 2010 he was appointed to the House of Lords.
4. Scottish Parliament and Welsh Assembly
Two of the Scottish Parliament’s 129 members (1.6%) elected in 2011 are minority ethnic, Humza Yousaf (SNP) and Hanzala Malik (Labour), both were elected from the Regional List for Glasgow.22
The number of minority ethnic Members of the National Assembly for Wales went from one to two following the 2011 elections. Vaughan Gething (Labour) joined Mohammad Asghar (Conservative) who had previously been elected for Plaid Cymru in 2007. Together they are 3.3% of the Assembly’s 60 AMs.23
17 Pew Research Center (2015) ‘114th Congress is most diverse ever’, January 2015 18 Fact finder (2010) ‘US population’, US Census 2010data, 2010 19 PSA (2013) ‘Germany’s new parliament: tiny steps towards better immigrant
representation’, November 2013 20 France 24 (2012) ‘Record number of women and minorities in new French Parliament’, June
2012 21 Institute for Government (2015) ’Whitehall statistics: Getting to know the new government’,
May 2015 22 Scottish Parliament (2011) ‘The 2011 Election’, May 2011 23 National Assembly for Wales Research Service (2011) ‘Key Issues for the Fourth Assembly’,
2011
0102030405060708090
100
USpopulation
US Congress US Senate%
Chart 2: Share of white and non-white groups in US 18,19
white
non-white
0 1 2 3 4 5
Scottish Parliament
Scotland population
Welsh Assembly
Wales population
%
Chart 4: Share of ethnic minorities 23 24
0102030405060708090
100
UKpopulation
House ofCommons
House ofLords
%
Chart 3: Share of ethnic minorities in the UK
whitenon-white
Number SN01156, 4 March 2016 10
0 5 10 15 20
GB population
Civil Service
%
Chart 6: Share of ethnic minorities: 30
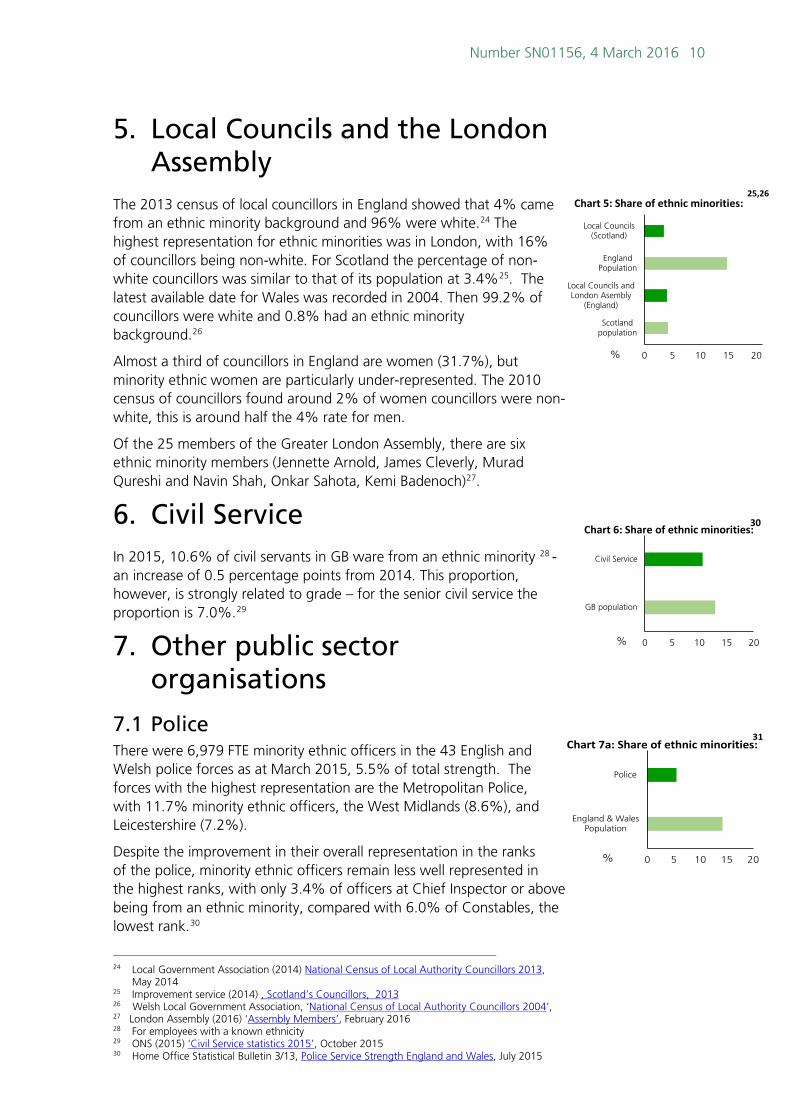
5. Local Councils and the London Assembly
The 2013 census of local councillors in England showed that 4% came from an ethnic minority background and 96% were white.24 The highest representation for ethnic minorities was in London, with 16% of councillors being non-white. For Scotland the percentage of non-white councillors was similar to that of its population at 3.4%25. The latest available date for Wales was recorded in 2004. Then 99.2% of councillors were white and 0.8% had an ethnic minority background.26
Almost a third of councillors in England are women (31.7%), but minority ethnic women are particularly under-represented. The 2010 census of councillors found around 2% of women councillors were non-white, this is around half the 4% rate for men.
Of the 25 members of the Greater London Assembly, there are six ethnic minority members (Jennette Arnold, James Cleverly, Murad Qureshi and Navin Shah, Onkar Sahota, Kemi Badenoch)27.
6. Civil Service In 2015, 10.6% of civil servants in GB ware from an ethnic minority 28 -an increase of 0.5 percentage points from 2014. This proportion, however, is strongly related to grade – for the senior civil service the proportion is 7.0%.29
7. Other public sector organisations
7.1 Police There were 6,979 FTE minority ethnic officers in the 43 English and Welsh police forces as at March 2015, 5.5% of total strength. The forces with the highest representation are the Metropolitan Police, with 11.7% minority ethnic officers, the West Midlands (8.6%), and Leicestershire (7.2%).
Despite the improvement in their overall representation in the ranks of the police, minority ethnic officers remain less well represented in the highest ranks, with only 3.4% of officers at Chief Inspector or above being from an ethnic minority, compared with 6.0% of Constables, the lowest rank.30
24 Local Government Association (2014) National Census of Local Authority Councillors 2013,
May 2014 25 Improvement service (2014) , Scotland’s Councillors, 2013 26 Welsh Local Government Association, ‘National Census of Local Authority Councillors 2004’, 27 London Assembly (2016) ‘Assembly Members’, February 2016 28 For employees with a known ethnicity 29 ONS (2015) ‘Civil Service statistics 2015’, October 2015 30 Home Office Statistical Bulletin 3/13, Police Service Strength England and Wales, July 2015
0 5 10 15 20
Scotlandpopulation
Local Councils andLondon Asembly
(England)
EnglandPopulation
Local Councils(Scotland)
%
Chart 5: Share of ethnic minorities: 25,26
0 5 10 15 20
England & WalesPopulation
Police
%
Chart 7a: Share of ethnic minorities: 31

11 Ethnic Minorities in Politics and Public Life
7.2 Judges The 2015 figures from the Judiciary of England and Wales show that 6% of the total judicial workforce are of ethnic minority backgrounds; however the figures differ by type of judge. The most ethnic diverse appointment at 10.7% is Deputy District Judges for Magistrate Courts, compared to 6.4% in 2011. The proportion non-white decreases for higher ranked judges31.
7.3 Teachers In November 2014, 6.0% of all teachers in publically funded schools in England were from non-white ethnic groups, compared to 6.2% in 2010. The equivalent figure for head-teachers is 2.9%, compared to 2.3% in 2010. 32
7.4 Armed forces In April 2015, 7.0% of the total service men and women in the regular forces are from ethnic minority backgrounds. However, only 2.4% of the officer ranks come from ethnic minorities, compared to 7.5% of other ranks.33
7.5 National Health Service NHS workforce statistics for England indicate that 17.3% of all staff were from ethnic minority background in 2014. The most diverse group in NHS is hospital medical and dental staff, 40.2% from a non-white group, although the proportion falls to 34.8% for the highest staff grade of consultant34.
The share of ethnic minorities is lower among non-medical staff. 15.1% of all non-medical staff are non-white. Likewise 8.4% of managers and senior managers are from an ethnic minority background.35
7.6 National Fire and Rescue Service Operational figures from the fire and rescue authorities in England show that in 2015, the proportion of ethnic minority personnel was 4.6%; up from 4.2% in 2010. The total number of whole-time firefighters from ethnic minority backgrounds in 2015 was 1,149, compared to 1,252 in 2010. 36
7.7 Ministerial Appointments Statistics by the Commissioner for Public Appointments show that in 2014/15 7.7% of appointments were given to those from ethnic minority background, up from 5.5% in 2012/13. 37
31 Courts and Tribunals Judiciary (2015), Diversity Statistics; Judiciary of England and Wales, July
2015 32 Department for Education (2011) School Workforce in England Nov 2010, April 2011; Department for Education (2015) School Workforce in England Nov 2014, July 2015; 33 Ministry of Defence, (2015) UK armed forces quarterly personnel report: 2015, May 2015 34 HSCIC, (2015)’NHS Workforce Statistics in England, Medical and Dental staff’, March 2015 35 HSCIC, (2015)’NHS Workforce Statistics in England, Non-medical staff’, March 2015 36 Department for Communities and Local Government (2015) ‘Fire and rescue authorities:
operational statistics bulletin for England 2014 to 2015’ September 2015 37 Commissioner for Public Appointments (2015) ‘Annual survey of ministerial Appointments and
Reappointments’, 2015
0 5 10 15 20
UK population
Armed forces
%
0 5 10 15 20
England Population
Teachers
%
0 5 10 15 20
EnglandPopulation
Fire and RescueService
%
0 5 10 15 20
EnglandPopulation
MinisterialAppointments
%
0 5 10 15 20
England & WalesPopulation
Judiciary
%
Chart 7b: Share of ethnic minorities: 32--37
0 5 10 15 20
EnglandPopulation
NHS
%

BRIEFING PAPER Number SN01156, 4 March 2016
About the Library The House of Commons Library research service provides MPs and their staff with the impartial briefing and evidence base they need to do their work in scrutinising Government, proposing legislation, and supporting constituents.
As well as providing MPs with a confidential service we publish open briefing papers, which are available on the Parliament website.
Every effort is made to ensure that the information contained in these publically available research briefings is correct at the time of publication. Readers should be aware however that briefings are not necessarily updated or otherwise amended to reflect subsequent changes.
If you have any comments on our briefings please email [email protected]. Authors are available to discuss the content of this briefing only with Members and their staff.
If you have any general questions about the work of the House of Commons you can email [email protected].
Disclaimer This information is provided to Members of Parliament in support of their parliamentary duties. It is a general briefing only and should not be relied on as a substitute for specific advice. The House of Commons or the author(s) shall not be liable for any errors or omissions, or for any loss or damage of any kind arising from its use, and may remove, vary or amend any information at any time without prior notice.
The House of Commons accepts no responsibility for any references or links to, or the content of, information maintained by third parties. This information is provided subject to the conditions of the Open Parliament Licence.