ethnic groups, political exclusion and … · the impact of ethnic group political exclusion on...
TRANSCRIPT
ETHNIC GROUPS, POLITICAL EXCLUSION ANDDOMESTIC TERRORISM
SEUNG-WHAN CHOIa* AND JAMES A. PIAZZAb
aDepartment of Political Science, University of Illinois at Chicago, Chicago, IL, USA; bDepartment ofPolitical Science, The Pennsylvania State University, University Park, PA, USA
(Received 17 May 2014; in final form 1 November 2014)
This study examines whether the exclusion of ethnic groups from political power is an important contributing fac-tor to domestic terrorism. To empirically test this question, we employ a negative binomial regression estimationon 130 countries during the period from 1981 to 2005. We find that countries in which certain ethnic populationsare excluded from political power are significantly more likely to experience domestic terrorist attacks and to sufferfrom terrorist casualties; furthermore, ethnic group political exclusion is a more consistent and substantive predictorof domestic terrorist activity than general political repression or economic discrimination.
Keywords: Domestic terrorism; Ethnic exclusion; Economic discrimination; Political constraints
JEL Codes: H56, D74
INTRODUCTION
Empirical studies deem the political exclusion of ethnic minority groups to be a significantcause of civil war, rebellions and mass political violence (e.g. Lichbach 1987; Moore 1998;Bonneuil and Ariat 2000; Regan and Norton 2005; Wimmer, Cederman, and Min 2009).1
However, the question of whether or not the political marginalization of ethnic groups moti-vates and sustains terrorist activity is largely unexplored. To the best of our knowledge,Piazza’s (2012) study is the only empirical research that examines the effect of minoritypolitical discrimination on domestic terrorism, reporting no significant effect. Thus, with aspecial focus on domestic terrorism, we extend the existing research on minority politicalexclusion and terrorism, contending that political exclusion creates frustration and politicalgrievances among ethnic groups who in turn resort to terrorist violence in an effort toaddress such grievances. One may wonder why such ethnic groups would resort to terror-ism rather than instigate civil war; we argue these groups turn to terrorism because ethnicties enhance their collective security and because fewer material capabilities are necessary
*Corresponding author: Department of Political Science (M/C 276), University of Illinois at Chicago, 1007 W.Harrison St., Chicago, IL 60607-7137, USA. E-mail: [email protected] exclusion is defined as ‘[t]he share of the excluded population [from representation in or influence overthe political executive] in the total population that is ethnopolitically relevant’ (Wimmer, Cederman, and Min 2009,327).
© 2014 Taylor & Francis
Defence and Peace Economics, 2016Vol. 27, No. 1, 37–63, http://dx.doi.org/10.1080/10242694.2014.987579

when limiting operations to a local area. When people resent a government that has failedto recognize their tribal, racial, religious or linguistic group, it is a more common strategyto withdraw from government control through autonomy or semi-autonomy rather than tojump into an insurgency movement; the former requires fewer material capabilities and lesssophistication while still allowing disgruntled people to address their grievances. Terrorism,then, is more cost-effective than civil war and thus becomes a more viable option for ethnicgroups that intend to pursue their political rights through the use of force.
Furthermore, a terrorist movement which develops from a group of people with social,cultural or family ties provides a relatively stable support system. Shared ethnic ties mayallow politically discriminated people to organize more easily into terrorist cells, to morereadily provide emotional encouragement to their members, and more effectively preventdesertion or a breach of security. That is, ethnic groups may be better equipped to carry outsuccessful terrorist operations as their deeply rooted social and cultural bonds provide anenhanced security and loyalty structure. As domestic terrorist organizations tend to createfewer cells and specialized teams, they are smaller in size than international terrorist organi-zations which often operate in several countries. The Mujahideen in Afghanistan and theKurdistan Islamic Movement exemplify such ethnic group-based terrorist operations.
There is also a micro-foundational argument to be made linking the political exclusion ofethnic minorities to the increased probability that members from the excluded communitywill engage in terrorism. Terrorism is frequently defined as a form of political violence per-petrated against civilians. Research by Agnew (2010) and Goodwin (2006) indicates thatmembers of terrorist movements hailing from segments of society experiencing repressionby the government frequently opt to target other civilians who they perceive as ‘complicit’with or as benefitting from government policies, particularly if complicit citizens are viewedas significantly more powerful ‘others.’ We use this framework to anticipate that radicalizedindividuals excluded from political life due to their ethnic background are, therefore, morelikely to see the use of terrorist attacks against ‘complicit’ citizens – members of the ethnicmajority – as legitimate behavior.
Note that several case studies find the political exclusion of ethnic groups to be animportant precipitating factor for the formation of terrorist movements, community supportfor terrorism, and the maintenance of terrorist campaigns (for a summary, Laqueur 1999).For example, formal and informal barriers to influence and representation in governmenthave been credited with starting and fueling Kurdish terrorism in Iraq, Turkey and Iran(Bradley 2006), Moro terrorism in the Philippines (Ergil 2000; Buendia 2005), the LTTE orTamil Tiger separatist movement in Sri Lanka (Van de Voorde 2005), the Basque ETAmovement in Spain (Whitaker 2001), and the resurgence of Irish Republican Army violencein 1968 (O’Hearn 1987). Survey research by Klausen (2005) finds that political – alongwith socioeconomic – exclusion fosters feelings of alienation among Western EuropeanMuslim minority communities and helps to drive radicalization and support for extremism.Other terrorist movements nominally motivated by different concerns frequently invokeethnic issues centering on political marginalization and exclusion as a core driving force.For example, the Maoist Naxalite movement in India began in the late 1960s as anon-sectarian urban guerilla movement aiming to foment a communist insurrection in theState of West Bengal. However, when the Communist Party of India took power in the statelegislature of West Bengal, the Naxalites shifted their struggle to the disenfranchisement ofthe aboriginal (Adivasi) population living in the rural areas across South and Eastern India.Today, the Naxalites are motivated by the issue of Adivasi political exclusion and abuse atthe hands of politically connected landlords (Dash 2006; Gupta 2007). Moreover,
38 S.-W. CHOI AND J.A. PIAZZA

addressing the marginalization and exclusion of ethnic groups has emerged as a key coun-terterrorism tool by the USA and coalition forces in Iraq and Afghanistan (Petraeus 2007).
Our research seeks to advance the scientific study of terrorism by empirically evaluatingthe impact of ethnic group political exclusion on domestic terrorism; thus, we rely on a bat-tery of estimation methods such as negative binomial, rare events logit, negative binomialwith cubic polynomial of time, and generalized estimating equations (GEEs) on cross-national, time-series data for 130 countries during the period from 1981 to 2005. We expectexclusion to most significantly affect the local, rather than the transnational, environmentfor political violence. Although domestic terrorism is more pervasive than transnational ter-rorism and results in substantially more casualties (Jongman 1992), it has, strangely,received less scholarly focus (see, Enders and Sandler 2006; Asal and Rethemeyer 2008a,2008b; LaFree and Ackerman 2009; Chenoweth 2010; Enders, Sandler, and Gaibulloev2011). In this study, we make use of more recently available data on domestic terrorismwhich does not ‘include incidents involving insurgency or guerilla warfare, internecine con-flict, mass murder, and criminal acts’ (Enders, Sandler, and Gaibulloev 2011, 322).2 Moreimportantly, we shed new light on the findings of previous empirical studies which haveexamined the effects of general/aggregate regime-type indicators of political institutions thatmeasure the experience of the modal – majority – citizen. We believe that our analysis ofexcluded ethnic groups is relevant given that terrorist behavior, it is presumed, is more oftenadopted by actors at the political margins of societies than by average citizens (discussionon this by Li 2005; Crenshaw 1981) as political exclusion is, by definition, more frequentlysuffered by ethnic minorities than by the dominant ethnic group.3
We argue that the political exclusion of ethnically different people within a countryincreases the propagation of disgruntled individuals who, in the absence of access to execu-tive power via orderly and nonviolent means, are more likely to support the use of domesticterrorism to address grievances.4 We find that the political exclusion of ethnic groups is amore significant and substantive predictor of domestic terrorism than general restriction ofpolitical participation (Li 2005) or minority economic discrimination (Piazza 2011, 2012), afinding which holds true even after accounting for a possibility of reverse causality. The fol-lowing section introduces the definition of terrorism and then assesses how previous studiesare related to our research topic.
LITERATURE REVIEW
We adopt the definition of terrorism employed by the Global Terrorism Database (GTD):‘the threatened or actual use of illegal force and violence by a non-state actor to attain apolitical, economic, religious or social goal through fear, coercion, or intimidation’ (formore detailed information, see www.start.umd.edu/gtd). Note that the GTD is the data
2Findley and Young’s (2012) geo-referenced terror event data, however, shows a high degree of overlap betweenterrorism and ongoing civil war.3Of course, as in contemporary Syria, there are cases in which the majority is excluded and the ethnic minorityrules. These cases are, however, the exception.4One may suggest that the turn to terrorism is more likely if an excluded population consists of several smallergroups, whereas one large excluded group is more likely to instigate rebellion. This conception might be empiri-cally verifiable with our statistical models only if our concept and operationalization of terrorism were the same asthose of insurgency. By the same token, it is not difficult to imagine that a large excluded group would engage indomestic terrorism – as opposed to insurrection – because they do not necessarily possess a united military powercapable of challenging the government. Simply put, whether an excluded population consists of one large ethnicgroup or many smaller ones, we expect domestic terrorism to arise in most cases where such groups are politicallyexcluded due to their ethnic background.
ETHNIC GROUP POLITICAL EXCLUSION 39

source for the dependent variable for our study. Due to their short time period and smallersample size, other domestic terrorism data-sets – such as the National Memorial Institutefor the Prevention of Terrorism at http://www.mipt.org/, Terrorism in Western Europe:Event Data at http://folk.uib.no/sspje/tweed.htm, and Domestic Terrorist Victims at http://www.march.es/dtv – are of more limited use for the researcher.
While the role of ethno-political exclusion as a precipitant of terrorism has been rarelyaddressed in the context of longitudinal data analysis, related topics, such as the role of regimetype and restriction and/or tolerance of general political participation, have been widely dis-cussed and examined. Though empirical research has generally found that democratic regimesexperience more terrorism than do dictatorships (e.g. Eubank and Weinburg 1994, 2001; Pape2003; Piazza 2008), a frequently cited study by Li (2005) determined that some elements ofdemocratic institutions promote terrorism, while others significantly reduce it. Li found thatconstraints on executive power, a hallmark of democratic rule, actually make states more likelyto experience transnational terrorist attacks; however, he also found that countries with higherrates of popular political participation experience fewer terrorist incidents, suggesting thatbroadening democratic participation will reduce rates of terrorism (Chenoweth 2010).
Our study seeks to further evaluate Li’s (2005) finding. We question the assumption thatfactors such as the degree to which citizens, at an aggregate level, are free from restrictionsagainst political participation are suited to predict fringe behaviors like terrorism. Measure-ments such as state tolerance for political participation operationalize the political status ofthe modal citizen within a country, while terrorist activity is invariably instigated by atypi-cal elites that often hail or derive their support from marginalized and excluded minoritycommunities within society. This mismatch complicates empirical analysis and interpreta-tion of political participation as a valid predictor of terrorism. Li (2005, 238) actuallyalludes to this dilemma in his study by depicting terrorist groups as ‘extremely marginalgroups whose grievances are too narrow to be resolved through a democratic system.’
More importantly, Li’s political participation variable (through voting) may be miscon-strued as a feature that leads to a decrease in transnational terrorism when it may, in fact,have only a spurious effect. Li’s study conceptualizes that the higher the voting rate indemocracies, the less likely transnational terrorism is to occur. However, because politicalnonparticipation (i.e. no voting) is pervasive within many full-fledged democracies such asthe USA, but less so within some emerging democracies, the high level of political partici-pation may not necessarily be associated with a low level of terrorist incidents (DeLuca1995). Furthermore, as Powell (1982) properly points out, the voter turnout rate is affectedby many institutional and attitudinal factors and may have little to do with whether citizenshave a reasonable chance to have their interests represented through elected officials. Sim-ply put, the actual patterns of political participation through voting are quite complex andmay vary from country to country.
This study argues that political participation may not affect terrorism. Low voting ratesmay simply indicate the prevalence of political apathy; political exclusion, on the otherhand, exacerbates terrorism because it is likely to compel ethnic groups to fight for thepolitical rights of which they are deprived. In this context, we expect that the political statusof ethnic communities – the degree to which the political system in their home country inte-grates them into or excludes them from political decision making – is a more likely causaltrigger for domestic terrorism than the overall measure of rates of political participation.5
5Whether political exclusion is a better predictor than political participation is, in the empirical analysis section,determined by the comparison of significance of these variables rather than of their magnitudes. For example, if theformer is significant and the latter is insignificant, the former is considered to be a better predictor of domestic ter-rorism. We discuss the relationship between political exclusion and participation further in the paper.
40 S.-W. CHOI AND J.A. PIAZZA

We, therefore, include Li’s (2005) measure of democratic participation, taken from theVanhannen Index, in the statistical models as a covariate.
Recent research by Piazza (2011) finds that countries qualified by economic discrimina-tion against minority groups – defined using data from the Minorities at Risk (MAR) data-base as groups that collectively suffer from disadvantages in income, housing, employmentand unequal access to government social services – experience higher levels of domesticterrorism. While we expect our research to confirm the above, we have theoretical reason tosuspect that ethno-political exclusion is a distinctly strong and consistent predictor of terror-ism even while considering the possibility of economic discrimination against minoritygroups. For example, research by Fox (1999, 2000) uses Gurr’s basic theory of exclusion,grievance, group identity, and mobilization to link cultural identity-based grievances topolitical violence. For Fox, cultural identities (he focuses mainly on ‘religious cultural com-munal identities’) are essential to people’s everyday lives. When they are threatened, or dis-paraged, potent group grievances are produced that are easily manipulated by extremists;this explains why conflicts over religious identity often result in higher levels of politicalviolence. Juergensmeyer (1993) and Rapoport (1991) make similar observations about theintensity of conflicts over religious and cultural identities, and identify such conflicts asprime vehicles for terrorism. Moreover, Pape’s (2003) research identifies foreign occupa-tion, particularly by foreign powers representing different religious and cultural traditions,as an important motivator for suicide terrorism.
For our study, we regard the political exclusion of ethnic minorities to be an affront ongroup identity insofar as excluded groups share similar religious and cultural heritages. Wethen argue that when their access to state power is deprived, these groups are likely toexpress high levels of grievances and intensified resentment which will, then, motivate theturn toward domestic terrorism. Undoubtedly, the experience of economic discriminationwill also produce collective grievances and motivate terrorism; however, for the purposes ofthis study we regard economic grievances as distinct from motivations of identity politicsand, accordingly, control for minority economic status in our empirics.
WHY ETHNO-POLITICAL EXCLUSION LEADS TO DOMESTIC TERRORISM
There is a strong theoretical base to support the notion that countries with large ethnic pop-ulations excluded from political power would experience higher levels of domestic terroristactivity. Gurr’s (1968, 1970, 1993, 1996, 2000) work on deprivation as a root precipitant ofriots, rebellion, and civil war helps to provide some of the theoretical motivation for ourassertion that political exclusion due to ethnicity is likely to lead the excluded to support orengage in domestic terrorism. Gurr argues that when ethnic and religious – and, in princi-ple, socioeconomic – subgroups within society face collective political and economic depri-vations, such as discrimination or lack of opportunities to participate in mainstream politicalor economic life, several transformations occur, which makes political violence more likely.Initially, core anti-status quo grievances are formed and enhanced among group membersby the experience of exclusion. This experience of grievance prompts the group to developan enhanced sense of collective identity as well as a strong sense of alienation from the eth-nic or religious majority in society, which, in turn, only serves to further reinforce the sal-ience of group grievances. Then, enhanced group identity, alienation, and salient groupgrievances are exploited by elites within the community to radicalize members and mobilizeopposition – both nonviolent and violent – to the state and status quo.
ETHNIC GROUP POLITICAL EXCLUSION 41

Though Gurr is primarily interested in explaining the onset of episodes of mass political vio-lence like rebellions, the thrust of his argument has been applied by other scholars to the forma-tion of terrorist movements within aggrieved ethnic populations and the mobilization ofcommunity support for terrorism. Work by Crenshaw (1981), DeNardo (1985) and Ross(1993) maintains that regimes characterized by political exclusion of ethnic minority groupsare particularly likely to experience terrorism. When ethnic communities experience politicaldiscrimination and formal and informal barriers to equality – Crenshaw (1981, 383) specificallydepicts this situation as ‘ethnic minorities… that are discriminated against by the majority pop-ulation’ – they develop grievances against the state and larger society. These grievances fuelthe construction of social protest movements seeking representation and political change.Fringe elements within the community will demand that direct action takes place outside ofmainstream governing institutions and processes and will, in extreme cases, advocate for terror-ist violence. In the face of state unresponsiveness and continued repression, they will siphoncommunity support away from mainstream nonviolent leaders and will cultivate their capacityto commit armed attacks. Not surprisingly, the demands for inclusion or equal treatment thatcharacterize the social protest movement will grow into stipulations for wider sociopoliticalchange, for greater ethno-political autonomy and/or calls for irredentism and independence.This change in demands is easily manipulated by extremists, greatly radicalizes the community,and raises the likelihood of involvement with terrorist movements.
It should be noted that Piazza’s (2012) study failed to find political discrimination againstminority groups to be a consistently significant and substantive predictor of domestic terror-ism when it was evaluated along with economic discrimination; we expect, however, to finda different result in this study as we operationalize political exclusion differently. We turnto the Ethnic Power Relations (EPR) Database which totals the excluded population on anation-wide basis. This provides a different test of political exclusion as a predictor of ter-rorism and helps to address some of the complications of the Piazza (2012) study, such asselection issues and operationalization of a group-level variable to a national unit of analy-sis. Accordingly, this study expects to find ethno-political exclusion to be a significant,positive predictor of the frequency of domestic terrorist attacks.
H1: Countries with larger numbers of people that are politically excluded due to their ethnic backgroundwill experience more domestic terrorist attacks.
We further reason that as the population size of politically excluded ethnic minorities increases,terrorist attacks become more severe and result in higher numbers of casualties. There are twocomponents to such reasoning. First, we regard numbers of casualties due to terrorism to be areliable accompanying indicator to a raw count of terrorist attacks; while the number of domesticterrorist attacks occurring in a year indicates the frequency of terrorist activity, the count of per-sons killed or injured in terrorist attacks indicates the scope and level of intensity of terroristactivity. Taken together, they provide a more complete picture of overall domestic terrorist activ-ity in a country, thereby increasing our confidence in the findings of the study. Second, the litera-ture suggests that ethno-political exclusion will have a particularly strong effect on terroristcasualties. For example, Kaufman (1996, 1998) demonstrates that violent inter-ethnic conflictsresult in higher casualty rates and more frequent atrocities committed against civilians by partici-pants. These findings are not trivial given that recent studies have noted changes between the‘old terrorism’ of the 1970s and 1980s, which was motivated by ideology, to the ‘new terrorism,’which is motivated by religious and ethnic identity (e.g. Frey and Luechinger 2005; Crain andCrain 2006; Frey, Luechinger, and Stutzer 2007; Asal and Rethemeyer 2008b). This new trendindicates that while the number of incidents is declining, the lethality of incidents is rising, givingway to our second hypothesis.
42 S.-W. CHOI AND J.A. PIAZZA

H2: Countries with larger numbers of people that are politically excluded due to their ethnic backgroundwill experience higher casualties from domestic terrorism.
It is important to make one final note on the nature of the outcome variable. In this study,we examine that ethno-political exclusion is a cause of domestic, as opposed to transna-tional, terrorism.6 Both the qualitative case studies alluded to above and the theoreticalframework developed by Gurr (1968, 1970, 1993, 1996, 2000), Crensahw (1981), DeNardo(1985) and Ross (1993) depict ethno-political exclusion as a precipitant of domestic politi-cal violence and terrorism. In a similar vein, we assert that the experience of political exclu-sion leads to a rise in localized grievances against the state and prompts the formation andmaintenance of terrorist movements that select local targets. We do acknowledge the possi-bility that terrorist groups motivated by political exclusion might perhaps choose to commitsome transnational terrorism to better publicize their grievances and political agendas; how-ever, this is a very rare occurrence, mostly due to the fact that it requires a much higherlevel of sophistication and capacity on the part of the domestic terrorist group. Nonetheless,in the effort to alleviate this possibility, we rerun our statistical models at the monadic levelusing transnational terrorism as the dependent variable. Our findings indicate that thesemodels do not consistently show political exclusion to be a significant predictor.7
DATA
Consistent with the theoretical discussion of the previous section, the dependent variable,domestic terrorism, is measured in two different ways: (1) the total number of domestic ter-rorist incidents that occurred in a given country per year and (2) an annual total of the num-ber of persons killed or wounded in terrorist attacks per country- year. We note that 56% ofthe terrorist incidents have zero values and 65% of the terrorist casualties have zero values.The terrorist casualty indicator has an advantage over total event counts as it captures theunequal degree of severity in each terrorist incident – in terms of deaths and injuries – asopposed to an aggregation of terrorist events of differing magnitude. To measure the activityof domestic terrorism, this study relies on the worldwide domestic terrorism data-set com-piled by Enders, Sandler, and Gaibulloev (2011), researchers who systematically separatedLaFree and Dugan’s (2007) GTD8 into domestic and transnational terrorism after removingnon-terrorist events such as insurgency and guerilla warfare. Enders, Sandler, andGaibulloev underscore that ‘no other article provides such a complete partitioning ofdomestic and transnational incidents’ (Enders, Sandler, and Gaibulloev 2011, 3).
As noted above, the dependent variables count all terrorist incidents and casualties occur-ring within each country, rather than incidents and casualties perpetrated specifically byethno-nationalist terrorist organizations. But, the latter might be preferable insofar as itcould allow us to draw a direct inference on the political exclusion of ethnic groups, ethnicgroup grievances, and ethno-nationalist terrorism as opposed to, for example, the generalpatterns on the exclusion–terrorism connection. However, for a number of reasons, we leavethis task for future research.
6Domestic terrorism is conventionally defined as terrorist attacks in which the perpetrator and the victim, or target,are of the same nationality and the attacks transpires within one country. Transnational terrorism is defined asattacks where the perpetrator and victim are of different nationalities and the attack is either cross-border, launchedin a different country from that of the perpetrator, or launched locally against foreign targets, such as embassies,tourists, or other foreign nationals (Enders and Sandler 2006, 7).7Results are available from the authors.8For more detailed information on GTD, see http://www.start.umd.edu/gtd/.
ETHNIC GROUP POLITICAL EXCLUSION 43

First, this study purports to produce an analysis that is compatible with and comparable tothe bulk of previous cross-national research on the root causes of terrorism; as such, the unitof analysis in this study is the country-year rather than the group-year. In recent years, studieswhich have empirically investigated predictors of terrorism – such as regime-type, types ofdemocratic institutions, respect for rule of law or human rights – have all used country-yearunits (e.g. Li 2005; Wade and Reiter 2007; Choi 2010; Walsh and Piazza 2010). Indeed,recent work on the impact of ethnic minority group statuses on terrorism and armed conflictare also aggregated to the country-year level (e.g. Wimmer, Cederman, and Min 2009; Piazza2011), and this practice is commonplace in the wider armed conflict literature (e.g. Fearonand Laitin 2003). In addition to producing a compatible study capable of adding to the cumu-lative understanding of terrorism, we also incorporate many of the indicators found to be sig-nificant in these studies as controls, all of which are measured at the country-year level.
Second, collecting group-level data on ethno-nationalist attacks is not feasible due to thefact that the perpetrator is known for only about 50% of the cases. More specifically, asDugan (2010, 16), one of the two main compliers of GTD points out, ‘nearly half of theattacks in the GTD are unattributed to any terrorist organization.’ If one’s statistical analysisrelies only on those attacks with known perpetrators, it would be subject to a selection biasthat would distort the empirical results. Ultimately, the re-classification of the GTD at thegroup level has to be withheld until the missing information about the perpetrator has beencollected and properly documented.
The two limitations we describe – the need for compatibility and the lack of perpetrator data– will be addressed in our future research; in the meanwhile, the present study focuses on pro-viding preliminary evidence showing the positive effect of ethnic exclusion on domestic terror-ism at the group-year level. The preliminary results in Appendix 1 are a replication of ethnicgroup Model 1 of Table II in Cederman, Wimmer, and Min’s (2010, 105) study, after havingchanged the dependent variable from ethnonationalist conflict to domestic terrorism.9
The main independent variable, ethno-political exclusion, is the percentage share of theexcluded population in the total population that is ethnopolitically relevant; this variable isderived from the EPR data-set.10 When ethnic groups are capable of achieving only a nomi-nal level of political mobilization or are subjected to intentional political discrimination dueto their ethnic background, they are coded by EPR as ethnopolitically relevant. Politicalexclusion occurs when a particular ethnic group’s members are barred from service or repre-sentation in the executive branch of government. The executive branch includes the politicalexecutive, such as presidential and government cabinet and executive offices, as well as thetop ranks of national militaries and bureaucracies (Wimmer, Cederman, and Min 2009;Cederman, Wimmer, and Min 2010). To correct the positive skew of the data, this study fol-lows Wimmer, Cederman, and Min’s (2009) approach by using its logged transformation,which is consistent with the assumption that an increase in the proportion of the excludedpopulation has a greater effect on the likelihood of terrorism at lower levels of exclusionthan at higher levels. As shown in Appendix 2 Descriptive Statistics, the logged politicalexclusion variable ranges from 0 to 4.52 with a mean value of 1.82.11 When the variable is
9Following Wimmer, Cederman, and Min’s research program on ethnic politics and civil war which began withcountry-year analysis (Wimmer, Cederman, and Min 2009) and then moved on to group-year analysis (Cederman,Wimmer, and Min 2010), we also wish to gradually develop a research program from country to group level. Ourfuture research should enable us to better respond to the concern that the group-year level analysis offers a betterassessment of a possible correlation between the size of the excluded population and domestic terrorism (asopposed to whether excluded groups actually engage in more terrorism).10The data and the codebook can be found at http://dvn.iq.harvard.edu/dvn/dv/epr/faces/study/StudyPage.xhtml?globalId=hdl:1902.1/11796&tab=files&studyListingIndex=0_038423516cef4f8d7855ab866ca5.11A more complete description of the political exclusion variable can be found in Appendix 3.
44 S.-W. CHOI AND J.A. PIAZZA

converted to a level term, the minimum value is 1, the maximum value is 92, and the meanis 6 on a scale of 0–100.
Our models also include measures of democratic political participation and economic dis-crimination against minorities, taken from Li’s (2005) and Piazza’s (2011) studies, respectively,and updated for this study. Political participation is expected to reduce domestic terrorism andis operationalized using the participation component of the Vanhannen Index; economic dis-crimination, on the other hand, is expected to increase domestic terrorism and is a dummy vari-able coded as ‘1’ for observations where minority groups suffer from some level of economicdeprivation vis-à-vis the majority population. This measurement is the same as that used byPiazza (2011) and is derived from the MAR database. To remain consistent with Li (2005), wealso include an indicator measuring executive constraints in all of the models that include polit-ical participation. Executive constraints are expected to increase domestic terrorism as theytend to tie the hands of executives who would otherwise implement strict counterterrorismmeasures. The data comes from Li’s (2005) study and is updated for this study.
Appendix 4 provides a correlation matrix of five independent variables of interest (i.e.political exclusion, political rights, political participation, executive constraints, and eco-nomic discrimination). It turns out that the highest correlation is only 0.30 between politicalexclusion and economic discrimination. It is also worth noting that the relationship betweenpolitical exclusion and political participation is negative and strikingly weak (−0.09); thisindicates that these two variables are conceptually and empirically distinct, as noted earlier.The correlation between exclusion and political rights is only −0.25, providing no evidencethat the two measures capture the same concept.
To avoid omitted variable bias, eight more control variables are included: politicalrights,12 ethnic fractionalization, state failure, a measure of human rights protections, inde-pendent judiciary, economic development, population, and a lagged term for the dependentvariable. These eight variables are chosen based on previous studies which have shown theyhold some impact on terrorist activity.13 Previous studies assert that democratic institutionsallow more terrorist activity due to the commitment to individual freedoms;14 Abadie(2006), for example, finds evidence that political rights are positively associated with terror-ist risk ratings (Eubank and Weinberg 1994, 2001). In accordance with these findings, weexpect that the promotion of political rights will increase the risk of domestic terrorism.The political rights variable is recorded as ‘7’ for the highest level of civil liberties and as‘1’ for the lowest. Data is collected from the Freedom House’s Political Rights Index.15 Itshould be noted that when the political rights control is included for estimation, politicalparticipation and executive constraints are excluded due to multicollinearity concerns; thecorrelation between political rights and participation, for example, is 0.80.
12When democracy is included instead of political rights, the results are similar to those reported in this study: it isa positive predictor of domestic terrorism. The democracy variable is taken from the Polity data-set and rangesfrom 10 (full democracy) to −10 (full autocracy) (Marshall and Jaggers 2007).13The discussion of the eight control variables is presented with the understanding that they are likely to affectinternational as well as domestic terrorism for similar reasons. For example, Savun and Phillips (2009, 879) make anote that ‘if democracies are prone to transnational terrorism by design, as most existing theoretical arguments sug-gest, then democracies should be vulnerable to domestic terrorism as well.’ Young and Findley (2011, 422) alsopoint out that ‘Li’s arguments [on the relationship between democracy and transnational terrorism] may be accuratewhen we apply his reasoning to domestic terrorism as opposed to the transnational form.’ More importantly, arecent paper by Kis-Katos et al. (2011) shows that domestic and transnational terrorism share similar causal roots.14Other studies, however, show that democracy is inversely proportional to terrorism since it provides peacefulchannels of conflict resolution (e.g. Schmid 1992; Eyerman 1998; Choi and James 2005; Li 2005; Choi 2010).15It should be noted that, unlike the EPR data-set, the Freedom House’s assessment of political rights is not basedon political exclusion of ‘ethnic groups.’
ETHNIC GROUP POLITICAL EXCLUSION 45

Kurrild-Klitgaard, Justesen, and Klemmensen (2006) find that while linguistic fractional-ization does drive terrorism, ethnic fractionalization does not (Blomberg and Hess 2008;Drakos and Gofas 2006; Sambanis 2008). However, most studies find that a measure of eth-nic fractionalization may induce more terrorist attacks (Tavares 2004; Piazza 2006, 2008).Given that there is some evidence for the idea that ethnic diversity encourages terroristattacks, this study includes it as a control and hypothesizes a positive relationship betweenethnic fractionalization and domestic terrorism. Fearon and Laitin’s (2003) ethnic fractional-ization data is used for estimation.
Failed states in which the central government is too weak to exercise legal authority overmuch of its territory are bound to attract domestic terrorists as they afford good opportuni-ties for terrorist groups to form, recruit, plan, and launch attacks (Rotberg 2002). Severalrecent studies provide empirical evidence on the linkage between failed states and terrorism(e.g. LaFree, Dugan, and Fahey 2007; Piazza 2008); we therefore include a control for statefailure, using the same indicator Piazza (2008) derived from the Political Instability TaskForce (PITF) (2007). The failed state variable ranges from 0 to 17 and is created by com-bining the severity of ethnic wars (0–4), revolutionary wars (0–4), adverse regime changes(1–4), and genocides and politicides (0–5). It is worth noting that the severity levels mea-sured in the PITF data are not likely affected by domestic terrorist activity (i.e. the possibil-ity of reverse causality) because the former are based on the number of deaths occurringand the size of the geographic territory affected by the particular failure. Nonetheless, as acheck for robustness we did rerun the models while excluding the state failure covariate,producing the same core results.
Walsh and Piazza’s (2010) study produced robust findings, showing that countries withhigher levels of human rights protections experienced less terrorism. This finding has beenreproduced in several subsequent studies (e.g. Piazza and Walsh 2010). Our models, there-fore, include the measure of respect for physical integrity rights – the right not to be abusedor harmed – used by Walsh and Piazza (2010). Our expectation is that it will be a negativepredictor of terrorism because promotion of physical integrity rights will reduce the level ofabuse and thus produce fewer grievances.
Choi (2010) demonstrates that when an independent judiciary with fair-minded judgesand police officers is present in a rule of law society, the risk of terrorism is small. Similarly,Findley and Young (2011) posit that independent judiciaries make government commitmentsseem more credible, thereby dis-incentivizing the use of terrorism; their results, then, providesupport for the credible commitment logic. Consistent with these findings, we expect that thepresence (or absence) of an independent judiciary is likely to decrease (or increase) thefrequency of terrorist incidents. Data is garnered from Henisz’s (2000) POLCON database.
Several recent empirical studies also consider the effects of poverty and economicdevelopment on terrorism (e.g. Li 2005; Wade and Reiter 2007; Freytag et al. 2011; Choiforthcoming; Choi and Luo 2013; Choi 2014). When a large percentage of a given country’spopulation lives below the poverty line, terrorist groups may find it easier to recruit thedisgruntled. People whose basic needs, such as clean water, nutrition, health care, education,clothing and shelter, are not fulfilled find fault with those who discriminate against theirsocial welfare – namely, the government and the rich. For this reason, the economicdevelopment variable is included as a control for its effect on terrorism. It is measured by thelogged real GDP per capita, adjusted for purchasing power parity.16 Data for this variable is
16Other possible poverty measures such as the Gini coefficient are not used because missing observation issuesloom large and data is not annual.
46 S.-W. CHOI AND J.A. PIAZZA

obtained from Gleditsch (2002) and is updated with base data from the new 6.3 version ofthe Penn World Tables (Heston, Summers, and Aten, August 2009).
Countries with large populations often find it difficult to provide adequate levels of secu-rity measures, resulting in greater vulnerability to terrorist plots and attacks (Eyerman1998). In fact, Savun and Phillips (2009) find evidence that highly populated countriesexperience more domestic terrorist incidents. With this in mind, the population variable,measured by the logged total population, is projected to increase the rate of terrorism due tothe relative difficulty of successfully policing a larger population. Data for this variable istaken from the US Census Bureau (2008).
When countries experience domestic terrorism in a given year, they are at a greater riskof experiencing terrorism in the following year; thus, this study controls for the history ofdomestic terrorism within countries by adding a lagged dependent variable on the right-hand side of the equation and by employing Li’s (2005) moving average of past terroristevents. Because these two measures do not lead to a substantive change in the main empiri-cal finding of this study, we report only the estimates of the former. However, it should benoted that although the lagged dependent variable has the potential to ‘soak up’ the explan-atory power of theoretically interesting independent variables (Achen 2000), previousresearch demonstrates it is theoretically appropriate that countries with past incidents ofdomestic terrorism are likely to be more vulnerable to terrorism in the present or in thefuture (Savun and Phillips 2009; Young and Findlely 2011).
In order to test the aforementioned hypotheses, we collect a cross-national, time-seriesdata on 130 countries during the period from 1981 to 2005. The study period is based onthe fact that one of the control variables (physical integrity rights) is available only after1981 (Cingranelli and Richards 2010; Walsh and Piazza 2010)17 and that the ethno-politicalexclusion data ends in 2005 (Wimmer, Cederman, and Min 2009). Our unit of analysis isthe country-year. As the dependent variable is operationalized as the total number of terror-ist events per year, this study employs a standard estimation method for count data, i.e. neg-ative binomial maximum-likelihood regression with Huber-White robust standard errors,clustered by country. This estimation method is chosen over Poisson regression because thevariance of the dependent variables is much larger than the mean (Greene 2003; Long andFreese 2006; Hilbe 2007). To further verify the results of these estimates, we use rare eventslogit, negative binomial regression with cubic polynomial of time, and GEEs. All predic-tors, barring economic discrimination and ethnic fractionalization, which are time-invariant,are lagged one year behind the outcome variable, ensuring that the predictors are betterassociated with the outcome variable.
RESULTS
This section discusses the statistical significance of estimated coefficients and introducesanalyses of their substantive effects. Table I presents the results of the main negative
17When the Political Terror Scale (PTS), another data source for human rights, is instead used, the study period canbe extended to 1976 (Wood and Gibney 2010). However, the results are not discussed here because they are virtu-ally identical to those reported in the next section. The similarity is attributed to the fact that the PTS relies on thesame source materials as the physical integrity rights of the CIRI index. In order to cover a longer time period, wehave conducted statistical analysis after excluding the physical integrity rights variable. Because this analysis doesnot change the significance of political exclusion in any meaningful way, the results are not reported. This findingis also an indication that selection bias is unlikely to be an issue, as it is not subject to the data availability of con-trol variables.
ETHNIC GROUP POLITICAL EXCLUSION 47

TABLEI
The
effect
ofpolitical
exclusionon
domestic
terrorism,1981–2
005 Negativebino
mialregression
Terroristincidents
Terroristcasualties
Variable
Mod
el1
Model
2Model
3Model
4Mod
el5
Model
6Model
7Model
8Mod
el9
Model
10
Politicalexclusion
0.18
9***
0.195*
**0.185*
*0.17
2**
0.10
3**
0.272*
**0.260*
**0.29
7***
0.267*
**0.138*
(0.059
)(0.063
)(0.065
)(0.066
)(0.038
)(0.073
)(0.082
)(0.082
)(0.084
)(0.063
)
Politicalparticipation(Vanhanen)
−0.10
8−0.100
0.016
−0.080
−0.058
−0.02
5
(0.089
)(0.089
)(0.064
)(0.108
)(0.114
)(0.055
)
Executiv
econstraint
(polity
)0.299*
**0.21
2**
0.119*
0.266*
**0.187*
*0.182*
*
(0.081
)(0.073
)(0.060
)(0.063
)(0.081
)(0.064
)
Economicdiscrimination
0.352*
0.394*
0.048
0.334
0.314
0.263*
(0.173
)(0.177
)(0.124
)(0.246
)(0.260
)(0.125
)
Politcal
rights
0.26
1***
0.207*
**0.241*
**0.16
8**
(0.050
)(0.055
)(0.058
)(0.065
)
Ethnicfractio
nalization
−0.956*
*−0.86
6**
−0.96
7**
−0.843*
0.307
−1.14
1**
−0.796*
−1.264*
*−0.967*
0.184
(0.356
)(0.370
)(0.390
)(0.378
)(0.248
)(0.465
)(0.478
)(0.525
)(0.505
)(0.218
)
State
failu
re0.224***
0.215***
0.247**
0.239**
0.166***
0.412***
0.452***
0.448***
0.477***
0.138***
(0.051
)(0.060
)(0.085
)(0.093
)(0.023
)(0.105
)(0.121
)(0.133
)(0.147
)(0.022
)
Phy
sicalintegrity
rights
−0.210*
**−0.196*
**−0.16
8***
−0.157*
**−0.103*
**−0.32
7***
−0.319*
**−0.260*
**−0.249*
**−0.22
1***
(0.035
)(0.040
)(0.037
)(0.039
)(0.023
)(0.046
)(0.049
)(0.053
)(0.053
)(0.026
)
Independentjudiciary
−0.431*
*−0.50
4**
−0.352*
−0.398*
*0.010
−0.33
4−0.298
−0.265
−0.210
0.067
(0.175
)(0.177
)(0.163
)(0.155
)(0.103
)(0.235
)(0.243
)(0.266
)(0.286
)(0.121
)
Econo
micdevelopm
ent
0.07
30.158
−0.046
0.05
90.47
2***
−0.13
0−0.047
−0.261*
−0.202
0.169*
(0.106
)(0.111)
(0.113
)(0.114
)(0.079
)(0.122
)(0.131
)(0.154
)(0.165
)(0.075
)
Pop
ulation
0.47
5***
0.487*
**0.511*
**0.490*
**0.15
1***
0.849*
**0.831*
**0.89
7***
0.872*
**0.106*
*
(0.073
)(0.076
)(0.073
)(0.072
)(0.045
)(0.093
)(0.093
)(0.103
)(0.102
)(0.041
)
Laggedterrorism
0.02
4***
0.023*
**0.020*
**0.020*
**0.00
3***
0.002*
**0.002*
*0.00
2**
0.002*
*0.000*
**
(0.005
)(0.005
)(0.005
)(0.005
)(0.000
)(0.001
)(0.001
)(0.001
)(0.001
)(0.000
)
48 S.-W. CHOI AND J.A. PIAZZA

Con
stant
−4.457*
**−4.950*
**−3.99
6***
−4.269*
**−7.257*
**−4.60
6***
−4.985*
**−4.175*
*−4.325*
*−4.93
1***
(0.951
)(1.048
)(1.009
)(1.055
)(0.767
)(1.131
)(1.176
)(1.386
)(1.472
)(0.667
)
WaldChi
236
2.57
417.86
419.54
428.05
939.61
410.93
424.31
337.28
342.91
631.04
Prob>Chi
20.00
10.001
0.001
0.00
10.001
0.001
0.001
0.00
10.001
0.001
Log
Pseud
olikelihoo
d−57
30.67
−54
37.57
−39
40.85
−38
51.94
−28
58.18
−64
87.29
−61
42.49
−45
51.37
−44
34.93
−34
02.26
Dispersion=1
3.41
3.33
3.15
3.16
n/a
8.34
8.16
8.05
8.03
n/a
Cou
ntry
andyear
fixed-effects
nono
nono
yes
nono
nono
yes
Observatio
ns27
9426
2019
2118
6517
8127
9426
2019
2118
6516
99
Note:
Robuststandard
errors
arein
parentheses.
*p<.05
**p<.01
***p
<.001,one-tailedtests.
ETHNIC GROUP POLITICAL EXCLUSION 49

binomial regression models of this study; a one-tailed test at the 0.05, 0.01, and 0.001 levelsis utilized because the hypotheses are directional.
Models 1 through 5 display results where the dependent variable is domestic terroristincidents per country-year. In Model 1, political exclusion is included as a predictor alongwith all of the controls including Political rights. In Model 2, the Political rights covariateis dropped from the model and in its place are the two democratic institutions variablesfound by Li (2005) to be significant: Political participation (Vanhanen) and Executive con-straints (Polity).18 In Model 3, Piazza’s (2011) Economic discrimination is added and Politi-cal participation (Vanhanen) and Executive constraints (Polity) are dropped while Politicalrights is controlled. Model 4 combines both of Li’s (2005) democratic institutions variableswith economic discrimination in the same model but drops the Political rights measure.19
The arrangement in Models 1 through 4 allows for an examination of the effects of a fullbattery of covariates against the significance of political exclusion, and also presents a vari-ety of different permutations of democracy-related variables. Model 5 replicates Model 4after adding country and year fixed-effects. Models 6 through 10, in which the dependentvariable is domestic terrorist casualties, use the same format.
Across all models – 1 through 10 – political exclusion proves to be a strongly significantpositive predictor of domestic terrorism. In Models 1 through 5, political exclusion predictsincidents of domestic terrorism at either the .01 or .001 level. In Models 6 through 10,political exclusion emerges as a significant and positive predictor of terrorist casualties.20
These findings remain robust regardless of an alternative set of covariates and model speci-fications, once more indicating that as a country politically excludes more of its citizens onthe basis of ethnicity, it is more likely to experience domestic terrorism; consequently, itscitizens suffer from higher casualties due to the increase in terrorist activity. The overallresults of Table I yield support for Hypotheses 1 and 2.
While Table I reports executive constraints to be consistently positive and significant, itshows that political participation, across all models, lacks significance. In Models 1 through10, regardless of the specification or of the inclusion or exclusion of covariates, politicalparticipation is not significant, although its coefficient is negative, as expected. This is incontrast to Li’s (2005) finding that countries with higher levels of overall political participa-tion experience fewer terrorist attacks.21 The ‘null’ finding on political participation sup-ports our theoretical expectation. Given that political exclusion is a measure bettergrounded in the theory of ethnic group grievance and mobilization for political violenceand better suited to predict the behavior of fringe, non-modal disgruntled political actors, itis a stronger and more consistent predictor of terrorist attacks and casualties than is thedegree of overall political participation in society.
18This study also replicates Model 2 after dropping Political participation (Vanhanen) in order to assuage the con-cern that Political exclusion and Political participation (Vanhanen) may capture a similar political phenomenon;however, the exclusion of the political participation variable does not change the main results that can be obtainedupon request.19We have conducted two sets of diagnostic tests for multicollinearity: variance inflation factors and R2 statistics(see Belsley, Kuh, and Welsch 1980; Gujarati 2003). As shown in Appendix 5, no severe multicollinearity is foundamong the predictors.20Another way to test the severity of terrorist attacks in terms of casualties is to use casualties per terrorist attack.The rationale for this measure is that if a country, ceteris paribus, experiences more attacks, there may be morecasualties. The results are consistent with Models 6–10 in Table I: political exclusion is positively associated withdomestic terrorist casualties. It should be noted that the estimation was performed after a majority of observationswere dropped due to the division of casualties by terrorist attack, each of which contained many zero values. Forthis reason, the estimated coefficients and standard errors are not reported.21It should be noted that Li’s finding was based solely on transnational terrorism.
50 S.-W. CHOI AND J.A. PIAZZA

The results produced for economic discrimination, however, are more ambiguous. It is asignificant positive predictor of domestic terrorist attacks in Models 3 and 4, but not a sig-nificant predictor of domestic terrorist casualties in Models 8 and 9. These findings offersome support for our expectation that political exclusion is important apart from its being afunction of economic discrimination against minorities; we note that political exclusion is astrong and distinct predictor of terrorism, remaining robust after the inclusion of indicatorsof minority economic status or economic forms of minority discrimination and exclusion.This assessment is based on the fact that political exclusion is consistently significant andin the expected direction across models, while economic discrimination fails to achieve sig-nificance with respect to casualties.22 Furthermore, we examined interaction effects forpolitical and economic discrimination. In these models, the coefficient of political exclusionindicates its considerable influence on terrorism when both minority economic discrimina-tion and the interaction term are set at zero. Because political exclusion is significant and inthe hypothesized direction while minority economic discrimination and the interaction termare not significantly different from zero, it is clear that ethnic group political exclusionexerts a distinct and significant effect on domestic terrorism.23
Many of the controls also prove to be significant in our models. State failure is consis-tently significant at the .01 or .001 level in the models, while protection of human rights(Physical integrity rights) is a significant negative predictor of both terrorist attacks andcasualties at the highest levels across model specifications. The results show that more pop-ulous countries experience more terrorism across all models, while previous terrorist attacksor terrorist casualties – the lagged dependent variable – is consistently a significant andpositive predictor in all models. Ethnic fractionalization, an indicator expected to be a sig-nificant and positive predictor of terrorism, is instead (for the most part) a consistently nega-tive predictor of terrorist attacks and casualties. This would suggest that countries with highlevels of ethnic diversity experience less terrorism and suffer fewer terrorist casualties.While the independent judiciary variable is shown to predict lower levels of terroristattacks, it is not a significant predictor of terrorist casualties. Economic development, itappears, is not a significant predictor at all; this is consistent with findings by Piazza (2006)that poverty and poor economic development are not linked to terrorism, at least not in anystraightforward manner.
This study also argues that political exclusion is a more substantive contributor to domes-tic terrorism than either aggregate political participation or economic discrimination sufferedby minorities. For comparison purposes, we estimate the substantive effects of the mainindependent variables on domestic terrorism incidents and casualties, ultimately finding sup-port for our argument. To calculate a baseline probability of a domestic terrorist incidentagainst which to make comparisons, we set the continuous variables at their means and thedichotomized variables at ‘0.’ We then adjust the variables of interest one at a time in orderto see the percentage change in the predicted probability of terrorism. Table II reports thesubstantive effects of the relationships between political exclusion, political participation,executive constraints, economic discrimination and terrorist attacks and casualties shown inTable I. The substantive effects are consistent with the statistical effects. For example, when
22While Piazza’s (2011, 2012) studies report the significance of economic discrimination, it should be noted that helooks at international terrorism and total terrorism in addition to domestic terrorism. As shown in Appendix 6 thatreplicate Model 3 in which economic discrimination is pitted against political exclusion, we also find a similar sig-nificant effect of the variable in case of terrorist incidents but not in case of terrorist casualties. This finding is notsurprising because the dependent variable in Piazza’s studies is terrorist incidents and not terrorist casualties whileour study tests both measures.23Results are available from the authors.
ETHNIC GROUP POLITICAL EXCLUSION 51

a country’s score on political exclusion changes from ‘25 percentile’ to ‘50 percentile,’ thepercentage change in the likelihood of domestic terrorist incidents increases by 37%, from‘50 percentile’ to ‘75 percentile’ by 80%, and from ‘75 percentile’ to ‘99 percentile’ by116% (see the shaded rows in the first column). It appears that political participation exertsa dampening effect on domestic terrorism in Table II; however, it is important to note thatthe variable was not statistically significant in Table I, thereby its substantive effect is of lit-tle interest. On the other hand, executive constraints and economic discrimination do appearto produce positive substantive effects on the level of domestic terrorist activity; when theoutcome variable is terrorist casualties instead of the number of terrorist incidents, a similarpattern appears across models. All in all, our findings suggest the substantive effect of polit-ical exclusion on domestic terrorism is more meaningful than those of the other causal fac-tors.
ROBUSTNESS TESTS
To test the robustness of the results in the study, we apply several alternative estimationmethods and specifications. Table III evaluates the robustness of the results reported inModels 4 and 9 of Table I by employing three different statistical estimators: rare eventslogit, negative binomial with cubic polynomial of time, and GEEs.24
In order to address potential problems associated with excessive zero observations in theterrorism data, we employ a rare events logistical modeling technique, an estimation toolwhich truncates the dependent variable (Tomz, King, and Zeng 1999; King and Zeng 2001;Choi 2010). To run this logit technique, the event count-dependent variable is converted
TABLE II The substantive effects of variables of interest
Negative binomial regression
Terrorist incidents Terrorist casualties
Variable In Model 4 In Model 9
Political exclusion
50 percentile 37% 63%
75 percentile 80% 149%
99 percentile 116% 231%
Political participation (Vanhanen)
50 percentile −5% −3%
75 percentile −22% −13%
99 percentile −22% −13%
Executive constraint (Polity)
50 percentile 24% 21%
75 percentile 63% 54%
99 percentile 89% 75%
Economic discrimination
From 0 to 1 48% 37%
Note: Of the variables, political participation (Vanhanen) failed to achieve significance in both models.
24We also employ zero-inflated negative binomial regression (Greene 2003; Long and Freese 2006; Hilbe 2007).We find that the political exclusion variable is significant in the expected direction with respect to terrorist inci-dents; however, when the dependent variable is casualties, the estimation fails to converge, producing no coeffi-cients or standard errors.
52 S.-W. CHOI AND J.A. PIAZZA

into a dichotomous measure, coded as ‘1’ if any terrorist incidents or casualties are recordedin an observation and as ‘0’ otherwise. To deal with the issue of time dependence betweenterrorist events, we employ Beck, Katz, and Tucker’s (1998) logit splines and Carter andSignorino’s (2010) cubic polynomial of time. Because these two models are designed toaddress temporal dependence in statistical data, they should serve as appropriate estimationtechniques for our terrorism data. Models 11 and 12 in Table III report the results of rareevents logit, while Models 13 and 14 show those of negative binomial regression with cubicpolynomial of time.25 Not surprisingly, the political exclusion variable is significant across
TABLE III The effect of political exclusion on domestic terrorism, 1981–2005: robustness tests
Rare events logit
Cubic polynomial of
T† GEEs
Terrorism Casualty Terrorism Casualty Terrorism Casualty
Variable Model 11 Model 12 Model 13 Model 14 Model 15 Model 16
Political exclusion 0.083* 0.101* 0.136** 0.306*** 0.202* 0.283**
(0.043) (0.044) (0.052) (0.079) (0.098) (0.094)
Political participation (Vanhanen) −0.119* −0.066 −0.043 −0.072 −0.140 −0.050
(0.056) (0.058) (0.066) (0.113) (0.103) (0.124)
Executive constraint (Polity) 0.117 0.127 0.100 0.052 0.331*** 0.250*
(0.077) (0.082) (0.064) (0.089) (0.089) (0.111)
Economic discrimination 0.309** 0.305** 0.254* 0.282 0.389* 0.371
(0.120) (0.128) (0.140) (0.276) (0.217) (0.280)
Ethnic fractionalization −0.000 −0.176 −0.736** −0.412 −1.027* −1.146*
(0.242) (0.246) (0.297) (0.455) (0.463) (0.612)
State failure 0.352*** 0.376*** 0.239** 0.358** 0.369*** 0.564***
(0.088) (0.089) (0.087) (0.132) (0.066) (0.084)
Physical integrity rights −0.112** −0.173*** −0.105** −0.190** −0.113** −0.251***
(0.039) (0.041) (0.038) (0.064) (0.045) (0.064)
Independent judiciary −0.107 −0.048 −0.227* −0.082 −0.487** −0.185
(0.144) (0.147) (0.128) (0.308) (0.163) (0.257)
Economic development 0.231*** 0.058 0.047 −0.016 −0.045 −0.252
(0.073) (0.075) (0.084) (0.166) (0.120) (0.172)
Population 0.280*** 0.313*** 0.361*** 0.672*** 0.633*** 0.885***
(0.053) (0.054) (0.062) (0.103) (0.083) (0.117)
Lagged terrorism 1.602*** 1.305*** 0.015*** 0.002** 0.005* 0.001**
(0.117) (0.125) (0.003) (0.001) (0.002) (0.000)
Constant −5.517*** −4.514*** −1.483* −3.272* −5.010*** −4.249*
(0.704) (0.708) (0.839) (1.634) (1.559) (2.095)
Wald Chi2 919.54 480.80 618.30 648.10
Prob > Chi2 0.001 0.001 0.001 0.001
Log Pseudolikelihood −3704.58 −4390.20
Dispersion = 1 2.42 7.34
Observations 1865 1865 1865 1865 1630 1630
Note: Robust standard errors are in parentheses.†Cubic polynomial of time are omitted to save space.*p < .05.**p < .01.***p < .001, one-tailed tests.
25The estimated results obtained from logit splines do not substantively deviate from those of cubic polynomial oftime; thus, the results are not reported here.
ETHNIC GROUP POLITICAL EXCLUSION 53

TABLE IV Two-step analysis of political exclusion and domestic terrorism, 1981–2005
Terrorist incidents Terrorist casualties
Variable Model 17 Model 18
1st step: political exclusion Generalized linear models
Terrorism 0.000 0.000*
(0.000) (0.000)
Veto players 0.019 0.021
(0.042) (0.042)
Politcal rights 0.003 0.002
(0.004) (0.004)
Ethnic fractionalization 0.014 0.014
(0.029) (0.029)
State failure −0.005* −0.005**
(0.002) (0.002)
Physical integrity rights −0.001 0.000
(0.004) (0.004)
Independent judiciary 0.006 0.007
(0.018) (0.018)
Economic development 0.036*** 0.035***
(0.008) (0.008)
Population 0.027*** 0.026***
(0.003) (0.003)
Lagged political exclusion 0.481*** 0.481***
(0.005) (0.005)
Constant −1.099*** −1.092***
(0.093) (0.093)
Observations 2494 2494
2nd step: domestic terrorism Negative binomial regression models
Political exclusion 0.143* 0.209**
(0.075) (0.079)
Politcal rights 0.300*** 0.248***
(0.049) (0.053)
Ethnic fractionalization −1.019** −1.305**
(0.375) (0.439)
State failure 0.254*** 0.434***
(0.055) (0.097)
Physical integrity rights −0.261*** −0.434***
(0.037) (0.054)
Independent judiciary −0.392* −0.179
(0.175) (0.213)
Economic development 0.082 0.001
(0.115) (0.123)
Population 0.455*** 0.812***
(0.077) (0.092)
Lagged domestic terrorism 0.022*** 0.002**
(0.005) (0.001)
Constant −4.162*** −4.899***
(1.015) (1.120)
Wald Chi2 353.70 424.91
(Continued)
54 S.-W. CHOI AND J.A. PIAZZA

these models and the essential findings are reproduced. Models 15 and 16 employ GEEs inorder to account for first-order correlation. Again, the political exclusion variable is statisti-cally significant with a positive sign. These results suggest that our core finding – the politi-cal exclusion of ethnic groups is a significant and substantive predictor of domesticterrorism and terrorist casualties – is robust and not dependent on a particular estimationtechnique.
It might very well be the case that when a terrorist group commits violent attacks in thename of a particular ethnic community (e.g. the Kurds in Turkey), the state then starts topolitically exclude this community from power in the central government (e.g. dismissing allKurdish ministers, dissolving Kurdish parties, etc.). In order to attend to this possibility, wealso look into potential reverse causality in our analysis. Since there is no standard softwarepackage that can simultaneously estimate a count variable (i.e. terrorism) and a continuousvariable (i.e. political exclusion), we build a two-step model after consulting Russett, Oneal,and Davis (1998), Choi and James (2004), and Baum (2008). Step one evaluates the impactof 10 factors on political exclusion, namely, domestic terrorism, veto players, and the samepredictors that appear in the previous tables (i.e. political rights, ethnic fractionalization, statefailure, physical integrity rights, etc.).26 Generalized linear models in this step produce pre-dicted values for political exclusion that will be used in the second step. Negative binomialregression models at the second step incorporate the predicted values for political exclusion,which were produced by the first step, and in addition the same eight predictors that wereemployed in the previous tables.
Table IV reports the results of the two-step model regarding the political exclusion–ter-rorism connection.27 The top part reports the political exclusion equation’s estimated coeffi-cients and standard errors from step one, while the bottom part displays the terrorismequation estimates from step two. While Model 17 shows the results of political exclusionwith respect to domestic terrorist incidents, Model 18 displays the results for domestic ter-rorist casualties. It turns out that even after endogeneity bias is taken into consideration, theadverse effect of political exclusion remains, regardless of the different operationalization ofthe dependent variable (see the shaded row in the second step). Simply put, political exclu-sion emerges as a cause of domestic terrorism.
TABLE IV (Continued )
Terrorist incidents Terrorist casualties
Variable Model 17 Model 18
Prob > Chi2 0.001 0.001
Log pseudolikelihood −5219.63 −5826.24
Dispersion = 1 3.25 7.62
Observations 2494 2494
Note: Robust standard errors are in parentheses.*p < .05.**p < .01.***p < .001, one-tailed tests.
26Of the four predictors, the effect of veto players requires some explanation. When more legislative veto playerspromote ethnic diversity based on their constituents, political exclusion should be less likely to occur (Tsebelis2002). This study uses Henisz’s (2000) data collection on veto players.27A test of overidentifying restrictions shows that we do not have more instruments than endogenous regressors.When the strength of the instrument variable is tested, we find that it is sufficiently strong because the F-statistic is12.09.
ETHNIC GROUP POLITICAL EXCLUSION 55

CONCLUSION
While quantitative research in academic and policy circles has examined transnational terror-ism and civil and interstate wars, research on the causes of domestic terrorism is severelylacking. Indeed, a serious limitation to the development of the empirical terrorism literaturethus far has been the lack of domestic terrorism data and the absence of an empirical probeinto the connection between political grievances and domestic terrorism. This has slowed theaccumulation of scientific knowledge regarding the relationships between domestic-levelpolitical phenomena (e.g. the degree of inclusiveness of the political system of a country)and political violence. Given its destructive impact on the daily functioning of human lifeand on national economies, a deeper probe of domestic terrorism is necessary. This study isone of the first quantitative studies to conceptualize and measure political exclusion as a rootcause of domestic terrorism, and as such, it will hopefully serve as a stepping stone towardincreased research interest in the neglected area of domestic terrorism and its motivations.
This study has demonstrated that, irrespective of the measure of terrorism and estimationmethod, ethno-political exclusion fuels domestic terrorism. When people are excluded fromstate power due to their ethnic background, they are more likely to resort to domestic terror-ism in an effort to solve issues and avenge grievances. Moreover, this study finds that thesize of the politically excluded ethnic population is a more consistent predictor of patternsof domestic terrorism than the general level of political participation in a country or thedegree of economic discrimination suffered by ethnic minorities; this assertion finds supportfor the fact that the former predictor maintains statistical significance and substantive effectin Tables I through IV, while the latter two do not.
These findings may also have significant implications for post-9/11 US counterterrorismpolicy. In 2005, US President George W. Bush announced the creation of a MillenniumChallenge Account which pledged to provide bilateral development aid to, among otherobjectives, help countries fight terrorism by addressing its political and economic rootcauses. In exchange for aid, recipient countries are required to engage in political reforms,adopt free-market economic policies, and to alleviate corruption (Millennium ChallengeCorporation 2011). Progress on these fronts is measured using scores on 17 indicators,which together determine a country’s eligibility to receive MCA aid; at present, none ofthe indicators measure a country’s political inclusiveness toward ethnic minority groups.28
The results of this study suggest that ethnic group political exclusion is a key element inthe generation of domestic terrorism and, therefore, policies aimed at fostering inclusivenesscould be a useful counterterrorism tool.
ACKNOWLEDGEMENT
We are grateful to Anahit Gomtsian, Nora Willy, and Andreas Wimmer for their commentsand help.
28The Millennium Challenge indicators are: The Freedom House Civil Liberties (1) and Political rights (2) mea-sures; the Voice and Accountability (3), Government Effectiveness (4), Rule of Law (5) and Control of Corruption(6) measures from the World Bank Institute; the Immunization Rate (7) and Public expenditure on Health (8) mea-sures from the WHO; UNESCO’s Girls Primary Education Complete Rate (9) and Public expenditure on PrimaryEducation (10) measures; the CIESIN/Yale Natural Resource Management measure (11); the Inflation Rate (12)from the IMF; the Heritage Foundation’s Trade Policy measure (13); the Land Rights and Access index fromIFAD/IFC (14); the Regulatory Quality measure from the World Bank Institute (15); the Fiscal Policy score fromthe IMF (16); and the Business Start-Up measure from the IFC (17) (see Millennium Challenge Corporation(2011)).
56 S.-W. CHOI AND J.A. PIAZZA

References
Abadie, Alberto. 2006. “Poverty, Political Freedom and the Roots of Terrorism.” American Economic ReviewPapers and Proceedings 96 (2): 50–56.
Achen, Christopher. 2000. Why Lagged Dependent Variables Can Suppress the Explanatory Power of other Inde-pendent Variables. Working paper, Society for Political Methodology, St. Louis, WA.
Agnew, Robert. 2010. “A General Strain Theory of Terrorism.” Theoretical Criminology 14 (2): 131–153.Asal, Victor, and R. Karl Rethemeyer. 2008a. “Dilettantes, Ideologues, and the Weak.” Conflict Management and
Peace Science 25 (3): 244–263.Asal, Victor, and R. Karl Rethemeyer. 2008b. “The Nature of the Beast.” Journal of Politics 70 (2): 437–449.Baum, Christopher F. 2008. “Stata Tip 63.” Stata Journal 8 (2): 299–303.Beck, Nathaniel, Jonathan N. Katz, and Richard Tucker. 1998. “Taking Time Seriously in Binary Time-series,
Cross-section Analysis.” American Journal of Political Science 42 (4): 1260–1288.Belsley, D. A., E. Kuh, and R. E. Welsch. 1980. Regression Diagnostics. New York: John Wiley & Sons.Blomberg, S. B., and G. D. Hess. 2008. “From (No) Butter to Guns?” In Terrorism, Economic Development, and
Political Openness, edited by P. Keefer and N. Loayza, 83–115. New York: Cambridge University Press.Bonneuil, Noël, and Nadia Auriat. 2000. “Fifty Years of Ethnic Conflict and Cohesion.” Journal of Peace Research
37 (5): 563–581.Bradley, John R. 2006. “Iran’s Ethnic Tinderbox.” The Washington Quarterly 30 (1): 181–190.Buendia, Rizal. 2005. “The State-moro Armed Conflict in the Philippines.” Asian Journal of Political Science 13
(1): 109–138.Carter, David B., and Curtis S. Signorino. 2010. “Back to the Future.” Political Analysis 18 (3): 271–292.Cederman, Lars-Erik, Andreas Wimmer, and Brian Min. 2010. “Why Do Ethnic Groups Rebel? New Data and
Analysis.” World Politics 62 (1): 87–119.Chenoweth, Erica. 2010. “Democratic Competition and Terrorist Activity.” Journal of Politics 72 (1): 16–30.Choi, Seung-Whan. 2010. “Fighting Terrorism through the Rule of Law?” Journal of Conflict Resolution 54 (6):
940–966.Choi, Seung-Whan. 2014. “Causes of Domestic Terrorism: Economic Sanctions as a Violence Trigger Structure.”
Korean Journal of International Studies 12 (1): 137–159.Choi, Seung-Whan. Forthcoming. “Economic Growth and Terrorism.” Oxford Economic Papers 1–40.Choi, Seung-Whan, and Patrick James. 2004. “Civil-Military Relations in a Neo-Kantian World, 1886–1992.”
Armed Forces & Society 30 (2): 227–254.Choi, Seung-Whan, and Patrick James. 2005. Civil-Military Dynamics, Democracy, and International Conflict.
New York: Palgrave.Choi, Seung-Whan, and Shali Luo. 2013. “Economic Sanctions, Poverty, and International Terrorism.” Interna-
tional Interactions 39 (2): 217–245.Cingranelli, David L., and David L. Richards. 2010. “The Cingranelli and Richards (CIRI) Human Rights Data
Project.” Human Rights Quarterly 32 (2): 401–424.Crain, Nicole V., and W. Mark Crain. 2006. “Terrorized economies.” Public Choice 128 (1–2): 317–349.Crenshaw, Martha. 1981. “The Causes of Terrorism.” Comparative Politics 13 (4): 379–399.Dash, Satya Prakash. 2006. Naxal Movement and State Power. New Delhi: Sarup and Sons.DeLuca, Tom. 1995. The Two Faces of Political Apathy. Philadelphia, PA: Temple University Press.DeNardo, James. 1985. Power in Numbers. Princeton: Princeton University Press.Drakos, K., and A. Gofas. 2006. “In Search of the Average Transnational Terrorist Attack Venue.” Defence and
Peace Economics 17 (2): 73–93.Dugan, Laura. 2010. “The Making of the Global Terrorism Database and What We have learned about the Life
Cycles of Terrorist Organizations.” Unpublished paper.Enders, Walter, and Todd Sandler. 2006. The Political Economy of Terrorism. Cambridge: Cambridge University
Press.Enders, Walter, Todd Sandler, and Khusrav Gaibulloev. 2011. “Domestic versus Transnational Terrorism.” Journal
of Peace Research 48 (3): 319–337.Ergil, Dogu. 2000. “The Kurdish Question in Turkey.” Journal of Democracy 11 (3): 122–135.Eubank, William, and Leonard Weinberg. 1994. “Does Democracy Encourage Terrorism?” Terrorism and Political
Violence 6 (4): 417–435.Eubank, William, and Leonard Weinberg. 2001. “Terrorism and Democracy.” Terrorism and Political Violence 13
(1): 155–164.Eyerman, Joe. 1998. “Terrorism and Democratic States.” International Interactions 24 (2): 151–170.Fearon, James D., and David D. Laitin. 2003. “Ethnicity, Insurgency and Civil War.” American Political Science
Review 97 (1): 75–90.Findley, Michael G., and Joseph K. Young. 2011. “Terrorism, Democracy, and Credible Commitments.” Interna-
tional Studies Quarterly 55 (2): 357–378.Findley, Michael G., and Joseph K. Young. 2012. “Terrorism and Civil War.” Perspectives on Politics 10 (2):
285–305.Fox, Jonathan. 1999. “The Influence of Religious Legitimacy on Grievance Formation by Ethno-Religious Minori-
ties.” Journal of Peace Research 36 (3): 289–307.
ETHNIC GROUP POLITICAL EXCLUSION 57
Fox, Jonathan. 2000. “The Effects of Religious Discrimination on Ethno-religious Protest and Rebellion.” Journalof Conflict Studies 20 (2): 1–26.
Frey, Bruno S., and Simon Luechinger. 2005. “Measuring terrorism.” In Law and the State, edited by Alain Marci-ano and Jean-Michel Josselin, 142–181. Northampton: Edward Elgar.
Frey, Bruno S., Simon Luechinger, and Alois Stutzer. 2007. “Calculating tragedy.” Journal of Economic Surveys21 (1): 1–24.
Freytag, Andreas, Jens J. Krüger, Daniel Meierrieks, and Friedrich Schneider. 2011. “The Origins of Terrorism.”European Journal of Political Economy 27 (Supplement 1): S5–S16.
Gleditsch, Kristian. 2002. “Expanded Trade and GDP Data.” Journal of Conflict Resolution 46 (5): 712–724.http://privatewww.essex.ac.uk/~ksg/exptradegdp.html.
Goodwin, Jeff. 2006. “ATheory of Categorical Terrorism.” Social Forces 84 (4): 2027–2046.Greene, William H. 2003. Econometric Analysis. Upper Saddle River, NJ: Prentice Hall.Gupta, Dipak K. 2007. “The Naxalites and Maoist Movement in India.” Democracy and Security 3 (2): 157–188.Gurr, Ted Robert. 1968. “A Causal Model of Civil Strife.” American Political Science Review 62 (4): 1104–1124.Gurr, Ted Robert. 1970. Why Men Rebel. Princeton: Princeton University Press.Gurr, Ted Robert. 1993. “Why Minorities Rebel.” International Political Science Review 14 (2): 161–201.Gurr, Ted Robert. 1996. “Minorities, Nationalists and Ethnopolitical Conflict.” InManaging Global Chaos, edited by C. A.
Crocker, F. O. Hampson and P. R. Aall, 53–78. Washington, DC: United States Institute of Peace Press.Gurr, Ted Robert. 2000. People Versus States. Washington, DC: United States Institute of Peace Press.Henisz, Witold J. 2000. “The Institutional Environment for Economic Growth.” Economics and Politics 12 (1): 1–31.Heston, Alan, Robert Summers, and Bettina Aten. August, 2009. Penn World Table Version 6.3. Center for Interna-
tional Comparisons of Production, Income and Prices at the University of Pennsylvania. http://pwt.econ.upenn.edu/php_site/pwt_index.php.
Hilbe, Joseph. 2007. Negative Binomial Regression. Cambridge: Cambridge University Press.Jongman, A. J. 1992. “Trends in International and Domestic Terrorism in Western Europe, 1968–1998.” Terrorism
and Political Violence 4 (4): 26–76.Juergensmeyer, Mark. 1993. The New Cold War? Berkeley: University of California Press.Kaufmann, Chaim. 1996. “Possible and Impossible Solutions to Ethnic Civil Wars.” International Security 20 (4):
136–175.Kaufmann, Chaim. 1998. “When All Else Fails.” International Security 23 (2): 120–156.King, Gary, and Langche Zeng. 2001. “Explaining Rare Events in International Relations.” International Organiza-
tion 55 (3): 693–715.Kis-Katos, Krisztina, Helge Liebert, and Günther G. Schulze. 2011. “The Origin of Domestic and International Ter-
rorism.” European Journal of Political Economy 27 (Supplement 1): S17–S36.Klausen, Jytte. 2005. The Islamic Challenge. Oxford: Oxford University Press.Kurrild-Klitgaard, P., M. K. Justesen, and P. Klemmensen. 2006. “The Political Economy of Freedom, Democracy
and Transnational Terrorism.” Public Choice 128 (1–2): 289–315.LaFree, Gary, and Gary Ackerman. 2009. “The Empirical Study of Terrorism.” Annual Review of Law and Social
Science 5: 347–374.LaFree, Gary, and Laura Dugan. 2007. “Introducing the Global Terrorism Database.” Terrorism and Political Vio-
lence 19 (2): 181–204.LaFree, Gary, Laura Dugan, and Susan Fahey. 2007. “Global Terrorism and Failed States.” In Peace and Conflict,
edited by J. Joseph Hewitt, Jonathan Wilkenfeld, and Ted Robert Gurr, 15. Boulder, CO: Paradigm Publishers.Laqueur, Walter. 1999. The New Terrorism. Oxford: Oxford University Press.Li, Quan. 2005. “Does Democracy Promote or Reduce Transnational Terrorist Incidents?” Journal of Conflict Reso-
lution 49 (2): 278–297.Lichbach, Mark Irving. 1987. “Deterrence or Escalation?” Journal of Conflict Resolution 31 (2): 266–297.Long, J. Scott, and Jeremy Freese. 2006. Regression Models for Categorical Dependent Variables Using Stata.
College Station, TX: Stata Press.Marshall, Monty, and Keith Jaggers. 2007. “POLITY IV Project.” http://www.systemicpeace.org/inscr/p4manu
alv2006.pdf.Millennium Challenge Corporation of the United States of America. 2011. Selection Indicators. http://www.mcc.
gov/pages/selection/indicators.Moore, Will T. 1998. “Repression and Dissent.” American Journal of Political Science 42 (3): 851–873.O’Hearn, Denis. 1987. “Catholic Grievances.” British Journal of Sociology 38: 94–100.Pape, Robert A. 2003. “The Strategic Logic of Suicide Terrorism.” American Political Science Review 97 (3):
343–361.Petreaus, David. 2007. The US Army and Marines Counterinsurgency Field Manual. http://freeinfosociety.com/
media/pdf/3095.pdf.Piazza, James A. 2006. “Rooted in Poverty?” Terrorism and Political Violence 18 (1): 159–177.Piazza, James A. 2008. “Incubators of Terror.” International Studies Quarterly 52 (3): 469–488.Piazza, James A. 2011. “Poverty, Minority Economic Discrimination, and Domestic Terrorism.” Journal of Peace
Research 48 (3): 339–353.Piazza, James A. 2012. “Types of Minority Discrimination and Terrorism.” Conflict Management and Peace Sci-
ence 29 (5): 521–546.
58 S.-W. CHOI AND J.A. PIAZZA

Piazza, James A., and James I. Walsh. 2010. “Physical Integrity Rights and Terrorism.” PS: Political Science andPolitics 43 (3): 411–415.
Political Instability Task Force. 2007. Internal Wars and Failures of Governance, 1955–2006. http://globalpolicy.gmu.edu/pitf/pitfpset.htm.
Powell, G. Bingham. 1982. Contemporary Democracies. Cambridge: Harvard University Press.Rapoport, David C. 1991. “Some General Observations on Religion and Violence.” Terrorism and Political Vio-
lence 3 (3): 127–134.Regan, Patrick M., and Daniel Norton. 2005. “Greed, Grievance, and Mobilization in Civil Wars.” Journal of Con-
flict Resolution 49 (3): 319–336.Ross, Jeffery Ian. 1993. “Structural Causes of Oppositional Political Terrorism.” Journal of Peace Research 30 (3):
317–329.Rotberg, Robert I. 2002. “Failed States in a World of Terror.” Foreign Affairs 81 (4): 127–140.Russett, Bruce, John Oneal, and David Davis. 1998. “The Third Leg of the Kantian Tripod for Peace.” Interna-
tional Organization 52 (3): 441–467.Sambanis, N. 2008. “Terrorism and Civil War.” In Terrorism, Economic Development, and Political Openness,
edited by P. Keefer and N. Loayza, 174–206. New York: Cambridge University Press.Savun, Burcu, and Brian J. Phillips. 2009. “Democracy, Foreign Policy, and Terrorism.” Journal of Conflict Resolu-
tion 53 (6): 878–904.Schmid, Alex P. 1992. “Terrorism and Democracy.” Terrorism and Political Violence 4 (4): 14–25.Tavares, Jose. 2004. “The Open Society assesses Its Enemies.” Journal of Monetary Economics 51 (5):
1039–1070.Tomz, Michael, Gary King, and Langche Zeng. 1999. RELOGIT. Cambridge: Harvard University. http://gking.har
vard.edu/.Tsebelis, George. 2002. Veto Players. Princeton: Princeton University Press.US Census Bureau, Population Division. 2008. International Database (IDB). http://www.census.gov/ipc/www/idb/
summaries.html.Van de Voorde, Cecile. 2005. “Sri Lankan Terrorism.” Policy Practice and Research 6 (2): 181–199.Wade, Sarah Jackson, and Dan Reiter. 2007. “Does Democracy Matter?” Journal of Conflict Resolution 51 (2):
329–348.Walsh, James I., and James A. Piazza. 2010. “Why Respecting Physical Integrity Rights Reduces Terrorism.” Com-
parative Political Studies 43 (5): 551–577.Whitaker, David J. 2001. The Terrorism Reader. New York: Routledge.Wimmer, Andreas, Lars-Erik Cederman, and Brian Min. 2009. “Ethnic Politics and Armed Conflict.” American
Sociological Review 74 (2): 316–337.Wood, Reed M., and Mark Gibney. 2010. “The Political Terror Scale (PTS).” Human Rights Quarterly 32 (2):
367–400.Young, Joseph K., and Michael G. Findley. 2011. “Promises and Pitfalls of Terrorism Research.” International
Studies Review 13 (3): 411–431.
ETHNIC GROUP POLITICAL EXCLUSION 59

APPENDIX 1. THE EFFECT OF POLITICAL EXCLUSION ON DOMESTICTERRORISM, 1981–2005: GROUP YEAR
Negative binomial regression
Terrorist incidents Terrorist casualties
Variable Model 1 Model 2
Excluded 0.344* 0.486**
(0.195) (0.196)
Downgraded −0.323 0.989**
(0.266) (0.401)
Log (group size) 0.074* 0.213***
(0.045) (0.061)
Past terrorism 0.023*** 0.003***
(0.006) (0.001)
Log (GDP per Capita), Lagged 0.174* 0.343**
(0.096) (0.131)
Log (Population), Lagged 0.235* 0.473**
(0.115) (0.151)
Constant −2.321* −4.511***
(1.050) (1.217)
Observations 9617 9617
Note: Robust standard errors are in parentheses. Peace years correction is omitted to save space. *p < .05, **p < .01, ***p < .001,one-tailed tests.
APPENDIX 2. DESCRIPTIVE STATISTICS
Variable Obs Mean Std. Dev. Minimum Maximum
Terrorist incidents 2794 11.50 42.15 0 524
Terrorist casualties 2794 52.32 205.73 0 4048
Political exclusion 2794 1.82 1.60 0 4.52
Political rights 2794 4.31 2.17 1 7
Ethnic fractionalization 2794 0.41 0.29 0.004 0.93
State failure 2794 0.58 1.54 0 13.50
Physical integrity rights 2794 4.76 2.31 0 8
Independent judiciary 2794 0.39 0.49 0 1
Economic development 2794 8.53 1.14 5.73 11.16
Populaton 2794 9.35 1.37 6.45 14.08
Lagged terrorist incidents 2794 11.68 42.80 0 524
Lagged terrorist casualties 2794 51.64 203.56 0 4048
60 S.-W. CHOI AND J.A. PIAZZA

APPENDIX 329
The political exclusion variable comes from the EPR data-set compiled by Andreas Wimmer, Lars-Erik Cederman,and Brian Min. The compilers identified all politically relevant ethnic groups and recorded the degree of access toexecutive-level power by their representatives in 155 countries from 1946 to 2005. In order to identify which ethniccategories were most salient to the national politics of a country, the compliers recruited a large panel of countryand regional experts. The codings were collected via an online survey relying on the input of nearly 100 area spe-cialists and scholars from across the globe.
The compilers followed the Weberian tradition of defining ethnicity that is referred to as a subjectively experi-enced sense of commonality based on a belief in common ancestry and shared culture. Accordingly, the definitionincludes ethnolinguistic, ethnosomatic (or ‘racial’), and ethnoreligious groups. Ethnic categories become politicallyrelevant as soon as there is a minimal degree of political mobilization or intentional political discrimination alongethnic lines. Because politically relevant categories and access to political power may change over time, the com-pliers asked coders to divide the 1946–2005 period and to provide separate codings for each subperiod. This wasalso necessary when the list of politically relevant categories changed from one year to the next. Next, the compil-ers categorized all politically relevant ethnic groups according to the degree of access to executive-level power bythose who claimed to represent them. Some held full control of the executive branch with no meaningful participa-tion by members of any other group, some shared power with members of other groups, and some were excludedaltogether from decision-making authority. Within each of these three categories, coders differentiated between fur-ther subtypes, including absolute power, power sharing regimes, and political exclusion from central power.
Since the focus of our study is the last category, the coding procedures on the first two categories are notexplained here. When political leaders who claim to represent a particular ethnic category are excluded from partic-ipation in central government, the compliers distinguish between those with local autonomy and those who arepowerless or discriminated against. Classifications of autonomy and discrimination are defined as follows: (1)Regional autonomy: Elite members of the group have no central power but have some influence at the subnationallevel (i.e. the provincial or district level, depending on the vertical organization of the state). Georgians underSoviet rule are an example. (2) Powerless: Elite representatives hold no political power at the national or regionallevels without being explicitly discriminated against. (3) Discriminated: Group members are subjected to active,intentional, and targeted discrimination with the intent of excluding them from both regional and national power.An example is Guatemaltecan Indians until the end of the civil war. It should be noted that the compilers do notinclude in the discriminated category ethnic groups suffering from indirect discrimination because they are disad-vantaged in the economic sphere or the educational sector and thus are unlikely to successfully compete in thepolitical arena.
APPENDIX 4. A CORRELATION MATRIX OF FIVE INDEPENDENTVARIABLES
Political
exclusion
Political
rights
Political
participation
Executive
constraint
Economic
discrimination
Political exclusion 1.0000
Political rights −0.2500 1.0000
Political
participation
−0.0904 0.0910 1.0000
Executive constraint −0.2421 0.7975 0.0328 1.0000
Economic
discrimination
0.3028 −0.0236 −0.0649 −0.0089 1.0000
29Appendix 3 is an abridged version of Wimmer, Cederman, and Min’s Cording Rules found at http://dvn.iq.harvard.edu/dvn/dv/epr/faces/study/StudyPage.xhtml?globalId=hdl:1902.1/11796&tab=files&studyListingIndex=0_1aba6adf0754418d90ae7739ce3c. We provide the abridged version in order to better familiarize readers with thepolitical exclusion data.
ETHNIC GROUP POLITICAL EXCLUSION 61

APPENDIX 5. MULITICOLLINEARITY DIAGNOSTICS1
VIFs R2
Political exclusion 1.30 0.23
Political participation (Vanhanen) 1.02 0.02
Executive constraint (Polity) 2.13 0.53
Economic discrimination 1.27 0.21
Ethnic fractionalization 1.39 0.28
State failure 1.45 0.31
Physical integrity rights 2.37 0.58
Independent judiciary 1.66 0.40
Economic development 2.08 0.52
Population 1.38 0.27
Lagged terrorist incidents 1.26 0.21
Mean variance inflation factors 1.57
1A general rule of thumb: A serious multicollinearity problem is suspected if the mean of all the variance inflation factors is consid-erably larger than 10, or if R2 is greater than 0.80.
62 S.-W. CHOI AND J.A. PIAZZA
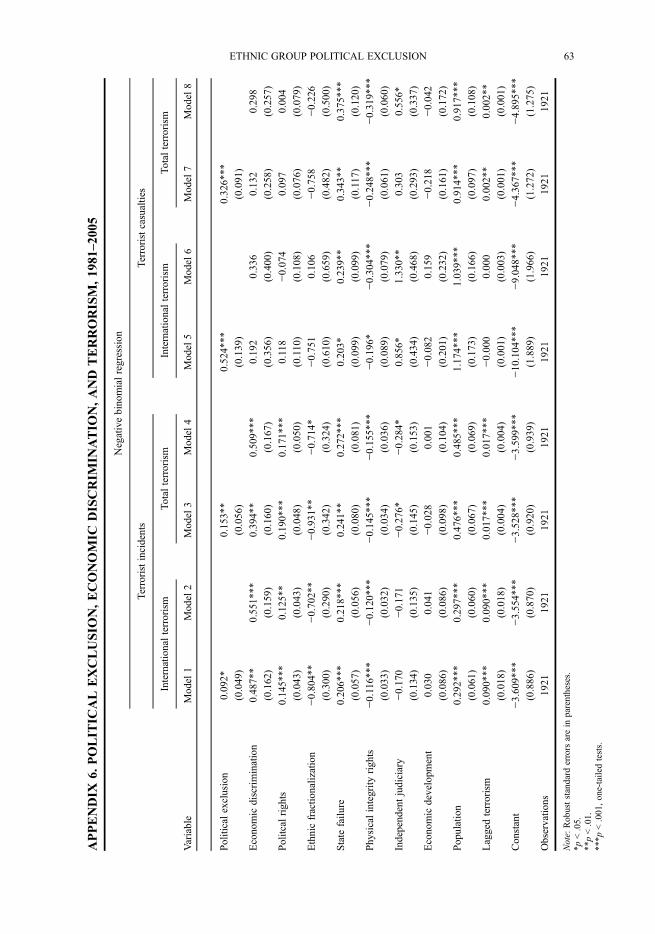
APPENDIX
6.POLIT
ICALEXCLUSIO
N,ECONOMIC
DISCRIM
INATIO
N,AND
TERRORISM,1981
–2005
Negativebino
mialregression
Terroristincidents
Terroristcasualties
Internationalterrorism
Totalterrorism
Internationalterrorism
Totalterrorism
Variable
Model
1Mod
el2
Model
3Model
4Model
5Model
6Mod
el7
Model
8
Politicalexclusion
0.092*
0.153*
*0.524*
**0.326*
**
(0.049
)(0.056
)(0.139
)(0.091
)
Economicdiscrimination
0.487**
0.551***
0.394**
0.509***
0.192
0.336
0.132
0.298
(0.162
)(0.159
)(0.160
)(0.167
)(0.356
)(0.400
)(0.258
)(0.257
)
Politcal
rights
0.145*
**0.12
5**
0.190*
**0.171*
**0.118
−0.074
0.097
0.004
(0.043
)(0.043
)(0.048
)(0.050
)(0.110
)(0.108
)(0.076
)(0.079
)
Ethnicfractio
nalization
−0.80
4**
−0.702*
*−0.93
1**
−0.714*
−0.75
10.10
6−0.758
−0.226
(0.300
)(0.290
)(0.342
)(0.324
)(0.610
)(0.659
)(0.482
)(0.500
)
State
failu
re0.206***
0.218***
0.241**
0.272***
0.203*
0.239**
0.343**
0.375***
(0.057
)(0.056
)(0.080
)(0.081
)(0.099
)(0.099
)(0.117
)(0.120
)
Physicalintegrity
rights
−0.116*
**−0.120*
**−0.14
5***
−0.155*
**−0.19
6*−0.304*
**−0.248*
**−0.31
9***
(0.033
)(0.032
)(0.034
)(0.036
)(0.089
)(0.079
)(0.061
)(0.060
)
Independ
entjudiciary
−0.170
−0.171
−0.27
6*−0.284*
0.856*
1.330*
*0.303
0.556*
(0.134
)(0.135
)(0.145
)(0.153
)(0.434
)(0.468
)(0.293
)(0.337
)
Economicdevelopm
ent
0.030
0.04
1−0.02
80.00
1−0.08
20.15
9−0.218
−0.042
(0.086
)(0.086
)(0.098
)(0.104
)(0.201
)(0.232
)(0.161
)(0.172
)
Population
0.292*
**0.29
7***
0.476*
**0.485*
**1.174*
**1.039*
**0.914*
**0.917*
**
(0.061
)(0.060
)(0.067
)(0.069
)(0.173
)(0.166
)(0.097
)(0.108
)
Laggedterrorism
0.090*
**0.09
0***
0.017*
**0.017*
**−0.00
00.00
00.002*
*0.002*
*
(0.018
)(0.018
)(0.004
)(0.004
)(0.001
)(0.003
)(0.001
)(0.001
)
Constant
−3.60
9***
−3.554*
**−3.52
8***
−3.599*
**−10
.104
***
−9.048*
**−4.367*
**−4.89
5***
(0.886
)(0.870
)(0.920
)(0.939
)(1.889
)(1.966
)(1.272
)(1.275
)
Observatio
ns19
2119
2119
2119
2119
2119
2119
2119
21
Note:
Robuststandard
errors
arein
parentheses.
*p<.05.
**p<.01.
***p
<.001,one-tailedtests.
ETHNIC GROUP POLITICAL EXCLUSION 63