ethnic differentials of the impact of the family planning
TRANSCRIPT
Demographic Research a free, expedited, online journal
of peer-reviewed research and commentary in the population sciences published by the Max Planck Institute for Demographic Research Konrad-Zuse Str. 1, D-18057 Rostock · GERMANY www.demographic-research.orgDEMOGRAPHIC RESEARCH VOLUME 25, ARTICLE 27, PAGES 837-868 PUBLISHED 20 DECEMBER 2011 http://www.demographic-research.org/Volumes/Vol25/27/ DOI: 10.4054/DemRes.2011.25.27 Research Article
Ethnic differentials of the impact of the Family Planning Program on contraceptive use in Nepal
Sharad Kumar Sharma
Naresh Pratap KC
Dhruba Raj Ghimire © 2011 Sharad Kumar Sharma et al.
This open-access work is published under the terms of the Creative Commons Attribution NonCommercial License 2.0 Germany, which permits use, reproduction & distribution in any medium for non-commercial purposes, provided the original author(s) and source are given credit. See http:// creativecommons.org/licenses/by-nc/2.0/de/

Table of Contents
1 Introduction 838 2 Methods 840 2.1 Data 840 2.2 Analysis 841 3 Results 843 3.1 Sample characteristics 843 3.2 Contraceptive use 845 3.3 Multilevel analysis 849 3.4 Simulation results 857 4 Discussion 861 5 Limitations 863 6 Acknowledgments 864 References 865
Demographic Research: Volume 25, Article 27 Research Article
http://www.demographic-research.org 837
Ethnic differentials of the impact of the Family Planning Program on contraceptive use in Nepal
Sharad Kumar Sharma1
Naresh Pratap KC2
Dhruba Raj Ghimire3
Abstract
There is wide variation of family planning services use among ethnic groups in Nepal. Despite three decades of implementation the need for family planning services is substantially unmet (25%), and there have been no systematic studies evaluating the impact of the family planning program. This study pooled data from nationally representative surveys conducted in 1996, 2001, and 2006. Multilevel logistic regression analysis of 23,381 married women of reproductive age nested within 764 clusters indicated that Muslims, Janjatis, and Dalits were significantly less likely to use contraceptives than Brahmins and Chhetries (OR=0.27, 0.88 and 0.82 respectively). The odds of using contraceptives by the Newar were higher than the odds for Brahmins and Chhetries, although it was not significant. Exposure of women to family planning messages through health facilities, family planning workers, radio, and television increased the odds of using modern contraceptives. However, the impact of family planning information on contraceptive use varied according to ethnicity. We also found that modern contraceptive use varied significantly across the clusters, and the cluster-level indicators, such as mean age at marriage, mean household asset score, percentage of women with secondary education, and percentage of women working away from home, were important in explaining this.
1 Senior Monitoring and Evaluation Associate, IPAS Nepal. 2 Director, DoHS, Family Health Division, Nepal. 3 Statistical Officer, DoHS, Management Division, Nepal.
Sharma, Pratap KC & Ghimire: Ethnic differences in contraceptive use in Nepal
838 http://www.demographic-research.org
1. Introduction
After more than thirty years of family planning program efforts, contraceptive use among married women of reproductive age in Nepal has increased from 26% in 1996 to 44% in 2006. At the same time, fertility has decreased from 4.6 to 3.1 per woman (Pradhan et al. 1997; Ministry of Health and Population (MoHP), New Era, and Macro International Inc. 2007). Yet the need for family planning is partly unmet (25%) (Karki and Krishna 2008) and some ethnic groups use family planning much more than others. For example, almost three times as many Newars (56%) use family planning as Muslims (17%). Use of family planning among Dalits (41%) and Muslims (17%) is less than the national average (44%) (Bennett and Dahal, 2008).
This information suggests that family planning efforts are reaching some groups more than others. However the cause of this disparity is not clear, and systematic studies evaluating the impact of the family planning program have not been conducted in Nepal. This paper intends to fill the gap by examining the impact of the family planning program on modern contraceptive use among different ethnic groups in Nepal.
The overall objective of this study is to examine whether the observed differences in the levels of modern contraceptive use among different ethnic groups over the last ten years in Nepal are associated with the family planning program. The specific objectives are:
• To examine if the family planning program is effective in increasing contraceptive
use • To explore if the impact of the family planning program differs by ethnicity • To provide policy recommendations to reduce ethnic disparity in impact.
Family planning activities in Nepal were first initiated in 1958 by the Nepal
Family Planning Association. The Family Planning Policy was adopted in 1965 and limited family planning services were made available in the Kathmandu Valley in 1968. Services were expanded all over the country only in the early 1990s (Aryal et al. 2008). Over the last two decades various interventions have been implemented to increase knowledge, acceptability, and use of contraceptives, through static and mobile services, door-to-door campaigns, and the mass media. Now knowledge of family planning among women of reproductive age is almost universal in Nepal (MoHP, New Era, and Macro International Inc. 2007). However the unmet contraceptive needs are considerably higher among poorer women (Johnson and Bradley 2008). Regional and ethnic disparities also exist in the utilization of family planning services. A report further analyzing the 2006 Nepal Demographic and Health Survey (NDHS), carried out in 2007, indicates that, despite impressive progress in meeting the Millennium
Demographic Research: Volume 25, Article 27
http://www.demographic-research.org 839
Development Goal (MDG), Dalit, Janjati, and Teraimadhesi-origin groups still face many barriers to accessing family planning services, because of their illiteracy, poverty, and low social status (Bennett and Dahal 2008).
Existing studies on contraceptive use focus more on individual and household-level determinants and ignore the importance of community and health care program factors (Dahal, Padmadas, and Hinde 2008; Emens 2008; Sharan and Valente 2002). Previous studies conducted in United States of America (USA) and Sub-Saharan Africa have shown that contraceptive use patterns vary among ethnic groups (Christman and Zawacki 2009; Raine et al. 2002; Addai 1999). In Nepal these issues are not commonly researched, and therefore the role of community and health care service characteristics on women’s contraceptive use needs to be explored in order to develop a community-based program, aimed at expanding the family planning program (Stephenson et al. 2007).
The goal of implementing a family planning program is to reduce population growth through the increased use of contraceptives and reduced fertility. However, there is not much consensus on the effectiveness of such a program in achieving its goal (Desai and Tarozzi 2008). The available literature shows mixed results on the association between family planning programs and women’s contraceptive behavior. While Gupta, Katende, and Bessinger (2003) consider exposure to a message broadcast through a variety of channels as the most effective way to change contraceptive knowledge, attitudes, and behavior, Desai and Tarozzi (2008) argue that access to contraceptives and exposure to family planning programs are largely ineffective in changing reproductive behavior. Evaluating the impact of the family planning program is also complicated by the fact that both program placement and individual participation are correlated with location.
The conceptual framework developed by Bertrand, Magani, and Rutenberg (1996) provides a basis for evaluating the impact of family planning programs on contraceptive use. The framework recognizes that fertility and other behaviors are the consequences of both the demand for and supply of family planning services. The demand for family planning services is affected by a number of political, socioeconomic, cultural, and individual factors. Thus an increase in the availability of family planning services is more likely to translate into higher levels of use in a country where these other factors exert a positive influence on demand. There is a growing application of the social epidemiological approach to understand how individual health outcomes and behavior are influenced by factors beyond individual and household-level factors (Stephenson et al. 2007).
Developments of multilevel modeling techniques have facilitated application of a social epidemiological approach to examine the impact of social contextual factors on individual behavior. Multilevel modeling provides a robust method for analyzing
Sharma, Pratap KC & Ghimire: Ethnic differences in contraceptive use in Nepal
840 http://www.demographic-research.org
hierarchically clustered data, while allowing measurement of the influence of community factors and unobserved community effects on individual health behavior (Stephenson, Beke, and Tshibangu 2008).
2. Methods
2.1 Data
The individual, household, community, and program-level data used in this analysis come from the 1996 Nepal Family Health Survey (Pradhan et al. 1997), the 2001 Nepal Demographic and Health Survey (MoHP, New Era, and Macro International Inc. 2002) and the 2006 Nepal Demographic and Health Surveys (MoHP, New ERA, and Macro International Inc. 2007). All three surveys were conducted under the guidance of the Ministry of Health and Population and implemented by New ERA. Technical support for the surveys was provided by Macro International Inc., and financial support was provided by the United States Agency for International Development through its mission in Nepal. The surveys used a stratified multi-stage cluster sample design to collect a nationally representative sample of women of reproductive age (15-49). Nepal is divided into 5 development regions and 75 districts. Each of the 75 districts in Nepal is subdivided into Village Development Committees (VDCs), and each VDC into wards. The primary sampling unit (PSU) for the surveys is a ward, sub-ward, or group of wards in rural areas, and sub-wards in urban areas. In all the surveys the sample was designed to provide estimates of most key variables, including contraceptive use for urban and rural areas, three ecological zones (Mountain, Hill and Terai), five development regions (Eastern, Central, Western, Mid-Western, and Far-Western), and thirteen sub-regions. The number of women of reproductive age interviewed in the surveys of 1996, 2001, and 2006 were 8,429, 8,726, and 10,793, respectively. Only the married women of reproductive age are used in this analysis. Therefore, after combining the three data sets and excluding the unmarried women, our final sample comprised 23,381 women (7,903, 7,788, and 7,690 from the 1996, 2001, and 2006 surveys, respectively).
The outcome of the analysis is dichotomous, indicating whether or not a woman uses a modern contraceptive (sterilization, pills, condom, Depo Provera, implant, or Intra-Uterine Device). If a woman was using any one of the above contraceptives at the time of survey she was assigned the code 1 and considered as using a modern contraceptive. If a woman was not using any of the above contraceptives at the time of the survey she was assigned the code 0 and considered as not using a modern contraceptive.

Demographic Research: Volume 25, Article 27
http://www.demographic-research.org 841
The independent variables used in this analysis are grouped into family planning program variables, individual background variables, household factors, and community characteristics.
We used six family planning program variables in the analysis, which are of central importance to this paper. All the program variables were dichotomous. The program variables were whether or not a woman had been visited by a family planning worker in the last 12 months, had visited a health facility in the last 12 months, or had heard of family planning on the radio, the radio program Janswasthya, television, or from a newspaper, in the last week. These variables were the only family planning program-related variables available in the survey questionnaire.
The impact of the family planning program on modern contraceptive use was examined by using background characteristics as a statistical control. Selection of the background variables and their reference categories were based on their significance in previous studies of contraceptive behavior. The background variables were grouped broadly into individual demographic factors, household factors, and community factors.
Individual demographic factors include age, education, ethnicity, occupation, and place of residence. In the absence of information on household income, a wealth index was used to represent the socioeconomic status of the household. The index comprises the ownership of nine household amenities and goods: telephone, electricity, radio, television, bicycle, floor material (vinyl or asphalt strips, carpet, tile, concrete, wood), source of drinking water, and type of toilet.
Four indices were created to represent different aspects of the cluster: mean age at marriage of women in the primary sampling unit (PSU), mean household asset score in the PSU, percentage of women with secondary or above education in the PSU, and percentage of women working away from home in the PSU. We also included year of survey as a covariate, to take into account the effect of time on contraceptive use.
2.2 Analysis
As the outcome variable of the analysis was dichotomous, representing the use of modern family planning method at the time of survey, and the data sets used in the analysis had a hierarchical structure with women nested within households and households within clusters (PSUs), a multilevel modeling technique was used for the analysis. Multilevel modeling accounts for the hierarchical structure of the data and facilitates the estimation of cluster (PSU) level influences on contraceptive use. The multilevel modeling strategy also corrects the estimated standard errors to allow for clustering of observations within units. Using multilevel analysis we can also control
Sharma, Pratap KC & Ghimire: Ethnic differences in contraceptive use in Nepal
for a range of individual, household, health facility, and community-level factors influencing contraceptive use (Goldstein 1995).
From the multilevel analysis we can estimate the variances in modern contraceptive use between the communities (clusters). These variances represent the unexplained variation in contraceptive use that remains after accounting for the factors included in the model. A significant variance might represent factors that influenced contraceptive use that were omitted from the models, either because they could not be quantified in a large survey or were absent from the data set, or a significant variance might reflect the poor measurement of some factors thought to influence it (Stephenson et al. 2007).
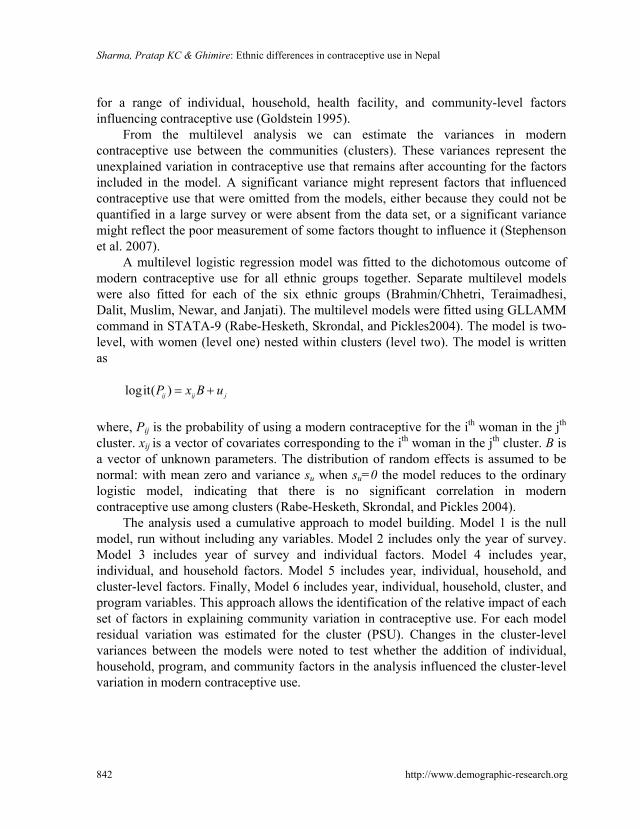
A multilevel logistic regression model was fitted to the dichotomous outcome of modern contraceptive use for all ethnic groups together. Separate multilevel models were also fitted for each of the six ethnic groups (Brahmin/Chhetri, Teraimadhesi, Dalit, Muslim, Newar, and Janjati). The multilevel models were fitted using GLLAMM command in STATA-9 (Rabe-Hesketh, Skrondal, and Pickles2004). The model is two-level, with women (level one) nested within clusters (level two). The model is written as
842 http://www.demographic-research.org
ju
ijij BxP +=)(itlog where, Pij is the probability of using a modern contraceptive for the ith woman in the jth cluster. xij is a vector of covariates corresponding to the ith woman in the jth cluster. B is a vector of unknown parameters. The distribution of random effects is assumed to be normal: with mean zero and variance su when su=0 the model reduces to the ordinary logistic model, indicating that there is no significant correlation in modern contraceptive use among clusters (Rabe-Hesketh, Skrondal, and Pickles 2004).
The analysis used a cumulative approach to model building. Model 1 is the null model, run without including any variables. Model 2 includes only the year of survey. Model 3 includes year of survey and individual factors. Model 4 includes year, individual, and household factors. Model 5 includes year, individual, household, and cluster-level factors. Finally, Model 6 includes year, individual, household, cluster, and program variables. This approach allows the identification of the relative impact of each set of factors in explaining community variation in contraceptive use. For each model residual variation was estimated for the cluster (PSU). Changes in the cluster-level variances between the models were noted to test whether the addition of individual, household, program, and community factors in the analysis influenced the cluster-level variation in modern contraceptive use.
Demographic Research: Volume 25, Article 27
http://www.demographic-research.org 843
3. Results
3.1 Sample characteristics
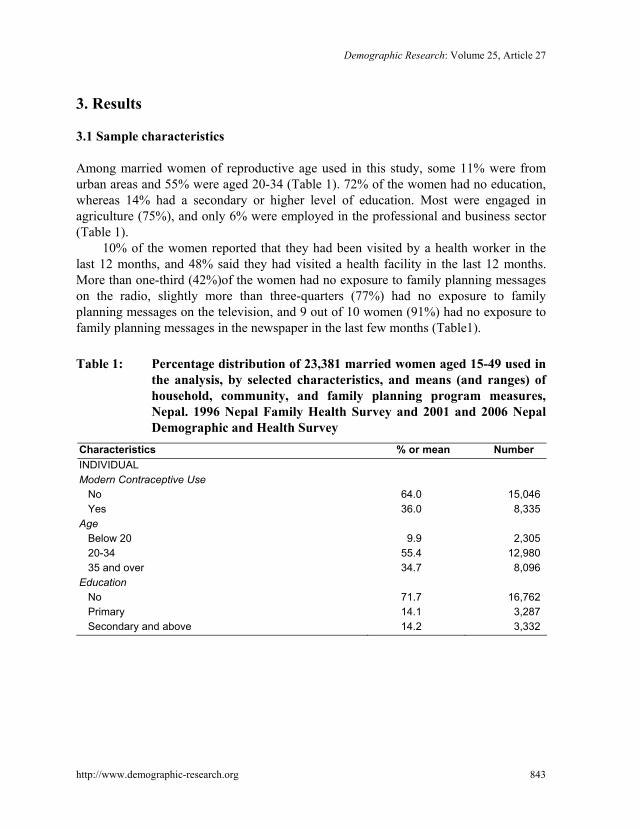
Among married women of reproductive age used in this study, some 11% were from urban areas and 55% were aged 20-34 (Table 1). 72% of the women had no education, whereas 14% had a secondary or higher level of education. Most were engaged in agriculture (75%), and only 6% were employed in the professional and business sector (Table 1).
10% of the women reported that they had been visited by a health worker in the last 12 months, and 48% said they had visited a health facility in the last 12 months. More than one-third (42%)of the women had no exposure to family planning messages on the radio, slightly more than three-quarters (77%) had no exposure to family planning messages on the television, and 9 out of 10 women (91%) had no exposure to family planning messages in the newspaper in the last few months (Table1).
Table 1: Percentage distribution of 23,381 married women aged 15-49 used in
the analysis, by selected characteristics, and means (and ranges) of household, community, and family planning program measures, Nepal. 1996 Nepal Family Health Survey and 2001 and 2006 Nepal Demographic and Health Survey
Characteristics % or mean Number INDIVIDUAL Modern Contraceptive Use No 64.0 15,046 Yes 36.0 8,335 Age Below 20 9.9 2,305 20-34 55.4 12,980 35 and over 34.7 8,096 Education No 71.7 16,762 Primary 14.1 3,287 Secondary and above 14.2 3,332

Sharma, Pratap KC & Ghimire: Ethnic differences in contraceptive use in Nepal
844 http://www.demographic-research.org
Table 1: (Continued) Characteristics % or mean Number INDIVIDUAL Ethnicity Brahmin/chhetri 31.6 8,265 Teraimadhesi other caste 15.4 2,911 Dalit 13.4 3,246 Newar 5.0 1,218 Janjatis 30.0 6,847 Muslim 4.6 894 Residence Rural 89.2 19,483 Urban 10.8 3,898 Occupation Not working 15.7 3,470 Agriculture self-employed 69.6 16,733 Agriculture employee 5.8 1,128 Business & service 5.9 1,400 Manual 3.0 650 FAMILY PLANNING PROGRAM Visited by health worker No 90.2 21,111 Yes 9.8 2,270 Visited health facility No 51.9 11,997 Yes 48.1 11,384 Heard family planning on radio No 42.4 9,408 Yes 57.6 13,973 Heard family planning on television No 76.7 17,853 Yes 23.3 5,528 Heard family planning on newspaper No 90.5 21,077 Yes 9.5 2,304 Heard radio program Janswasthya No 71.4 16,392 Yes 28.6 6,989 Total
Demographic Research: Volume 25, Article 27
http://www.demographic-research.org 845
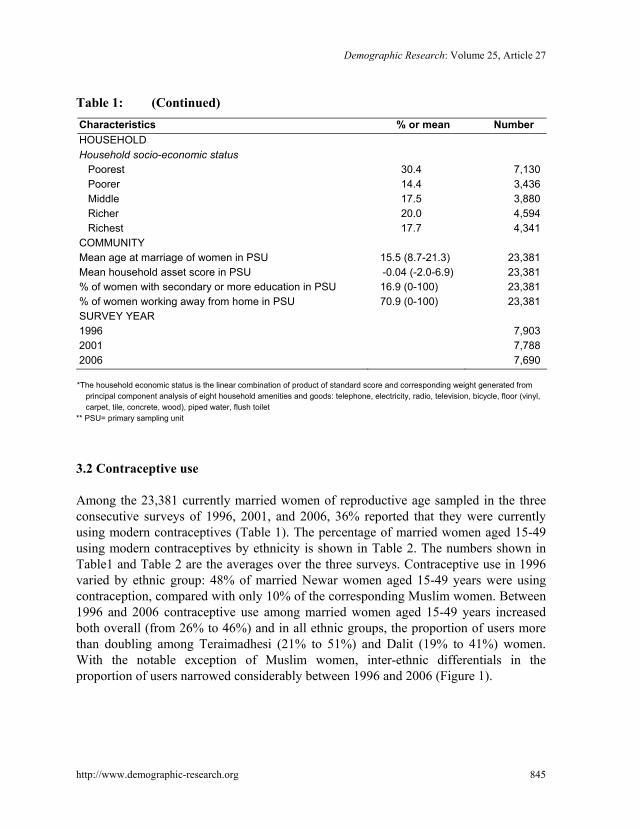
Table 1: (Continued) Characteristics % or mean Number HOUSEHOLD Household socio-economic status Poorest 30.4 7,130 Poorer 14.4 3,436 Middle 17.5 3,880 Richer 20.0 4,594 Richest 17.7 4,341 COMMUNITY Mean age at marriage of women in PSU 15.5 (8.7-21.3) 23,381 Mean household asset score in PSU -0.04 (-2.0-6.9) 23,381 % of women with secondary or more education in PSU 16.9 (0-100) 23,381 % of women working away from home in PSU 70.9 (0-100) 23,381 SURVEY YEAR 1996 7,903 2001 7,788 2006 7,690
*The household economic status is the linear combination of product of standard score and corresponding weight generated from
principal component analysis of eight household amenities and goods: telephone, electricity, radio, television, bicycle, floor (vinyl, carpet, tile, concrete, wood), piped water, flush toilet
** PSU= primary sampling unit
3.2 Contraceptive use
Among the 23,381 currently married women of reproductive age sampled in the three consecutive surveys of 1996, 2001, and 2006, 36% reported that they were currently using modern contraceptives (Table 1). The percentage of married women aged 15-49 using modern contraceptives by ethnicity is shown in Table 2. The numbers shown in Table1 and Table 2 are the averages over the three surveys. Contraceptive use in 1996 varied by ethnic group: 48% of married Newar women aged 15-49 years were using contraception, compared with only 10% of the corresponding Muslim women. Between 1996 and 2006 contraceptive use among married women aged 15-49 years increased both overall (from 26% to 46%) and in all ethnic groups, the proportion of users more than doubling among Teraimadhesi (21% to 51%) and Dalit (19% to 41%) women. With the notable exception of Muslim women, inter-ethnic differentials in the proportion of users narrowed considerably between 1996 and 2006 (Figure 1).

Sharma, Pratap KC & Ghimire: Ethnic differences in contraceptive use in Nepal
846 http://www.demographic-research.org
Table 2: Percentage of married women aged 15-49 years who were using contraceptives according to various characteristics and ethnic groups, Nepal, 1996 Nepal Family Health Survey and 2001 and 2006 Nepal Demographic and Health Survey
Characteristics Ethnic groups All Brahmin
Chhetri Terai-
madhesiDalit Newar Janjati Muslim
INDIVIDUAL Age Below 20 9.0 9.0 4.9 5.9 20.9 13.6 6.3 20-34 34.4 36.1 31.7 26.2 49.4 38.0 12.4 35 and over 46.2 50.1 47.9 44.4 61.5 43.8 16.2 Education No 34.5 36.8 33.4 28.3 51.8 38.7 11.1 Primary 38.1 40.7 33.0 33.3 52.7 37.4 16.6 Secondary and above 41.1 42.3 43.1 34.3 52.2 33.1 43.2 Ethnicity Brahmin/Chhetri 38.8 - - - - - - Teraimadhesi other caste 34.0 - - - - - - Dalit 28.8 - - - - - - Newar 52.2 - - - - - - Janjatis 38.0 - - - - - - Muslim 13.0 - - - - - - Residence Rural 33.8 36.1 32.5 27.4 44.7 37.2 11.0 Urban 53.7 56.1 50.8 45.7 65.7 48.5 32.2 Occupation Not working 33.9 48.1 25.6 27.0 56.3 37.1 12.9 Agriculture self-employed 34.2 35.1 35.7 26.4 43.3 36.5 9.6 Agriculture employee 34.9 42.3 35.6 32.3 43.7 44.4 11.4 Business & service 55.5 56.9 58.3 54.9 65.3 50.0 26.8 Manual 52.9 56.7 48.0 43.3 65.2 51.6 47.2 FAMILY PLANNING PROGRAM
Visited by health worker No 34.5 37.6 32.9 27.8 50.7 36.1 11.0 Yes 49.1 50.0 43.4 40.2 70.8 53.3 35.3 Visited health facility No 32.6 36.8 34.0 27.9 46.7 32.9 7.1 Yes 39.6 41.4 34.0 29.9 56.3 43.5 19.7

Demographic Research: Volume 25, Article 27
http://www.demographic-research.org 847
Table 2: (Continued) Characteristics Ethnic groups
All Brahmin Chhetri
Terai-madhesi
Dalit Newar Janjati Muslim
Heard family planning on radio No 29.5 30.5 30.1 26.4 52.8 33.2 9.7 Yes 40.7 41.6 44.7 31.3 52.0 41.0 22.7 Heard family planning on television
No 31.0 32.8 30.4 26.2 41.0 34.8 9.7 Yes 52.2 53.3 51.8 46.5 63.1 49.2 38.4 Heard family planning in newspaper
No 34.7 36.5 33.2 28.5 50.5 37.9 11.6 Yes 48.3 49.8 55.0 41.0 58.4 38.7 53.5 Heard radio program Janswasthya
No 33.4 34.8 33.2 27.8 50.9 36.9 12.3 Yes 42.4 44.3 43.6 32.5 54.0 40.6 21.4 HOUSEHOLD Household socio-economic status
Poorest 24.5 23.6 26.2 22.3 23.2 28.4 7.3 Poorer 32.3 31.7 34.1 28.0 33.8 35.7 12.0 Middle 36.8 40.8 37.6 35.1 28.0 41.0 11.2 Richer 40.4 42.7 38.1 35.6 47.1 43.8 14.7 Richest 52.9 55.6 45.1 49.3 65.7 46.4 32.3 COMMUNITY Mean age at marriage of women in PSU
- - - - - - -
Mean household asset score in PSU
- - - - - - -
% of women with secondary or more education in PSU
- - - - - - -
% of women working away from home in PSU
- - - - - - -
SURVEY YEAR 1996 26.0 31.2 20.8 18.9 48.5 25.0 10.2 2001 37.0 40.4 34.8 29.1 51.7 38.5 11.6 2006 46.0 44.6 50.9 40.5 58.2 48.0 17.9
*The household economic status is the linear combination of product of standard score and corresponding weight generated from
principal component analysis of eight household amenities and goods: telephone, electricity, radio, television, bicycle, floor (vinyl, carpet, tile, concrete, wood), piped water, flush toilet
** PSU= primary sampling unit

Sharma, Pratap KC & Ghimire: Ethnic differences in contraceptive use in Nepal
There is a marked difference in contraceptive use between Muslims and Newars in Nepal (Figure 1). The prevalence of use of modern contraceptives among Teraimadhesis, Dalits, Janjatis, and Brahmins and Chhetries has increased steadily. The level of contraceptive use is highest among the Newars, although there has been very little change in their use of modern contraceptives over the last decade (49% in 1996 and 58% in 2006). Despite having the lowest level of use, there has also been little change in modern contraceptive use among Muslims over the last ten-year period (10% in 1996 and 18% in 2006). Increase in contraceptive use over the last ten-year period was highest in the Teraimadhesi (28%), followed by the Janjatis (20%), Dalits (19%), and Brahmins and Chhetries (14%).
Figure1: Percentage of women using a contraceptive method, by year,
according to ethnicity
0
10
20
30
40
50
60
1996 2001 2006
M uslim DalitBrahmin/chhetri JanjatisTerai madhesi other cast NewarTotal
Contraceptive use varied by age group: only 9% of women aged less than 20 years
were using modern contraceptives, while women aged 35 and over were most likely to use modern contraceptives (46%). Women with at least secondary education reported the highest level of contraceptive use (41%), followed by women with primary
848 http://www.demographic-research.org

Demographic Research: Volume 25, Article 27
education (38%) and women with no formal education (35%). A similar trend was reported by women in all ethnic groups except Newars and Janjatis. Contraceptive use varied by place of residence: women living in urban clusters reported a higher level of contraceptive use (54%) than women living in rural areas (34%). Contraceptive use differed by occupation: women working in the business or service sectors reported the highest level of contraceptive use (56%). The level of contraceptive use was higher among women engaged in manual work (53%) than among women who were not working and those working in the agriculture sector (34%). The association of employment and contraceptive use also varied according to ethnicity.
Women who had been exposed to family planning messages through radio, television, and newspapers in the last few months were more likely to use modern contraceptives (41%, 52%, and 48%, respectively) than women who were not exposed to family planning in the mass media. Women who had either visited a health facility or had been visited by a health worker in the last 12 months were more likely to use contraceptives (40% and 49% respectively) than their counterparts. Use of modern contraceptives was highest among women living in the richest households (53%) and lowest among women living in the poorest households (25%). Even though the level varied by ethnicity, the pattern of contraceptive use by household wealth was similar (Table 2).
3.3 Multilevel analysis
Multilevel logistic regression modeling was employed to determine the impact of program variables on contraceptive use and to examine ethnic differences in the impact. Individual, household, and cluster-level variables were also included in the model as confounders. Six variables on exposure to family planning information from health worker and mass media sources were used as program variables. Four groups of variables were entered into the model in sequence. Table 3 and Table 4 show the result of the multilevel modeling of contraceptive use.
Model 1 in Table 3 indicated that there was significant unexplained cluster-level variance in modern contraceptive use (0.84). It further indicated that the amount of variation in modern contraceptive use that was attributed to the cluster was about 20% [ρ = 0.84/(0.84+3.29)]. Here, ρ stands for the intra cluster correlation for the null model and is given by where 2 2 2
0 0/( / 3),u uρ σ σ π= + 20uσ is the variance at the cluster level and
π = 3.14 (Hox 2010:128).18% of the cluster-level variance seen in Model 1 was explained by the variable year of the survey added in Model 2. Individual socio-demographic factors included in Model 3 explained 17% of the cluster-level variation of modern contraceptive use that remained unexplained in Model 2. Similarly, the
http://www.demographic-research.org 849
Sharma, Pratap KC & Ghimire: Ethnic differences in contraceptive use in Nepal
850 http://www.demographic-research.org
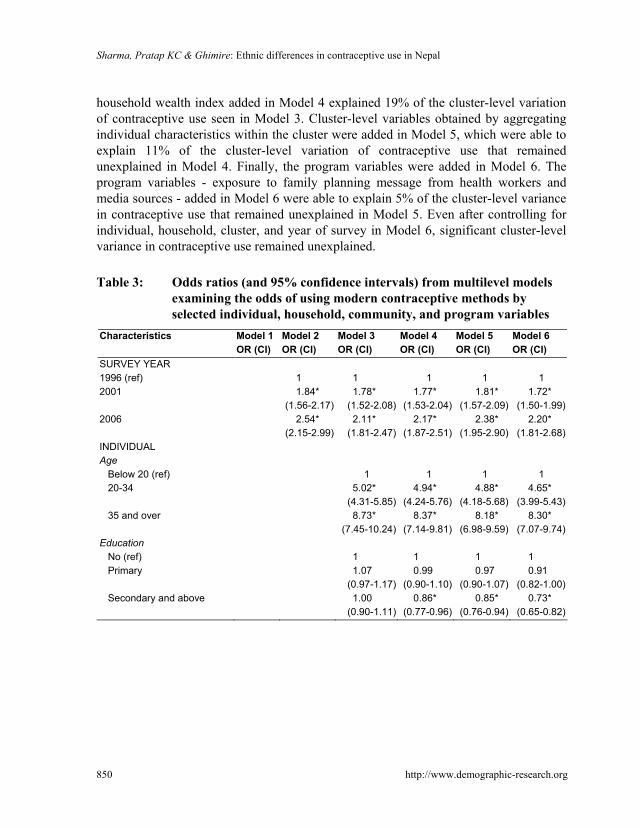
household wealth index added in Model 4 explained 19% of the cluster-level variation of contraceptive use seen in Model 3. Cluster-level variables obtained by aggregating individual characteristics within the cluster were added in Model 5, which were able to explain 11% of the cluster-level variation of contraceptive use that remained unexplained in Model 4. Finally, the program variables were added in Model 6. The program variables - exposure to family planning message from health workers and media sources - added in Model 6 were able to explain 5% of the cluster-level variance in contraceptive use that remained unexplained in Model 5. Even after controlling for individual, household, cluster, and year of survey in Model 6, significant cluster-level variance in contraceptive use remained unexplained.
Table 3: Odds ratios (and 95% confidence intervals) from multilevel models
examining the odds of using modern contraceptive methods by selected individual, household, community, and program variables
Model 1 Model 2 Model 3 Model 4 Model 5 Model 6 Characteristics OR (CI) OR (CI) OR (CI) OR (CI) OR (CI) OR (CI)
SURVEY YEAR 1996 (ref) 1 1 1 1 1 2001 1.84*
(1.56-2.17)1.78*
(1.52-2.08)1.77*
(1.53-2.04)1.81*
(1.57-2.09) 1.72*
(1.50-1.99) 2006 2.54*
(2.15-2.99)2.11*
(1.81-2.47)2.17*
(1.87-2.51)2.38*
(1.95-2.90) 2.20*
(1.81-2.68) INDIVIDUAL Age Below 20 (ref) 1 1 1 1 20-34 5.02*
(4.31-5.85)4.94*
(4.24-5.76)4.88*
(4.18-5.68) 4.65*
(3.99-5.43) 35 and over 8.73*
(7.45-10.24)8.37*
(7.14-9.81)8.18*
(6.98-9.59) 8.30*
(7.07-9.74) Education No (ref) 1 1 1 1 Primary 1.07
(0.97-1.17)0.99
(0.90-1.10)0.97
(0.90-1.07) 0.91
(0.82-1.00) Secondary and above 1.00
(0.90-1.11)0.86*
(0.77-0.96)0.85*
(0.76-0.94) 0.73*
(0.65-0.82)

Demographic Research: Volume 25, Article 27
http://www.demographic-research.org 851
Table 3: (Continued) Model 1 Model 2 Model 3 Model 4 Model 5 Model 6 Characteristics OR (CI) OR (CI) OR (CI) OR (CI) OR (CI) OR (CI)
Ethnicity Brahmin/Chhetri (ref) 1 1 1 1 Teraimadhesi, other caste 0.85*
(0.74-0.97)0.90
(0.79-1.03)0.85*
(0.74-0.98) 0.93
(0.81-1.07) Dalit 0.72*
(0.64-0.80)0.81*
(0.72-0.91)0.79*
(0.71-0.89) 0.82*
(0.73-0.92) Newar 1.21*
(1.03-1.43)1.18
(1.00-1.39)1.09
(0.92-1.29) 1.12
(0.95-1.32) Janjati 0.86*
(0.78-0.94)0.88*
(0.81-0.97)0.86*
(0.78-0.94) 0.88*
(0.80-0.97) Muslim 0.27*
(0.20-0.35)0.28*
(0.21-0.37)0.25*
(0.19-0.33) 0.27*
(0.21-0.36) Occupation Not working (ref) 1 1 1 1 Agriculture self-employed 1.12*
(1.01-1.25)1.23*
(1.11-1.37)1.35*
(1.21-1.50) 1.35*
(1.21-1.51) Agriculture employee 1.22*
(1.02-1.45)1.49*
(1.24-1.77)1.56*
(1.31-1.86) 1.60*
(1.34-1.91) Business & service 1.71*
(1.48-1.98)1.69*
(1.46-1.95)1.70*
(1.47-1.97) 1.64*
(1.42-1.90) Manual 1.71*
(1.40-2.10)1.87*
(1.53-2.28)1.83*
(1.50-2.24) 1.77*
(1.44-2.16) Residence Rural (ref) 1 1 1 1 Urban 2.02*
(1.71-2.39)1.53*
(1.30-1.80)0.95
(0.79-1.15) 0.97
(0.80-1.17) HOUSEHOLD Household socio-economic status Poorest (ref) 1 1 1 Poorer 1.26*
(1.14-1.40)1.25*
(1.13-1.39) 1.17*
(1.05-1.29) Middle 1.66*
(1.50-1.84)1.60*
(1.45-1.77) 1.52*
(1.37-1.68) Richer 1.78*
(1.61-1.97)1.67*
(1.50-1.84) 1.52*
(1.37-1.69) Richest 2.50*
(2.21-2.84)2.08*
(1.82-2.38) 1.81*
(1.58-2.08)

Sharma, Pratap KC & Ghimire: Ethnic differences in contraceptive use in Nepal
852 http://www.demographic-research.org
Table 3: (Continued) Model 1 Model 2 Model 3 Model 4 Model 5 Model 6 Characteristics OR (CI) OR (CI) OR (CI) OR (CI) OR (CI) OR (CI)
COMMUNITY Mean age at marriage of women in PSU
0.97 (0.93-1.01)
0.97 (0.93-1.01)
Mean household asset score in PSU
1.26* (1.16-1.37)
1.25* (1.15-1.36)
% of women with secondary or more education in PSU
1.00 (0.99-1.00)
0.99 (0.99-1.00)
% of women working away from home in PSU
0.99 (0.99-1.00)
0.99 (0.99-1.00)
FAMILY PLANNING PROGRAM Visited by health worker No (ref) 1 Yes 1.60*
(1.44-1.76) Visited health facility No (ref) 1 Yes 1.23*
(1.15-1.32) Heard family planning on radio No (ref) 1 Yes 1.22*
(1.12-1.32) Heard family planning on television No (ref) 1 Yes 1.18*
(1.07-1.30) Heard of family planning in newspaper
No (ref) 1 Yes 1.09
(0.97-1.23) Heard radio program Janswasthya No (ref) 1.13*
(1.04-1.22) Yes Community level random intercept(SE)
0.84* (0.06)
0.69* (0.05)
0.57* (0.04)
0.46* (0.04)
0.41* (0.03)
0.39* (0.03)
Log Likelihood -14145 -14085 -13358 -13240 -13201 -13083 Number of observations 23,381 23,381 23,381 23,381 23,381 23,381
* p< 0.05, † The household economic status is the linear combination of product of standard score and corresponding weight generated from
principal component analysis of eight household amenities and goods: telephone, electricity, radio, television, bicycle, floor (vinyl, carpet, tile, concrete, wood), piped water, flush toilet
‡ PSU= primary sampling unit
Demographic Research: Volume 25, Article 27
http://www.demographic-research.org 853
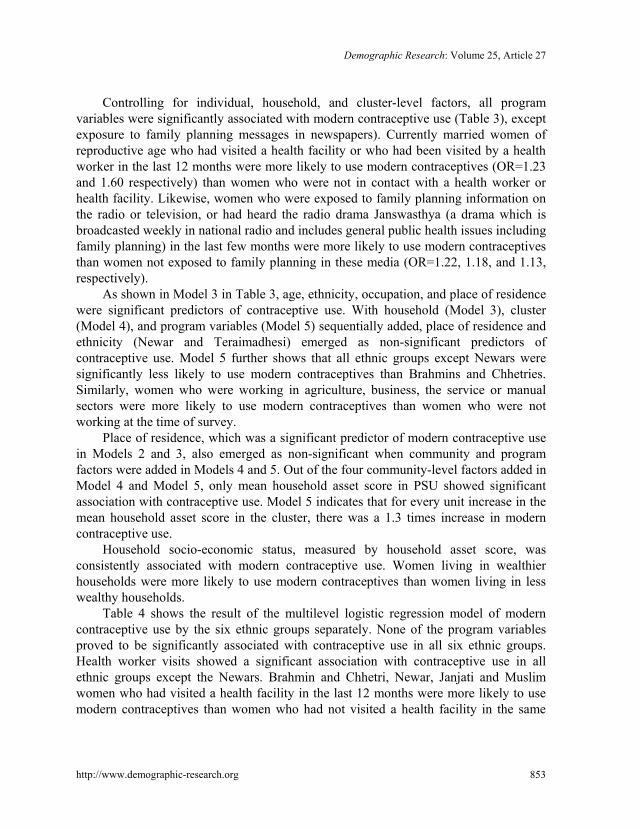
Controlling for individual, household, and cluster-level factors, all program variables were significantly associated with modern contraceptive use (Table 3), except exposure to family planning messages in newspapers). Currently married women of reproductive age who had visited a health facility or who had been visited by a health worker in the last 12 months were more likely to use modern contraceptives (OR=1.23 and 1.60 respectively) than women who were not in contact with a health worker or health facility. Likewise, women who were exposed to family planning information on the radio or television, or had heard the radio drama Janswasthya (a drama which is broadcasted weekly in national radio and includes general public health issues including family planning) in the last few months were more likely to use modern contraceptives than women not exposed to family planning in these media (OR=1.22, 1.18, and 1.13, respectively).
As shown in Model 3 in Table 3, age, ethnicity, occupation, and place of residence were significant predictors of contraceptive use. With household (Model 3), cluster (Model 4), and program variables (Model 5) sequentially added, place of residence and ethnicity (Newar and Teraimadhesi) emerged as non-significant predictors of contraceptive use. Model 5 further shows that all ethnic groups except Newars were significantly less likely to use modern contraceptives than Brahmins and Chhetries. Similarly, women who were working in agriculture, business, the service or manual sectors were more likely to use modern contraceptives than women who were not working at the time of survey.
Place of residence, which was a significant predictor of modern contraceptive use in Models 2 and 3, also emerged as non-significant when community and program factors were added in Models 4 and 5. Out of the four community-level factors added in Model 4 and Model 5, only mean household asset score in PSU showed significant association with contraceptive use. Model 5 indicates that for every unit increase in the mean household asset score in the cluster, there was a 1.3 times increase in modern contraceptive use.
Household socio-economic status, measured by household asset score, was consistently associated with modern contraceptive use. Women living in wealthier households were more likely to use modern contraceptives than women living in less wealthy households.
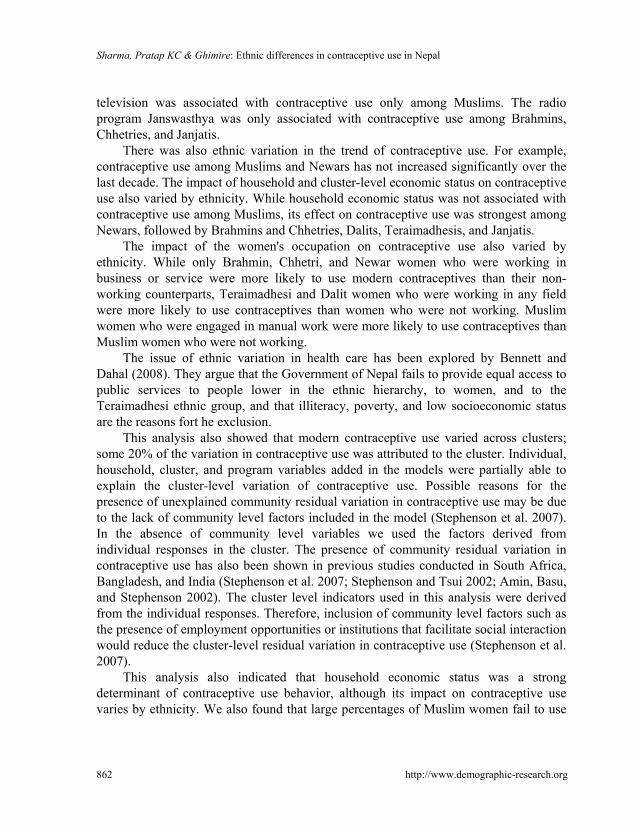
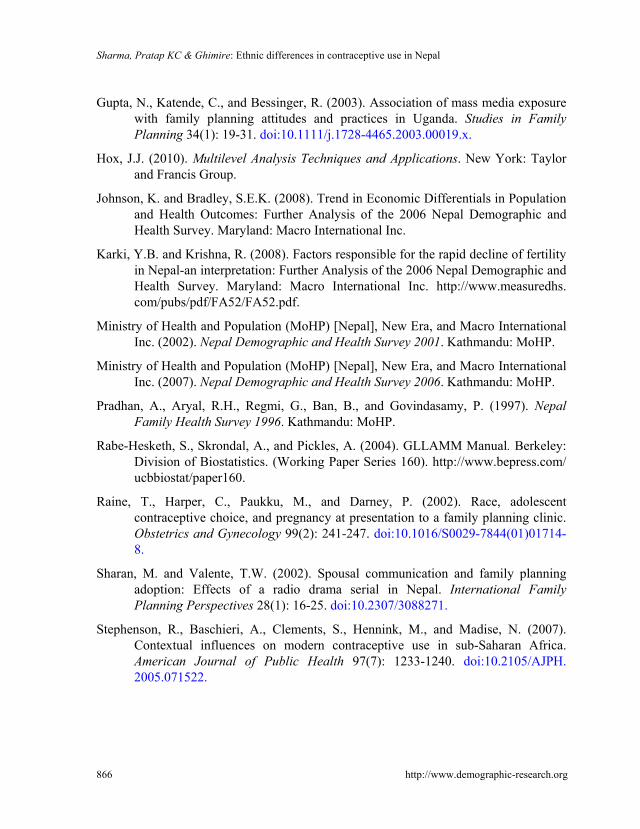
Table 4 shows the result of the multilevel logistic regression model of modern contraceptive use by the six ethnic groups separately. None of the program variables proved to be significantly associated with contraceptive use in all six ethnic groups. Health worker visits showed a significant association with contraceptive use in all ethnic groups except the Newars. Brahmin and Chhetri, Newar, Janjati and Muslim women who had visited a health facility in the last 12 months were more likely to use modern contraceptives than women who had not visited a health facility in the same

Sharma, Pratap KC & Ghimire: Ethnic differences in contraceptive use in Nepal
854 http://www.demographic-research.org
period. Relative to women who had not heard family planning information on the radio, women other than Newars, Dalits, and Muslims, who had heard the family planning message on the radio, were more likely to use contraceptives. Exposure to family planning on the television was a significant predictor of contraceptive use only among Muslim women. Similarly, exposure to the Janswasthya radio program was associated with modern contraceptive use only among Brahmins, Chhetries, and Janjatis. Exposure to family planning in newspapers was not associated with contraceptive use among women of all ethnic groups.
There was also ethnic variation in the association of survey year and contraceptive use. Even though modern contraceptive use increased over the ten-year period among all ethnic groups, the increase was not significant among Newars and Muslims. Similarly, only women working in the business or service sectors were more likely to use modern contraceptives than non-working women among Brahmins and Chhetries and Newars. Likewise, irrespective of the type of work, Teraimadhesi and Dalit women who were working (agriculture, business, service, and manual) were significantly more likely to use modern contraceptives than women from the same ethnic groups who were not working. Finally, Muslim women who were engaged in manual work were significantly more likely to use contraceptives than their non-working counterparts.
There was also ethnic variation in the association of household wealth and community characteristics with contraceptive use: household wealth was not associated with contraceptive use in Muslims. Similarly, cluster-level percentages of women with secondary education, the percentage of women working away, and mean age at marriage were not associated with contraceptive use among any ethnic groups.
Despite the inclusion of individual, programmatic, household, cluster, and survey year, there was significant cluster-level variation in all six ethnic groups. This finding indicates that whereas the survey year, individual, program, household, and contextual variables included in the models partially explained the cluster-level variability in modern contraceptive use, a substantial amount of unexplained cluster-level variability in modern contraceptive use remained.

Demographic Research: Volume 25, Article 27
http://www.demographic-research.org 855
Table 4: Odds ratios (and 95% confidence intervals) from multilevel models examining the odds of using modern contraceptive methods by ethnic groups and selected individual, household, community, and program variables
Final Multilevel Model by Ethnicity Characteristics Brahmin- Chhetri
Terai-madhesi
Dalit Newar Janjati Muslim
SURVEY YEAR 1996 (ref) 1 1 1 1 1 1 2001 1.70*
(1.38-2.10) 1.83*
(1.30-2.58) 2.00*
(1.44-2.76) 1.36
(0.91-2.03)2.07*
(1.61-2.66) 0.92
(0.39-2.15) 2006 2.09*
(1.56-2.81) 4.17*
(2.67-6.52) 2.74*
(1.77-4.44) 1.43
(0.71-2.87)2.05*
(1.42-2.96) 1.31
(0.48-3.62) INDIVIDUAL Age Below 20 (ref) 1 1 1 1 1 1 20-34 4.83*
(3.66-6.38) 10.46*
(5.88-18.61) 5.60*
(3.65-8.57) 2.79*
(1.49-5.25)3.98*
(3.05-5.19) 2.14
(0.84-5.41) 35 and over 9.11*
(6.83-12.15) 21.07*
(11.70-37.95)14.24*
(9.14-22.18)4.63*
(2.38-9.01)5.88*
(4.45-7.78) 2.89*
(1.10-7.61) Education No (ref) 1 1 1 1 1 1 Primary 0.90
(0.77-1.05) 0.84
(0.61-1.17) 0.95
(0.70-1.29) 0.70
(0.48-1.01)0.93
(0.78-1.11) 1.13
(0.42-3.04) Secondary and above
0.73* (0.61-0.87)
0.90 (0.59-1.36)
0.82 (0.49-1.35)
0.45* (0.29-0.69)
0.73* (0.57-0.93)
1.22 (0.44-3.38)
Occupation Not working (ref) 1 1 1 1 1 1 Agriculture Self-employed
1.13 (0.93-1.38)
1.85* (1.42-2.41)
1.72* (1.21-2.45)
1.11 (0.71-1.74)
1.19 (0.94-1.49)
1.55 (0.82-2.93)
Agriculture employee
1.28 (0.81-2.00)
1.93* (1.30-2.86)
2.50* (1.64-3.82)
0.68 (0.21-2.22)
1.46* (1.02-2.11)
1.41 (0.57-3.46)
Business & service 1.35* (1.07-1.71)
1.71* (1.07-2.73)
2.72* (1.45-5.11)
1.57* (1.02-2.42)
1.74* (1.29-2.35)
1.10 (0.36-3.37)
Manual 1.42 (0.91-2.23)
2.99* (1.38-6.48)
2.50* (1.53-4.08)
1.31 (0.78-2.20)
1.29 (0.87-1.92)
3.70* (1.25-9.92)
Residence Rural (ref) 1 1 1 1 1 1 Urban 0.86
(0.67-1.12) 0.76
(0.43-1.31) 0.88
(0.60-1.30) 0.78
(0.49-1.27)1.11
(0.80-1.53) 1.24
(0.39-3.95)

Sharma, Pratap KC & Ghimire: Ethnic differences in contraceptive use in Nepal
856 http://www.demographic-research.org
Table 4: (Continued) Final Multilevel Model by Ethnicity Characteristics
Brahmin- Chhetri
Terai-madhesi
Dalit Newar Janjati Muslim
HOUSEHOLD Household socio-economic status
Poorest (ref) 1 1 1 1 1 1 Poorer 1.27*
(1.07-1.51) 1.26
(0.88-1.78) 1.30
(0.98-1.71) 1.45
(0.72-2.93)0.93
(0.77-1.12) 1.34
(0.45-3.96) Middle 1.66*
(1.37-2.00) 1.87*
(1.45-2.41) 1.74*
(1.32-2.29) 1.41
(0.74-2.69)1.23*
(1.02-1.48) 1.20
(0.61-2.38) Richer 1.59*
(1.32-1.91) 1.48*
(1.12-1.97) 1.61*
(1.19-2.20) 2.51*
(1.37-4.60)1.39*
(1.15-1.67) 1.33
(0.65-2.70) Richest 2.03*
(1.60-2.58) 1.83*
(1.21-2.76) 1.88*
(1.17-3.01) 3.28*
(1.64-6.58)1.47*
(1.15-1.88) 2.48
(0.97-6.36) COMMUNITY Mean age at marriage of women in PSU
1.03 (0.97-1.10)
1.05 (0.92-1.20)
0.97 (0.87-1.08)
0.92 (0.81-1.05)
0.89 (0.83-0.95)
0.97 (0.67-1.42)
Mean household asset score in PSU
1.22* (1.08-1.38)
1.09 (0.83-1.44)
1.29* (1.04-1.61)
1.33* (1.08-1.64)
1.23* (1.07-1.41)
1.06 (0.48-2.35)
% of women with secondary or more education in PSU
1.00 (0.99-1.00)
1.00 (0.99-1.02)
1.00 (0.98-1.01)
1.00 (0.99-1.01)
0.99 (0.98-1.00)
1.00 (0.97-1.04)
% of women working away from home in PSU
0.99 (0.99-1.00)
0.99 (0.98-1.00)
0.98 (0.98-0.99)
1.00 (0.99-1.01)
1.00 (0.99-1.00)
0.98 (0.97-1.00)
FAMILY PLANNING PROGRAM
Visited by health worker No (ref) 1 1 1 1 1 1 Yes 1.59*
(1.34-1.89) 1.47*
(1.10-1.97) 1.82*
(1.35-2.47) 1.58
(0.91-2.72)1.58*
(1.33-1.89) 4.00*
(2.07-7.75) Visited health facility No (ref) 1 1 1 1 1 1 Yes 1.13*
(1.01-1.26) 0.86
(0.71-1.04) 0.99
(0.81-1.20) 1.64*
(1.23-2.17)1.57*
(1.39-1.77) 2.18*
(1.33-3.59) Heard family planning on radio
No (ref) 1 1 1 1 1 1 Yes 1.29*
(1.12-1.48) 1.53*
(1.20-1.95) 1.06
(0.85-1.31) 0.86
(0.61-1.22)1.23*
(1.07-1.42) 1.29
(0.73-2.29)

Demographic Research: Volume 25, Article 27
http://www.demographic-research.org 857
Table 4: (Continued) Final Multilevel Model by Ethnicity Characteristics
Brahmin- Chhetri
Terai-madhesi
Dalit Newar Janjati Muslim
Heard family planning on television
No (ref) 1 1 1 1 1 1 Yes 1.12
(0.96-1.32) 1.35
(1.00-1.82) 1.13
(0.83-1.54)1.14
(0.79-1.65)1.16
(0.97-1.37) 2.07*
(1.03-4.17) Heard of family planning in newspaper
No (ref) 1 1 1 1 1 1 Yes 1.11
(0.94-1.31) 1.47
(0.90-2.42) 1.24
(0.72-2.15)0.94
(0.64-1.38)0.91
(0.71-1.17) 1.82
(0.61-5.47) Heard radio program Janswasthya
No (ref) 1 1 1 1 1 1 Yes 1.19*
(1.05-1.34) 0.87
(0.60-1.26) 1.06
(0.82-1.36)1.24
(0.92-1.66)1.16*
(1.01-1.34) 0.67
(0.26-1.75) Community level random intercept
0.43* (0.06)
0.41* (0.10)
0.45* (0.10)
0.22* (0.11)
0.56* (0.07)
0.52* (0.31)
Log Likelihood -4786 -1543 -1602 -734 -3966 -279 Number of observation 8265 2911 3246 1218 6847 894
* p< 0.05, † The household economic status is the linear combination of product of standard score and corresponding weight generated from
principal component analysis of eight household amenities and goods: telephone, electricity, radio, television, bicycle, floor (vinyl, carpet, tile, concrete, wood), piped water, flush toilet ‡ PSU= primary sampling unit
3.4 Simulation results
To provide further exploration of the effects observed in the analysis a series of simulations were run. In the simulations the predicted probability of women using modern contraceptive methods during the period 1996-2006 was compared under alternative scenarios concerning family planning program factors for contraceptive use, when the observed effects of the other covariates used in the analysis were held constant at their observed levels.
For the purposes of the simulation exercise, five family planning program variables and all confounding factors significantly associated with contraceptive use were included in the model. The impact of the five program variables on contraceptive use were examined separately among different ethnic groups. In the base line simulation the value of the program variables was set at their observed levels. In the second simulation the program variables were set equal to zero, simulating the scenario

Sharma, Pratap KC & Ghimire: Ethnic differences in contraceptive use in Nepal
858 http://www.demographic-research.org
of minimal program intervention (that is, none of the women included in the sample were exposed to the program). In the final simulation the five program variables were set equal to 1 to represent their maximum theoretical value (that is, all the women included in the sample were exposed to the program) to assess the hypothetical effects of an optimal family planning program intervention. The results of the simulation exercise are presented graphically in Figures 2-6.
Figure 2 displays the result of a simulation to examine the impact of health worker visits in the previous 12 months among different ethnic groups. The impact of health facility visits, exposure to family planning on the radio, and exposure to family planning in the radio drama Janswasthya on corresponding modern contraceptive use is shown in Figure 3, Figure 4, Figure 5, and Figure 6, respectively.
In Figure 2, the first, blue, bar indicates the predicted probability of contraceptive use when none of the women in the sample were visited by health workers in the 12 months preceding the survey. Similarly, the second, red, bar indicates the predicted probability of contraceptive use if all of the women in the sample were visited by a health worker. The difference of the predicted probability of contraceptive use obtained with and without a health worker visit is the hypothetical impact of a health worker visit on contraceptive use. Figure 2 clearly indicates that the impact of a health worker visit on contraceptive use varies with ethnicity. While the impact is highest among Muslim women, it is lowest among the Brahmin, Chhetri and Madhesi ethnic groups. Using the same logic, we confirm that the impact of the family planning program (health facility visit, exposure to family planning on radio and television and in the radio drama) on contraceptive use varies among the different ethnic groups in Nepal (Figures 3-6).

Demographic Research: Volume 25, Article 27
Figure 2: Predicted probability of modern contraceptive use by currently married women aged 15-49 with and without health worker's visit
0.00
0.10
0.20
0.30
0.40
0.50
0.60
0.70
Brahmin &Chhetrie
Madhesi Dalit Newar* Janjati Muslim
Pred
icte
d P
roba
bilit
y
No HW Visit HW Visit
* Health worker’s visit on contraceptive use was not significant
Figure 3: Predicted probability of modern contraceptive use by currently
married women aged 15-49 with and without health facility visit
0.00
0.10
0.20
0.30
0.40
0.50
0.60
Brahmin &Chhetrie
Madhesi* Dalit* Newar Janjati* Muslim
Pred
icte
d Pr
obab
ility
No HF VisitHF Visit
* Effect of health facility visit on contraceptive use was not significant
http://www.demographic-research.org 859

Sharma, Pratap KC & Ghimire: Ethnic differences in contraceptive use in Nepal
Figure 4: Predicted probability of modern contraceptive use by currently married women of aged 15-49 with and without exposure to FP on radio
0.00
0.10
0.20
0.30
0.40
0.50
0.60
Brahmin &Chhetrie
Madhesi Dalit* Newar* Janjati Muslim*
Pred
icte
d Pr
obab
ility
No FP on RadioFP on Radio
* Effect of exposure of family planning information on radio on contraceptive use was not significant
Figure 5: Predicted probability of modern contraceptive use by currently
married women aged 15-49 with and without exposure to FP on television
0.00
0.10
0.20
0.30
0.40
0.50
0.60
Brahmin &Chhetrie*
Madhesi* Dalit* Newar* Janjati* Muslim
Pred
iced
Pro
babi
lity
No FP on TVFP on TV
`
* Effect of exposure to family planning information on Television on contraceptive use was not significant
860 http://www.demographic-research.org

Demographic Research: Volume 25, Article 27
Figure 6: Predicted probability of modern contraceptive use by currently married women aged 15-49 with and without listening to radio drama Janswasthya
0.00
0.10
0.20
0.30
0.40
0.50
0.60
Brahmin &Chhetrie*
Madhesi* Dalit* Newar* Janjati Muslim*
Pred
icte
d Pr
obab
ility
Not Listen JS Listen JS
* Effect of exposure of family planning information on Janswasthya on contraceptive use was not significant
4. Discussion
Findings from this analysis indicate that modern contraceptive use among currently married women of reproductive age in Nepal has increased over the past ten years, from 26% in 1996 to 46% in 2006. The increased contraceptive use was attributed to individual socio-demographic, household, and program factors. Age, ethnicity, and occupation were the important individual-level factors contributing to contraceptive use. Household economic status measured by the possession of household goods and amenities was also a strong predictor of contraceptive use. Among four cluster-level indicators the mean household asset in the cluster was the only significant predictor of contraceptive use. Out of the six program variables used in the analysis, five were associated with increased contraceptive use. Exposure to family planning information on radio and television and contact of women with a health worker were the important program variables contributing to contraceptive adoption.
The impact of the program variables on contraceptive use differed by ethnicity. For example, health worker's visit was not associated with contraceptive use among Newars. Similarly there was no association between health facility visit and contraceptive use among the Dalit and Teraimadhesi ethnic groups. While exposure to family planning information on the radio was not associated with contraceptive use among Newars, Dalits, and Muslims, exposure to family planning information on
http://www.demographic-research.org 861
Sharma, Pratap KC & Ghimire: Ethnic differences in contraceptive use in Nepal
862 http://www.demographic-research.org
television was associated with contraceptive use only among Muslims. The radio program Janswasthya was only associated with contraceptive use among Brahmins, Chhetries, and Janjatis.
There was also ethnic variation in the trend of contraceptive use. For example, contraceptive use among Muslims and Newars has not increased significantly over the last decade. The impact of household and cluster-level economic status on contraceptive use also varied by ethnicity. While household economic status was not associated with contraceptive use among Muslims, its effect on contraceptive use was strongest among Newars, followed by Brahmins and Chhetries, Dalits, Teraimadhesis, and Janjatis.
The impact of the women's occupation on contraceptive use also varied by ethnicity. While only Brahmin, Chhetri, and Newar women who were working in business or service were more likely to use modern contraceptives than their non-working counterparts, Teraimadhesi and Dalit women who were working in any field were more likely to use contraceptives than women who were not working. Muslim women who were engaged in manual work were more likely to use contraceptives than Muslim women who were not working.
The issue of ethnic variation in health care has been explored by Bennett and Dahal (2008). They argue that the Government of Nepal fails to provide equal access to public services to people lower in the ethnic hierarchy, to women, and to the Teraimadhesi ethnic group, and that illiteracy, poverty, and low socioeconomic status are the reasons fort he exclusion.
This analysis also showed that modern contraceptive use varied across clusters; some 20% of the variation in contraceptive use was attributed to the cluster. Individual, household, cluster, and program variables added in the models were partially able to explain the cluster-level variation of contraceptive use. Possible reasons for the presence of unexplained community residual variation in contraceptive use may be due to the lack of community level factors included in the model (Stephenson et al. 2007). In the absence of community level variables we used the factors derived from individual responses in the cluster. The presence of community residual variation in contraceptive use has also been shown in previous studies conducted in South Africa, Bangladesh, and India (Stephenson et al. 2007; Stephenson and Tsui 2002; Amin, Basu, and Stephenson 2002). The cluster level indicators used in this analysis were derived from the individual responses. Therefore, inclusion of community level factors such as the presence of employment opportunities or institutions that facilitate social interaction would reduce the cluster-level residual variation in contraceptive use (Stephenson et al. 2007).
This analysis also indicated that household economic status was a strong determinant of contraceptive use behavior, although its impact on contraceptive use varies by ethnicity. We also found that large percentages of Muslim women fail to use

Demographic Research: Volume 25, Article 27
http://www.demographic-research.org 863
modern contraceptives, and the trend in the last decade is not encouraging. The question of why such a large proportion of Muslims are not using contraceptives should be a subject of further exploration. However, we can speculate that this is due to language and cultural barriers and their feeling of being discriminated against, which need to be addressed by the family planning program.
It is also evident that, despite geographical and cultural difficulties, ethnic minority groups are open to adopting family planning when services are accessible and provided in a culturally acceptable manner (Bertrand, Seiber, and Escudero 2001). Therefore, future family planning program intervention in Nepal should be designed as context-specific so as to make it acceptable to different cultures. Nepal is a country of great geo-physical, climatic, and biological diversity that has resulted in diverse socio-economic and cultural patterns. It is divided into three ecological belts: 15% of the total land area is high mountains, called the mountain region; 68% of the area is high land, called the hill region; and 17% of the area is flat land, called the Terai region. Different approaches should be applied to expand the family planning program in mountain, hill, and Terai regions, and also among the different ethnic groups. It is argued that the ethnic variation in contraceptive use is due to cultural and knowledge barriers affecting women's access to health care. Therefore ethnic minorities should be made more aware of the importance of the family planning program. Special program attention should be paid to the Muslim, Dalit, and Madhesi women, because these groups have low levels of contraceptive use and other health indicators, and together these groups make up 28% of Nepal’s population. If they are not reached Nepal’s progress on the MDG will stall (Bennett and Dahal 2008).
Finally, future interventions in Nepal designed to attain the MDG should be based on the socio-cultural conditions of the different ethnic groups. The community health workers, including FCHVs (Female Community Health Volunteers), should be encouraged to disseminate health information in the local language. They should also be motivated to serve Dalits and other ethnic minorities without violating the local cultural norms. Members of the local ethnic groups should be integrated into the working teams that deliver the family planning message to Muslim, Teraimadhesi, and Dalit women.
5. Limitations
Although the analysis has highlighted various issues of ethnic difference in the impact of the family planning program on modern contraceptive use in Nepal, the analysis has various limitations. One important limitation is that the analysis used cross-sectional data; therefore the causality must be explained with caution. There may also be some

Sharma, Pratap KC & Ghimire: Ethnic differences in contraceptive use in Nepal
864 http://www.demographic-research.org
problem regarding the ethnicity categorization. The Population Census of Nepal 2001 lists more than 100 ethnicities in Nepal. Condensing these ethnicities into six categories is very difficult. The lack of data collected at the cluster-level and by health facilities limits this analysis, and reflects the continued presence of community-level variation in contraceptive use. This highlights the need to include community-level data to improve our understanding of contextual influences on contraceptive use that exist beyond the individual and the household.
6. Acknowledgements
This analysis is based on secondary analysis of Nepal Family Health Survey, 1996 and Nepal Demographic and Health Survey 2001 and 2006. These studies were carried out by Ministry of Health and Population and New Era and were supported by the United States Agency for International Development and Macro International. The authors would like to thank the reviewers for their constructive feedback in improving the quality of this paper.

Demographic Research: Volume 25, Article 27
http://www.demographic-research.org 865
References
Addai, I. (1999). Ethnicity and contraceptive use in sub-Saharan Africa: The case of Ghana. Journal of Biosocial Science 31(1):105-120. doi:10.1017/S00219320990 01054.
Amin, S., Basu, A.M., and Stephenson, R. (2002). Spatial variation in contraceptive use in Bangladesh: Looking beyond the borders. Demography 39(2): 251-267. doi:10.1353/dem.2002.0014.
Aryal, R.H., Pathak, R.S., Dottel, B.R., and Pant, P.D. (2008). A comparative analysis of unmet need in Nepal: Further analysis of the 2006 Nepal Demographic and Health Survey. Calverton, Maryland, USA: Macro International Inc.
Bennett, L. and Dahal, D.R. (2008). Caste, ethnic, and regional identity dimensions of the Nepal 2006 Demographic and Health Survey. Calverton, Maryland, USA: Macro International Inc.
Bertrand, J.T., Magani, R.J., and Rutenberg, N. (1996). Evaluating Family Planning Programs: With Adaptations for Reproductive Health. Chapel Hill: The Evaluation Project.
Bertrand, J.T., Seiber, E., and Escudero, G. (2001). Contraceptive dynamics in Guatemala: 1978-1998. International Family Planning Perspectives 27(3): 112-118+136. doi:10.2307/2673832.
Christman, S.K. and Zawacki, T. (2009). Understanding ethnic disparities in contraceptive use: The mediating role of attitudes. Undergraduate Research Journal for the Human Science 8. (University of Texas at San Antonio).
Dahal, G.P., Padmadas, S.S., and Hinde, P.R.A. (2008). Fertility-limiting behavior and contraceptive choice among men in Nepal. International Family Planning Perspective 34(1): 6–14. doi:10.1363/3400608.
Desai, J. and Tarozzi, A. (2010). Microcredit, family planning programs and contraceptive behavior: Evidence from a field experiment in Ethiopia. Demography 48(2): 749-782. doi:10.1007/s13524-011-0029-0.
Emens, A. (2008). Perceived fertility regulation costs and contraceptive use in Nepal. Michigan: Michigan University. (Population Studies Center Research Report 08-644).
Goldstein, H. (1995). Multilevel Statistical Models. London: Edward Arnold. doi:10.1002/9780470973394.
Sharma, Pratap KC & Ghimire: Ethnic differences in contraceptive use in Nepal
866 http://www.demographic-research.org
Gupta, N., Katende, C., and Bessinger, R. (2003). Association of mass media exposure with family planning attitudes and practices in Uganda. Studies in Family Planning 34(1): 19-31. doi:10.1111/j.1728-4465.2003.00019.x.
Hox, J.J. (2010). Multilevel Analysis Techniques and Applications. New York: Taylor and Francis Group.
Johnson, K. and Bradley, S.E.K. (2008). Trend in Economic Differentials in Population and Health Outcomes: Further Analysis of the 2006 Nepal Demographic and Health Survey. Maryland: Macro International Inc.
Karki, Y.B. and Krishna, R. (2008). Factors responsible for the rapid decline of fertility in Nepal-an interpretation: Further Analysis of the 2006 Nepal Demographic and Health Survey. Maryland: Macro International Inc. http://www.measuredhs. com/pubs/pdf/FA52/FA52.pdf.
Ministry of Health and Population (MoHP) [Nepal], New Era, and Macro International Inc. (2002). Nepal Demographic and Health Survey 2001. Kathmandu: MoHP.
Ministry of Health and Population (MoHP) [Nepal], New Era, and Macro International Inc. (2007). Nepal Demographic and Health Survey 2006. Kathmandu: MoHP.
Pradhan, A., Aryal, R.H., Regmi, G., Ban, B., and Govindasamy, P. (1997). Nepal Family Health Survey 1996. Kathmandu: MoHP.
Rabe-Hesketh, S., Skrondal, A., and Pickles, A. (2004). GLLAMM Manual. Berkeley: Division of Biostatistics. (Working Paper Series 160). http://www.bepress.com/ ucbbiostat/paper160.
Raine, T., Harper, C., Paukku, M., and Darney, P. (2002). Race, adolescent contraceptive choice, and pregnancy at presentation to a family planning clinic. Obstetrics and Gynecology 99(2): 241-247. doi:10.1016/S0029-7844(01)01714-8.
Sharan, M. and Valente, T.W. (2002). Spousal communication and family planning adoption: Effects of a radio drama serial in Nepal. International Family Planning Perspectives 28(1): 16-25. doi:10.2307/3088271.
Stephenson, R., Baschieri, A., Clements, S., Hennink, M., and Madise, N. (2007). Contextual influences on modern contraceptive use in sub-Saharan Africa. American Journal of Public Health 97(7): 1233-1240. doi:10.2105/AJPH. 2005.071522.
Demographic Research: Volume 25, Article 27
http://www.demographic-research.org 867
Stephenson, R., Beke, A., and Tshibangu, D. (2008). Community and health facility influences on contraceptive method choice in the Eastern Cape, South Africa. International Family Planning Perspectives 34(2): 62-70. doi:10.1363/3406208.
Stephenson, R.B. and Tsui, A.O. (2002). Contextual influences on reproductive health service use in Uttar Pradesh, India. Studies in Family Planning 33(4): 309-320. doi:10.1111/j.1728-4465.2002.00309.x.

Sharma, Pratap KC & Ghimire: Ethnic differences in contraceptive use in Nepal
868 http://www.demographic-research.org