ethiopia west showa numeracy boost endline · es effect size. the effect size is a measure of the...
TRANSCRIPT
1
Ethiopia West Showa Numeracy Boost
Endline
Authors: Ali Amente, Clara Pava & Motuma Takele
With special thanks to our team of assessors!
December 2015
© 2015

2

3
Table of Contents List of Acronyms and Definitions ................................................................................................................... 5
Executive Summary ........................................................................................................................................... 6
I. Introduction ............................................................................................................................................... 7
II. Context ....................................................................................................................................................... 8
III. Implementation History ....................................................................................................................... 8
IV. Methods .................................................................................................................................................. 9
Sampling ......................................................................................................................................................... 9
Measurement ................................................................................................................................................ 10
Analysis ......................................................................................................................................................... 12
V. Student Descriptive Statistics ................................................................................................................ 12
Presence at Endline ..................................................................................................................................... 12
Student Background Characteristics ......................................................................................................... 12
Home Numeracy Environment ................................................................................................................ 13
VI. Endline Results .................................................................................................................................... 14
Program Impact of Numeracy Boost .................................................. Error! Bookmark not defined.
Overall Impact.................................................................................... Error! Bookmark not defined.
Individual Constructs Analysis .................................................................................................................. 16
Numbers and Operations ...................................................................................................................... 16
Geometry ................................................................................................................................................. 17
Measurement ........................................................................................................................................... 19
Impact by Subgroups (ELM and LB) ....................................................................................................... 19
ELM .......................................................................................................................................................... 19
LB .............................................................................................................................................................. 20
VII. Learning Equity and Struggling Students......................................................................................... 20
Girls ............................................................................................................................................................... 20
ECD attendance .......................................................................................................................................... 21
SES and Home Numeracy Environment ................................................................................................ 21
Struggling students ...................................................................................................................................... 22
VIII. Conclusion........................................................................................................................................ 22
4
Appendix A. Descriptive Statistics ................................................................................................................ 24
A1. Background Characteristics of Children at Endline........................................................................ 24
A2. Home Numeracy Environment of children. Baseline, endline, and gains. ................................. 24
Appendix B. Multivariate regression analyses .............................................................................................. 25
Appendix B2. Home Numeracy Environment and Endline Scores .................................................... 26
Appendix B3. Struggling Students Characteristics ................................................................................. 27
Appendix B3. Predicted gains for struggling students ........................................................................... 28
5
List of Acronyms and Definitions
ELM Emergent Literacy and Math
ES Effect size. The effect size is a measure of the magnitude of an observed difference,
expressed in standard deviations in order to compare across different types of measures.
HNE Home Numeracy Environment
LB Literacy Boost
NB Numeracy Boost
SES Socioeconomic Status

6
Executive Summary
This report examines the results of a learner background survey and numeracy assessment
conducted in West Showa, Ethiopia prior to beginning the Numeracy Boost (NB) intervention and
again after nine months of implementation. The baseline survey and numeracy assessment covered
660 grade 2 learners throughout 30 schools (10 NB, 5 NB+ELM, 5 NB+ELM+LB, and 10
comparison schools) and was administered in October 2014. The follow-up gathered data again
from 529 of these children. The learner background survey covered student socio-economic status
and home numeracy environment questions amongst others. The numeracy assessment covered
three constructs: numbers and operations, geometry and measurement. Also, three time
identification questions were included in the assessment.
The results show a similar Home Numeracy Environment of students in NB and intervention
schools with very low access to child friendly materials at home. In terms of impact, the results show
that the overall impact of the Numeracy Boost program in the region has been high. Over the
period of eight months children in Numeracy Boost schools had significant higher gains as
compared to students in comparison schools in 14 out of the 17 numeracy skills assessed after
controlling for background characteristics and baseline scores. The three skills were statistically equal
gains between intervention and comparison groups were found were counting, one-to-one
correspondence and measurement, with the first two being skills that students had already mastered
so the no difference in gains is not practically significant.
The evaluation was also meant to provide a sense of the difference in achievement amongst
subgroups (those children that had been exposed to ELM programming and LB programming
before) but the results are limited in this front as we did not have a reliable source of information to
determine whether the students in the sample were exposed to these programs. They show modest
higher gains for children in LB programming schools in three out of 17 skills and modest higher
gains for the “zero subtest” and a lower gain for number identification for students in districts with
ELM programming.
Finally, in terms of learning equity there are a few skills where boys’ scores outperform girls’ at
endline (magnitude, missing value, and time) and where high numeracy environments at endline are
predictive of higher endline scores (ordering numbers, shape patterns, and shapes).
7
I. Introduction
This report examines the results of a learner background survey and numeracy assessment
conducted in West Showa, Ethiopia prior to beginning the Numeracy Boost (NB) intervention and
again after nine months of implementation. The baseline survey and numeracy assessment covered
660 grade 2 learners throughout 30 schools and was administered in October 2014. The follow-up
gathered data again from 529 of these children. The 30 schools are split into 20 primary schools
designated to receive Numeracy Boost (split into five that had received ELM and LB programming
in the past, five that had received ELM programming, and 10 that had not received any previous
Save the Children programming) and 10 comparison primary schools receiving no intervention. This
report explores: the comparability of the learners in Numeracy Boost and comparison schools, the
skills profiles at baseline and endline, and equity in learning by gender, poverty, home literacy and
other characteristics. These results will inform targeting of further interventions.
The Numeracy Boost program includes teacher training, community math activities, and age-
appropriate local language materials creation to support emergent math skills among early-grade
children. These skills include numbers and operations, geometry and measurement. As part of
Numeracy Boost, learners are periodically assessed in each of these skills through an adaptable
assessment tool to inform programming and estimate program impact.
The key research questions to be explored in this report include:
1. How has the sample of learners changed over time?
o Are the learners who were able to be found at endline different than those who were not
able to be found? If so, how?
o Did the attrition rate differ between Numeracy Boost and comparison learners?
2. Of the students who were able to be found at endline, how comparable are baseline
background characteristics and numeracy skills among Numeracy Boost learners versus comparison
learners?
3. What can the endline assessment tell us about students’ math skills?
o What does this mean for continuing Numeracy Boost programming in this area?
4. Did the Numeracy Boost program exhibit impact on learners’ numeracy skills?
o For which types of learners was impact the greatest/least?
o Does this impact result in more equitable outcomes for traditionally disadvantaged groups?
o Did this impact vary between children that had received previous Save the Children
programming and those who had not?
5. How does learners’ development of numeracy skills vary over time by learner background
and community literacy environment?
o What does this mean for targeting Numeracy Boost’s various intervention components?

8
To investigate these questions, this report first describes the context and implementation history of
Numeracy Boost in West Showa. Next, this report gives an overview of the research methods used;
including sampling, measurement, and analysis. The report will then analyze the attrition of the
sample over time and how intervention and comparison groups have or have not remained
statistically similar. The report will then present results from impact analysis investigating the extent
to which Numeracy Boost appears to have improved learners’ numeracy skills. After this, learners’
endline scores for each of the numeracy skills will be analyzed to determine which skills learners
have mastered and which require additional improvement. Finally, the report will investigate any
correlations between baseline-endline numeracy skill development and student background or
community numeracy environment variables using multivariate regression analysis.
II. Context
The West Showa Impact Area is one of Save the Children’s Sponsorship core programs intervention
areas since 2009. The West Showa zone covers 18 districts with about 824 primary schools. Save the
Children’s Sponsorship program is currently under implementation in four of these districts- Dendi,
Ejere, Toke Kutaye and Ambo-where there are 203 primary schools.
The Numeracy Boost pilot project covers Dendi and Ambo districts which have had LB
programming in primary schools and ELM programs in ECCD centers since 2011 and 2012
respectively. For this evaluation, schools in districts were purposely selected to assess the
contribution of LB and ELM on children’s Numeracy Skills. For this reason, five primary schools
with LB and NB interventions and five others with ELM and NB interventions were chosen as part
of the evaluation sample. Besides these two districts, Toke Kutaye, a newly enrolled district for Save
the Children’s Sponsorship program and that has 10 primary schools with only NB programming
was selected to measure the impact of exclusive NB programming on children’s numeracy skills. To
be able to have a valid comparison, 10 schools from Cheliya, a district with no Save the Children
interventions, were selected as comparison schools. With this, a total of 30 schools were identified
for the NB assessment.
III. Implementation History
The Numeracy Boost program in the West Shewa region of Ethiopia started towards de end of
2014. Baseline data was collected in October 2014 and actual implementation started in November
of the same year with the teacher training activities. By April 2015 teacher trainings and follow-ups
had happened and 53 math camps had been celebrated in 20 intervention schools. Complete details
of implementation can be found on Table 1.
Table 1. Implementation Timeline and Outputs
Date Activity Output
Oct 2014 Baseline assessment - 656 students assessed, 219 from
Comparison and 437 from NB schools (
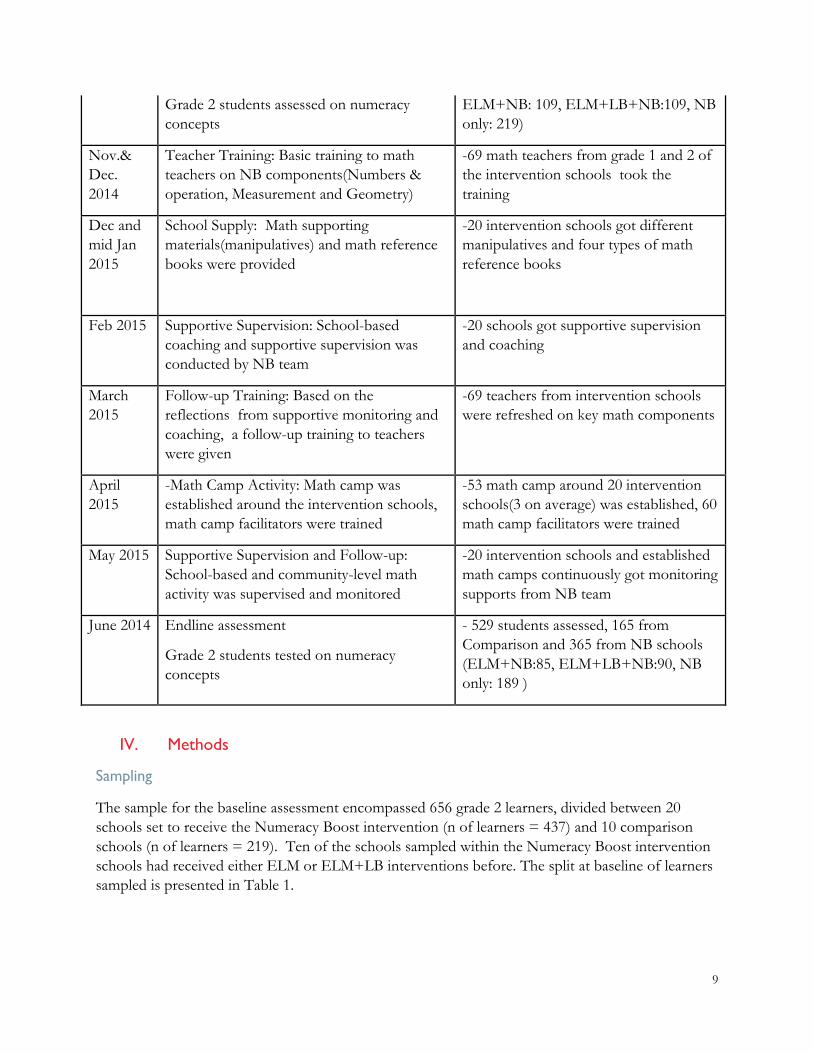
9
Grade 2 students assessed on numeracy
concepts
ELM+NB: 109, ELM+LB+NB:109, NB
only: 219)
Nov.&
Dec.
2014
Teacher Training: Basic training to math
teachers on NB components(Numbers &
operation, Measurement and Geometry)
-69 math teachers from grade 1 and 2 of
the intervention schools took the
training
Dec and
mid Jan
2015
School Supply: Math supporting
materials(manipulatives) and math reference
books were provided
-20 intervention schools got different
manipulatives and four types of math
reference books
Feb 2015 Supportive Supervision: School-based
coaching and supportive supervision was
conducted by NB team
-20 schools got supportive supervision
and coaching
March
2015
Follow-up Training: Based on the
reflections from supportive monitoring and
coaching, a follow-up training to teachers
were given
-69 teachers from intervention schools
were refreshed on key math components
April
2015
-Math Camp Activity: Math camp was
established around the intervention schools,
math camp facilitators were trained
-53 math camp around 20 intervention
schools(3 on average) was established, 60
math camp facilitators were trained
May 2015 Supportive Supervision and Follow-up:
School-based and community-level math
activity was supervised and monitored
-20 intervention schools and established
math camps continuously got monitoring
supports from NB team
June 2014 Endline assessment
Grade 2 students tested on numeracy
concepts
- 529 students assessed, 165 from
Comparison and 365 from NB schools
(ELM+NB:85, ELM+LB+NB:90, NB
only: 189 )
IV. Methods
Sampling
The sample for the baseline assessment encompassed 656 grade 2 learners, divided between 20
schools set to receive the Numeracy Boost intervention (n of learners = 437) and 10 comparison
schools (n of learners = 219). Ten of the schools sampled within the Numeracy Boost intervention
schools had received either ELM or ELM+LB interventions before. The split at baseline of learners
sampled is presented in Table 1.

10
Table 1. Baseline Sample
Group Subsample Female Male Total
Comparison Comparison 110 109 219
NB ELM+NB 54 55 109
ELM+LB+NB 54 55 109
NB only 110 109 219
Total 328 328 656
At each of the Numeracy Boost and comparison schools where data was collected, 22 children-11
girls and 11 boys- in grade 2 were sampled. If there was more than one section of grade 2 at a given
school, one section was randomly selected. At endline, data was collected from as many students of
those that participated in the baseline assessment as could be found. The resulting sample can be
found on Table 2.
Table 2. Endline sample
Group Subsample Female Male Total
Comparison Comparison 73 92 165
NB ELM+NB 44 41 85
ELM+LB+NB 44 46 90
NB only 94 95 189
Total 255 274 529
Measurement
For the student assessment, all learners in the sample were asked about their background
characteristics (age, household possessions, household building materials, etc.). Learners also were
asked about their family members and numeracy habits in their home (who they had seen doing
math in the week prior to the assessment, who had ask them to help doing something that required
math, etc). Table 3 offers examples of school survey items, background, and home literacy
indicators.
Table 3. Student Background and Home Numeracy Environment Data Collected
Type of Data Collected Examples
Student Background
General
Sex, age, language spoken at home
School-related Distance to school, repetition history, previous ECD attendance
Socioeconomic status Household possessions, house building materials and access to public
11
services, livestock
Children’s Time Type of chores, amount of time spent on chores, amount of time spent studying
Home Numeracy Environment
Access to print Types of materials present in home
Math at home Presence and percentage of family members who children see using numbers, who ask children to do math, and who play math games with the child
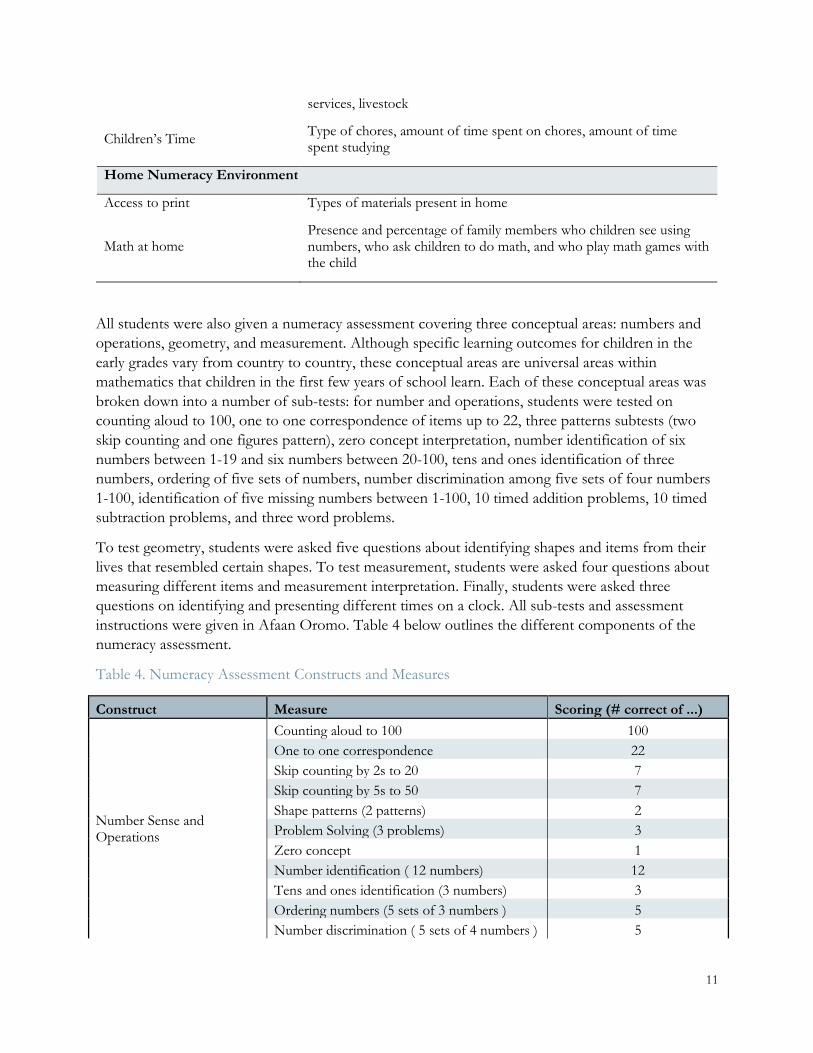
All students were also given a numeracy assessment covering three conceptual areas: numbers and
operations, geometry, and measurement. Although specific learning outcomes for children in the
early grades vary from country to country, these conceptual areas are universal areas within
mathematics that children in the first few years of school learn. Each of these conceptual areas was
broken down into a number of sub-tests: for number and operations, students were tested on
counting aloud to 100, one to one correspondence of items up to 22, three patterns subtests (two
skip counting and one figures pattern), zero concept interpretation, number identification of six
numbers between 1-19 and six numbers between 20-100, tens and ones identification of three
numbers, ordering of five sets of numbers, number discrimination among five sets of four numbers
1-100, identification of five missing numbers between 1-100, 10 timed addition problems, 10 timed
subtraction problems, and three word problems.
To test geometry, students were asked five questions about identifying shapes and items from their
lives that resembled certain shapes. To test measurement, students were asked four questions about
measuring different items and measurement interpretation. Finally, students were asked three
questions on identifying and presenting different times on a clock. All sub-tests and assessment
instructions were given in Afaan Oromo. Table 4 below outlines the different components of the
numeracy assessment.
Table 4. Numeracy Assessment Constructs and Measures
Construct Measure Scoring (# correct of ...)
Number Sense and Operations
Counting aloud to 100 100
One to one correspondence 22
Skip counting by 2s to 20 7
Skip counting by 5s to 50 7
Shape patterns (2 patterns) 2
Problem Solving (3 problems) 3
Zero concept 1
Number identification ( 12 numbers) 12
Tens and ones identification (3 numbers) 3
Ordering numbers (5 sets of 3 numbers ) 5
Number discrimination ( 5 sets of 4 numbers ) 5

12
Missing numbers identification (8 numbers) 8
Timed addition (10 problems) 10
Timed subtraction (10 problems) 10
Geometry Shape identification (5 questions) 5
Measurement Measuring items (4 questions) 4
Time identification (3 questions) 3
Analysis
The critical purpose of this analysis is to estimate the impact of Numeracy Boost programs on
children’s reading and math skills, as well as to perform an in-depth analysis of each skill to inform
future programming. Summary statistics will be used to analyze students’ performance in each of the
reading and math sub-tests. To test the comparability of students in the samples, this report will use
comparison of means through t-tests, with clustered standard errors to account for the grouping of
student-level data within schools. Finally, this report will look to multilevel regression models to
explore relationships between literacy skills and student background characteristics, school
environment, and home numeracy environment.
V. Student Descriptive Statistics
Presence at Endline
Of the 656 students surveyed at baseline, 529 were found at endline (80.1%). Student attrition was
more likely amongst students that were not part of the numeracy program (the probability of
attrition for Numeracy Boost students was 16.7% vs. 25% of the comparison students), and those
with less household members.
Schools with a particular high number of students not present at endline were: Barkume Uko (47%
of students missing), Sire Silase (41% of students missing), and Rafiso Kortu (40% of students
missing). The main reason for students missing at endline was the timing of the data collection. June
was the end of academic year for Ethiopia and some students were not attending school. In
addition, the month of June is a rainy and busy month in which the rural community is cultivating
and some children are supporting their family in farms. Also, crossing rivers to attend school is
difficult for children at this time of the year.
Student Background Characteristics
At endline, students are 10 years old in average, 48% of them are female and 99% speak Afaan
Oroomo at home. About 34% of them have attended an ECD/preschool program before, they have
been in school for an average of 2.6 years and 21% repeated grade 1. In terms of socioeconomic
characteristics 84% of them live in a house with an iron sheets roof and only 20% have access to
electricity. Appendix A1 contains further details on the characteristics of students at endline divided
by group.
There are a few characteristics at endline that are different between NB and Comparison students
and that need to be taken into account for impact analysis. These are: age, ECD, time in school,

13
household members, grade 1 repetition, iron sheets roof, and to a lesser extent the presence of a
bicycle and electricity at home. Controlling for these variables that are different at endline will
be important to understand the real extent of the program’s effect in children’s skills.
Home Numeracy Environment
In terms of the Home Numeracy Environment (HNE), gains of students from comparison schools
are larger for the majority of child friendly materials and numeracy habits. However, the only
statistical significant difference in gains comes from children seeing someone doing math at home.
Further information on the students’ home numeracy environment can be found in Appendix A2.
Figure 1. Reading Materials.
Percentage of children that report having child-friendly reading materials at home. Baseline scores
and gains
p-value for difference in gains: ~10%, * 5%, ** 1 %, ***0.1%.
7.9
4.7 5.5 4.1
0.6 2.5 0
10
20
30
40
50
Comparison NB Comparison NB Comparison NB
Storybooks Coloringbooks Comics
Baseline Gain

14
Figure 2. Numeracy Habits
Percentage of family members that…
p-value for difference in gains: ~10%, * 5%, ** 1 %, ***0.1%.
VI. Endline Results
Overall Impact
Over the period of eight months children in Numeracy Boost schools had significant higher gains as
compared to students in comparison schools in 14 out of the 17 numeracy skills assessed after
controlling for background characteristics and baseline scores. The average effect size across subtest
gains differences was of 0.5 (which is considered a medium effect size).1 Details on baseline score,
endline scores, gains can be found on Table 5.
1 Widely cited statistician Jacob Cohen describes effect sizes of .2 as small, .5 as medium, and .8 as large. Cohen, J.:
Statistical Power Analysis for the Behavioral Sciences. (2nd ed.) 1988.
34.3 39.647.5 51.8
28.0 34.3 30.2 37.2
30.9 25.2 20.6 16.6
32.8 30.1
25.6
27.8
0
10
20
30
40
50
60
70
80
90
100
Comparison NB Comparison NB Comparison NB Comparison NB
The child has seen doingmath ~
Told child to study Told child to do math Played math games withchild
Baseline Gain
15
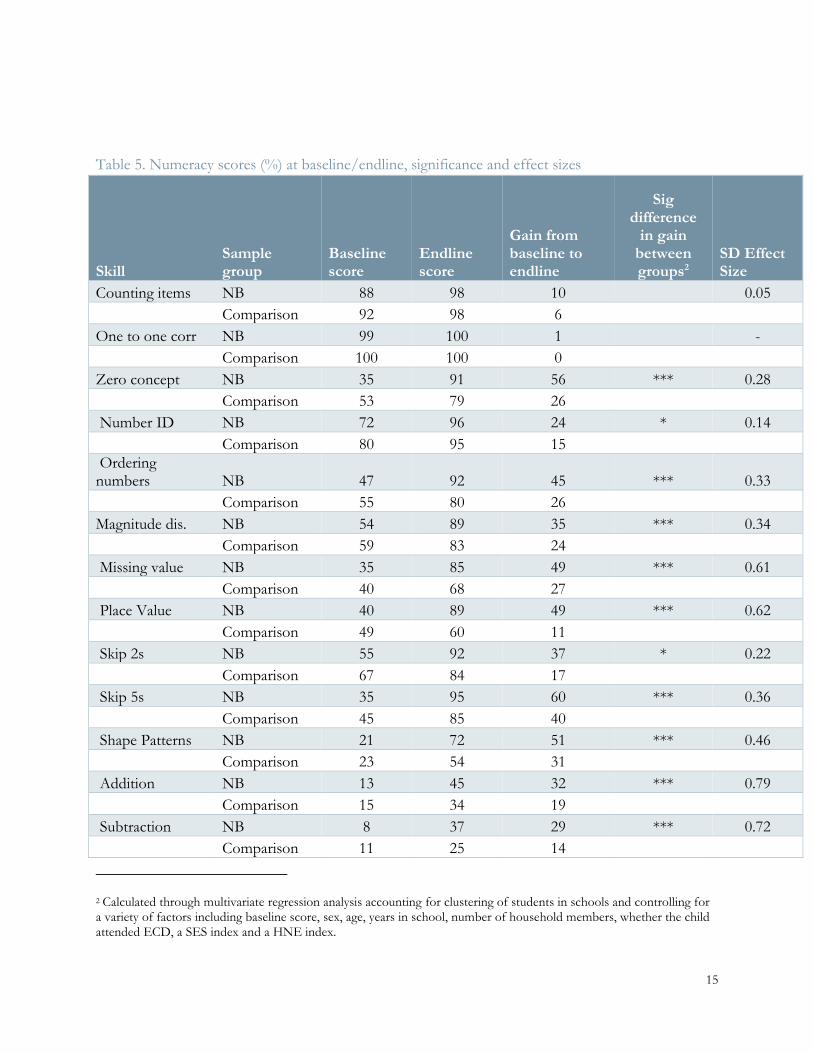
Table 5. Numeracy scores (%) at baseline/endline, significance and effect sizes
Skill Sample group
Baseline score
Endline score
Gain from baseline to endline
Sig difference
in gain between groups2
SD Effect Size
Counting items NB 88 98 10
0.05
Comparison 92 98 6
One to one corr NB 99 100 1
-
Comparison 100 100 0
Zero concept NB 35 91 56 *** 0.28
Comparison 53 79 26
Number ID NB 72 96 24 * 0.14
Comparison 80 95 15
Ordering numbers NB 47 92 45 *** 0.33
Comparison 55 80 26
Magnitude dis. NB 54 89 35 *** 0.34
Comparison 59 83 24
Missing value NB 35 85 49 *** 0.61
Comparison 40 68 27
Place Value NB 40 89 49 *** 0.62
Comparison 49 60 11
Skip 2s NB 55 92 37 * 0.22
Comparison 67 84 17
Skip 5s NB 35 95 60 *** 0.36
Comparison 45 85 40
Shape Patterns NB 21 72 51 *** 0.46
Comparison 23 54 31
Addition NB 13 45 32 *** 0.79
Comparison 15 34 19
Subtraction NB 8 37 29 *** 0.72
Comparison 11 25 14
2 Calculated through multivariate regression analysis accounting for clustering of students in schools and controlling for a variety of factors including baseline score, sex, age, years in school, number of household members, whether the child attended ECD, a SES index and a HNE index.

16
Word problems NB 31 80 49 ** 0.31
Comparison 36 72 36
Shapes NB 53 96 43 *** 0.67
Comparison 56 78 22
Measurement NB 53 94 42
0.05
Comparison 65 93 28
Time NB 3 70 66 *** 0.98
Comparison 4 30 26
Individual Constructs Analysis
Numbers and Operations
In Numbers and Operations, gains of Numeracy Boost students were statistically greater that the
gains made by comparison students in 12 out of 14 subtests. The two subtests where the gains were
not significantly greater were counting and one to one correspondence. However, students already
mastered these skills at endline so the no difference in gains is not practically significant. Addition
and subtraction are two skills that although significant gains were made in require further
attention. In the addition subtest students are scoring 45% on average correctly and in the
subtraction subtest 37% correct, which roughly corresponds to 1 problem correct every 15 seconds.
Figure 3 shows the baseline scores and gains for all subtests under the numbers and operations
construct where the gains between comparison and Numeracy Boost students were significantly
different at a 1% level.
Figure 3. Number sense and operations3. Baseline scores and gains by subtest
3 For space purposes 5 subtests were left out of the graph: One to one correspondence and counting had no significant differences in gains while number identification, skip2s, and word problems gains were statistically different at a 5% level

17
p-value for difference in gains: ~10%, * 5%, ** 1 %, ***0.1%. Significance was calculated through multivariate
regression analysis accounting for clustering of students in schools and controlling for a variety of factors including
baseline score, sex, age, years in school, number of household members, whether the child attended ECD, a SES index
and a HNE index.
Geometry
In the geometry subtest Numeracy Boost students had significantly higher gains than their peers.
Doing a deeper glance at the questions asked, gains were not only large in identifying figures on
paper, but also in being able to identify them in the real world. Figure 4 show the baseline scores and
gains for the geometry subtest and Figure 5 disaggregates the subtest into four out of its five
questions.
Figure 4. Geometry. Baseline scores and gains
53
35
55 47
59 54 40 35
49 40 45
35 23 21 15 13 11 8
26 56 26 45 24 35
27 49
11
49 40 60
31 51
19 32
14 29
-
10
20
30
40
50
60
70
80
90
100
Co
mp
aris
on
NB
Co
mp
aris
on
NB
Co
mp
aris
on
NB
Co
mp
aris
on
NB
Co
mp
aris
on
NB
Co
mp
aris
on
NB
Co
mp
aris
on
NB
Co
mp
aris
on
NB
Co
mp
aris
on
NB
Zero concept***
Orderingnumbers ***
Magnitudedis ***
Missingvalue ***
Place Value***
Skip 5s *** ShapesPattern ***
Addition *** Subtraction***
% C
orr
ect
Baseline Gain

18
p-value for difference in gains: ~10%, * 5%, ** 1 %, ***0.1%. Significance was calculated through multivariate
regression analysis accounting for clustering of students in schools and controlling for a variety of factors including
baseline score, sex, age, years in school, number of household members, whether the child attended ECD, a SES index
and a HNE index.
Figure 5. Geometry. Baseline scores and gains. Identifying figures on paper and in the real world
56.4 52.5
21.5 43.0
0
10
20
30
40
50
60
70
80
90
100
Comparison NB
Shapes ***
% C
orr
ect
Baseline Gain
84.0
88.6
40.3
41.6
71.9
84.5
34.1
38.8
15.2
4.1
58.6
38.3
26.8
5.8
54.4
28.3
0 10 20 30 40 50 60 70 80 90 100
NB
Comparison
NB
Comparison
NB
Comparison
NB
Comparison
Iden
tifi
es c
ircl
e
Iden
tifi
es c
ircl
ein
th
e re
alw
orl
dId
enti
fies
tria
ngl
e
Iden
tifi
estr
ian
gle
in t
he
real
wo
rld
% Correct
Baseline Gain
19
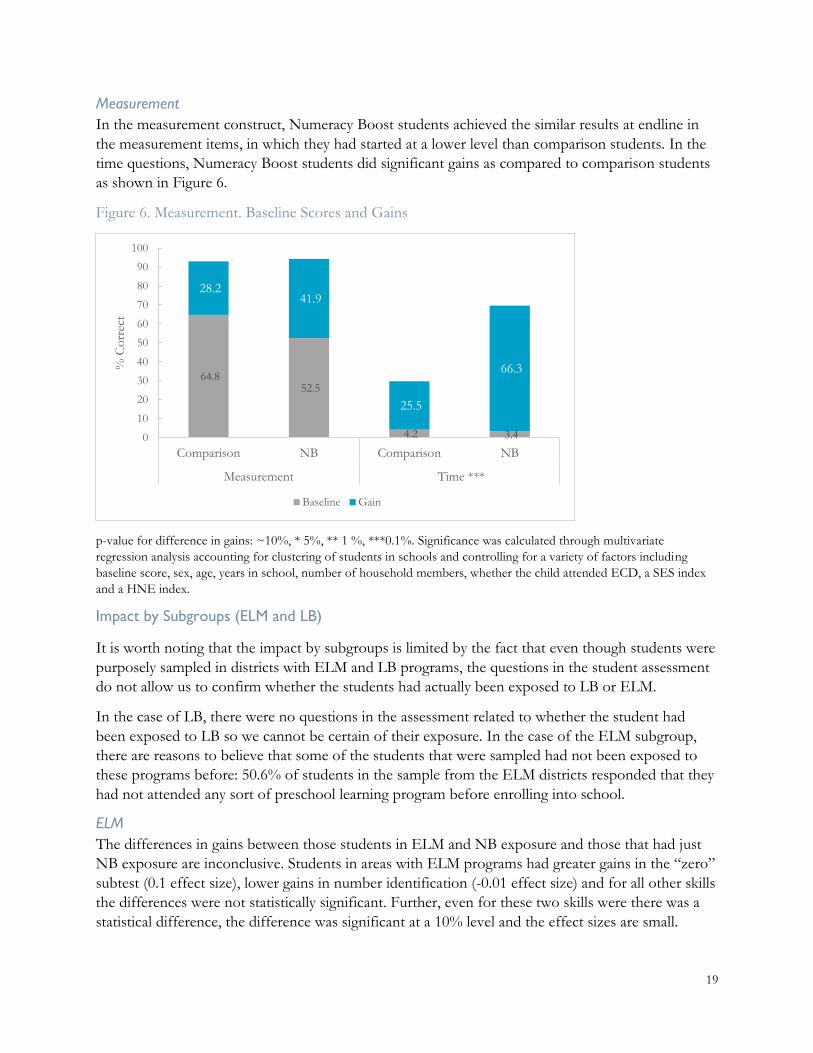
Measurement
In the measurement construct, Numeracy Boost students achieved the similar results at endline in
the measurement items, in which they had started at a lower level than comparison students. In the
time questions, Numeracy Boost students did significant gains as compared to comparison students
as shown in Figure 6.
Figure 6. Measurement. Baseline Scores and Gains
p-value for difference in gains: ~10%, * 5%, ** 1 %, ***0.1%. Significance was calculated through multivariate
regression analysis accounting for clustering of students in schools and controlling for a variety of factors including
baseline score, sex, age, years in school, number of household members, whether the child attended ECD, a SES index
and a HNE index.
Impact by Subgroups (ELM and LB)
It is worth noting that the impact by subgroups is limited by the fact that even though students were
purposely sampled in districts with ELM and LB programs, the questions in the student assessment
do not allow us to confirm whether the students had actually been exposed to LB or ELM.
In the case of LB, there were no questions in the assessment related to whether the student had
been exposed to LB so we cannot be certain of their exposure. In the case of the ELM subgroup,
there are reasons to believe that some of the students that were sampled had not been exposed to
these programs before: 50.6% of students in the sample from the ELM districts responded that they
had not attended any sort of preschool learning program before enrolling into school.
ELM
The differences in gains between those students in ELM and NB exposure and those that had just
NB exposure are inconclusive. Students in areas with ELM programs had greater gains in the “zero”
subtest (0.1 effect size), lower gains in number identification (-0.01 effect size) and for all other skills
the differences were not statistically significant. Further, even for these two skills were there was a
statistical difference, the difference was significant at a 10% level and the effect sizes are small.
64.8 52.5
4.2 3.4
28.2 41.9
25.5
66.3
0
10
20
30
40
50
60
70
80
90
100
Comparison NB Comparison NB
Measurement Time ***
% C
orr
ect
Baseline Gain

20
LB
Students in LB had higher numeracy gains than students not exposed to LB in 2 out of 17 skills
assessed: counting and skip2s. The effect size was 0.06 for counting (and the difference significant at
a 10% level) and 0.1 for skip2s (and significant at a 5% level). Given the data limitations, this suggest
that students exposed to LB might have greater gains in other skills, but we are not able to capture
them with the current data.
VII. Learning Equity and Struggling Students
This section analyzes the factors that relate to higher endline numeracy skills and higher gains in
numeracy skiils for the group of Numeracy Boost students. Specifically, we investigate whether
baseline numeracy skills and numeracy skill gains differ for traditionally disadvantaged groups, such
as girls, the poorest of the poor, the HNE-deprived, and children without previous ECD experience.
We also investigate whether students who struggled at baseline improved their test scores differently
than other students, and whether struggling students share certain demographic characteristics. To
conduct this analysis, baseline and endline data were used to construct indices of HNE and SES
socio-economic status (SES) and HNE. Multivariate regression models were used to estimate the
correlation between reading skills outcomes and these measures of equity. Details on the
multivariate regressions that this section refers to can be found in Appendix B.
Girls
Results for boys and girls that were present at baseline and endline were different for three out of
the 17 subtests at endline, and gains were different only for one of these subtests. The Numeracy
Boost program should be mindful of the skills in which girls might be falling behind-two of
which are related to number sense and operations and one which is related to measurement- and
help them catch up with their male peers. Figure 7 shows the baseline scores and gains for the
skills where endline results were statistically different between girls and boys and Appendix B1
contains the corresponding regression analysis. In the case of the time questions, not only where
endline scores but also gains statistically different for boys and girls after controlling for baseline
scores and background characteristics.

21
Figure 7. Boys and girls. Baseline scores and gains for skills with statistically significant differences in
endline scores
p-value for difference in endline scores: ~10%, * 5%, ** 1 %, ***0.1%. Significance was calculated through multivariate
regression analysis accounting for clustering of students in schools and controlling for a variety of factors including
baseline score, sex, age, years in school, number of household members, whether the child attended ECD, a SES index
and a HNE index.
ECD attendance
In three out of 17 skills, students reporting having attended an ECD program had lower gains. For
two of these skills, zero and place value, the results are marginally significant and with low effect
sizes (-0.096 and -0.09 respectively). For the time subtest the effect size was -0.2 and the difference
in gains was significant at a 5% level.
SES and Home Numeracy Environment
Gains for Numeracy Boost students were no different depending on their socioeconomic status
after controlling for other background characteristics and baseline scores showing that Numeracy
Boost did not disproportionately benefit students depending on their socioeconomic background.
The regression analysis also shows that endline scores are not different depending on SES (except
for skip 5s where it is marginally significant) showing that the most disadvantaged students do not
seem to be falling behind.
Gains and endline scores, however, were different depending on the Home Numeracy environment
of the child. A higher baseline Home Numeracy Environment index was related to higher gains (in
three of the numeracy skills assessed) and a higher Home Numeracy Environment index at endline
was related with higher endline scores (in two of the numeracy skills assessed). This demonstrates
the importance of continuing to influence the Home Numeracy Environment of children
through the program’s activities. Figure 8 shows the predicted endline scores for children for
ordering numbers, patterns, and shapes taking into account their Home Numeracy Environment.
49.258.2
31.139.1
3.11 3.66
32.3
48.1
70.7
38.0
50.7
61.9
0
10
20
30
40
50
60
70
80
90
100
Girls Boys Girls Boys Girls Boys
Magnitude ~ Missing value ~ Time*
% C
orr
ect
Baseline Boys Gain Girls Gain

22
Figure 8. Predicted endline score by Home Numeracy environment tercile (low, medium, high)
p-value for difference in endline scores: ~10%, * 5%, ** 1 %, ***0.1%.
Struggling students
For the purposes of this analysis, struggling students were defined as those students that where in
the bottom two quintiles of the number identification subtest at baseline. This subtest was chosen as
it provided enough variation in students’ baseline scores and the average in baseline scores in this
subtest was fairly high (72%).
Examining the struggling students’ characteristics, they are younger on average and pertain to a
lower Home Numeracy Environment household. In terms of their gains, they are likely to have
lower gains in 13 out of the 17 subtests assessed. Identifying struggling students and supporting
their learning can help them not to keep falling behind their more skill advantaged peers.
VIII. Conclusion
The results show that the overall impact of the Numeracy Boost program in the region has been
high. Over the period of eight months children in Numeracy Boost schools had significant
higher gains as compared to students in comparison schools in 14 out of the 17 numeracy
skills assessed after controlling for background characteristics and baseline scores. The three
skills were statistically equal gains between intervention and comparison groups were found were
counting, one-to-one correspondence and measurement, with the first two being skills that students
had already mastered so the no difference in gains is not practically significant.
In terms of the difference in achievement amongst subgroups (those children that had been exposed
to ELM programming and LB programming before) the results are limited in this front as we did
not have a reliable source of information to determine whether the students in the sample were
exposed to these programs. The results show however modest higher gains for children in LB
programming schools in three out of 17 skills and modest higher gains for the “zero subtest” and a
lower one for number identification for students in districts with ELM programming. One avenue
89.2
68.2
94.492.4
72.2
95.695.6
76.2
96.8
0
10
20
30
40
50
60
70
80
90
100
Ordering Numbers* Shape Patterns* Shapes~
% C
orr
ect
Low Medium High

23
for future research is to purposely identify students that have had confirmed participation in
ELM and/or Literacy Boost, and create the evaluation sample based on these students.
Finally, in terms of learning equity there are a few skills were boys scores outperform girls at endline
(magnitude, missing value, time) and were high numeracy environments at endline are predictive of
higher endline scores (ordering numbers, shape patterns, shapes).

24
Appendix A. Descriptive Statistics
A1. Background Characteristics of Children at Endline
Whole Sample NB Comparison
Statistical sig diff (NB vs. comparison)
General characteristics Female (%) 48.2 50.0 44.2
Age (yrs) 10.1 9.9 10.4 **
Attended ECD/Preeschool (%) 33.8 45.1 9.1 ***
Time in school (yrs) 2.6 2.8 2.3 ***
Household members (n) 5.8 5.7 6.1 **
Repeater- Grade 1 (%) 21.4 24.2 15.2 *
Repeater- Grade 2 (%) 11.2 10.7 12.1 Does chores (%) 99.8 99.7 100.0 Home language-Afaan Oroomo (%) 99.2 98.9 100.0 SES
House- iron sheets roof (%) 84.3 81.3 90.9 **
House- poles walls (%) 100.0 100.0 100.0 House- dirt floor (%) 100.0 100.0 100.0 Has radio (%) 60.3 61.3 58.2 Has tv (%) 6.8 6.9 6.7 Has latrine (%) 88.3 87.6 89.7 Has electricity (%) 20.4 18.4 24.8 ~
Has bicycle (%) 1.1 1.7 0.0 ~
Livestock (n) 4.6 4.5 4.6 Observations 529 364 165 p-value: ~10%, ** 5%, *** 1 %
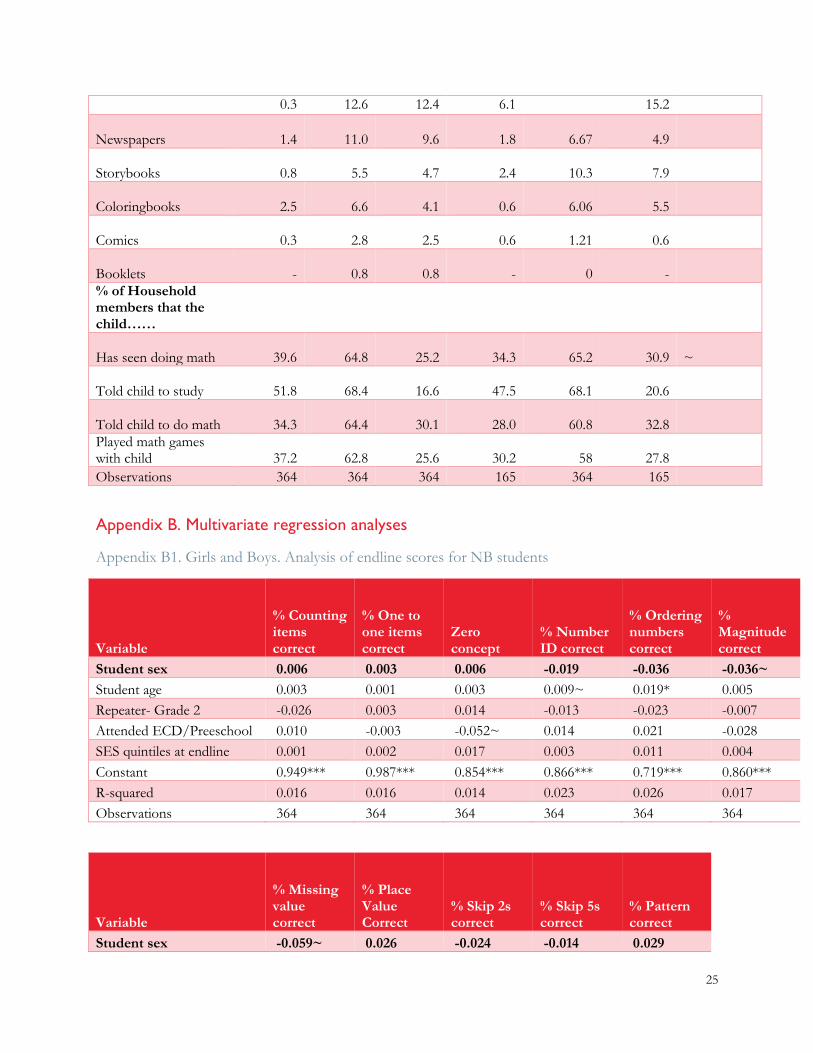
A2. Home Numeracy Environment of children. Baseline, endline, and gains.
Numeracy Boost Comparison
Baseline Endline Gain Baseline Endline Gain
Statistically significant difference in gains
% of Children that have……
Textbooks
58.2
55.8
(2.5)
79.4 58.2
(21.2)
Religious books
8.5
22.8
14.3
9.1 30.3
21.2 Magazines 21.2
25
0.3 12.6 12.4 6.1 15.2
Newspapers
1.4
11.0
9.6
1.8 6.67
4.9
Storybooks
0.8
5.5
4.7
2.4 10.3
7.9
Coloringbooks
2.5
6.6
4.1
0.6 6.06
5.5
Comics
0.3
2.8
2.5
0.6 1.21
0.6
Booklets
-
0.8
0.8 - 0 - % of Household
members that the child……
Has seen doing math
39.6
64.8
25.2
34.3 65.2
30.9 ~
Told child to study
51.8
68.4
16.6
47.5 68.1
20.6
Told child to do math
34.3
64.4
30.1
28.0 60.8
32.8 Played math games
with child
37.2
62.8
25.6
30.2 58
27.8 Observations 364 364 364 165 364 165
Appendix B. Multivariate regression analyses
Appendix B1. Girls and Boys. Analysis of endline scores for NB students
Variable
% Counting items correct
% One to one items correct
Zero concept
% Number ID correct
% Ordering numbers correct
% Magnitude correct
Student sex 0.006 0.003 0.006 -0.019 -0.036 -0.036~
Student age 0.003 0.001 0.003 0.009~ 0.019* 0.005
Repeater- Grade 2 -0.026 0.003 0.014 -0.013 -0.023 -0.007
Attended ECD/Preeschool 0.010 -0.003 -0.052~ 0.014 0.021 -0.028
SES quintiles at endline 0.001 0.002 0.017 0.003 0.011 0.004
Constant 0.949*** 0.987*** 0.854*** 0.866*** 0.719*** 0.860***
R-squared 0.016 0.016 0.014 0.023 0.026 0.017
Observations 364 364 364 364 364 364
Variable
% Missing value correct
% Place Value Correct
% Skip 2s correct
% Skip 5s correct
% Pattern correct
Student sex -0.059~ 0.026 -0.024 -0.014 0.029

26
Student age 0.007 0.009 0.012 0.004 0.010
Repeater- Grade 2 -0.053 0.039 0.033~ 0.006 -0.042
Attended ECD/Preeschool -0.043* -0.063* 0.012 0.002 -0.101**
SES quintiles at endline 0.014 -0.002 0.011 0.012~ 0.006
Constant 0.795*** 0.816*** 0.780*** 0.880*** 0.636***
R-squared 0.031 0.022 0.017 0.009 0.023
Observations 364 364 364 364 364
Variable
% Addition correct
% Subtraction correct
% Word problems correct
% Shapes correct
% Measurement correct
% Time items correct
Student sex -0.001 -0.031 -0.022 -0.016 -0.028 -0.100*
Student age 0.015 0.008 0.011 -0.002 -0.001 0.001
Repeater- Grade 2 0.041 -0.017 0.016 -0.022 -0.003 -0.065
Attended ECD/Preeschool -0.079** -0.037 -0.018 -0.025 0.005 -0.118*
SES quintiles at endline 0.017 0.016 0.004 -0.001 -0.003 0.014
Constant 0.294* 0.275* 0.704*** 0.999*** 0.972***
0.752***
R-squared 0.048 0.022 0.005 0.016 0.005 0.037
Observations 364 364 364 364 364 364
Appendix B2. Home Numeracy Environment and Endline Scores
Variable
% Counting items correct
% One to one items correct
Zero concept
% Number ID correct
% Ordering numbers correct
Student sex 0.005 0.003 0.001 -0.019 -0.038
Student age 0.002 0.000 0.001 0.009~ 0.018~
Repeater- Grade 2 -0.026 0.002 0.007 -0.012 -0.018
Attended ECD/Preeschool 0.010 -0.003 -0.050~ 0.014 0.021
HLE quintiles endline 0.001 0.001 0.003 0.006 0.019*
Constant 0.952*** 0.992*** 0.916*** 0.865*** 0.715***
R-squared 0.015 0.012 0.008 0.028 0.040
Observations 364 364 364 364 364

27
Variable
% Magnitude correct
% Missing value correct
% Place Value Correct
% Skip 2s correct
% Skip 5s correct
% Pattern correct
Student sex -0.037* -0.062* 0.026 -0.027 -0.017 0.028
Student age 0.004 0.005 0.009 0.010 0.002 0.009
Repeater- Grade 2 -0.003 -0.055 0.040 0.027 0.005 -0.033
Attended ECD/Preeschool -0.028 -0.042~ -0.063* 0.014 0.003 -0.101**
HLE quintiles endline 0.011 0.011 0.001 0.001 0.010 0.022*
Constant 0.847*** 0.827*** 0.807*** 0.827*** 0.905*** 0.604***
R-squared 0.024 0.030 0.021 0.012 0.009 0.031
Observations 364 364 364 364 364 364
Variable
% Addition correct
% Subtraction correct
% Word problems correct
% Shapes correct
% Measurement correct
% Time items correct
Student sex -0.006 -0.036 -0.023 -0.016 -0.026 -0.104*
Student age 0.013 0.006 0.010 -0.002 -0.001 -0.000
Repeater- Grade 2 0.036 -0.023 0.017 -0.018 0.004 -0.073
Attended ECD/Preeschool -0.078* -0.035 -0.017 -0.025 0.004 -0.116*
HLE quintiles endline 0.007 0.006 0.007 0.007~ 0.012 -0.001
Constant 0.345** 0.327* 0.705*** 0.978*** 0.931*** 0.816***
R-squared 0.042 0.016 0.006 0.024 0.014 0.035
Observations 364 364 364 364 364 364
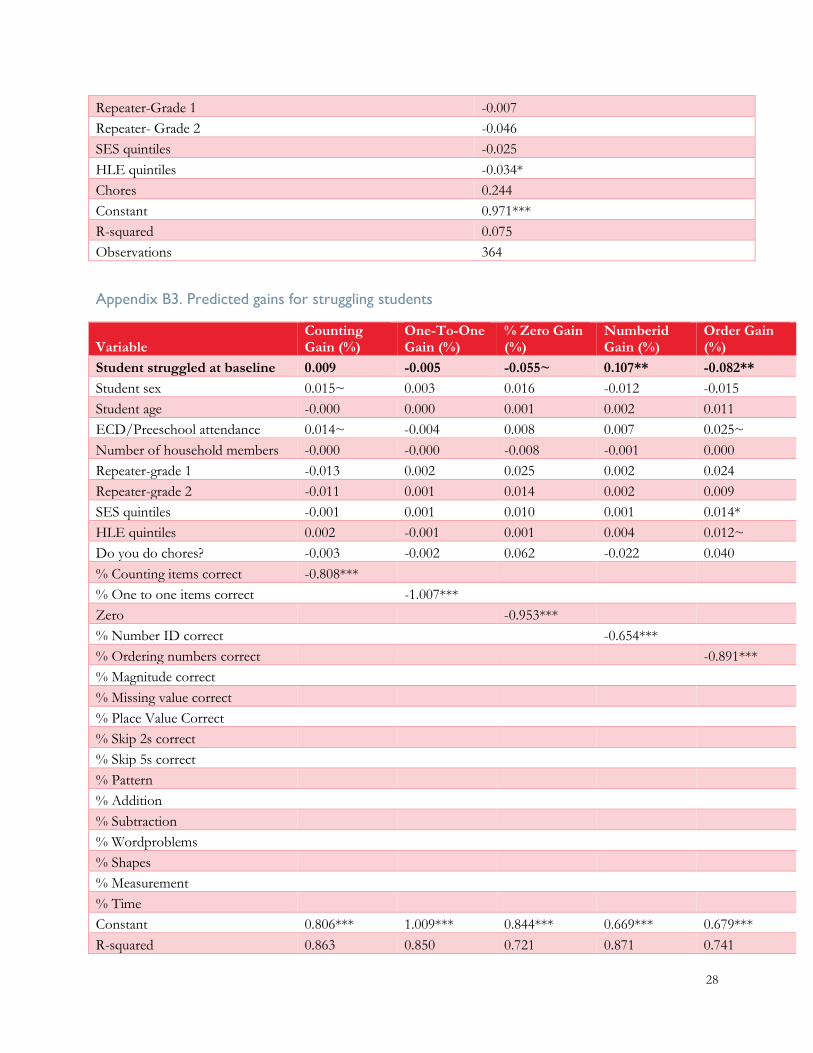
Appendix B3. Struggling Students Characteristics
Variable Student struggled at baseline (number ID)
Student sex 0.093
Student age -0.063**
Attended ECD/Preeschool -0.076
Number of household members -0.009
28
Repeater-Grade 1 -0.007
Repeater- Grade 2 -0.046
SES quintiles -0.025
HLE quintiles -0.034*
Chores 0.244
Constant 0.971***
R-squared 0.075
Observations 364
Appendix B3. Predicted gains for struggling students
Variable Counting Gain (%)
One-To-One Gain (%)
% Zero Gain (%)
Numberid Gain (%)
Order Gain (%)
Student struggled at baseline 0.009 -0.005 -0.055~ 0.107** -0.082**
Student sex 0.015~ 0.003 0.016 -0.012 -0.015
Student age -0.000 0.000 0.001 0.002 0.011
ECD/Preeschool attendance 0.014~ -0.004 0.008 0.007 0.025~
Number of household members -0.000 -0.000 -0.008 -0.001 0.000
Repeater-grade 1 -0.013 0.002 0.025 0.002 0.024
Repeater-grade 2 -0.011 0.001 0.014 0.002 0.009
SES quintiles -0.001 0.001 0.010 0.001 0.014*
HLE quintiles 0.002 -0.001 0.001 0.004 0.012~
Do you do chores? -0.003 -0.002 0.062 -0.022 0.040
% Counting items correct -0.808*** % One to one items correct
-1.007***
Zero
-0.953*** % Number ID correct
-0.654***
% Ordering numbers correct
-0.891***
% Magnitude correct % Missing value correct % Place Value Correct % Skip 2s correct % Skip 5s correct % Pattern % Addition % Subtraction % Wordproblems % Shapes % Measurement % Time Constant 0.806*** 1.009*** 0.844*** 0.669*** 0.679***
R-squared 0.863 0.850 0.721 0.871 0.741
29
Observations 364 364 364 364 364
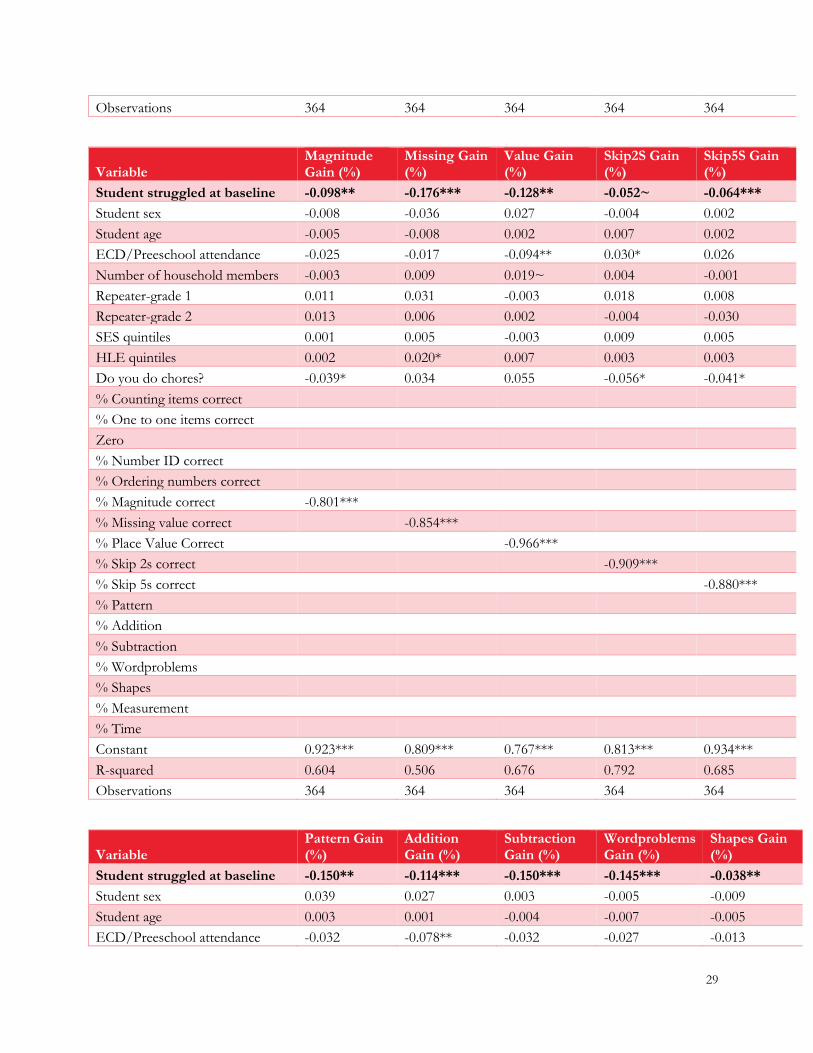
Variable Magnitude Gain (%)
Missing Gain (%)
Value Gain (%)
Skip2S Gain (%)
Skip5S Gain (%)
Student struggled at baseline -0.098** -0.176*** -0.128** -0.052~ -0.064***
Student sex -0.008 -0.036 0.027 -0.004 0.002
Student age -0.005 -0.008 0.002 0.007 0.002
ECD/Preeschool attendance -0.025 -0.017 -0.094** 0.030* 0.026
Number of household members -0.003 0.009 0.019~ 0.004 -0.001
Repeater-grade 1 0.011 0.031 -0.003 0.018 0.008
Repeater-grade 2 0.013 0.006 0.002 -0.004 -0.030
SES quintiles 0.001 0.005 -0.003 0.009 0.005
HLE quintiles 0.002 0.020* 0.007 0.003 0.003
Do you do chores? -0.039* 0.034 0.055 -0.056* -0.041*
% Counting items correct % One to one items correct Zero % Number ID correct % Ordering numbers correct % Magnitude correct -0.801***
% Missing value correct
-0.854*** % Place Value Correct
-0.966*** % Skip 2s correct
-0.909*** % Skip 5s correct
-0.880***
% Pattern % Addition % Subtraction % Wordproblems % Shapes % Measurement % Time Constant 0.923*** 0.809*** 0.767*** 0.813*** 0.934***
R-squared 0.604 0.506 0.676 0.792 0.685
Observations 364 364 364 364 364
Variable Pattern Gain (%)
Addition Gain (%)
Subtraction Gain (%)
Wordproblems Gain (%)
Shapes Gain (%)
Student struggled at baseline -0.150** -0.114*** -0.150*** -0.145*** -0.038**
Student sex 0.039 0.027 0.003 -0.005 -0.009
Student age 0.003 0.001 -0.004 -0.007 -0.005
ECD/Preeschool attendance -0.032 -0.078** -0.032 -0.027 -0.013

30
Number of household members 0.003 0.001 0.007 0.011 0.006
Repeater-grade 1 0.044 0.015 0.002 0.050 -0.011
Repeater-grade 2 0.037 0.004 -0.028 0.006 -0.004
SES quintiles 0.005 0.004 0.005 -0.010 -0.000
HLE quintiles 0.024~ 0.005 0.005 0.010 0.004
Do you do chores? 0.198 -0.080 0.016 -0.034 0.016
% Counting items correct % One to one items correct Zero % Number ID correct % Ordering numbers correct % Magnitude correct % Missing value correct % Place Value Correct % Skip 2s correct % Skip 5s correct % Pattern -0.980***
% Addition
-0.304** % Subtraction
-0.345** % Wordproblems
-0.825*** % Shapes
-0.921***
% Measurement % Time Constant 0.429* 0.460*** 0.346** 0.844*** 0.936***
R-squared 0.471 0.097 0.125 0.475 0.840
Observations 364 364 364 364 364
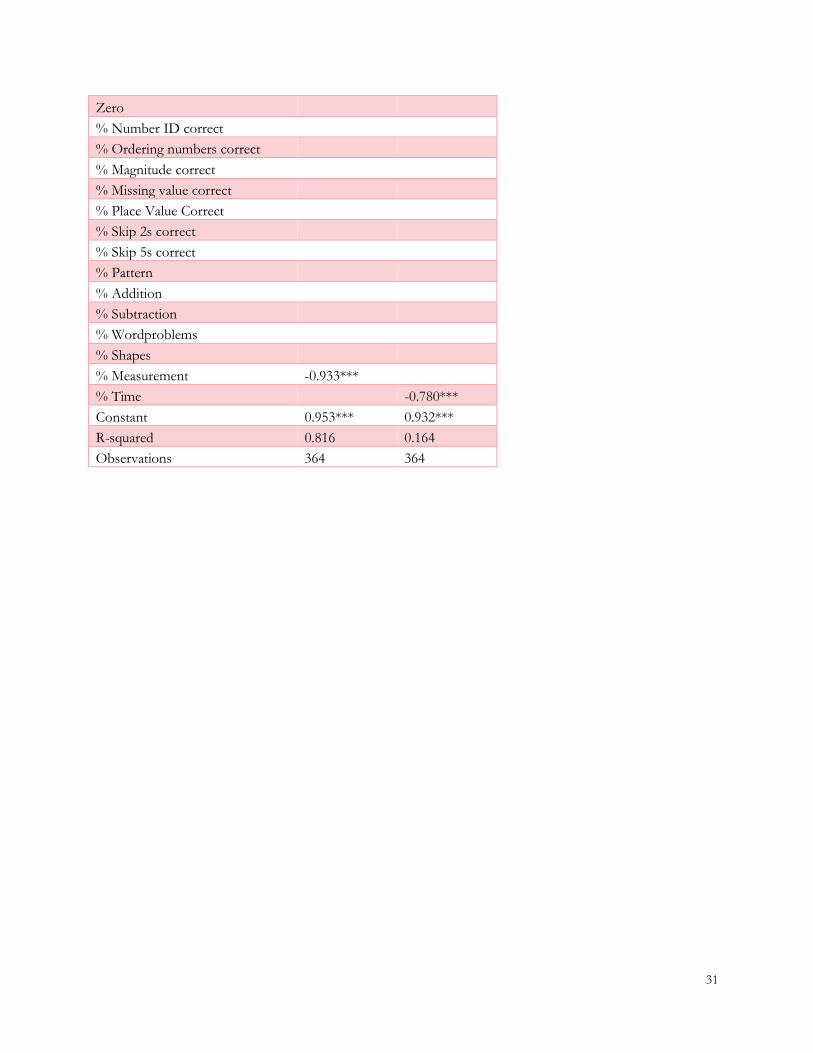
Variable Measurement Gain (%)
Time Gain (%)
Student struggled at baseline -0.013 -0.237***
Student sex -0.023 -0.084*
Student age -0.005 -0.008
ECD/Preeschool attendance -0.008 -0.149*
Number of household members 0.004 -0.014
Repeater-grade 1 -0.023 0.010
Repeater-grade 2 0.011 -0.072
SES quintiles -0.007 0.003
HLE quintiles 0.001 0.026~
Do you do chores? 0.020 0.032
% Counting items correct % One to one items correct
31
Zero % Number ID correct % Ordering numbers correct % Magnitude correct % Missing value correct % Place Value Correct % Skip 2s correct % Skip 5s correct % Pattern % Addition % Subtraction % Wordproblems % Shapes % Measurement -0.933***
% Time
-0.780***
Constant 0.953*** 0.932***
R-squared 0.816 0.164
Observations 364 364