eta violence: police action, political measures and the
TRANSCRIPT

ETA TERRORISM: POLICE ACTION, POLITICAL MEASURES AND THE
INFLUENCE OF VIOLENCE ON ECONOMIC ACTIVITY IN THE BASQUE COUNTRY
Carlos P. Barros
Technical University of Lisbon
Guglielmo Maria Caporale Brunel University, London
Luis A. Gil-Alana
University of Navarra
February 2006
Abstract In the last 15 years or so, ETA activity has substantially decreased, but also changed. Whilst the type of killings has become more specialised (politicians, reporters, etc.), a new phenomenon based on urban guerrilla tactics, and called in Basque “kale borroka” (street fighting), has emerged, creating an atmosphere of violence in the streets. The contribution of this paper is threefold. First, we create a daily measure of the level of violence in the area. Second, we examine if police action and the repressive policy measures adopted by government have been effective in reducing the intensity of violence. Third, we investigate whether the level of violence has had an effect on the stock market index in the Basque Country. The results, based on daily data from July 1st, 2001 to November 15th, 2005 suggest that the only effective measure to reduce violence was the banning of Herri Batasuna (HB), the radical party close to ETA supporters. Moreover, there was a decrease in the stock market index as a consequence of the violence in the area. Keywords: ETA, Terrorism, Economic Impact, Stock Exchange, Fractional Integration JEL Classification: C22, D78, H56. Corresponding author: Professor Guglielmo Maria Caporale, Brunel Business School, Brunel University, Uxbridge, Middlesex UB8 3PH, UK. Tel.: +44 (0)1895 266713. Fax: +44 (0)1895 269770. E-mail: [email protected]

1. Introduction
The impact of terrorism on economic activity has already been investigated in various
papers such as Drakos and Kutan (2003), Enders and Sandler (1991), Enders and
Sandler (1996), Enders, Sandler and Parise (1992). However, these studies mainly focus
on the impact of terrorist activities on tourism. For regions where tourism is not a
predominant economic activity, the effects of terrorism on the stock exchange have
hardly been analysed. A rare study of this type is Abadie and Gardeazabal (2003). We
revisit this issue in the present paper using an innovative approach.
The motivation for our analysis is the observed persistence of ETA terrorism
activity in the Basque Country. Despite the signing of various political agreements to
put an end to violence, terrorism activity has survived in a different form, namely as
Kale Borroka. This persistence, notwithstanding the stated intention and apparent
political will of the Spanish government to find a solution to the Basque problem,
suggests that the two sides are not engaged in a very effective dialogue, and therefore
that terrorism activity might still be carried out in the near future. Moreover, the
emergence of the radical Islamic terrorism in Europe raises the possibility of its
developing links with the terrorist activities of ETA, which is a nationalist terrorist
group.
In order to analyse persistence in ETA terrorism and its impact on the stock market
of the Basque Country this paper uses a novel method based on fractional integration
which also allows for possible structural breaks. It improves upon related studies (e.g.
Barros (2003), Abadie and Gardeazabal (2003), Barros and Gil-Alana (2006), Barros,
Passos and Gil-Alana (2006)) in three ways: first, it uses a new measure of terrorism;
second, it examines explicitly its effects on the stock exchange in the Basque country;
1

third, it models persistence in a fractional integration framework allowing for breaks in
the series.
The paper is organised as follows: in section 2, we put the analysis in context by
briefly reviewing the history of ETA; in section 3, we survey the empirical literature on
this topic; in section 4, we present a new measure of the intensity of violence in the
Basque Country; in section 5, we examine the different policies used to reduce the
violence in the area. Section 6 analyses the effects of violence on the stock market,
while Section 7 concludes.
2. A brief history of ETA
The acronym ETA stands for Euskadi Ta Askatasuna, or Basque Fatherland and
Liberty. The aim of its terrorist activities is to establish an independent state for the
Basque people in the seven provinces in North-Eastern Spain and South-Western France
where they have lived since ancient times. The group was created as an extreme, radical
expression of the Basques’ profound pride in their own unique identity and culture and
their determination to be recognized as a nation. Their language, Euskera, is a living
testament to their origins and longevity, given that it has no links with any other known
language and precedes all the Indo-European languages spoken in Europe. The
protection of Euskera has long been a vital element of the Basques’ struggle. This long
tradition makes their position within Europe rather unique.1
Today, following four decades of harsh repression of the Basques and their
homeland under Franco as a punishment for their opposition during the Spanish Civil
War, the language is thriving in the autonomous region. Euskera radio and TV stations,
newspapers and literature serve an estimated 750,000 fluent speakers (of a total
1 In the Middle Ages they defeated the French king Charlemagne in Roncesvalles (Orreaga, in Basque), (Chanson de Roland, unknown author, 1080).
2

population of 2.5 million Basques). The future survival of this language would appear to
be secured, since more than 90% of Basque children study in Euskera schools.
The nationalists consider the Basque Country to comprise seven provinces. Four of
these are part of Spain. The other three belong to France. However, Spain only
recognizes three provinces in the Basque Country, in what is called the “Comunidad
Autónoma del País Vasco” (Basque Country Autonomous Community),
Whilst many Basques may traditionally harbour dreams of sovereign nationhood, it
should not be assumed that ETA therefore enjoys mass active support for its terrorist
activities among the majority of the population. Since democracy returned to Spain in
1975, the region has known great development and increased prosperity under the
degree of autonomy granted by Madrid. Many Basques favour self-determination or
increased autonomy, but wish to see this achieved through peaceful, political means
rather than violence.
ETA’s first military action took place in 1961 with an unsuccessful attempt to derail
a train carrying civil war veterans travelling to Donostia (San Sebastian) to celebrate the
twenty-fifth anniversary of the Spanish Civil War. They then planted explosives in the
police headquarters of the Basque cities of Bilbao and Vitoria (Abadie and Gardeazabal,
2003). Henceforward, they maintained continuous terrorist activity, with assassinations
and kidnapping beginning in 1968. After a popular ETA activist was killed by the police
in 1968, ETA produced its first victims, assassinating an inspector of the Policia
Nacional and a member of the Guardia Civil. The Franco Government reacted by
putting the entire Basque region under a prolonged siege. Thousands were jailed,
tortured, and exiled, culminating in the 1970 Burgos trial and imprisonment of over a
dozen ETA leaders. During the mid-1970s, ETA activities increased sharply, with 1978
to 1980 being their bloodiest years. In December 1973, ETA assassinated the Spanish
3
premier and putative successor to Franco, Luis Carrero Blanco, which marked a
watershed in terrorist actions.
The long-ruling dictator Franco died in 1975, and democracy was restored. This was
to lead to the Basque region being granted a degree of autonomy (by the Estatuto de
Autonomía del País Vasco, promulgated in 1979) with its own parliament, control over
several areas such as education and taxes, and the promotion of the Basque language in
schools.
In the last 15 years or so, ETA activity has substantially decreased, but also
changed. The number of victims has considerably fallen, the type of killings becoming
more specialized (politicians, reporters, etc.). On the other hand, a new phenomenon
based on urban guerrilla tactics, and called in Basque “Kale Borroka” (street fighting),
has emerged, creating an atmosphere of violence in the streets. This can characterised as
low-intensity urban terrorism fomented by ETA, and amounts to street hooliganism
perpetrated by the youth wing of the terrorist movement. According to the UN
Commissioner for Human Rights in Spain: “these acts have deteriorated to such a point
that it affects not only the fundamental rights of individuals but also the free exercise of
certain civil and political rights which are the basis and foundation of every
democracy”. (Gil-Robles, 2001).
The Spanish Constitution of 1978 does not explicitly provide for the independence
of the Basque Country, and it was against this backdrop that ETA continued its strategy
of individual terrorism during the transition period as well. In December 1982, the left-
wing Socialist Party came to power and set up the anti-terrorist group GAL (Anti-
Terrorist Liberation Group) to combat ETA. These were para-military death squads that
were active from 1983 to 1987. The GAL units hunted down ETA members, and killed
at least 28 of them. In January 1988, all the political parties with representation in the
4

Basque Parliament, with the exception of HB (Herri Batasuna, the radical nationalist
party), signed the agreement known as the Pact of Ajuria-Enea, in the firm belief that
the only way to achieve normality and peace in the Basque Country was to respect the
choices and desires of the Basque people. Negotiations to end ETA violence were held
in Algeria in 1992 but failed in their objective. Unsuccessful ETA attempts on the life
of Prime Ministerial candidate José María Aznar and of King Juan Carlos, in April and
August 1995 respectively, were among the most notorious attacks. Aznar’s Popular
Party was elected in May 1996 and reinforced and maintained the hard-line approach on
terrorism until its unexpected demise in March 2004, precipitated by what turned out to
be radical Islamic terrorist attacks in Madrid 3 days before the elections.
By the late 1990’s ETA had lost most of its support in the main cities and important
ETA commando cells had been eliminated by the police. As a result, the organization
changed its strategy. Together with other nationalist parties, the parliamentary
representation of ETA (EH, Euskal Herritarrok, or "We Basque Citizens”, former HB),
approved the so-called “Treaty of Lizarra” in the fall of 1998. This declaration
contained the obligation to hold open, but exclusively Basque, negotiations on the
political future of the Basque Country. Following the signing of this treaty, ETA
announced an unlimited, unconditional ceasefire in September 1998.
The ceasefire was maintained until 3 December 1999. ETA’s justifications for
resuming its attacks were the unchanging hard-line stance of the Spanish Government
against the separatists and the weak response of the moderate nationalists to the latter.
In fact, scarcely any negotiations took place. Aznar was only willing to discuss the
transfer of a few ETA prisoners to Basque Country jails and the disarming of the
organization. Under no circumstances was the Government prepared to grant ETA more
influence in Basque politics, let alone contemplate the group’s unequivocal demand for
5

independence and unification of all Basque provinces, including the three provinces in
France.
On the contrary, Aznar never left any doubts as to his determination to solve the
Basque question by police methods, and stepped up the pursuit of ETA members during
this period. Since ETA had apparently used the ceasefire period to improve its logistics
and stock up explosives and weapons, it was only a matter of time before violence
would break out again. The hardline position of the Popular Party against ETA included
political measures such as the closing down of radio stations and newspapers (Egin,
July, 1998; Egunkaria, February, 2003) or the “Ley de Partidos” (June, 2002) that led to
the banning of Herri Batasuna from political activity (August, 2002).
3. Literature Review
The economics literature on terrorism is rather limited (for a relatively up to date
survey, see Enders and Sandler, 1995). Two main types of empirical studies can be
found: time series models and cross-section or panel data models. Within this literature,
ETA has been the subject of more papers than other known terrorist organisation. One
reason for such emphasis on ETA is its longevity. Many time series studies on ETA use
intervention analysis, regressing the number of terrorist incidents on indicators of policy
intervention, to evaluate the effectiveness of the adopted policy (Enders and Sandler,
1993). Papers in this mould are Barros (2003), who analysed ETA killings and kidnaps
with a VAR model from 1968 to 2000; Barros and Gil-Alana (2006), who estimated a
fractional integration model for ETA attacks; and Barros, Passos and Gil-Alana (2006),
who investigated the duration of ETA attacks with several duration models.
Alternatively, other studies use economic-impact analysis, regressing economic
variables on terrorist incidents, to evaluate the economic impact of terrorism. For
6

instance, Enders and Sandler (1991) estimated a first-order VAR (Vector Auto-
Regression) model to evaluate the economic impact of terrorism on tourism in Spain
during the period from 1970 to 1988 (see also Enders (2004)). Abadie and Gardeazabal
(2003) analysed the economic impact of ETA terrorism on GDP, concluding that there
was an average 10% gap between per-capita GDP in the Basque Country and the per-
capita GDP of a comparable region that does not suffer from terrorism. Moreover, when
analysing Basque market-listed companies in comparison with non-Basque listed
companies, they concluded that the former show a negative performance as an
externality of terrorism. The present paper adopts this second time series approach to
examine the impact of terrorism attacks on economic variables. In contrast to earlier
studies, which treat terrorist events as stationary (Enders and Sandler, 1996), we model
the order of integration of ETA terrorism attacks with fractional integration techniques,
which allow for intra-annual integration. Second, we model possible breaks in the series
within the fractional integration framework. Finally, we use information on Basque
stock market prices to evaluate the impact of ETA violence.
4. Measuring the intensity of violence
Measures of the intensity of violence are usually based on counting violent episodes.
For example, the ITERATE data set, the most renowned terrorist data set, counts the
number of terrorist attacks and the number of killings, as well as other terrorist events.
However, these methods are rather uni-dimensional as they inevitably lump together a
large variety of terrorist actions. An alternative way to measure terrorism actions is to
use a Likert-type variable defined as varying between zero and five to account for
different types of terrorism intensity. This is the procedure adopted in the present paper.
7
Such a Likert-type variable ranging between 0 and 5 enables us to compare
different types of terrorism activity with different social impact, and to construct a
terrorist index. Index variables in addition to the one adopted in the paper can be found
in papers using questionnaire data (see, e.g., Gans, Hsu and Stern (2002) and Morris and
Pavet (1992).
[Insert Table 1 about here]
The Likert-type variable employed in this paper refers to the daily level of
violence in the Basque Country and will be denoted by DVIt. This variable takes a value
of 0 if there has not been any violent incident related to ETA terrorism during a single
day. It takes a value of 1 (Very Low Level of Violence) if there has been only a small
number (≤ 5) of incidents of “kale borroka” across the Basque geography. It takes a
value of 2 (Low Level of Violence) if there are more than 5 acts of kale borroka in a
single day. DVIt = 3 (Medium Level of Violence) if there are generalized incidents of
kale borroka or if ETA has put bombs with less than 5 kilograms of explosives. Level 4
(High Level of Violence) is achieved with ETA bombs which are stronger than 5
kilograms of explosives or if there have been serious injuries as a consequence of a
terrorist attack. Finally, Level 5 (Very High Level of Violence) occurs when there are
one or more fatalities in the attacks. Although this classification does not distinguish
between one or more than one killing in a single day of terrorist activity, we would
argue that the death of even a single person is sufficiently important to be defined as the
highest level of violence.
From a first inspection of the data one can see that the sample mean for the
variable in the period analysed in the paper (1st July, 2001 – 15th November, 2005) is
relatively low (0.8011), implying a level of violence slightly below Level 1, which
corresponds to the category “Very Low Level of Violence”; this is considerably lower
8

than in previous periods (e.g., 1978-1980, with a mean value higher than 4; or the
decade of the 80s, with a value of around 3.5)
Another feature of these data is that there is not a monotonic decrease in violent
activity during the recent period: the annual means from 2001 through 2005 are equal to
1.364, 0.879, 0.671, 0.720 and 0.691, respectively. Moreover, the values displayed in
Figure 1, which correspond to the monthly averages, show that the highest level of
violence occurred in November 2005, that is, the last month in the sample.2
5. Deterrence policies
In this section we examine which factors may affect the daily level of violence in the
Basque Country (DVIt). For this purpose, we first run linear regressions using as
dependent variables the following ones: ARRt: daily number of arrests related to ETA
violence; LEADt: a step dummy increasing by 1 each time the police arrest ETA
leaders; EGKt: a dummy variable equal to 1 after the police closed the Basque
newspaper Egunkaria (February 20th, 2002); HBt: a dummy variable taking a value of 1
after Herri Batasuna was declared illegal (August 27th, 2002); and finally, 11-Mt: a
dummy variable equal to 1 after the March 11th Islamic attack in Madrid. These
variables are fully described in Table 2.
[Insert Tables 2 and 3 about here]
We estimate by Ordinary (Generalized) Least Squares (OLS-GLS) the following
regression model:
DVIt = a1 + a2 ARRt + a3 LEADt + a4 EGKt + a5 HBt + a6 11Mt + ut (1)
where ut is the error term, adopting different ARMA representations. Table 3 displays
the estimated coefficients, assuming that ut is an ARMA(1,1) process. The specification
2 At the time of writing (February, 2006) the violence still persists in the Basque Country, and the average monthly values for December 2005 and January 2006 are respectively 0.719 and 0.662.
9
was chosen according to the AIC and BIC criteria. It can be seen immediately from this
Table that only LEAD, EGK and HB have a negative effect on ETA violence. By
contrast, the number of daily arrests and the 11-M attacks have a positive coefficient.
An explanation for the positive coefficient on the number of arrests might be the fact
that, when police arrest people in the Basque Country, this usually provokes incidents in
the streets by ETA supporters, thereby increasing the acts of “kale borroka” and the
feeling of violence. On the other hand, the two political measures (closeness of
Egunkaria and banning of Herri Batasuna) have a negative coefficient, though only the
latter is significant at conventional statistical levels, suggesting that, according to our
model, this was the only effective measure to reduce violence in the area.
However, the analysis presented so far is based upon the assumption that the
error term ut in equation (1) is integrated of order 0, i.e., ut ~ I(0). In our view, it is
plausible to think instead that the level of violence in the Basque Country instead
follows an I(d) process with d > 0. In fact some earlier studies have shown that ETA
violence is integrated of order d with d strictly higher than 0 (see Barros and Gil-Alana,
2006). Thus, in what follows, we assume that the level of violence (DVIt) is described
by (1) with ut given by:
...,2,1,)1( ==− tvuL ttd (2)
where vt is I(0). Hence, if d = 0, we are in the previous case, analysed in Table 3. We
now test:
,: oo ddH = (3)
for any real value do in a model given by (1) and (2), assuming that vt is white noise,
AR, etc.
In Table 4 we report the results based on Robinson’s (1994) statistic, testing Ho
(3) in (1) and (2), for do-values = 0, 0.10, …, 1, assuming that vt is white noise, AR(1)
10
and AR(2) respectively. Higher AR orders and MA processes were also employed and
the results were in line with those presented here. The statistic proposed by Robinson
(1994) is fully described in the Appendix, and follows a standard normal distribution.
Thus, significantly positive values imply rejections of the null in favour of alternatives
of the form: d > do, and, similarly, significant negative ones imply rejections of the null
in favour of smaller orders of integration (d < do). We can see in Table 4 that, if d = 0,
the null hypothesis is rejected for all types of disturbances in favour of alternatives of
the form d > 0, implying long-memory behaviour. We can also note that if vt is white
noise or AR(1) the null cannot be rejected for do = 0.10, and, if vt is AR(2), the non-
rejections take place for values of do constrained between 0.10 and 0.20. Hence, in
Table 5, we display the statistics for a range of do-values constrained between 0.10 and
0.20 with 0.01 increments. Note that the lowest statistic in absolute value should
correspond to a value of d that is an approximation to the maximum likelihood
estimate.2
[Insert Tables 4 and 5 about here]
The results in Table 5 show that, if vt is white noise, Ho cannot be rejected for
values of d constrained between 0.10 and 0.15, and the lowest statistic corresponds to do
= 0.12. When allowing for autocorrelated disturbances, we observe more non-rejections
and the lowest statistics occur in both cases at do = 0.13.
[Insert Table 6 about here]
Table 6 displays the estimated coefficients for each type of disturbances in the
cases of the lowest statistics. Similarly to the I(0) case, negative coefficients (implying a
reduction in the level of violence) are found for the arrests of ETA coup-members and
2 Robinson’s (1994) statistic is based on the Whittle function, that is an approximation to the likelihood function.
11

the two political measures (closing down of Egunkaria and banning of HB); however,
only the latter variable appears to be significant at conventional statistical levels.
The results presented so far seem to indicate that only the banning of HB
produced a significant reduction in terrorist activities in the Basque Country. This took
place in August 2002. Next, we examine the possibility of a structural break in the data,
and, for this purpose, we use a simple procedure that enables us to estimate the
deterministic components, the orders of integration and the time of the break
endogenously to the model. Note that since the series of interest, the daily intensity of
violence, is not I(0), standard procedures like Bai and Perron (1998) cannot be directly
applied. We assume that there is a unique break in the data, occurring at time Tb, and
consider a model of the form:
,,...,2,1,)1(; 11 bttd
tt TtuxLxy ==−+= α
,,...,1,)1(; 22 TTtuxLxy bttd
tt +==−+= α
where d1 and d2 correspond respectively to the orders of integration of the first and the
second subsample. Note that the model above can be expressed as:
(4) ,,...,2,1,1)1()1( 111 bttd
td TtuLyL =+−=− α
(5) ,,...,1,1)1()1( 222 TTtuLyL bttd
td +=+−=− α
where 1t = 1 for all t. First, we choose a grid for the values of the fractionally
differencing parameters d1 and d2, for example, dio = 0, 0.01, 0.02, …, 1, i = 1, 2. Then,
for a given partition {Tb} and given d1, d2-values, , we estimate the α's by
minimizing the sum of squared residuals,
)d,d( )j(o2
)j(o1
[ ] [ ]}2,1,2,1{...
1222
1111 )(1~)1()(1~)1(min
ββαα
αα
trw
T
bTtottodbT
tottod dyLdyL ∑
+=∑=
−−+−−.
12
Let denote the resulting estimates for partition {T),;(ˆ )1(2
)1(1 oob ddTα b} and initial
values and . Substituting these estimated values into the objective function, we
get RSS(T
)1(1od )1(
2od
b; , ), and minimizing this expression across all values of d)1(1od )1(
2od 1o and d2o
in the grid we obtain:
).,;(minarg)( )(2
)(1},{
jo
iobjib ddTRSSTRSS =
Then, the estimated break date, , is such that kT
)(minargˆ ...,,1 imik TRSST == ,
where the minimization is over all partitions T1, T2, …, Tm, such that Ti - Ti-1 ≥ |εT|. The
regression parameter estimates are the associated least-squares estimates of the
estimated k-partition, i.e.,
}),ˆ({ˆˆ kii Tαα =
and their corresponding differencing parameters,
}),ˆ({ˆˆ kii Tdd =
for i = 1 and 2.
We do not report asymptotic results for the rates of convergence of the
estimates, though they should be similar to those in Bai and Perron (1998), since we
choose the values in such a way as to minimize the residual sum of squares and, under
the appropriate specification, ut should follow an I(0) process. Some Monte Carlo
results based on this approach can be found in Gil-Alana (2006), where it is shown that
this procedure correctly estimates the timing of the breaks and produces very accurate
estimates of the model parameters, especially if the sample size is large.
[Insert Table 7 about here]
13
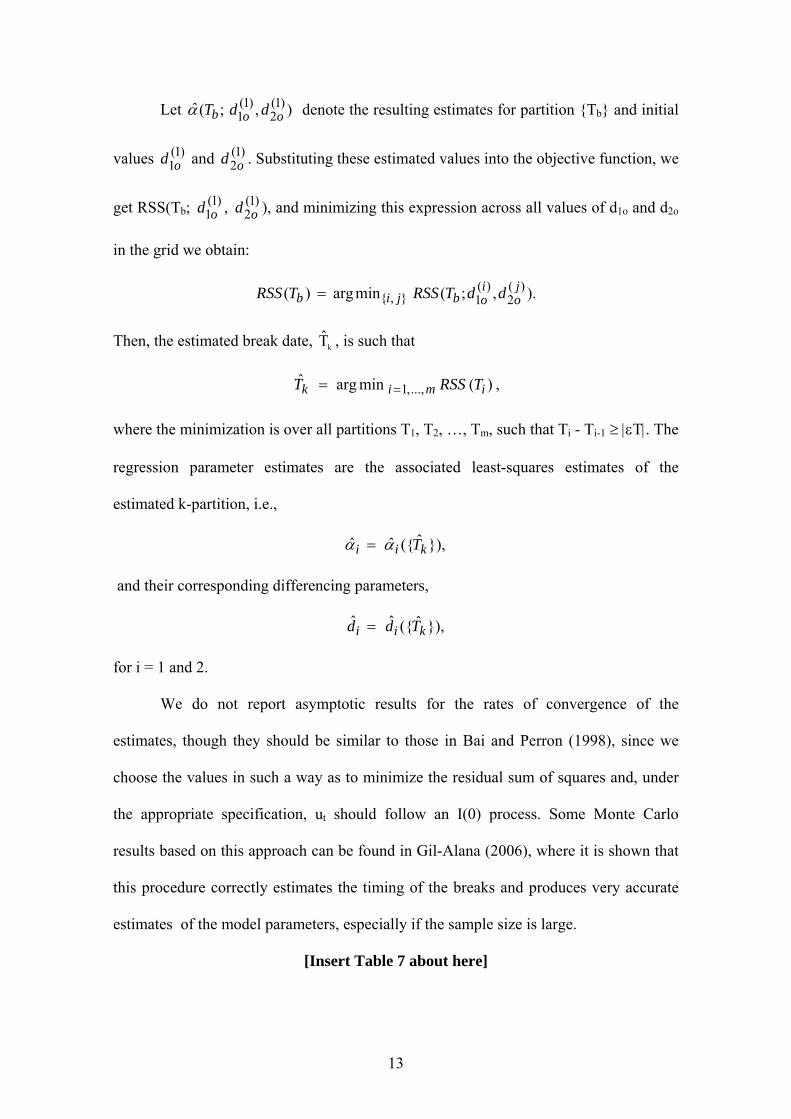
Table 7 reports the estimates of model (4) and (5) assuming that ut is white noise
and autocorrelated. In the latter case we suppose that ut follows an AR(1) process. We
also tried higher AR and MA processes, obtaining similar results. Starting with the case
of white noise disturbances, we can see that the break takes place on May 8th, 2002,
which is a few months before the banning of HB, though at that time it was already
known that this would take place.3 As expected, the estimate of the intercept is higher in
the first subsample, and significant in both subsamples. Interestingly, the order of
integration is substantially higher in the second subsample (0.14 compared with 0.03 in
the first subsample). When ut is assumed to follow an AR(1) process the results are very
similar. The break occurs on May 1st, 2002, and the first subsample seems to follow an
I(0) process, while d2 = 0.15. The estimates for the intercepts are now 1.267 for the first
subsample and 0.689 after the banning of HB, and both are statistically significant. On
the whole, it would appear that there has been a substantial reduction in the intensity of
the violence in the Basque Country since HB has been declared illegal; however, its
persistence has increased as a result of the adoption of this measure.
6. Violence and economic activity
In this section we examine whether the level of violence in the Basque Country has had
any effect on economic activity in the area. For this purpose, we use the DVI variable
described in Section 3 as an indicator of the level of violence, and the Bilbao Stock
Market index (BSMt) as an indicator of economic activity.
[Insert Figures 1 – 3 about here]
First, we examine the statistical properties of the individual series. Stock market
indices are generally believed to be nonstationary, and to contain a unit root. On the
3 The “Ley de Partidos” was promulgated in June 2002.
14

other hand, visual inspection of the monthly averages of the DVI series, in Figure 1,
seems to suggest that series in hand is stationary.
[Insert Table 8 about here]
Table 8 shows the fractional integration results for the two series. Note that the
fractional integration approach nests the two classic cases of modelling statistical time
series, the stationary case (d = 0) and the unit root approach (d = 1). We report the 95%
confidence intervals as well as the quasi maximum likelihood estimate of d (in
parenthesis within the brackets) in the frequency domain, assuming that the two series
are I(d) with white noise, AR and Bloomfield disturbances.4
It can be seen that, for the stock market index, the values of d are close to 1 in all
cases, ranging from 0.95 to 1.09. However, for the level of violence, the values are
much smaller, ranging from 0.13 to 0.30. Thus, while BSM is clearly nonstationary and
probably I(1), DVI is stationary, though with a component of long memory behaviour.5
Moreover, the fact that the two series exhibit different orders of integration invalidates
any inference based on cointegration models. Consequently, in what follows, we
assume that DVI is weakly exogenous, and consider a model of the following form:
,tktt xDVIBSM ++= −βα (6)
,)1( ttod uxL =−
with k in (6) equal to 0, 1, 2 and 3 and white noise and AR(1) and AR(2) disturbances
ut. As an alternative approach, we could have employed a dynamic lag-structure for
DVI in (6) in line with the literature on dynamic regressions in standard models.
However, that approach would have imposed the same degree of integration across the
lags, whilst ours allows d to take different values for each lag.
4 The model of Bloomfield (1973) is a non-parametric approach of modelling the I(0) disturbances, that produces autocorrelations decaying exponentially as in the AR(MA) case.
15

[Insert Table 9 about here]
Table 9 reports, for each type of disturbances and for each k, the estimates for
the coefficients (and their corresponding t-ratios), the value of do producing the lowest
statistic, its confidence interval (at the 95% level) and the values for the short-run (AR)
parameters. It can be seen that the results are robust to the different type of disturbances.
The estimates of d are around 1 in all cases, and the slope coefficient only appears
significant when k = 1, with a negative value, implying that an increase in the level of
daily violence in the streets produces a reduction in the stock market index in the
following period.
The final part of the analysis considers the possibility of a structural break in the
stock market index, and applies the same procedure used in Section 4 to examine the
relationship between the level of violence and the stock market index in the following
period. Thus, the model is now
bttd
td
td TtuDVILLBSML ,...,1,)1(1)1()1( 111111 =+−+−=− −βα
,,...,1,)1(1)1()1( 122222 TTtuDVILLBSML bttd
td
td +=+−+−=− −βα
and we jointly estimate d1o, α1, β1, d2o, α2, β2 along with the time break Tb by
minimizing the RSS for a grid of values of Tb = T/10, T/10+1, …, 9T/10-1, 9T/10. The
results are displayed in Table 10.
[Insert Table 10 about here]
Starting with the case of white noise disturbances, we can see that both
coefficients, the intercept (α1) and the slope (β1), are significant in the first subsample,
while only the intercept (α2) is significant after the break, which occurs on July 4th, 2002
(i.e. one month after the promulgation of the “Ley de Partidos”, and one month before
5 This latter result is consistent with Barro and Gil-Alana (2006) who found evidence of long memory (d
16

the banning of HB). The orders of integration oscillate around 1 in the two subsamples,
with values of 1.03 and 0.95 respectively. We also find that the slope coefficient is
negative in both cases, though only significant before the break, implying that the
negative effect of violence on the stock market was stronger before the break. If ut
follows an AR(1) process, the two orders of integration are slightly below unity (0.97
and 0.98), and the slope coefficients are negative though insignificant in the two
subsamples. The coefficients associated to the AR component are close to 0, suggesting
that the white noise specification could be an adequate choice for this series. On the
whole, the level of violence seems to affect negatively the stock market, with a stronger
effect before the banning of Herri Batasuna.
7. Conclusions
In the last 15 years or so, ETA activity has substantially decreased, but also changed.
Whilst the number of carefully selected victims (politicians, reporters, etc.) has fallen,
more diffuse violence has emerged, in the form of urban guerrilla tactics, known in
Basque as “kale borroka” (street fighting). This paper has aimed to analyse this new
phenomenon and its economic consequences. Its contribution is threefold. First, we
have created a daily measure of the level of violence in the area. Second, we have
examined if police action and the repressive policy measures adopted by government
have been effective in reducing the intensity of violence. Third, we have investigated
whether the level of violence has had an effect on the stock market index in the Basque
Country. We have improved upon earlier studies not only by using a more appropriate
measure of the level of violence, but also by modelling its high degree of persistence by
means of fractional integration techniques, and allowing for possible breaks.
> 0) in the number of killings by ETA from 1968 to 2002 using the ITERATE database.
17

Our results, based on daily data from July 1st, 2001 to November 15th, 2005,
suggest that the only effective measure to reduce violence was the banning of Herri
Batasuna (HB), the radical party close to ETA supporters (the average values for the
level of violence before and after the banning being 1.1184 and 0.6877 respectively).
This controversial measure (which the majority of the Basque population opposes)
appears to have successfully reduced the level of violence, though, at the same time, it
has increased its degree of persistence. Moreover, there was a decrease in the stock
market index as a result of the violence in the area, especially during the period prior to
the banning of HB.
What policy measures should then be adopted on the basis of our findings?
Simply banning Herri Batasuna appears not to be a recommendable policy, if one takes
into account the persistence of ETA terrorism (see Barros and Alana (2006)), and the
negative effects on the stock market (and possibly on growth and employment) in the
region). In order to achieve a decrease in both political violence and its persistence, a
political agreement seems indispensable. In its absence, one should expect ETA
violence to continue in the future. Finding a way to eliminate national terrorism has
become a necessity not only for economic reasons, but also to be able to focus on
appropriate deterrence policies to deal with the rise of radical Islamic terrorism, which
poses an increasing threat to Western societies.
18

Appendix A
The LM test of Robinson (1994) for testing Ho (3) in (1) and (2) is
aATr ˆˆˆ
ˆ 2/12
2/1−=
σ,
where T is the sample size and:
∑ ∑==−
=−
=
−
=
−−1
1
1
1
1221 );()ˆ;(2)ˆ(ˆ);()ˆ;()(2ˆT
j
T
jjjjjj Ig
TIg
Ta λτλπτσσλτλλψπ
⎟⎟⎟
⎠
⎞
⎜⎜⎜
⎝
⎛∑ ∑ ∑×⎟
⎟⎠
⎞⎜⎜⎝
⎛∑×−=
−
=
−
=
−
=
−−
=
1
1
1
1
1
1
11
1
2 )()(ˆ)'(ˆ)(ˆ)'(ˆ)()(2ˆ T
j
T
j
T
jjj
T
jjjjjjT
A λψλελελελελψλψ
).(minargˆ;2
);ˆ;(log)(ˆ;2
sin2log)( 2 τστπ
λτλτ
λελ
λψ ==∂∂
==T
jg jjj
jj
a and in the above expressions are obtained through the first and second derivatives
of the log-likelihood function with respect to d (see Robinson, 1994, page 1422, for
further details). I(λ
A
j) is the periodogram of ut evaluated under the null, i.e.:
;'ˆ)1(ˆ ttodt wyLu β−−= ,)1(;)1('ˆ
1
1
1t
odt
T
tt
odt
T
ttt zLwyLwww −=∑ −⎟⎟⎠
⎞⎜⎜⎝
⎛∑=
=
−
=β
and g is a known function related to the spectral density function of ut:
.),;(2
);;(2
2 πλπτλπ
στσλ ≤<−= gf
19

References Abadie, A. and J. Gardeazabal, 2003, The Economic Costs of Conflict: A Case-Control Study for the Basque Country. American Economic Review 93,1,113-132. Bai, J. and P. Perron, 1998, Estimating and testing linear models with multiple structural changes, Econometrica 66, 47-78. Barros, C.P., 2003, An Intervention Analysis of Terrorism: The Spanish ETA Case. Defence and Peace Economics 14, 6, 401-412. Barros, C.P and L.A. Gil-Alana 2006, E.T.A.: a persistent phenomenon. Defence and Peace Economics, Forthcoming. Barros, C.P. A. Passos and L.A. Gil-Alana, 2006, The timing of the ETA terrorist Attacks, forthcoming in Journal of Policy Modelling. Chanson de Roland, unknown author, circa, 1080. Drakos, K. and A. Kutan, 2003, Regional Effects of Terrorism on Tourism: Evidence from Three Mediterranean Countries, Journal of Conflict Resolution 47 (5): 621-642. Enders,W., 2004. Applied Econometric Time series. New York: John Wiley & Sons. Enders, W. and T. Sandler, 1991, Causality between transnational terrorism and tourism: The case of Spain, Terrorism 14 (1): 49-58. Enders, W. and T. Sandler, 1993. The Effectiveness of Anti-terrorism Policies: A Vector-Autoregression-Intervention Analysis. American Political Science Review, 87 (4): 829-844. Enders, W. and T. Sandler, 1995, Terrorism: Theory and applications. In Handbook of Defense Economics, edited by Keith Hartley and Todd Sandler, 213-249. North Holland. Enders, W. and T. Sandler, 1996, Terrorism and foreign direct investment in Spain and Greece. Kyklos 49 (3): 331-352. Enders, W., T. Sandler and G.F. Parise, 1992, An econometric analysis of the impact of terrorism on tourism, Kyklos 45: 531-554. Gans, J.S., Hsu, D.H. and Stern, S. (2002) When does start-up innovation spur the gale of creative destruction. The RAND Journal of Economics, 33,4, 571-586. Gil-Alana, L.A., 2006, Fractional integration and structural breaks at unknown periods of time, Preprint. Gil-Robles, A., 2001, Report by Mr. Alvaro Gil-Robles, Commissioner for Human Rights, on his visit to Spain and the Basque Country, Council of Europe. Morris, T. and Pavett, C.M., 1992, Management Style and Productivity in two cultures. Journal of International Business Studies, 23,1,169-179.
20

TABLE 1
Measuring the level of terrorist violence Level 0 No violence activity Level 1 Very low level of violence (small acts of kale borroka) Level 2 Low level of violence (Acts of kale borroka)
Level 3 Medium level of violence (Bombs with less than 5 kg of explosives; Kidnappings; Generalized acts of kale borroka)
Level 4 High level of violence (Bombs with more than 5 kg of explosives; Serious injuries as a consequence of a terrorist attack)
Level 5 Very high level of violence (Assassinations; Fatalities as a consequence of a terrorist attack)
TABLE 2
Description of the variables used in the paper Name Definition Range Mean Stand. Dev.
DVItLevel of daily Violence
Intensity [0 - 5] 0.8011 1.4644
ARRt Number of daily arrests [0 - 80] 0.9662 3.7355
LEADtStep dummy ETA leaders
arrests [0 - 14] 5.3721 6.6601
EGKtDummy variable for the close of EGUNKARIA [0 - 1] 0.6253 0.7908
HBtDummy variable for the
banning of HB [0 - 1] 0.7360 0.8579
11-MtDummy variable for the 11-M attack in Madrid [0 - 1] 0.3839 0.6196
BSMtBilbao daily Stock
Market Index [976.32 – 1956.35] 1410.87 1428.50
21

FIGURE 1
Monthly average of the daily level of violence intensity in the Basque Country
0
0,4
0,8
1,2
1,6
2
July-01 5Nov-0
FIGURE 2
Monthly number of arrests related to ETA violence
0
20
40
60
80
100
120
July-01 Nov-05
FIGURE 3
Monthly average of the Bilbao 2000 Stock Market Index
800
1200
1600
2000
July-01 Nov-05
22

TABLE 3
Estimated coefficients based on the standard I(0) regression model Coefficient Standard Error t-Statistic
Constant term 1.131886 0.098763 11.46066 ARRt 0.007656 0.008206 0.933060
LEADt -0.010443 0.030147 -0.346393 EGKt -0.011525 0.174010 -0.066230 HBt -0.414802 0.175394 -2.364973
11-Mt 0.085630 0.203060 0.421699 AR(1) coefficient 0.816661 0.056092 14.55933 MA(1) coefficient -0.709542 0.068595 -10.34392
TABLE 4
Testing the order of integration in the regression model given by (1) and (2) d White noise AR (1) AR (2)
0.00 8.859 5.505 13.814 0.10 1.184 1.013 2.469 0.20 -3.400 -1.841 -5.025 0.30 -6.627 -4.171 -10.735 0.40 -8.950 -6.039 -15.083 0.50 -10.665 -7.534 -18.427 0.60 -11.980 -8.782 -21.085 0.70 -13.038 -9.886 -23.294 0.80 -13.903 -10.845 -25.156 0.90 -14.611 -11.655 -26.743 1.00 -15.202 -12.344 -28.129
In bold: Non-rejection values of the null hypothesis at the 5% level.
23
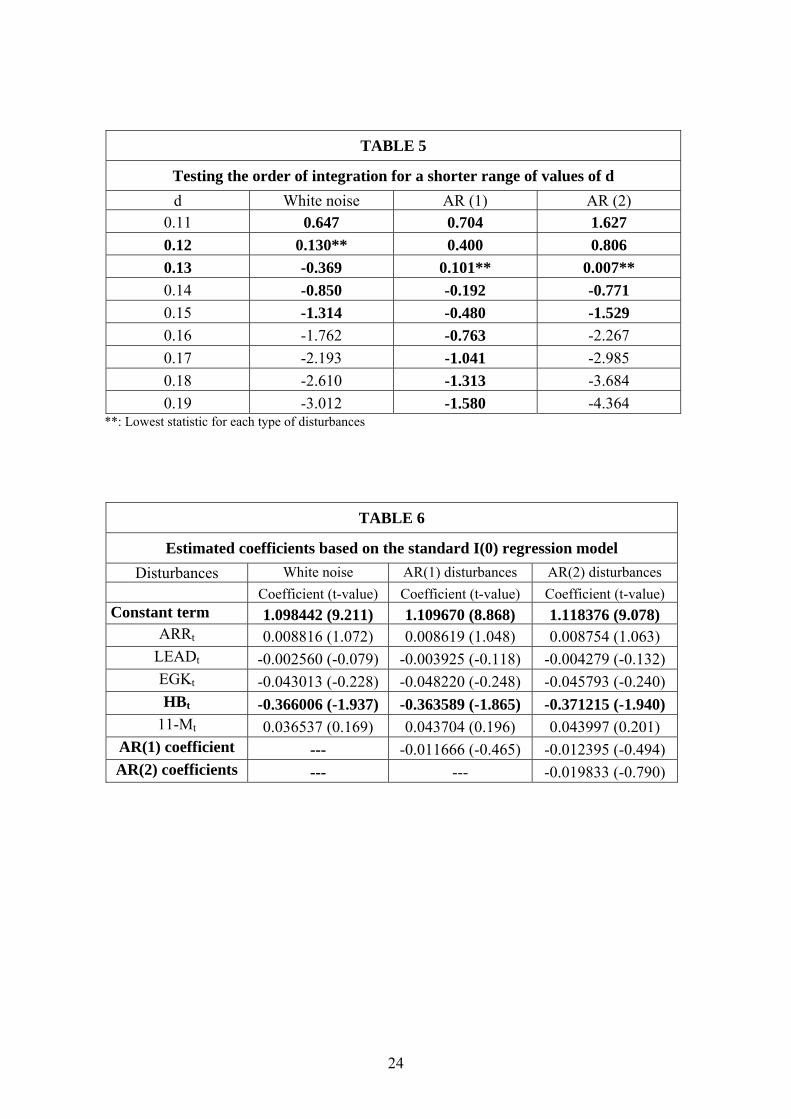
TABLE 5
Testing the order of integration for a shorter range of values of d d White noise AR (1) AR (2)
0.11 0.647 0.704 1.627 0.12 0.130** 0.400 0.806 0.13 -0.369 0.101** 0.007** 0.14 -0.850 -0.192 -0.771 0.15 -1.314 -0.480 -1.529 0.16 -1.762 -0.763 -2.267 0.17 -2.193 -1.041 -2.985 0.18 -2.610 -1.313 -3.684 0.19 -3.012 -1.580 -4.364
**: Lowest statistic for each type of disturbances
TABLE 6
Estimated coefficients based on the standard I(0) regression model Disturbances White noise AR(1) disturbances AR(2) disturbances
Coefficient (t-value) Coefficient (t-value) Coefficient (t-value) Constant term 1.098442 (9.211) 1.109670 (8.868) 1.118376 (9.078)
ARRt 0.008816 (1.072) 0.008619 (1.048) 0.008754 (1.063) LEADt -0.002560 (-0.079) -0.003925 (-0.118) -0.004279 (-0.132) EGKt -0.043013 (-0.228) -0.048220 (-0.248) -0.045793 (-0.240) HBt -0.366006 (-1.937) -0.363589 (-1.865) -0.371215 (-1.940)
11-Mt 0.036537 (0.169) 0.043704 (0.196) 0.043997 (0.201) AR(1) coefficient --- -0.011666 (-0.465) -0.012395 (-0.494) AR(2) coefficients --- --- -0.019833 (-0.790)
24

TABLE 7
Parameter estimates with a single break
White noise AR (1) disturbances α1 1.270 1.267
(t-value α1) (14.256) (16.424) α2 0.689 0.689
(t-value α2) (8.628) (8.072) d1 0.03 0.00 d2 0.14 0.15 Tb May 8th, 2002 May 1st, 2002
AR coeff. (1st s.) --- 0.051 AR coeff. (2nd s.) --- -0.013
TABLE 8
Estimating the order of integration of each series
Disturbances BSMt DVIt
White noise [0.95 (0.97) 1.00] [0.13 (0.15) 0.17] AR (1) [0.95 (0.99) 1.04] [0.17 (0.21) 0.24] AR (2) [0.97 (1.03) 1.09] [0.17 (0.23) 0.30]
Bloomfield (1) [0.96 (0.99) 1.04] [0.15 (0.18) 0.23] Bloomfield (2) [0.97 (1.02) 1.06] [0.18 (0.21) 0.27]
25

TABLE 9
Testing the effects of violence intensity on the stock market index
Model: BSMt = β0 + β1DVIt + xt; (1 - L)d xt = ut; ut is I(0) ut K Conf. Interval d β0 (S.E.) β0 (S.E.) α1 α1
k = 0 [0.95 1.00] 0.97 1539.34 (114.00) 0.2712 (1.256) --- ---
k = 1 [0.95 1.00] 0.98 1539.64 (114.10) -0.4656 (-2.158) --- ---
k = 2 [0.95 1.00] 0.98 1570.30 (116.30) -0.0002 (-0.001) --- ---
White noise
k = 3 [0.95 1.00] 0.97 1560.14 (115.54) -0.0091 (-0.042) --- ---
k = 0 [0.95 1.04] 0.99 1538.18 (113.86) 0.2725 (1.275) -0.027 ---
k = 1 [0.95 1.03] 0.98 1538.07 (114.06) -0.4644 (-2.165) -0.018 ---
k = 2 [0.94 1.04] 0.98 1568.71 (116.38) -0.0012 (-0.005) -0.017 ---
AR (1)
k = 3 [0.93 1.03] 0.99 1558.55 (115.67) -0.0091 (-0.042) -0.018 ---
k = 0 [0.97 1.10] 1.03 1539.79 (114.14) 0.2744 (1.310) -0.068 -0.049
k = 1 [0.94 1.08] 1.01 1539.58 (114.21) -0.4608 (-2.181) -0.047 -0.035
k = 2 [0.93 1.10] 1.01 1571.54 (116.62) -0.0086 (-0.040) -0.038 -0.031
AR (2)
k = 3 [0.92 1.10] 1.00 1561.09 (115.88) -0.0056 (-0.026) -0.030 -0.026
BSMt is the stock market index and DVIt is the violence intensity.
26

TABLE 10
Parameter estimates with a single break
White noise AR (1) disturbances α1 1539.47 1539.31
(t-value α1) (89.801) (86.333) β1 -1.033 -0.730
(t-value β1) (-2.216) (1.484) α2 1259.37 1195.84
(t-value α2) (105.02) (104.23) β2 -0.197 -0.039
(t-value β2) (-0.019) (0.177) d1 1.03 0.97 d2 0.95 0.98 Tb July 4th, 2002 July 29th, 2002
AR coeff. (1st s.) --- 0.071 AR coeff. (2nd s.) --- -0.062
27