et 7.3 9 27 2010
TRANSCRIPT

Sharpen Your InsightSharpen Your Insight Reach Ethnic and ReligiousReach Ethnic and Religious
Markets with upwards ofMarkets with upwards of
90% 90% AccuracyAccuracy

What is America?What is America?

America has America has always been always been a country of a country of multiple multiple heritages.heritages.

unique values.
More significantly,we seeeach groupchoosing tomaintain andpreserve their

Their preferences and family Their preferences and family values are shaped by their values are shaped by their culture, social structure and culture, social structure and political climate.political climate.

Whether from Ancestral Whether from Ancestral Immigration or New Immigration or New
Citizenship Every One has an Citizenship Every One has an Ethnic OriginEthnic Origin
What is EthnicityWhat is Ethnicity?? Ethnicity is an individuals identity with or membership in a
particular racial or cultural group. Many ethnic and religious groups in the United States maintain a
strong cultural identity. Immigrants are often attracted to communities from their own ethnicity, communities in which many traditional cultural features are maintained.
An individuals ethnicity is not in all circumstances related to ones “Country of Origin”.
Deepak Banerjee may have been born in England and then came to our country, but his ethnicity is Indian and his religion is Hindu.
Melting Pot or Salad Bowl?Melting Pot or Salad Bowl? Conventional wisdom says that America is a melting
pot of many different cultures. Try mixing up six different cheeses in a melting pot then try to find the different taste values of each. It is very difficult to do. The same applies to identifying the different cultures in our nation.
A better approach is to see the diversity in America as a mixed salad, where each different ingredient can be identified. This method, if used properly applies to the many ethnicities and different cultures in our nation and each can be identified.

America in 2010 - what we often America in 2010 - what we often refer to as the “Minority Population” refer to as the “Minority Population” has become the majority in our has become the majority in our major urban markets.major urban markets.
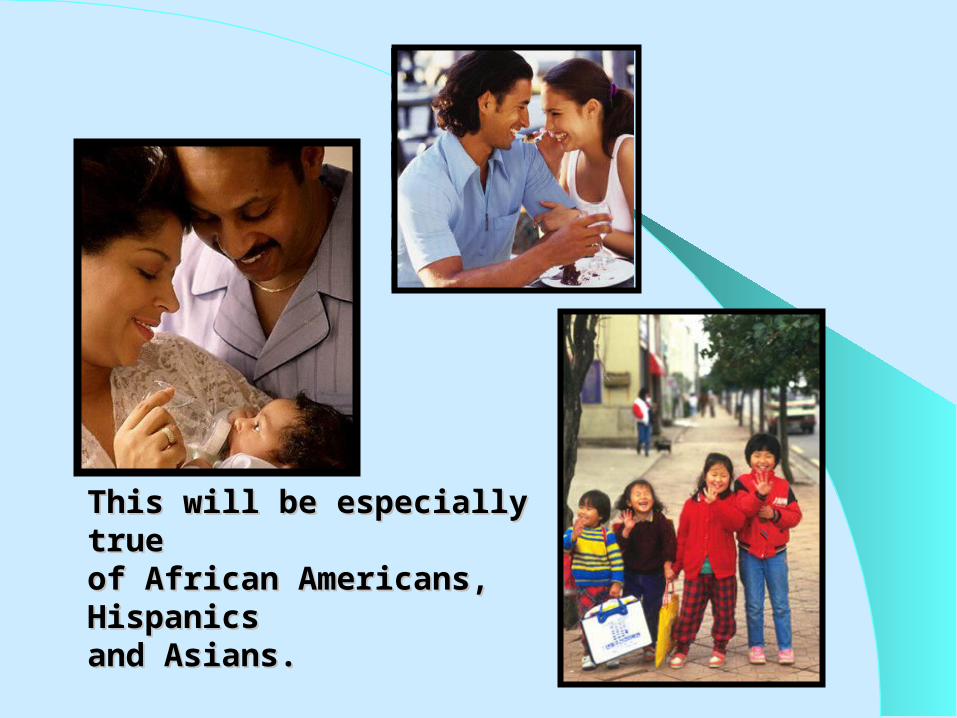
This will be especially trueThis will be especially trueof African Americans, of African Americans, HispanicsHispanicsand Asians.and Asians.

Ethnic Markets are growingEthnic Markets are growing
0
10
20
30
40
50
60
70
African Americans Hispanic Asian
Popu
latio
n in
Mill
.
1980199020092020

Multicultural MarketingMulticultural MarketingOffers Many OpportunitiesOffers Many Opportunities
In 2010, today’s Minorities make up a majority of the populations of California, Florida and Texas.
In some of the nations largest markets such as New York, Washington, Los Angeles and Atlanta more than half the residents are non-white, and in some cases up to 70% of these populations will be multicultural.
The US government announced in January 2003 that the Hispanic population has become the major minority totaling 36.8 million individuals.
Hispanic PopulationHispanic Population Hispanic Population reached 48.4 million in July 2009, 16% of
the total US population. The US is now the 2nd largest Hispanic population in the world,
Mexico being number 1. The Hispanic population in the US surpasses the entire population
of Canada. The Hispanic population in the US has increased 60.4% since
1990. The Hispanic population is made up of people that come from over
20 different countries to the US. The projected Hispanic population of the United States by July
2050 is over 131 million. According to this projection, Hispanics will constitute 30% of the nation's population by then

Hispanic PopulationHispanic PopulationThere are no Hispanics in Latin America. They are either Colombian, Venezuelan, Mexican, etc. Here in this country we lump people from Latin American and Spanish heritage under the Hispanic umbrella classification. Hispanic is not a race, although many Hispanics do exhibit mixed race characteristics and in an effort to classify them into race categories some have mistakenly used the term as a race in the marketing nomenclature. Hispanic is not a race, it is an ethnic classification.

Hispanic Population by Hispanic Population by RegionRegion20102010
05
101520253035404550
Northeast Midwest South West
Hispanic %
Non-HispanicWhite %

Origin of the US Hispanic Origin of the US Hispanic PopulationPopulation
54%
18%
3%
14%
5%4%2%
MexicoPuerto RicoCubaOtherCentral AmericaSouth AmericaDominican Republic

Hispanic CultureHispanic Culture Hispanic people have been in this country for a
very long time. The earliest settlement in North America was in St. Augustine, Florida by people from Spain. The great majority of Hispanics come here for economic reasons. Some, like most Cubans, came to the US to escape communism. Unlike other immigrants from Europe, few Hispanics immigrate for religious reasons. The difference in the factors that motivate immigration create a very different mindset among US Hispanics.

Hispanic CultureHispanic Culture Physical contact is very important. Personal space tends to be closer. Hispanics are family oriented. Appearance is extremely important to Latinos. Hispanics are more spiritual in nature. Hispanic homes are more decorative. Hispanics feel ‘Brand Name’ and ‘Made in the USA’ means high
quality.
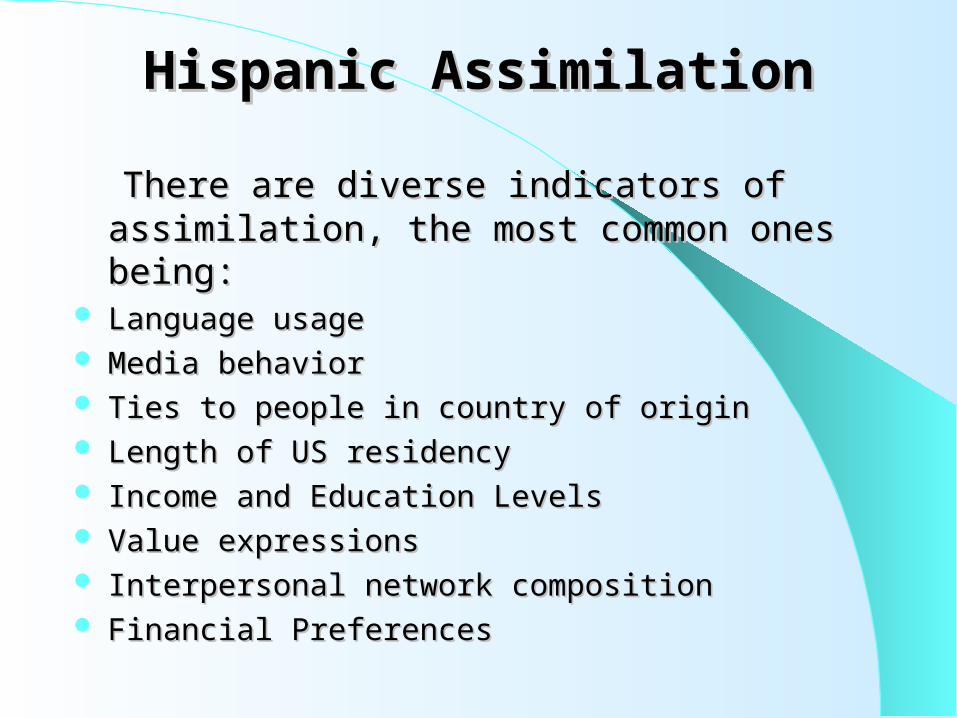
Hispanic AssimilationHispanic Assimilation
There are diverse indicators of assimilation, the There are diverse indicators of assimilation, the most common ones being:most common ones being:
Language usageLanguage usage Media behaviorMedia behavior Ties to people in country of originTies to people in country of origin Length of US residencyLength of US residency Income and Education LevelsIncome and Education Levels Value expressionsValue expressions Interpersonal network compositionInterpersonal network composition Financial PreferencesFinancial Preferences
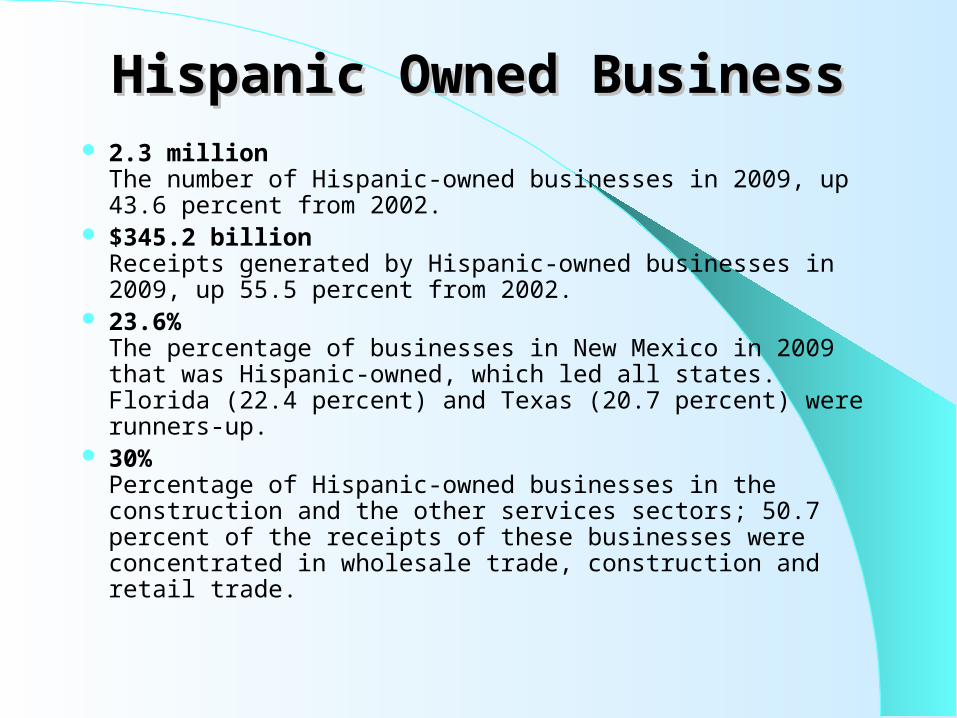
Hispanic Owned BusinessHispanic Owned Business 2.3 million
The number of Hispanic-owned businesses in 2009, up 43.6 percent from 2002.
$345.2 billionReceipts generated by Hispanic-owned businesses in 2009, up 55.5 percent from 2002.
23.6%The percentage of businesses in New Mexico in 2009 that was Hispanic-owned, which led all states. Florida (22.4 percent) and Texas (20.7 percent) were runners-up.
30%Percentage of Hispanic-owned businesses in the construction and the other services sectors; 50.7 percent of the receipts of these businesses were concentrated in wholesale trade, construction and retail trade.

African American African American PopulationPopulation
The African American population reached 40.7 million in 2009, 13.6% of the total US population.
Between 2002 & 2020 their growth rate is projected to be 1.3% a year and by 2020 make up 17.2% of our total population.
39% of African American’s live in suburbs and nearly three-tenths of households are middle and upper class.
African American’s gravitate towards products that are seen as reflecting their sense of community, embracing their values and supporting their goals.
More than 70% of African American’s read community-based news and publications.

Asian PopulationAsian Population The Asian Population reached 15.5 million in 2009. 5.1%
of the total US population. Between 2002 & 2020 their growth rate is projected to be
5.2% a year and by 2020 make up 10.2% of our total population.
*The Fastest Growing group by percent. Over 7 Million Asians speak their native language at
home. 88% of this group are either foreign-born or have at least
one foreign-born parent.
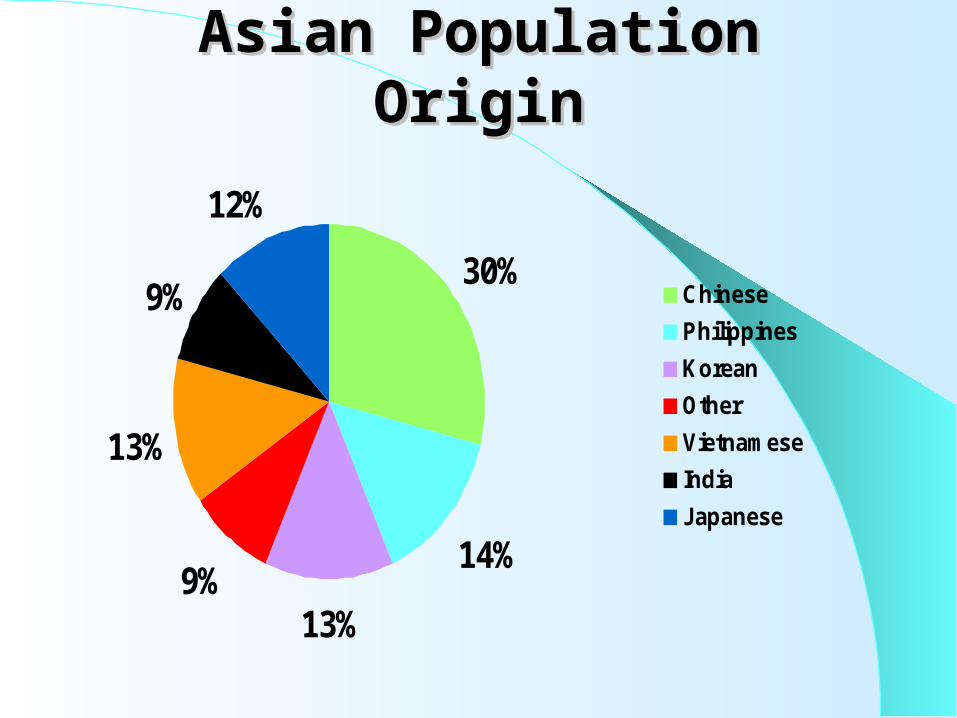
Asian Population OriginAsian Population Origin
30%
14%
13%9%
13%
9%
12%
ChinesePhilippinesKoreanOtherVietnameseIndiaJapanese

How Asian Americans prefer to How Asian Americans prefer to be marketed tobe marketed to
(in percentages)(in percentages) ( From National Asian American Survey, October 2009) ( From National Asian American Survey, October 2009)
0102030405060
English OnlyAsian LanguageBoth

Future purchasing power is rapidly Future purchasing power is rapidly increasing for the Multicultural increasing for the Multicultural
populationpopulation

Multicultural Multicultural Purchasing PowerPurchasing Power
2010 2012 projectionsAfrican
American $925 billion $1.2 trillion
Hispanic $ 1 trillion $1.4 trillionAsian
American $545 billion $752 billion
Native American $61.8 billion $84.6 billion

Projected Minority Purchasing Projected Minority Purchasing Power Power
2000 to 20452000 to 2045
0
1
2
3
4
5
2000 2010 2020 2030 2045
By 2045 Minority buying power may reach 4.8 trillion US Dollars.
Minority Populations may contribute 44%, or as much as 70% of the total increase in buying power from 2000-2045.
(This percentage depends on the proportional increase or decrease in income disparity).
Trillions of dollars with year 2005 dollar value

Hispanic Purchasing Hispanic Purchasing PowerPower
Hispanic Population reached 48.4 million in 2009, 16% of the total US population.
Total consumer spending by Hispanics is $1 trillion for 2010.
Between 2002 & 2020 their growth rate is projected to be 2.8% a year and by 2020 make up 18.9% of our total population.
Projected income growth per households will be 4.8% per year and personal consumption spending will average 9.1% growth through the year 2020.
Hispanics will outpace the national average through the year 2020 and beyond.
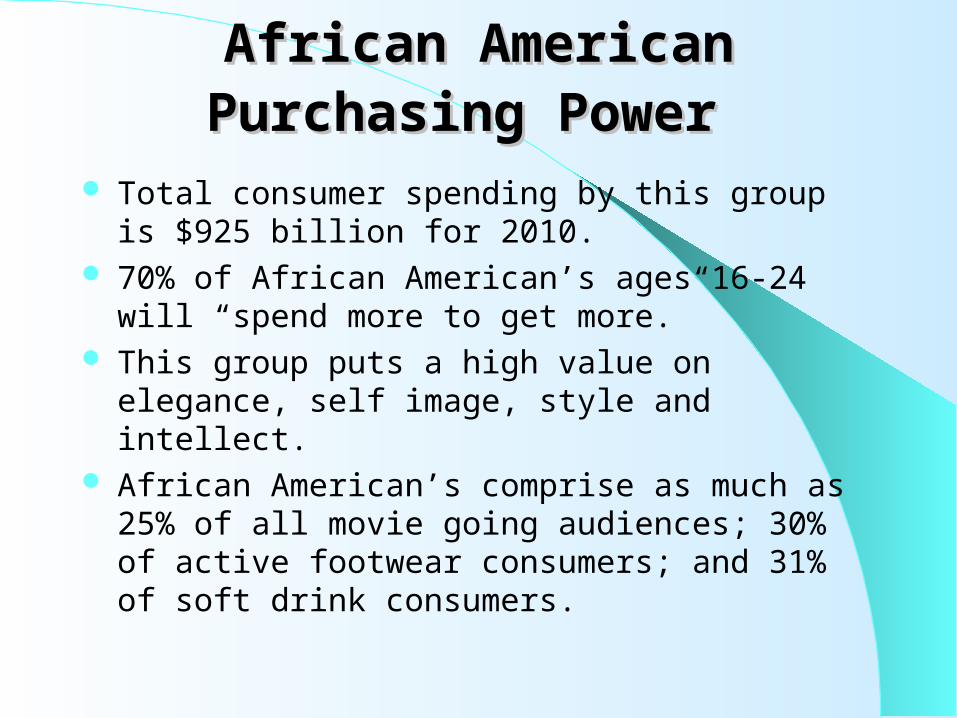
African American African American Purchasing PowerPurchasing Power
Total consumer spending by this group is $925 billion for 2010.
70% of African American’s ages 16-24 will “spend more to get more.”
This group puts a high value on elegance, self image, style and intellect.
African American’s comprise as much as 25% of all movie going audiences; 30% of active footwear consumers; and 31% of soft drink consumers.

Asian Purchasing PowerAsian Purchasing Power
Annual median income for this group is $54,500. Total consumer spending by this group is $545 billion for
2010. 87% of this group who are over 25 are high school
graduates, 48% have a bachelors degree and 16% have achieved an advanced degree (e.g master’s, Ph.D., M.D., or J.D.) The Highest Education Level by percent .
Home ownership for this group is upwards of 64%.
Where will this Purchasing Where will this Purchasing power go? power go?
Are you trying to reach these markets? Are you trying to increase your sales while keeping your
costs down? If your answer is yes, then your answer is E-Tech.
One Size Fits All, Or Does It?One Size Fits All, Or Does It?
Western cultures view the color white as purity while some Asian cultures associate white with death.
The color red in some Asian cultures is considered lucky, western cultures see it as a symbol of anger or passion.
Orange is considered very neutral and accepted by all Asian communities.
Marketing to the ethnic communities sometimes means going against conventional wisdom.

Appreciate DiversityAppreciate Diversity
Become familiar with the culture you are trying to reach. Acknowledge the wide variety of groups within the
Hispanic and Asian communities. Even within the same cultural group there are differences. Country of Origin may not necessarily be the same as
ethnic origin.

Appreciate The Groups Appreciate The Groups WithinWithin
There is very little in common among many of the sub-groups. Even language can drastically
vary. Many marketing mistakes have occurred from the assumption that all Hispanics are alike. We often think that the cultural traits of an individual from Mexico would be equal to that of one from Cuba. Yet Mexican culture is very different from the rest of Latin America.

Over 177 EthnicitiesOver 177 Ethnicities& 12 Major & 12 Major ReligionsReligions
Are waiting for you to contact Are waiting for you to contact themthemHow are How are youyou going to reach going to reach them?them?
Are the methods you are using to Are the methods you are using to target multicultural markets delivering target multicultural markets delivering
the results you want ?the results you want ?
Geo coding, census data and surname tables may cause poor results and response rates
These methods can cause inaccurate Ethnic, Language Preference and Religious
identification
But Wait…. There is one product But Wait…. There is one product that out performs these methods to that out performs these methods to
better identify your markets!better identify your markets!

has developedhas developed “ ” “ ”
Which identifies Ethnicity, HispanicWhich identifies Ethnicity, Hispanic Country of Origin, Religion andCountry of Origin, Religion and
Language PreferenceLanguage Preference.

Your dataYour data
is a business solutions provider that enables you to identify the Ethnicity, Religion and Language Preference of any individual on any database you may be using.

YourYour datadata
E-TechE-Tech enables you to identify Ethnicity, Religion and Language Preferences ofany individual...
+
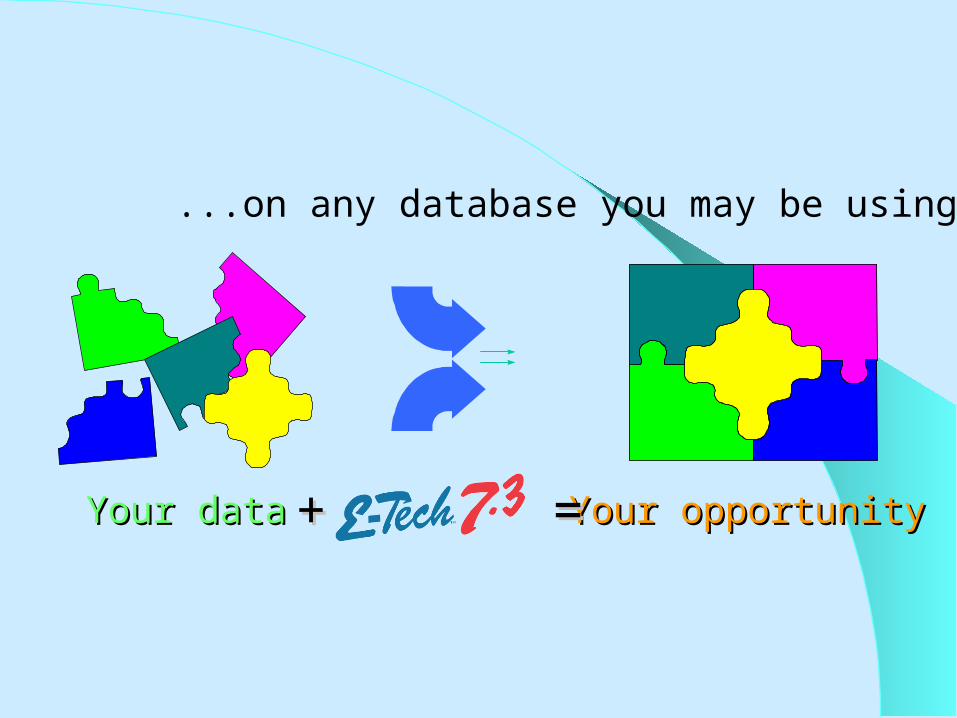
Your dataYour data Your opportunityYour opportunity
...on any database you may be using.
==++

Multicultural Marketing Is An Multicultural Marketing Is An OpportunityOpportunity
E-Tech enables you to seize this opportunity by accurately identifyingE-Tech enables you to seize this opportunity by accurately identifying
African Americans Hispanics
Asians And 170 + other groups
E-Tech also enables you to find E-Tech also enables you to find the fast growing ethnic family the fast growing ethnic family
marketsmarkets
Why use ?Why use ?E-Tech provides market insights that help you gain vital intelligence about your markets and customers.
Ethnic Technologies staff has researched ethnicity, religions and languages all over the world.
Our HistoryOur History Ethnic Technologies was formed in 1997, by two
companies. One possessed the largest body of ethnic research dating back to 1958, while the other brought a fresh approach and research of its own. From this E-Tech was born.
Ongoing research takes E-Tech a step ahead of any other approach.

The E-Tech Targeting System The E-Tech Targeting System SynopsisSynopsis
Unique first name files Unique surname files Non-unique first name files Unique middle name files A series of two (2) to six (6) character prefix rule
files A series of three (3) to six (6) character suffix rule
files

System Synopsis (cont.)System Synopsis (cont.) Codes to attach to a name record which identify
ethnicity, religion and language spoken. Geocentric reference tables. Programs that apply the above to lists and
databases. Full documentation and support including a users
group.

Steps in Assigning EthnicitySteps in Assigning Ethnicity

Why the addition of middle names?
Research has shown that there are names common to two or more ethnic groups. This is where the middle name, when available, is used as a tie breaker.
Middle Names are also used to define different religions within an ethnic group. Ex. Hindu or Sikh
John Smith could be English or African American depending on his geographic location. If his full name was John Big Eagle Smith he would be coded as Native American regardless of his geographic location.
Peter Yu could be either Korean or Chinese. Peter Mei Yu would be coded Chinese and Peter Hak Yu would be coded Korean.

Language PreferenceLanguage Preference
• In marketing we often wind up sending the right message to In marketing we often wind up sending the right message to the wrong audience or we reach the right audience but in the the wrong audience or we reach the right audience but in the wrong language.wrong language.
• Their Language Preference is the language that they both speak Their Language Preference is the language that they both speak and think in.and think in.
• If possible, you want each mail piece to be read and considered If possible, you want each mail piece to be read and considered in the language the consumer thinks in.in the language the consumer thinks in.

What Language Does Pablo What Language Does Pablo Prefer?Prefer?
Pablo thinks and speaksPablo thinks and speaks

Language Preference Influences Language Preference Influences Consumer SpendingConsumer Spending
A recent survey stated that more than half (56%) of Hispanic Consumers are Spanish Dominant, preferring Spanish for all communications. They have a strong cultural identity and desire to protect it.
E-Tech’s language preference identification methods enable you to identify these individuals with unmatched accuracy.
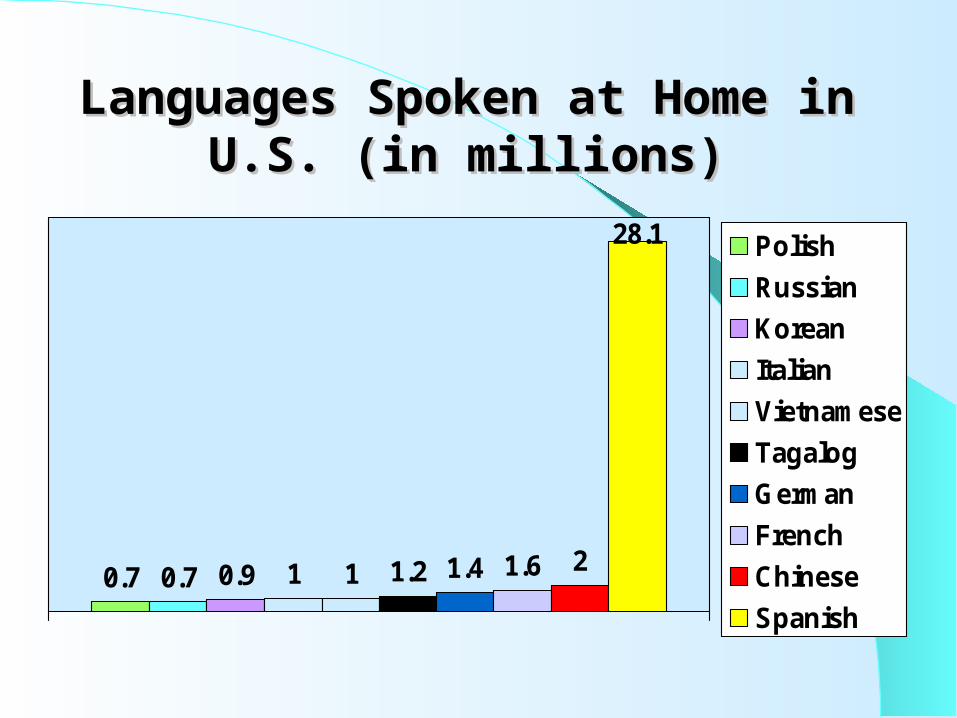
Languages Spoken at Home Languages Spoken at Home in U.S. (in millions)in U.S. (in millions)
0.7 0.7 0.9 1 1 1.2 1.4 1.6 2
28.1 PolishRussianKoreanItalianVietnameseTagalogGermanFrenchChineseSpanish
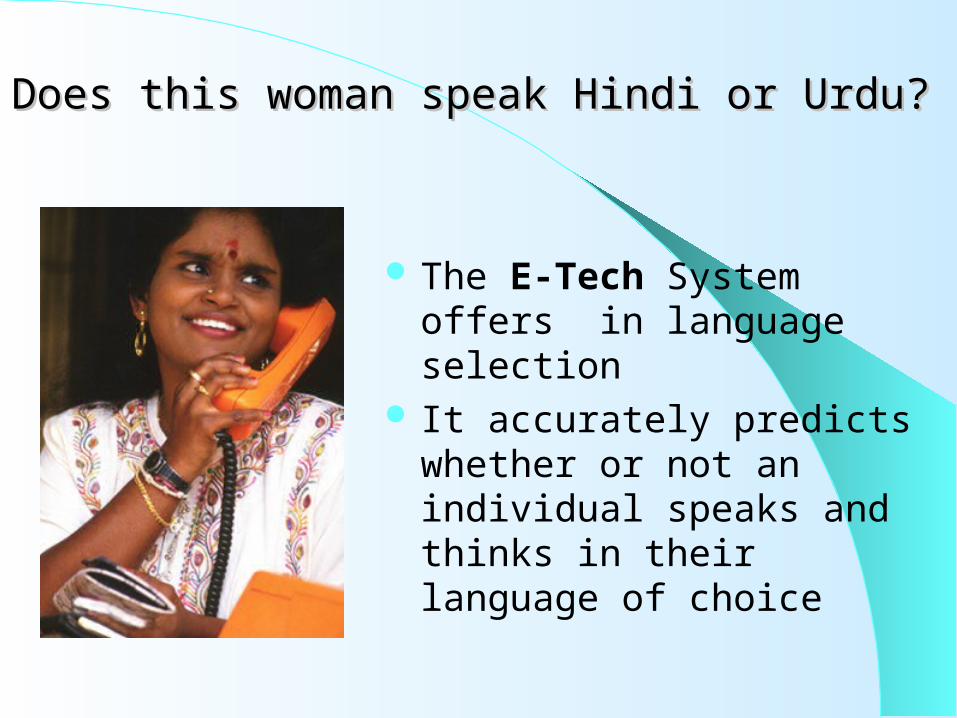
Does this woman speak Hindi or Urdu?Does this woman speak Hindi or Urdu?
The E-Tech System offers in language selection
It accurately predicts whether or not an individual speaks and thinks in their language of choice

How do we accomplish How do we accomplish this?this?
First, by identifying unique first names. – E-Tech has the worlds largest body of research on this.
Second, by matching unique surnames to first names which identify language preference.
For example: E-Tech will say Marisol probably speaks and thinks in Spanish whether or not her last name is Lopez or Koslowski.

Translation vs. TransliterationTranslation vs. Transliteration
Language marketing is not simple, for example:
The ad campaign “Got Milk?” was launched in a Spanish version and translated to “¿Tiene Leche?” and was roughly translated as “Are you breast-feeding?” The campaign producer at the time had a limited grasp of the Hispanic Culture. After rethinking their approach the ad read “¿Y usted, les dio suficiente leche hoy?”
(Have you given them enough milk today?)

Today’s Most Powerful EthnicToday’s Most Powerful EthnicMarketing Tool Just Got StrongerMarketing Tool Just Got Stronger
Announcing Version Announcing Version 7.37.3 E-Tech 7.37.3 adds unprecedented breadth and depth
to your ethnic, religious and spoken language marketing capabilities. Now you can expect an 92% to 97% match rate with up to of 95% accuracy, and dig deeper into specific markets with more unique first names, unique middle names and surnames.

The systemThe system Fall Fall 20102010
Over 175 Ethnic groups Over 175 Ethnic groups Over 171,725 first namesOver 171,725 first names Over 92,175 ethnic unique first namesOver 92,175 ethnic unique first names Over 940,250 ethnic unique surnamesOver 940,250 ethnic unique surnames Over 335 ethnic unique middle names Over 335 ethnic unique middle names Over 3,595 expert system rulesOver 3,595 expert system rules Over 80 Language groupsOver 80 Language groups 21 Hispanic Country of Origin subsets21 Hispanic Country of Origin subsets 12 Religion groups12 Religion groups
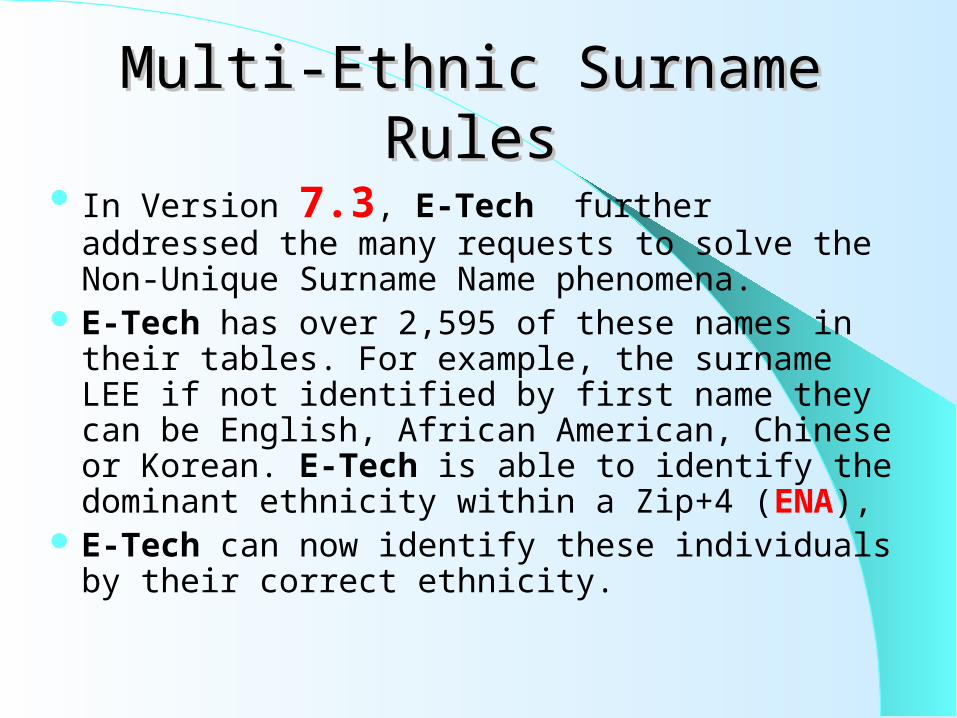
Multi-Ethnic Surname RulesMulti-Ethnic Surname Rules In Version 7.3, E-Tech further addressed the many
requests to solve the Non-Unique Surname Name phenomena.
E-Tech has over 2,595 of these names in their tables. For example, the surname LEE if not identified by first name they can be English, African American, Chinese or Korean. E-Tech is able to identify the dominant ethnicity within a Zip+4 (ENA),
E-Tech can now identify these individuals by their correct ethnicity.
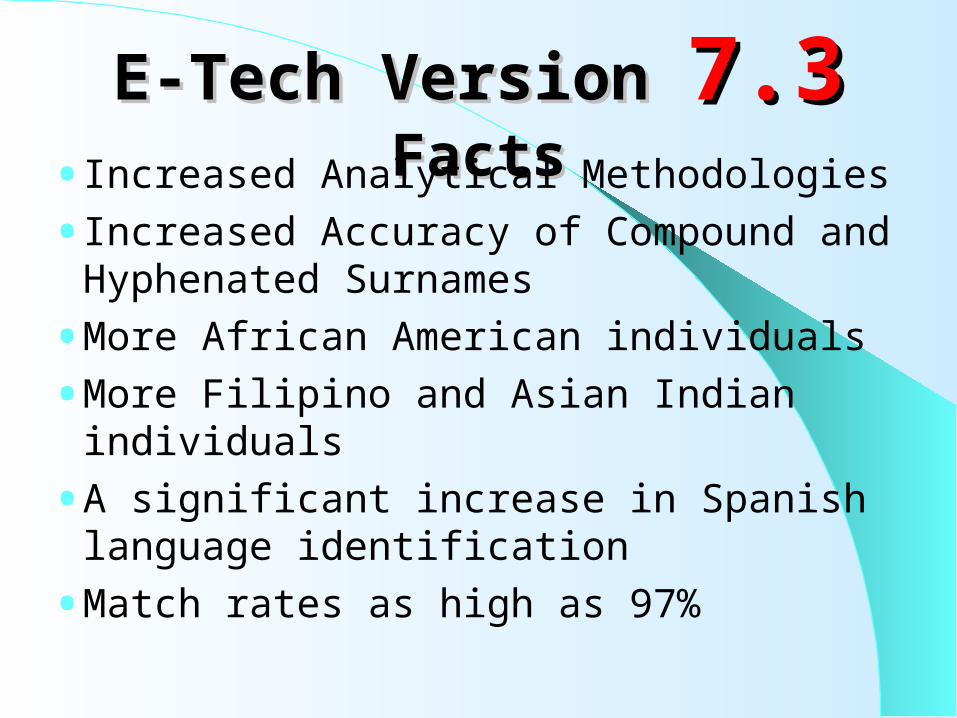
E-Tech Version E-Tech Version 7.37.3 FactsFacts• Increased Analytical Methodologies
• Increased Accuracy of Compound and Hyphenated Surnames
• More African American individuals• More Filipino and Asian Indian individuals • A significant increase in Spanish language
identification• Match rates as high as 97%

E-Tech Version E-Tech Version 7.37.3 Facts Facts (cont.)(cont.)
The dramatic increases in E-Tech Version The dramatic increases in E-Tech Version 7.37.3 are the results of two main efforts: are the results of two main efforts:
Names Research - Leading name research efforts has been a key strength of E-Tech for more than 40 years. E-Tech Version 7.3 now incorporates 28% more first names and 44% more surnames than E-Tech Version 7.0.
Enhanced Neighborhood Analytics (ENA) – The incorporation of ENA technology in E-Tech Version 7.3 establishes a new and unprecedented level of granularity and completeness in the Ethnic marketing industry.

Assimilation is a level in which a Hispanic or Asian individual has adapted to our language and way of living. Ethnicity, language preference, education, income, socioeconomic status, dwelling unit size and enhanced neighborhood analytics are used as variables along with our expert system rules to match a Hispanic or Asian individual with one of our assimilation index codes. With each level of assimilation the individuals spending habits, socioeconomic status, communication preference and other lifestyle characteristics differ.
Ethnic Technologies has done extensive research into these important cultural traits and incorporated assimilation indexes into a premium additional module that compliments their core E-Tech ethnic enhancement product.
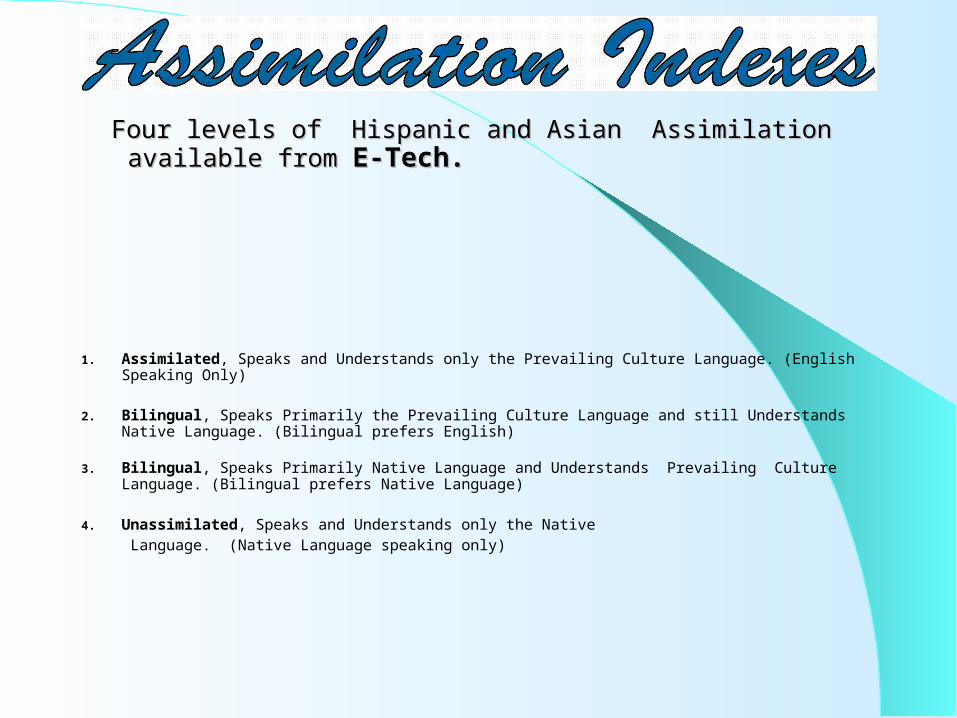
Four levels of Hispanic and Asian Assimilation available from Four levels of Hispanic and Asian Assimilation available from E-Tech.E-Tech.
1. Assimilated, Speaks and Understands only the Prevailing Culture Language. (English
Speaking Only)
2. Bilingual, Speaks Primarily the Prevailing Culture Language and still Understands Native Language. (Bilingual prefers English)
3. Bilingual, Speaks Primarily Native Language and Understands Prevailing Culture Language. (Bilingual prefers Native Language)
4. Unassimilated, Speaks and Understands only the Native Language. (Native Language speaking only)
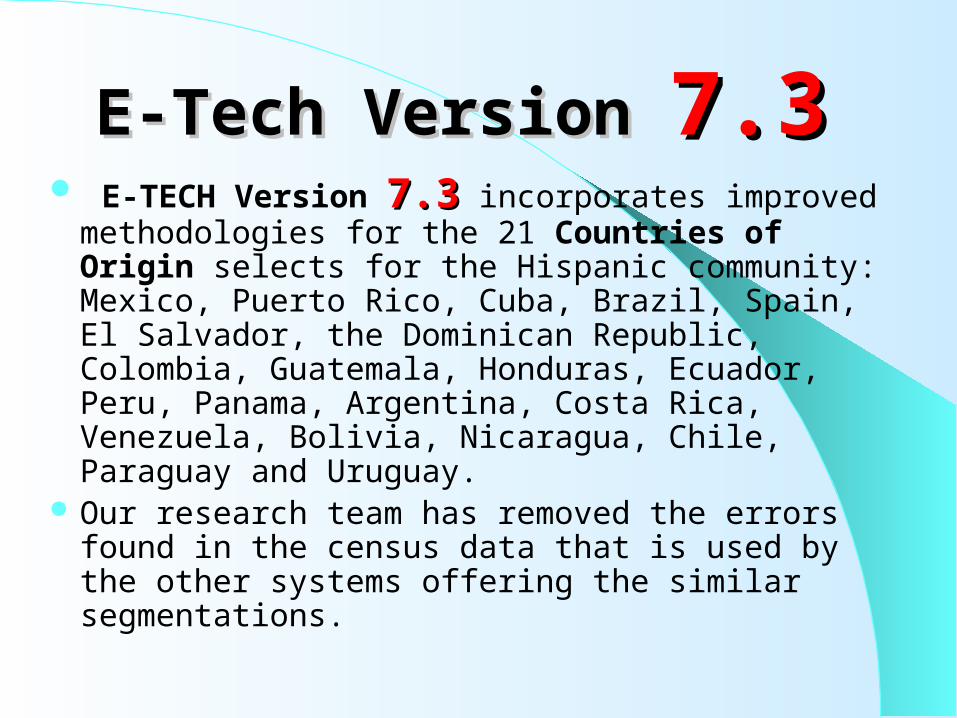
E-Tech Version E-Tech Version 7.37.3 E-TECH Version 7.37.3 incorporates improved
methodologies for the 21 Countries of Origin selects for the Hispanic community: Mexico, Puerto Rico, Cuba, Brazil, Spain, El Salvador, the Dominican Republic, Colombia, Guatemala, Honduras, Ecuador, Peru, Panama, Argentina, Costa Rica, Venezuela, Bolivia, Nicaragua, Chile, Paraguay and Uruguay.
Our research team has removed the errors found in the census data that is used by the other systems offering the similar segmentations.
Why the Addition of HispanicWhy the Addition of HispanicCountry of Origin?Country of Origin?
Research has shown us that diversity also exists within the Hispanic community. From different buying habits to different dialects within the Spanish language each deserves a unique approach tailored to their specific needs. The cultural identity and purchasing trends exhibited by a family from Cuba are different than those from a family from Mexico.

Eliminate Error inEliminate Error inGeographic TargetingGeographic Targeting
E-Tech’s-Tech’s Team removes the error in the census Team removes the error in the census data their competitors use.data their competitors use.
Backed by years of exhaustive research and smart Backed by years of exhaustive research and smart programming methodologies, programming methodologies, E-TechE-Tech is by far the is by far the most accurate and rigorous multicultural marketing most accurate and rigorous multicultural marketing tool available anywhere.tool available anywhere.
7.37.3 Higher Accuracy, Higher Accuracy, Lower CostLower Cost
E-Tech 7.3 applies algorithms at a Zip+4 level resulting in greater accuracy
E-Tech 7.3 identifies the multicultural consumer characteristics
E-Tech 7.3 increases accuracy by retaining only those names that “most likely are” within your profile
E-Tech’sE-Tech’s Improved Gender Improved Gender
Enhancement ProductEnhancement Product Originally based upon preponderance theory,
whereby a large database was examined for known gender identification, G-Tech 3.1 has been extensively modified by Ethnic Technologies personnel to incorporate much of the research done on first names for the E-Tech 7.3 product. The tables used in G-Tech 3.1 now contain correct gender identification for over 445,250 first names including all of the unique first names by ethnicity covered by E-Tech 7.3.

E-Tech'sE-Tech's 177 Ethnic Groups and 12 177 Ethnic Groups and 12 Major Religions can be accessed in Major Religions can be accessed in
five waysfive ways Via The EthniCenter Database
– Our own multi-sourced compiled database Via the many Consumer and Business lists that
use our system Encode your data with E-Tech
– We currently run an 90% - 97% match rate E-Tech’s In House EthniCenter Database License the E-Tech expert software system
– Available in Main Frame, Server and PC versions

Successful Uses for E-Tech DataSuccessful Uses for E-Tech Data Credit Card Offers Affinity Programs Fundraising Home Mortgage Offers Automotive Offers Retail Services Insurance Offers Long Distance Cable or Satellite TV Offers Political Campaigns Health Care and Pharmaceuticals
Product Developments for Product Developments for 20102010
Available now EMSEMS E-Tech’sE-Tech’s micro geographic propensity and analytical data segmentation.
Available now E-Tech’s Emprix E-Tech’s Emprix enhanced master files and email files.
Available now EthniBase E-Tech’sEthniBase E-Tech’s complete data management software package.
Available now E-Tech’s Prizm E-Tech’s Prizm enhanced master files and email files.
Available now E-Techs’ Assimilation Elements.E-Techs’ Assimilation Elements.

EMSEMS EMSEMS, E-Tech’sE-Tech’s micro geographic propensity and
analytical data segmentation product.
E-Tech has developed data market analysis services designed to give marketers in-depth and up-to-date market intelligence. E-Tech's data analysis services encompass the creation of predictive models which can be used to indicate acculturation level, credit worthiness, lifestyles, and purchasing behavior..
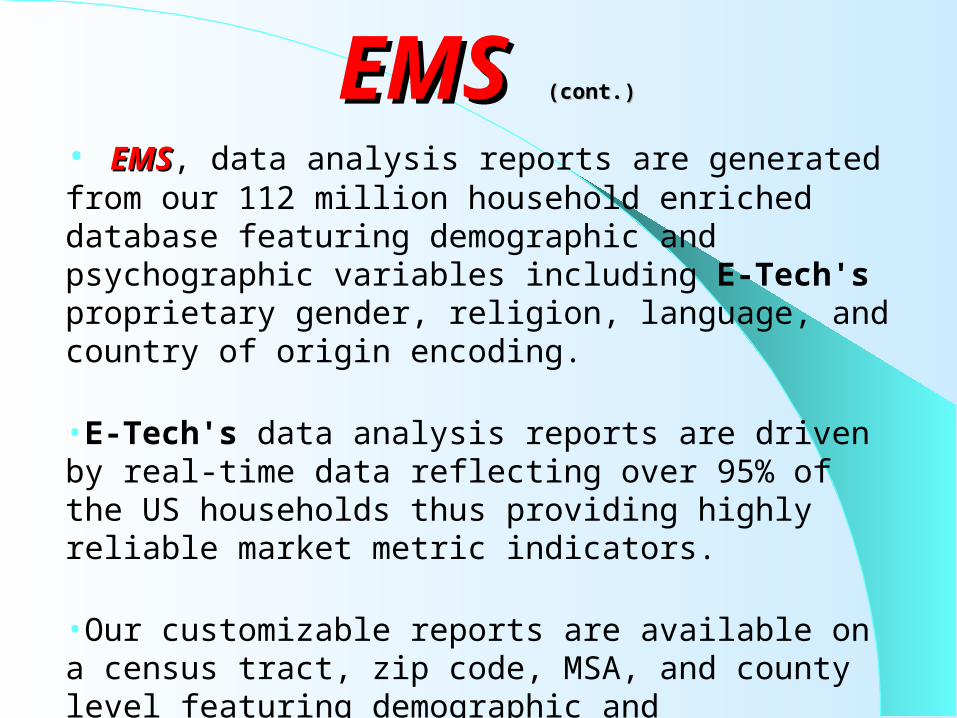
EMSEMS (cont.)(cont.)
• EMSEMS, data analysis reports are generated from our 112 million household enriched database featuring demographic and psychographic variables including E-Tech's proprietary gender, religion, language, and country of origin encoding.
•E-Tech's data analysis reports are driven by real-time data reflecting over 95% of the US households thus providing highly reliable market metric indicators.
•Our customizable reports are available on a census tract, zip code, MSA, and county level featuring demographic and psychographic data elements.
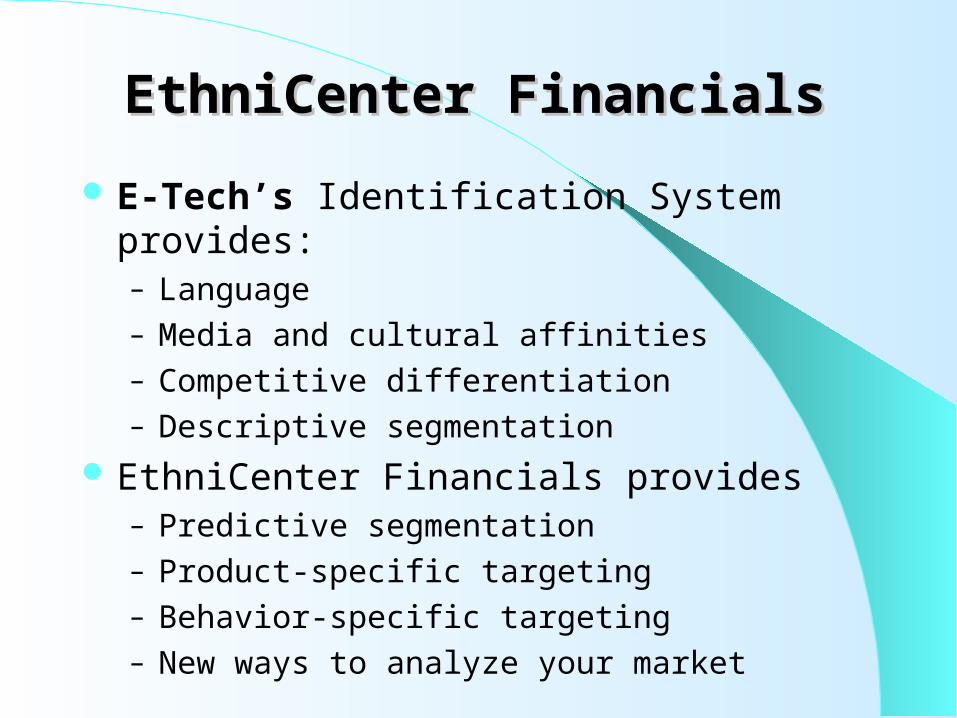
EthniCenter FinancialsEthniCenter Financials E-Tech’s Identification System provides:
– Language– Media and cultural affinities– Competitive differentiation– Descriptive segmentation
EthniCenter Financials provides– Predictive segmentation– Product-specific targeting– Behavior-specific targeting– New ways to analyze your market
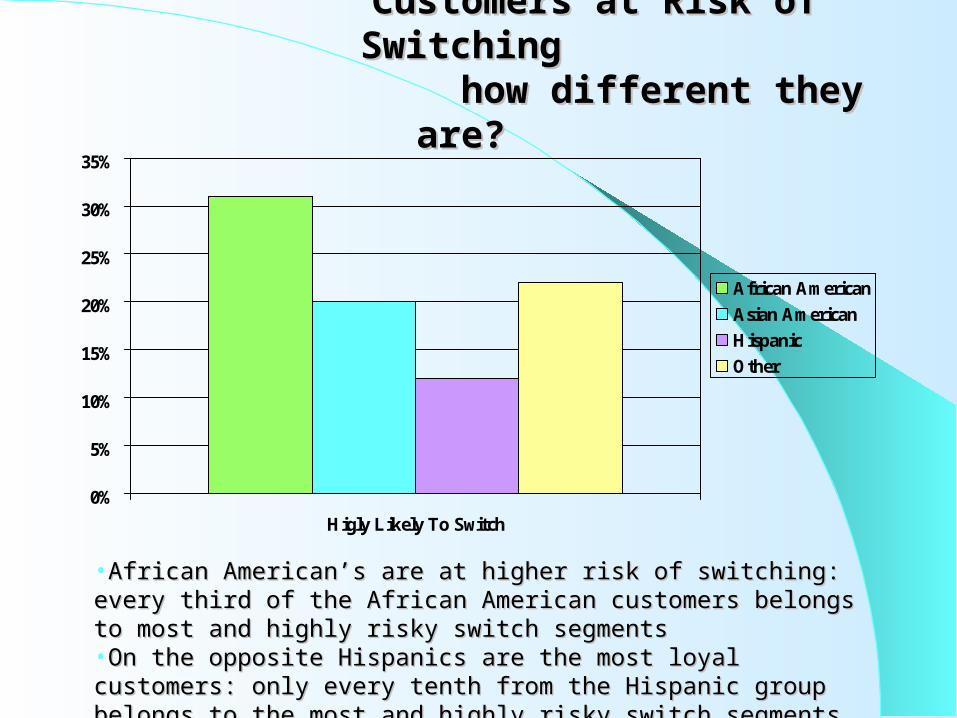
Customers at Risk of SwitchingCustomers at Risk of Switching how different they are? how different they are?
0%
5%
10%
15%
20%
25%
30%
35%
Higly Likely To Switch
African AmericanAsian AmericanHispanicOther
•African American’s are at higher risk of switching: every third of the African African American’s are at higher risk of switching: every third of the African American customers belongs to most and highly risky switch segmentsAmerican customers belongs to most and highly risky switch segments•On the opposite Hispanics are the most loyal customers: only every tenth from On the opposite Hispanics are the most loyal customers: only every tenth from the Hispanic group belongs to the most and highly risky switch segments the Hispanic group belongs to the most and highly risky switch segments
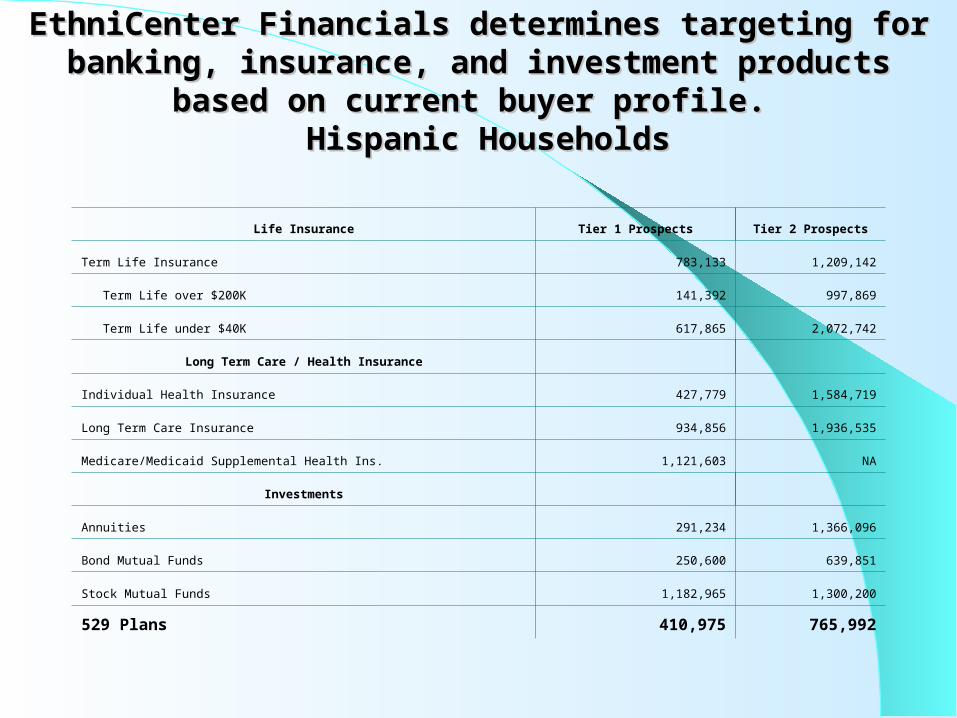
EthniCenter Financials determines targeting for banking, EthniCenter Financials determines targeting for banking, insurance, and investment products based on current buyer insurance, and investment products based on current buyer
profile. profile. Hispanic Households Hispanic Households
Life Insurance Tier 1 Prospects Tier 2 Prospects
Term Life Insurance 783,133 1,209,142
Term Life over $200K 141,392 997,869
Term Life under $40K 617,865 2,072,742
Long Term Care / Health Insurance
Individual Health Insurance 427,779 1,584,719
Long Term Care Insurance 934,856 1,936,535
Medicare/Medicaid Supplemental Health Ins. 1,121,603 NA
Investments
Annuities 291,234 1,366,096
Bond Mutual Funds 250,600 639,851
Stock Mutual Funds 1,182,965 1,300,200
529 Plans 410,975 765,992
Database ModelingDatabase Modeling
Using E-Tech to enhance your database helps you to identify the ethnicity, language spoken and religion of the individuals on your files.
You will be acquainted with your customers before they are acquainted with you.

Modeling AdvantagesModeling Advantages Tailor your campaigns and offers to meet specific
needs and lifestyles
Create more comfort with your product or offer
Create more response for your product or offer
Higher probability of accepting your offer
“Smart Mailing” saves money
Challenge GuaranteeChallenge GuaranteeWe are the Originators and Developers of We are the Originators and Developers of Ethnic, Religious, and Language Ethnic, Religious, and Language Identification Target Marketing.Identification Target Marketing.
We back up our claims of being the most We back up our claims of being the most accurate and rigorous list segmentation accurate and rigorous list segmentation available anywhere in the world today, with available anywhere in the world today, with our our CHALLENGE GUARANTEE!CHALLENGE GUARANTEE!
We continually welcome any challenge for We continually welcome any challenge for benchmark testing of our ethnic products and benchmark testing of our ethnic products and services against anyone claiming to provide services against anyone claiming to provide similar offerings, services or products based similar offerings, services or products based on the fact that we consistently achieve the on the fact that we consistently achieve the greatest results and returns leading the greatest results and returns leading the industry with upwards of industry with upwards of 90% accuracy90% accuracy..
Keep Up With the FutureKeep Up With the Future Ethnic Technologies’ full time, in-house ongoing
research allows you to keep pace with the future as it arrives.
Becoming an E-Tech user gives you an active role in shaping this future.

E-TechE-Tech Knows Who They Are Knows Who They Are
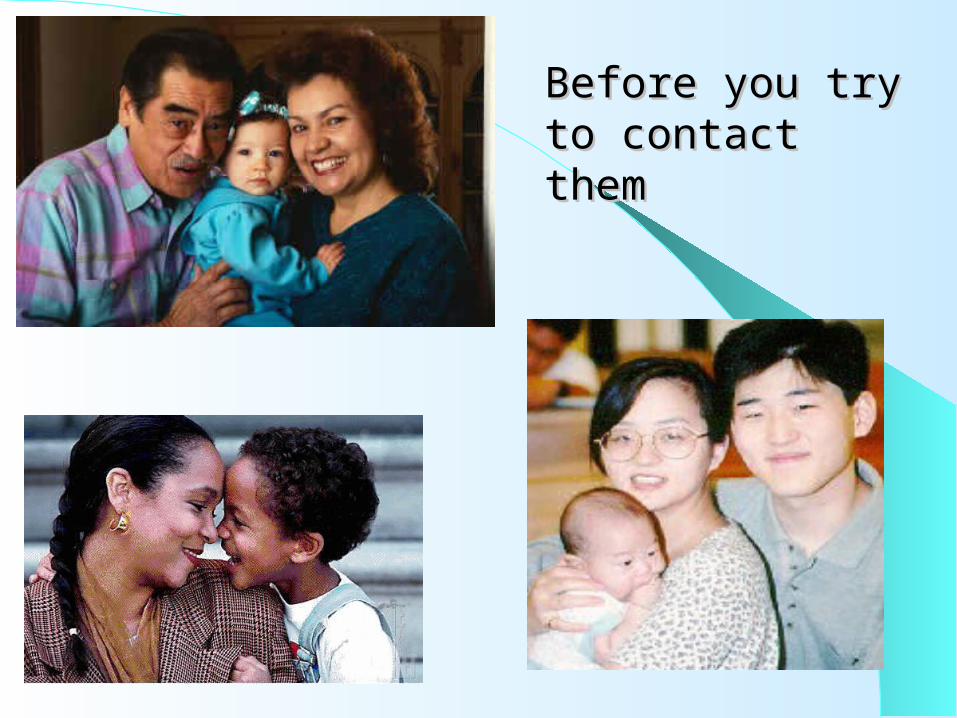
Before you try to Before you try to contact themcontact them

Contact UsContact UsCallCall
[email protected]@ethniclist.com
Or visit our web site @Or visit our web site @
www.ethnictechnologies.cowww.ethnictechnologies.comm

2010 Product Line2010 Product Line
E-Tech’sE-Tech’s Gender Enhancement Gender Enhancement
Product from Product from

2010 Product Line2010 Product Line
E-Tech’sE-Tech’s Canadian database from Canadian database from
2010 Product Line2010 Product Line
E-Tech’sE-Tech’s Family database from Family database from

2010 Product Line2010 Product Line
E-Tech’sE-Tech’s Geo-spatial and Demographic data Geo-spatial and Demographic data
mining mining solution fromsolution from
E-Tech MappingE-Tech Mapping andand
E-TechE-Tech Powered MicroBuild Powered MicroBuildHEHE

2010 Product Line2010 Product Line
E-Tech’sE-Tech’s Demographic data append and Demographic data append and address standardization product address standardization product
fromfrom
E-Tech ExpressE-Tech Express
How does Compare How does Compare to the competition?to the competition?
E-Tech E-Tech gives you more than just a number.gives you more than just a number.
We give you census neutral, real time We give you census neutral, real time actionable information that puts you in touch actionable information that puts you in touch with the individual. with the individual.

Value of Actionable Data ReportsValue of Actionable Data Reports
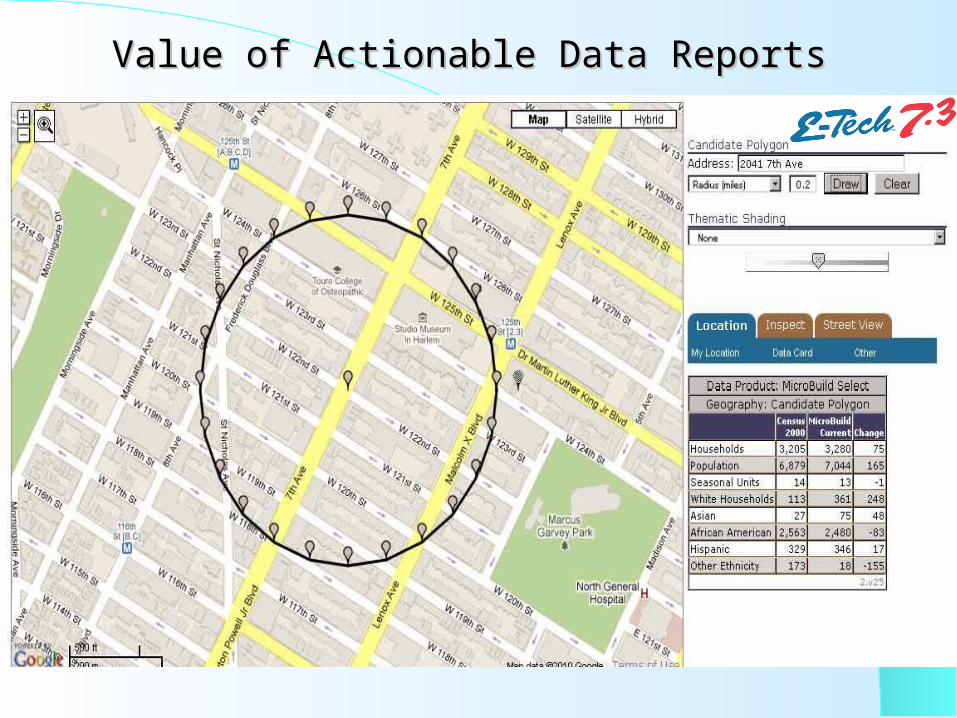
Value of Actionable Data ReportsValue of Actionable Data Reports

Value of Actionable Data ReportsValue of Actionable Data Reports

Value of Actionable Data ReportsValue of Actionable Data Reports

Value of Actionable Data ReportsValue of Actionable Data Reports
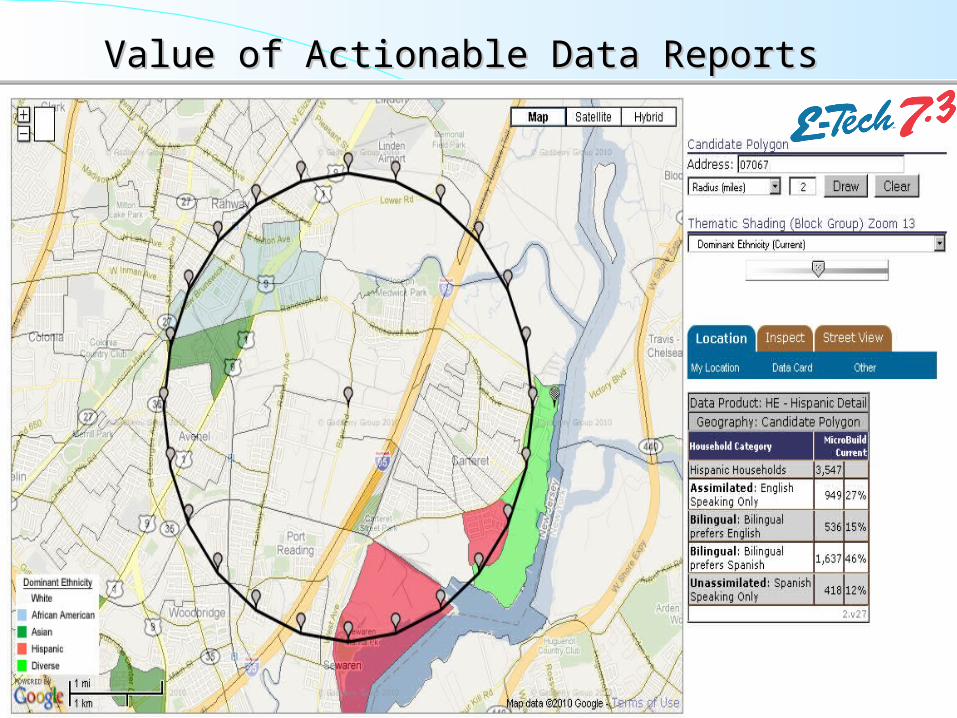
Value of Actionable Data ReportsValue of Actionable Data Reports

E-Tech’sE-Tech’s data cards can be data cards can be found at the sites listed found at the sites listed
below below www.ethnictechnologies.comwww.srds.comwww.nextmark.comwww.minokc.com
Ethnic Technologies, LLCEthnic Technologies, LLCis a team of people committed to:is a team of people committed to: Providing the world’s finest ethnic, religious and Providing the world’s finest ethnic, religious and
language preference targeting system.language preference targeting system. Bringing together with sensitivity, targeted groups Bringing together with sensitivity, targeted groups
and those with messages geared towards them. and those with messages geared towards them. Striving to improve by listening to those who use our Striving to improve by listening to those who use our
work.work. Finding practical solutions to nearly impossible tasks.Finding practical solutions to nearly impossible tasks.
1-866-333-83241-866-333-8324

Copyright 9/24/2010 Ethnic Technologies LLC 600 Huyler Street South Hackensack NJ 07606
Credits: C.M. Kennedy G.C. Holste T.J. Lindsay G.R. Nelson