estimators of fruit abundance of tropical trees1semliki/pdfs/chapmanetalethunt1992.pdfestimators of...
TRANSCRIPT

Estimators of Fruit Abundance of Tropical Trees1
Colin A. Chapman
Peabody Museum, Harvard University, Cambridge, Massachusetts 021 13, U.S.A.
Lauren J. Chapman
Museum of Comparative Zoology, Harvard University, Cambridge, Massachusetts 021 13, U.S.A
Richard Wangham, Kevin Hunt
Peabody Museum, Harvard University, Cambridge, Massachusetts 021 13, U.S.A.
Daniel Gebo
Department of Anthropology, Northern Illinois University, DeKalb, Illinois 60115, U.S.A.
and
Leah Gardner
Peabody Museum, Harvard University, Cambridge, Massachusetts 02113, U.S.A.
ABSTRACT
Many types of b~ological s t ~ ~ i l ~ e s require rht. estirnatio~i of food ahu~iil,ince In tropical fi~resrs, and a variety of mt.thods have been used to estimatt. this parameter. I-lere we cornpare the ;iccuracy .inii prec~sion of three lnerhods for estlmatlng the fruit ahucldaclce (hiomass and numhcr) of tropical rree specles. rree diameter, crown vo lu~ne , anil v~sua l cstlrnatlocl. D ~ ~ i m e r e r low levels of ~nrerobserver a t breast height (DBF-I)was tht. most consistently accurate methoit and e x h ~ b ~ t e i l variahility. Generally. crou7n volume a7Lis neither precise nor ,lccurare. The v~sua l estlrnatlon mt.rhod was aiiiirare for trees with very large fruit, bu t t . xh~b~ te i l h ~ g h ~nterobservrr va r~~ ib~ l i t !
Key zc,o&: DBH: croufn zjoiiime:.fvtiil nblindrrnt-r: i i ; t . t b~$~/ ' i~~) : twe i/ia)12ater:trop~t.al triei; LJgnndtr
THEQUANTIFICATION OF FRUIT AVAILABILITY has been
a primary objective in many studies which focus on
the ecology of tropical fruiting trees and/or their
frugivore consumers (Leighton 8: Leighton 1982,
Terborgh 1981, Chapman 1990, Leighton, in press).
Such estimates are often related to the behavior of
the frugivores (Clutton-Brock 1977, Raemakers
1980, Chapman & Lefebvre 199O), or used to
examine interannual variability in the production of
fruit (Milton et al. 1982). Although a variety of
methods have been used to estimate fruit abun-
dance, differences in the accuracy and precision of
the different methods have rarely been quantified.
Consequently, it is difficult to state the extent to
which different methodologies contribute to varia-
tion among studies as opposed to other factors of
biological significance, such as differences between
species, habitats, or seasons. In addition, there are
few guidelines available to indicate which proce-
dures are most appropriate in different situations
(see Peters et a / . 1988).
Tlie objective of this study was to examine the
applicability of three methods for estimating fruit
number and biomass for different species of rain
forest trees in the Kibale Forest Reserve, Uganda.
For all tree species, we docun~ented the relationships
between three different estimates of fruit abundance,
and the degree of variation benveen observers. In
addition, for two tree species we determined the
accuraq of the different methods of estimating fruit
number and biomass.
METHODS
TREESPECIES~xAhrrs~u.-Tree species were selected
so that each of the different methods are more
suitable for one of the species than were the other
methods. Ptetygata ~~zildbraedii (F. Sterculiaceae)
has large fruits, rendering it most suitable for visual
counts. However, the trunk of this species is highly
buttressed (up to 5 m in length at ground level, or
1 .2 nl in length at 1.2 n~ above the ground), which
produces problenls in measuring DBH. In addition.
Ptelygota is a tall emergent tree which increases the
accepteij 20 jCin-diffic~~ltyof producing an accurate estimation of
uary 1992 crown volume. Fii .~s exasperafa (F. hforaceae) has
527
1 ~ ~ 2 8 ~ ~ ~1 9 91, t i , ~~ ~ ~ ~ d ~ ~ ~

528 Chapman, Chapman, Wangham, Hunt, Gebo, and Gardner
an irregular trunk that can be highly buttressed,
making measurements of DBH difficult. In addi- -tion, it has small fruits which are green when unripe
and are thus somewhat difficult to see when making
visual counts. Therefore crown volume would ap-
pear most appropriate for this species. Conopbayn-
gin holstii (F. Apocynaceae) and Uvariopsis congen-
sis (F. Annonaceae) should be suitable for all
methods. In particular, C. holstii harbors large, clearly
visible fruits, increasing the accuracy of visual counts.
Uvariopsis seems to be the most suitable tree for
measurement of DBH, since it seldom has more
than one trunk and has no buttresses.
U. congensis is a common understory tree in
Kibale ores st that may reach up to 20 m in height.
Mature fruits average 3 cm in length (but range
from 1.5 to 5 cm, SD = 4.2, N = 30) and contain
between 2 and 7 seeds (mean = 4.5, SD = 1.36,
N = 30). The fruit turns from greeen to red during
ripening. C. holstii is a understory tree that reaches
a height of 10-1 5 m and bears large green drupes
(mean length = 8.7 cm, SD = 1.1, N = 19; mean
width = 7.8 cm, SD = 0.95, N = 19). Pteygota
mildbraedii is a large forest tree that reaches a height
of 50 m, and often has a round, relatively small
crown. Its fruits are elliptical in shape, approxi-
mately 11.0 cm long (SD = 1.3, N = 15) and
,
10.0 cm wide (SD = 1.6, N = 15). Each fruit
contains many winged seeds (mean number of seeds
per fruit = 38.9, SD = 7.8, N = 15) that average
6.5 cm in length (SD = 1.1, N = 30). Ficus
exasperata is a mid-sized tree and its fruits are
axillary, solitary, or paired and are 1.5 cm in di-
ameter (SD = 0.38, N = 30) and weigh an average
of 1.8 g when ripe (SD = 1.00, N = 30).
ESTIMATINGFRUIT ABUNDANCE.-Four methods were
used to estimate the numbers of biomass of fruit
on trees.
Diameter at Breast Height. Diameter of the tree
at breast height (DBH) is an indicator of tree size,
which is assumed to reflect the tree's ability to
produce fruit (Leighton & Leighton 1982; Peters
et al. 1988; Chapman 1989, 1990). DBH was
measured 1.2 m from the ground (if the tree was
on a slope its height was measured on the uphill
side). Trees with buttresses represent a difficulty,
since the buttress increases the diameter at the base,
but this inflated diameter is unlikely to reflect the
tree's ability to produce fruit. For trees with but-
tresses, DBH was measured 1.2 m above the ground
and was estimated directly above the buttresses.
Crown Volume. The longest axis of the crown
and the axis perpendicular to this were measured
by stretching a rope, marked off at 1 m intervals,
across the axis at the base of the tree. The height
of the crown was measured using a clinometer and
the shape of the crown was assigned to one of five
categories: hemisphere, sphere, elliptical hemi-
sphere, elliptical sphere, and cone. The appropriate
volumetric formula was used to estimate the volume
of each of these shapes.
Visual Counts. To visually estimate the number
of fruits in a tree, five 1 m i areas of the crown were
selected on an ad libitum basis, and the numbers
of fruits in these estimated areas were counted. An
effort was made to spread the samples throughout
the tree. For hidden areas of the counting unit, the
number of fruits was estimated. Only components
of the tree that normally contain fruit were selected
(e.g., for noncauliflorous trees, tree trunk areas were
not included). A mean of these counts was calculated
and multiplied by the number of counting units
estimated to be in the crown of the tree. The total
number of counting units in the tree was determined
by estimating the number of counting units in one
arm of the tree, and then estimating the total num-
ber of arms in the tree. For every tree, these esti-
mations were done a number of times by each
observer until a consistent number was obtained
(similar sampling procedures were used by Diner-
stein 1986; Leighton, in press). In an effort to de-
crease interobserver variability, we conducted train-
ing trials where observers made estimates of fruit
abundance on a trial tree and subsequently discussed
why the estimates were not the same. Generally, it
took approximately five minutes to make a visual
estimate. However, for large trees where the canopy
was obscured by understory trees, estimates could
take longer.
For each of these three techniques, four ob-
servers independently made estimates, and we pres-
ent the mean, range, and standard error of these
estimates.
Fruit Removal from Focal Trees. Over the past
three years vigils have been maintained at fruiting
fig trees as part of a long-term study of plant-
frugivore interactions and seed dispersal in the Ki-
bale Forest. For focal trees reported here, vigils
began as fruit began to ripen and ended when fru-
givores ceased visiting. DBH was measured and
crown volume was estimated by calculating volume
assuming a spherical shape for each of these focal
trees.
The total number of fruits removed by frugi-
vores was estimated as follows (for details see
Wrangham et al., in press). The number of fruits
eaten by a frugivore were counted for a 1 min period

Estimators of Fruit Abundance 529
TABLE 1. Correiirtion between actnal b i o m n ~ ~ irtof the frnit produl-ed b) a tree, as detertntned froirom pic-Ring the friitt une period of tttne nnd estilnirted fruit c-rup Jtze. Croufn voliltne z i n ~ c-iririiiirted nJJurntng the shirpe of the crown urnJ a sphere (Volttt~re Sphere) and assigning the I-ruzi 11 to one ofthe dtjerent shapes (Vuinme Shape).
Fruit zi eight ufas log trirn~jirfned.
Species
U V N Y ~ O ~ J ~ Jc-ungensis
DBH Volume Sphere Volume Shape V~sual Estimate
Conophntyngin hoistii
DBH Volume Sphere Volume Shape Visual Estlmate
Myrtnnthns arborens
DBH Volume Sphere Volume Shape Visual Estimate
Rothmirnia nri-eiiij;mts
DBH Volume Sphere Volume Shape Visual Estimate
Biomass
j2 Probability
Number
Sample Sample s i ~ e r' Probab~l l r~ sue
iting the tree although the trees typically still con-
tamed some fruit. Fruit weight for a tree was
estimated from a regression of fruit diameter and
weight derived from subsequently collected data.
MEASIJRE A(.TUAI. FRUIT X[JMBI:R A N D B I O A ~ A S S01
THROUGH FKIJIT FEI.I.ING.-For two species of trees,
U ~ ' a ~ i o p ~ z . r es-congensis and Conophatyngia ho l~- t i i .
timates of fruit production were made by measuring
DBH, by measuring crown volume, and by the
visual estimate, after which the entire fruit crop was
collected, counted, and weighed. Ground vegetation
surrounding the tree was cleared, fallen fruit were
removed, and fruits were hand picked or knocked
out of the tree using a long pole. The total fruit
crop was weighed to calculate total fruit biomass.
STATISTI(.ALANAI.YSLS.-To determine the accuracy
of the different estimators, mean values for each
estimate were determined for each tree and corre-
lated to the actual biomass determined from picking
and weighing the fruits on the tree. For the species
observed as focal trees, the crop size, determined
from the observation of frugivores and from fallen
fruit, was correlated with DBH, crown volume, and
visual estimates. Fruit biomass was log transformed
whenever a focal animal was visible (= feeding rate).
The number of individuals in the tree and the num-
ber of these animals that were feeding were deter-
mined every 1 5 min, allowing a calculation of the
percentage of time spent feeding for each individual
and the number of animals feeding. The product
of the feeding rate, number of individuals of each
species feeding, and the amount of time spent feed-
ing, is an estimate of the number of fruits eaten by
each species. The sum of these figures over all species
and over the entire fruiting period provided an es-
timate of the number of fruits eaten by frugivores.
The number of fruits that were not consumed and
fell to the ground was estimated by collecting fru~ts
along two perpendicular transects below the tree on
a daily basis. To estimate the number of fruits falling
to the ground per day, this number was multiplied
by the proportion of the tree shadow that was en-
compassed by the transects. The sum of estimated
fruits eaten and estimated fruits falling over the
fruiting period was used to estimate the number of
fruits produced during the fruiting season. This
method cannot account for nocturnal fruit removal,
but qualitative observations suggest that nocturnal
fruit removal is low in K~bale. In addition, obser-
vations were stopped when frugivores stopped vis-
530 Chapman, Chapman, Wangham, Hunt, Gebo, and Gardner
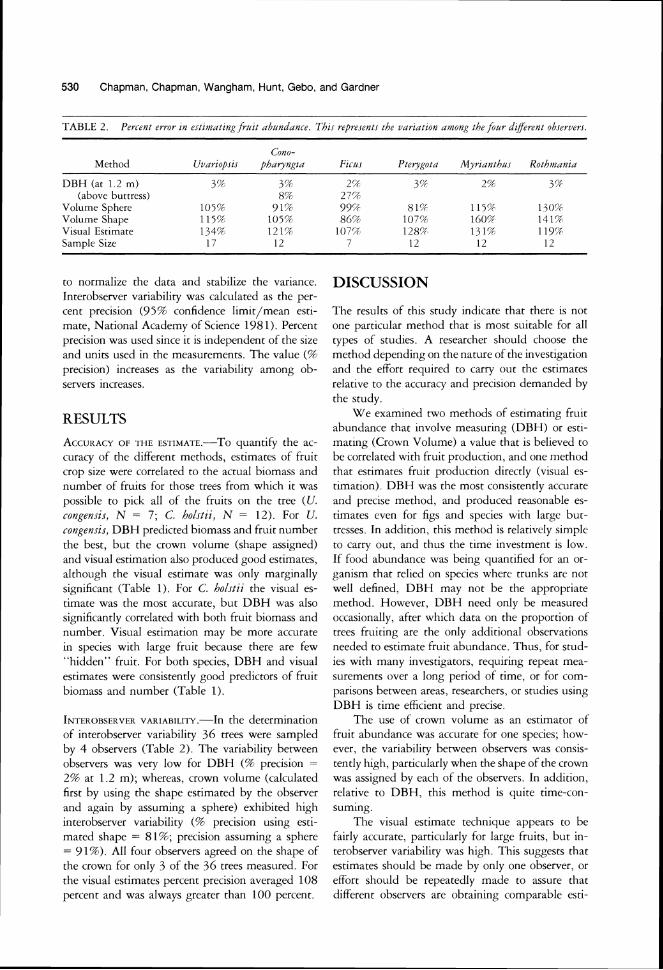
TABLE 2 . Peri-ent error In e~timnttng frttit abl~ndirni-e. Tht i repre~ents the virriattun amunfi the fottr dijerent ubiervers.
Cono-Method U ~ a r i u p ~ t ~ phntynfi~ir
DBH (at 1 2 m) 3% 37 (above buttress) 8%
Volume Sphere 105% 91% Volume Shape 11557 105% V~sual Est~mate 134% 121% Sample S~ze 17 12
to normalize the data and stabilize the variance.
Interobserver variability was calculated as the per-
cent precision (95% confidence I~mit/mean esti-
mate, National Academy of Science 198 1). Percent
precision was used since it is independent of the size
and units used in the measurements. The value (%
precision) increases as the variability among ob-
servers Increases.
RESULTS
A ~ ~ U R A C YOF THE ESTIMATE.-To quantify the ac-
curacy of the different methods, estimates of fruit
croD size were correlated to the actual biomass and
number of fruits for those trees from which it was
possible to pick all of the fruits on the tree (U.
congensis, N = 7 ; C, holstii, N = 12). For U.
congensis, DBH predicted biomass and fruit number
the best, but the crown volume (shape assigned)
and visual est~mation also produced good estimates,
although the visual estimate was only marginally
significant (Table 1). For C. holstii the visual es-
timate was the most accurate, but DBH was also
significantly correlated with both fruit biomass and
number. Visual estimation mav be more accurate
in species with large fruit because there are few
"hidden" fruit. For both species, DBH and visual
estimates were consistently good predictors of fruit
biomass and number (Table 1).
INTEROBSERVER the determination VARIABILITY.-I~
of interobserver variability 36 trees were sampled
by 4 observers (Table 2). The variability between
observers was very low for DBH (9F precision =
29F at 1.2 m); whereas, crown volume (calculated
first by using the shape estimated by the observer
and again by assuming a sphere) exhibited high
interobserver variability (% precision using esti-
mated shape = 81%; precision assuming a sphere
= 91%). All four observers agreed on the shape of
the crown for only 3 of the 36 trees measured. For
the visual estimates percent precision averaged 108
percent and was always greater than 100 percent.
Fii-u~ Pterygotir Myrianthr~s Rothjnirnia
2% 3% 257 3'4
27%
99'f 81% 115% 13O(4
86(f ~O 'Q 160% 1414 O'?1 128?4 l 3 l P 119r?
7 12 12 12
DISCUSSION
The results of this study Indicate that there is not
one particular method that is most suitable for all
types of studies. A researcher should choose the
method depending on the nature of the invest~gation
and the effort required to carry out the estimates
relative to the accuracy and precision demanded by
the study.
W e examined two methods of estimating fruit
abundance that lnvolve measuring (DBH) or esti-
mating (Crown Volume) a value that is believed to
be correlated w ~ t h fruit production, and one method
that estimates f r u ~ t production directly (visual es-
timation). DBH was the most consistently accurate
and preclse method, and produced reasonable es-
timates even for figs and species with large but-
tresses. In addition, this method is relat~vely simple
to carry out, and thus the time investment is low.
If food abundance was being quantified for an or-
ganism that relied on species where trunks are not
well defined, DBH may not be the appropriate
method. However, DBH need only be measureci
occasionally, after which data on the proportion of
trees fruiting are the only additional observations
needed to estimate fruit abundance. T ~ L L S , for stud-
ies with many investigators, requiring repeat mea-
surements over a long period of time, or for com-
parisons between areas, researchers, or studies using
DBH is time efficient and precise.
The use of crown volume as an estimator of
fruit abundance was accurate for one species; how-
ever, the variability between observers was consis-
tently high, particularly when the shape of the crown
was assigned by each of the observers. In addition,
relative to DBH, this method is quite time-con-
suming.
The visual estimate technique appears to be
fairly accurate, particularly for large fruits, but in-
terobserver variability was high. This suggests that
estimates should be made by only one observer, or
effort should be repeatedly made to assure that
different observers are obtaining comparable esti-

Estimators of Fruit Abundance 531
mates. This method is very demanding of energy kg; 1988, 56 kg; 1989, 472 kg). If a study de-
and time, thus it may not be appropriate if a large mands assessment of such variation in fruit crop
number of trees must repeatedly be sampled. How- over time or between trees of the same size in dif- ever, this is the only method that can measure the ferent areas, the visual estimate is appropriate.
variability in crop size of a single tree over different
fruiting periods. While conducting focal tree ob- ACKNOWLEDGMENTS
servations in Kibale Forest, the same individual tree
was occasionally sampled in consecutive years. Re- The authors would like to thank T . Lawrence, A. P. Clark,
sults indicated that there can be marked differences J . Obua, G . Etot, and the Ugandan field assistants for help in the field. T h ~ s research was supervised and en-
in the amount of fruit produced by a single tree couraged by the Office of the President, Uganda, the during different fruiting bouts. For example, one National Research Councll, and the Ugandan Forest De-
Ficus bracbylepis tree produced 30,480 fruits in partment. Research was financially supported by NSF,
1987, 7399 figs when it fruited in 1988, and 12,494 National Geographic, and MacArthur Foundation Grants. W e would like to thank M. Le~ghton, K. Fischer, E. R .
figs in 1989. In addition, in 1988, the year with He~thaus, T . Laman, S. Zens, C. Cannon, and D . Law-
the fewest fruits, the size of the figs were small, rence for helpful comments on an earlier version of t h ~ s thus interannual differences in fruit biomass are even manuscript.
more pronounced than fruit number (1987, 1146
LITERATURE CITED
C. A.CHAPMAN, 1989. Ecological constraints on group slze In three species of neotroplcal primates. Fol~a Primatol. 55: 1-9. . 1990. Association patterns of male and female spider monkeys: the Influence of ecology and sex on social organization. Behav Ecol. Sociobiol. 26: 409-414. , AND L. LEFEBVRE. 1990. Manipulat~ng foraging group size: Spider monkey food calls at frultlng trees. Anim. Behav. 39. 89 1-896.
CLUTTON-BROCK,T. T . 1977. Some aspects of intraspecific variation in feeding and ranglng behavlour In primates In T. H . Clutton-Brock (Ed.), Primate ecology, pp. 539-556. Academ~c Press, London, England.
DINERSTEIN,E. 1986. Reproductive ecology of fruit bats and the seasonality of fruit production in a Costa Rican cloud forest. Biotropica 18: 307-3 18.
LEIGHTON,M. In press. Modeling dlet select~vity by bornean orangutans: evldence for lntegratlon of multiple criteria in f r u ~ t selection. Int. J . Primatol. , AND D . R. LEIGHTON. 1982. The relationship of size and feedlng aggregate to slze of food patch: Howler monkey Aiouirtta pcriiiatir feeding in Trii-hdzn 1-ipo trees on Barro Colorado Island. Biotropica 14: 8 1-90.
MILTON,K., D . M. WINDSOR, AND A. M. ESTRIBI. 1982.D . W . MORRISON, Fruiting phenologies of two neotropical Ficus species. Ecology 63: 752-762.
NATIONAL COUNCIL. 198 1. RESEARCH Techniques for the study of prlmate populat~on ecology. National Academy Press, Washington, D.C.
PETERS,R., S. CLOUTIER, P. HASTINGS, & B. SAWER-FONER. 1988. The ecology of D . DUBE, A. EVANS, D . KOI-IN, the weight of fruit on trees and shrubs In Barbados. Oecologia 74: 612-616.
RAEMAKERS,J. 1980. Causes of variation between months in the distance travelled dally by gibbons. Folla Primatol. 34: 46-60.
TERBORGH, 1983. Five New World primates. Princeton University Press, Princeton, New Jersey. J . WRANGHAM,R., N . L. CONKLIN, G . ETOT, J AND A. P. CLARK. In press. OBUA,K. D. HUNT, M. D . HAUSER, The
value of figs to chimpanzees. Int. J . Primatol.