estimation of wear depth as an approach to predict tool
TRANSCRIPT

Diyala Diyala Journal of Engineering Sciences Vol. 12, No. 02, June 2019, pages 13-34 ISSN 1999-8716 DOI: 10.26367/DJES/VOL.12/NO.2/2 eISSN 2616-6909
13
Estimation of Wear Depth as an Approach to Predict Tool Service Life in Cold Forming Process
Lutfi Y. Zaidan 1, Akram Mahdi Abd 1, Mohsin A. AlShammari 2, 1 Department of Mechanical Engineering, College of Engineering, University of Diyala
2 Department of Mechanical Engineering, College of Engineering, University of Baghdad email address: [email protected]
Abstract
Wear phenomenon is considered as a predominant parameter in the forming processes causing the shorten tool life which in turn increases the production costs. In this study, wear depth of tool components for multi-stages of metal shell of spark plug (MSSP) manufacturing was analyzed using Archard's model with FE simulation software. The 3D geometry models were built using SolidWorks software then the models files were exported to Simufact forming software to do the settings of preprocess and FE analysis. The cylinder compression test and ring compression test were executed to get the flow stress and frictional factor respectively. Product parts dimensions, forging loads, effective stress, relative sliding velocity and contact pressure were solved and discussed. Subsequently to verify the analysis acceptance, the actual product parts measurements which obtained by coordinate measuring machine (CMM), were compared with the simulation results. It was found that the deviations of actual MSSP geometry dimensions less than (4%). Also verification is performed to forging loads at each stage which gives a good agreement between actual and FE simulation results. Finally, the wear depth of tool components were calculated for each stage using the FE software. Based on the results of wear depth from simulation and tolerance rages of actual product parts, tool service lives were predicted to find the productivities for each tool component. The results of FE simulation were compared with the CMM measurements for known productivities tool components from actual production line, which gives a good accuracy and acceptable agreement.
Keywords: Wear model, Metal forming, Cold forging, Finite element analysis Simufactforming software.
Paper History: (Received: 29/10/2017; Accepted: 15/1/2018) 1. Introduction
The most important parameters in metal forming industries are product quality, productivity and production cost, which are related with tool performance and tool service life. Cold forging processes, especially forward and backward extrusion are specified by high sliding velocities and temperature generation and very high normal
pressures arise at the corner radii of die where a large reduction in area of the workpiece occurs. Wear is considered as the primary failure mode in this operation. The dies have to be removed from service and scrapped once the produced parts either: are out of dimensional tolerance, sticks to the dies or exhibits poor surface finish [1]. To derive the wear equation and to determine the effects of processing parameters on wear of the metal, Archard's model suggests that the wear volume generated over a sliding distance is related to the contact area and normal pressure. Many studies, adopted FE analysis, studied die wear in forming process and discussed friction mechanisms during metal forming and the effects of lubricating conditions on die wear and die life. G. A. Lee and Y. T. Im, (1999) [2] calculated the wear profile in die of upsetting process execute Archard’s model using a rigid thermo visco-plastic FE software for metal forming. Simulation results obtained were agree well with the experimental results available in the literature. R.S. Lee and J.L. Jou, (2003) [3] presented a study of numerical simulation method (DEFORM code) combine with Archard wear model to analyze the warm forging of automotive transmission outer race and the predicted results of the die wear conditions were obtained. H.C. Lee, et al, (2008) [4] presented a study using an integrated model to predict tool life in the cold forming process depending on wear and fatigue. Archard’s wear model was adopted to calculate the wear amount as an incremental form and executed by the FE code. B. Santosh, et al., (2014) [5] suggested a approach to estimate the die service life in hot forming using plastic deformation and abrasive wear. It was concluded that the increasing of forming velocity led to decreasing in the die service life caused by abrasive wear. R. Iamtanomchai and S. Bland, (2015) [6] Developed and validated a FE model for forming process in a particular automotive product. Based on the critical wear depth, the life of the upper and lower dies were calculated. As a result, it was found that the die life can be increased as two times by choosing optimal process conditions and material hardening. S. Y. Hsia and P. Y. Shih, (2015)[7] used FEA (DEFORM-3D) based on actual cold forming process conditions to establish wear simulation for automotive repair fastener producing dies. The wear regions of the die were predicted using the obtained stress levels substituted into the Archard wear model. J. H. Noh and B. B. Hwang, (2015)[8] examined the
Diyala Diyala Journal of Engineering Sciences Vol. 12, No. 02, June 2019, pages 13-34 ISSN 1999-8716 DOI: 10.26367/DJES/VOL.12/NO.2/2 eISSN 2616-6909
14
geometrical parameters of double cup extrusion process that influence on the characteristics of tool wear. Two cases of experimental observations were compared with numerical predictions to verify Archard’s wear model in bulk deformation of metal forming processes. It can be established from the results that the wear depth increases as the wall thickness ratio increases and severe wear occurs in regions near the punch or mandrel corner. B. A. Behrens, et al., (2016)[9] presented an optimization of design to increase the efficiency of the bulk metal forming processes taking tool wear prediction into account. Tool wear of the hot forging process was investigated numerically. Liang D., et al., (2016)[10] used FEM as a base to solve tool wear and to investigate the contact.
2. Factors Influencing Tool Life and Wear
In cold forging processes, the process parameters (equipment characteristics, workpiece materials and lubrication), and design parameters (the geometry of die, die material and surface treatments) together determine the tool workpiece interface conditions, which control the die failure mechanisms. In spite of there are more than one type of failure mechanism taking place in die, wear represents the dominant reason for failure in forming process. In some studies, wear is estimated for up to 70% in case of hot forging and about 20% in cold forging of tool failures in production[9]. The both parameters; process and design effect wear in metal forming, which can be categorized as those related to[10] :
• The workpiece (material, geometry, preparation and heating),
• Equipment (contact time and loading conditions), • Dies (material, manufacturing method, heat
treatment, surface finish and coatings), • Lubrication and cooling, and • Process conditions (die temperature, transfer time,
etc.).
The essential task during the die design process is a prediction of the tool wear. The die material selections and lubricant type have a great effect on the condition of die wear, so this must considered to optimize die geometry design practice. Insufficient filling of the die cavity may occur as a result of excessive wear. Forging weaknesses can also be caused by wear that influences the final produced parts and be not within the desired dimensional tolerances. For optimal design, the premature die wear and excessive die surface worn areas should be avoided. By changing the geometry die design, critical worn areas of the die surface can be solved and treated. Also, heat treatment of the die surface and lubricant type and die material selection can be used as a treatments to prevent die wear[11].
3. Analytical Determination of Wear depth in Forming Process
Wear level rely on several variables such as relative velocity, temperature, material, surface roughness, contact pressure, lubrication and sliding length[12]. In metal forming process, wear is extremely difficult to express relationships between its variables and process parameters due to its complexity. Therefore, to improve tools wear resistance, the investigation of wear phenomenon needs to be in detailed formula. Generally, the wear rate can be represented as an equation of normal stress σn, temperature T, relative velocity u, and hardness H which is in turn a function of temperature. The function of wear volume which was suggested by Archard is formulated in differential form:
𝑑𝑉 = 𝑘 %&.%()
(1)
Where V is the wear volume, H is the local hardness, p is the contact load, L is the sliding length, and k is a wear coefficient which changes within the range of 10-2 to 10-7 depending on conditions of sliding contact. Local hardness (H) in the cold forming process was assumed to be constant so it varies only slightly with the temperature rise. In equation (1), the process parameters dV, dp, and dL can be formulated as follows:
𝑑𝑉 = 𝑑𝑍 · 𝑑𝐴𝑑𝑝 = 𝜎0 · 𝑑𝐴𝑑𝐿 = 𝑢 · 𝑑𝑡
(2)
Where σn is the normal stress, dA is the contact area of infinitesimal element, dZ is the depth of wear of infinitesimal element, dL is the sliding length of infinitesimal element, dt is the period of sliding time, and u is the sliding relative velocity. By substituting equations (2) into equation (1) and dividing both sides by dA, equation (1) can be rewritten as the following with r and t represent position and time parameters respectively:
𝑑𝑍 = 𝑘 45(7,9).;(7,9))
𝑑𝑡 (3)
To rewrite Eq. (3) in an integral form, wear depth will be in the following expression:
𝑍(𝑟) = 𝑘 ∫ 45(7,9).;(7,9))
𝑑𝑡9> . (4)
The wear parameters (σn and u) are obtained from rigid–thermo-visco-plastic using FE analysis at discretized nodes on the die surface[13], therefore the wear depth equation can be discretized as follows:
𝑍? = 𝑘∑ ∑ {45(7,9)}?C.{;(7,9)}?C)
∆𝑡E?FG
HCFG (5)
Where M is the total number of time steps, N indicates the total number of nodes at the workpiece/die interface and ∆t is the time step.

Diyala Diyala Journal of Engineering Sciences Vol. 12, No. 02, June 2019, pages 13-34 ISSN 1999-8716 DOI: 10.26367/DJES/VOL.12/NO.2/2 eISSN 2616-6909
15
To compute the normal stress and the relative velocity at the interface of workpiece and dies, it need to transfer the contact data from the workpiece surface to the dies surface. This task execute by finite element method using packaged computerize software. Therefore the following data is required to execute the calculations:
1. The part geometry, 2. The flow stresses in the cavity during the stages
of the forming process and 3. The coefficient of friction at the die/workpiece
interface.
4. Modeling of the Parts
The case study of this work is a manufacturing process of multi-stage cold forming of (MSSP) with six stages . The actual press machine has six-stage closed die. A billet of 17.6 mm diameter and 20.5 mm height is cut by shearing die and transfer to forging stages. The upper punches are used to produce a one piece at the each stage as shown in Fig.1 .
Figure.1: Actual product parts of each stage
In the first stage, upsetting process is used to flat the acute edges of the workpiece ends, then it's turned over by transfer mechanism and moved to the second stage in which forward and backward extrusion process is executed. Upper punch creates the lead hole of depth 2.6 mm at the upper face and hole of φ8.25 mm at bottom face with depth of 5mm. Then the workpiece is moved to the third stage where the backward extrusion continue, a hole of φ15.38 mm at the upper face extended with a stroke of 14.67 mm. The hexagonal portion is formed at this stage at the upper flange surface. Then the part is moved to the fourth stage at which the upper punch carry on the backward extrusion to complete hexagonal flange, and forward extrusion of lower hole to 6.7 mm depth, and moved to the fifth stage where all the external
dimensions are finished and transfer to next step. At the final stage, the internal hole for the finished part will be formed using piercing punch. Fig.2 shows a scheme of six stage manufacturing process for MSSP.
The 3D models of forging die assemblies, punches, and pins for all stages are usually constructed by a computer-aided design (CAD) system using SolidWorks software as shown in Fig.3. Then the files of (.STL) format for all models are exported into a FE simulation system for analysis. Generally, the FE simulation system does not have advanced geometry modeling capacity to model the complex and nonlinear geometries of die components

Diyala Diyala Journal of Engineering Sciences Vol. 12, No. 02, June 2019, pages 13-34 ISSN 1999-8716 DOI: 10.26367/DJES/VOL.12/NO.2/2 eISSN 2616-6909
16
Figure.2: Scheme of forging sequence for MSSP manufacturing
Figure.3: Cross-sections views for process sequence for six stages.
5. Simulation of the Process 5.1. Import Components Geometry
The geometry models of upper die, lower die and workpiece, are imported from SolidWorks software to use in the Simufact.forming program.
An important consideration should be made while importing, that Simufact.forming requires a closed volume surface model for both workpiece and dies. The surfaces of components models are meshed with triangular elements shaped facets only as shown in Fig.4.
Insert (core1) of stage 3 Punch of stage 3
Figure 4: Samples of die components with facet mesh by Simufact.forming for third stage
In Simufact.forming, forging operation direction is aligned on the Z-axis. So these models are firstly aligned as in Table.1.
Table .1:The position of punch and elements of die, their direction is aligned on the Z-axis
Stage No. Stroke end of punch (mm) Position of Pin (mm) Position of stripper (mm)
Stage 1 5.81 25.15 -- Stage 2 9.27 25.31 31.38 Stage 3 14.67 24.30 3.97 Stage 4 25.36 30.47 39 Stage 5 28.11 31.16 39 Stage 6 32.5 -- --
Once the objects are aligned along the Z-axis,
user can drop the workpiece in place and position the dies against the workpiece in initial contact by using Positioning option. For example, the alignment of
the dies and the workpiece and initial position of third stage is shown in Fig.5:

Diyala Diyala Journal of Engineering Sciences Vol. 12, No. 02, June 2019, pages 13-34 ISSN 1999-8716 DOI: 10.26367/DJES/VOL.12/NO.2/2 eISSN 2616-6909
17
Figure 5. Cross section of alignment the die components for third stage
5.2. Forging Machine Database
The machines that perform the forming processes are inserted in software. Simufact software has six different types of forming machine that any of them can be used for forming process simulation. The
actual machine which is used in this study is a Crank press forging machine. The required data of this machine is entered and these data are listed in Table.2.
Table 2: Required Data of Actual Forming Machine Parameter Value
Type of Forming Machine Crank Press
Crank Radius (R) mm 330
Length Connecting Rod (L)mm 1000
Revelation velocity (rpm) 60
5.3. Mechanical Properties of Workpiece and Tool Materials
The mechanical properties and characteristics of material of the workpiece and tools that were used in
FE simulation of forming process of MSSP are shown in Table.3.
Table.3: Mechanical properties of materials for workpiece and tools
Components Forming Properties
Material Standard
Mesh type for FEA Hardness
Workpiece Elastic-plastic AISI 1010 Hexahedral
element HRC38
Upper punch Rigid SKH55 Facet mesh HRC66
Lower punch (Pin) Rigid SKH55 Facet mesh HRC66
Die inserts (core) Rigid Tungsten Carbide (WC)
Facet mesh HRC77

Diyala Diyala Journal of Engineering Sciences Vol. 12, No. 02, June 2019, pages 13-34 ISSN 1999-8716 DOI: 10.26367/DJES/VOL.12/NO.2/2 eISSN 2616-6909
18
6. Experimental Work 6.1 Determination of Flow Stresses in Forming
Process
To determine the flow stress data (true stress and true strain), compression test is used for metals at various strain rates and temperatures. This test execute on a flat platens cylindrical sample are up held at the same temperature to avoid die chilling effect on metal flow. In order to execute this test without corrections or errors, cylindrical sample should be upset without any barreling. From compression test information the flow stress is calculated at each stage of deformation or for increasing strain. The engineering stress-strain relations(𝜎I =
JKL
and 𝜖I =(LN((L
) are used and then applied the true stress-true strain equations as:
𝜎O =JK= 𝜎I(1 − 𝜖I (6)
𝜖O = − ln T ((LU = −ln(1 − 𝜖I) (7)
where 𝜎𝑇 is true stress and 𝜖𝑇 is true strain.
The samples of cylindrical shape are manufactured from the same material of workpiece which is (AISI 1010) with standard dimensions of diameter to height ratio of 2:3 (i.e. diameter of 16 mm and height of 24 mm) using turning machine. The test was executed in the laboratory using a universal hydraulic testing machine of 100-ton, as shown in Fig.6. at the first, the samples must be prepared and cleaned from any rust or sharp edges, also clean the upper and lower flat faces of the universal testing machine which must be smooth. The test starts with adjust the upper moved side of the testing machine to targeted height. In current test, it will be used four reduction percentages (20%, 40%, 50% and 60% ) as targeted heights as shown in Fig.7. The test performed at room temperature (20ºC) .
Figure 6 : 100-ton universal hydraulic testing machine
Using different percentage in height reduction are necessary to find the true stress-stain curve with considerable accuracy. Load and displacement (or stress and strain) data which record in computer
memory are read and applied the equations which were derived in (Eq. 6 and Eq. 7) to calculate the true stress-true strain curve.
Figure.7 : Compression test of compressed cylindrical samples at 20%, 40%, 50% and 60% reductions.

Diyala Diyala Journal of Engineering Sciences Vol. 12, No. 02, June 2019, pages 13-34 ISSN 1999-8716 DOI: 10.26367/DJES/VOL.12/NO.2/2 eISSN 2616-6909
19
The flow stress with power law can be obtained with statistical regression calculations which is expressed as σ =759ε0.24. Fig.8 shows the flow stress
curve fitting and experimental result of the AISI 1010 material.
Fig.8: Experimental and curve fitting flow stress curve of AISI 1010
6.2 Ring Compression Test and Friction Factor
Calibration Curves
The main purpose of this test is to determine the coefficient of friction (µ) and shear friction factor (m) between the workpiece and tools. These two values (µ, m) depend on the lubrication type, experimental results of this test and friction calibration curves. The samples of ring compression test have the standard dimensions which include external diameter to internal diameter to height as ( 6:3:2). So the actual size of the external diameter was
(15 mm), internal diameter (7.5 mm) and height (5 mm). In order to achieve the compression test as closest to the actual situation, it will be performed with and without lubrication at room temperature. Firstly, the ring sample is put on the lower fixed block and adjust the upper block to make contact with the ring. The machine begins the test by upsetting the specimen at reduction height ratios of 10%, 20%, 30%, 40% , 50%and 60% as shown in Fig.9.
Figure.9: Compression ring test samples at 10%, 20%, 30%, 40% and 50% and 60% reductions
Because of the internal circumference of the ring specimen is not exactly circle, the internal diameters of the ring face are measured at different angles. The calibration curves are represented as the relation between the internal diameter reduction ratios and the height reduction ratios. Therefore, to find the actual coefficient of friction factor (m) of the workpiece material, the reduction ratio in internal diameter is needed to be calculated at each corresponding height
reduction ratio. Then from the points of actual data on the chart of calibration curves, the experimental curve of the coefficient of friction factor can be found. As a results of actual tests on workpiece of AISI 1010 , it is found that the coefficient of friction factor is about 0.12 as shown in Fig10, which can be used in Simufact.forming software as required input data for friction conditions.
0
100
200
300
400
500
600
700
800
900
1000
0 0.5 1 1.5 2
True
Str
ess M
Pa
True strain %
Curve Fitting
Experimental
D= 16 mm H= 24 mmσ =759 ε0.24

Diyala Diyala Journal of Engineering Sciences Vol. 12, No. 02, June 2019, pages 13-34 ISSN 1999-8716 DOI: 10.26367/DJES/VOL.12/NO.2/2 eISSN 2616-6909
20
Fig. 10: Friction factor calibration curve with experiment
6.3. Using Coordinate Measuring Machine (CMM)
To compare the actual dimensions of all parts in experimental work with the results of simulation analysis that execute by Simufact.forming software, high accuracy measurement means should be used. Therefore all the measurements have been done in laboratories of Al-Fedaa Company using Coordinate Measuring Machine (CMM) of model PC-DMIS as
shown in Fig.11. This model is adapted with Windows environment of a full-featured and geometric measurement package. In addition, CMM has an ability of transfer objects pictures to 3D sketches that can be used in software packages for designing and analyzing, such as CAD or SolidWorks software.
Figure 11: Coordinate Measuring Machine
m=0
m=0
m=0.1
m=0.2
m=0.3
m=0.4m=0.5m=0.6m=0.7m=0.8m=0.9m=1
-80
-60
-40
-20
0
20
40
60
80
100
0 20 40 60 80
Redu
ctio
n of
inte
rnal
dia
met
er ∆
Di/D
i %
Reduction of hight ∆H/H%
Friction Calibration Curaves(shear friction factor m)
m=0
m=0.1
m=0.2
m=0.3
m=0.4
m=0.5
m=0.6
m=0.7
m=0.8
m=0.9
m=1
Exp

Diyala Diyala Journal of Engineering Sciences Vol. 12, No. 02, June 2019, pages 13-34 ISSN 1999-8716 DOI: 10.26367/DJES/VOL.12/NO.2/2 eISSN 2616-6909
21
7. Results and Discussion 7.1. Analysis of Workpiece Dimensions
Depending on the original documents of production and measurements of actual parts produced in each stage of production, all the essential dimensions are measured and listed in Table.4. The results of the finite element simulation are compared
with actual results such that the part dimensions of each forming stage in FE simulation are listed opposite the actual dimensions. The deviations of the FE results from actual dimensions was calculated and listed as below: 𝐷𝑒𝑣𝑖𝑎𝑡𝑖𝑜𝑛% = _K`9;ab%?cd0e?f0NJI%?cd0e?f0
K`9;ab%?cd0e?f0_ * 100%
Table.4: The essential dimensions of actual and FE simulation results for the first three stages of part product. Stage No. Model Dim Actual
(mm) FE
(mm) Deviation %
First stage
D 18.35 18.33 0.109
L 20.15 20.17 0.13
Second Stage
D1 18.5 18.48 0.097
D2 12.91 12.89 0.14
L1 24.75 23.93 3.31
L2 2.6 2.525 2.96
L3 5 4.95 1
Third stage
D1 20.5 20.5 0
D2 18.65 18.47 0.94
D3 12.97 12.94 0.18
D4 19.8 19.78 0.07
L1 28 27.79 0.73
L2 17 16.3 4.1
The deviation are attributed to many reasons. For
example, the small size of the upper and lower sharp edges of the part cause large deviation as in L1 and L2 in second stage or L2 in third stage, while in first
stage there is trivial deviation in dimensions due to there is no edges of small size in this stage as shown in Fig.12.

Diyala Diyala Journal of Engineering Sciences Vol. 12, No. 02, June 2019, pages 13-34 ISSN 1999-8716 DOI: 10.26367/DJES/VOL.12/NO.2/2 eISSN 2616-6909
22
Figure.12: Effect of element size on the final part dimensions in small edges in third stage
When the thickness of the edge is less than the width of three adjusting elements, this edge will be vanished with progress of forming process in FE simulation. Therefore the error is always occurs in case of small thickness dimensions. In order to avoid this error, the element size must be as small as possible on the other hand, the computer solving time will increase . 7.2. Load and Stroke Analysis for Each Stage
The analyzing of load during forging process is considered as an important task in the design steps. The intermediate stages usually depend on the experiences of designer and operator to determine
stroke length. So using FE simulations in this task is considered as a powerful tool to achieve the desired design.
In present study, The results of forging loads analysis which were obtained by Simufact.forming for each of the six stages are arranged as shown in diagram of Fig.13. This diagram illustrates the relation between forming loads (force in Z-direction) and the stroke, also the maximum load values are indicated for each stages. Generally, the whole forging load for product part from the first to the final stages was about 1883 kN.
Figure.13: Load distribution for the six stages of FE simulation by Simufact.forming
To verify the FE results, the actual operation at
forming machine has a monitor in control board which displays the values of the operation load for each stage of forming process. From the observing of this monitor for different production situations, it's found that the values of forging load are fluctuated
around 10% increasing and decreasing. Actual values of forging load and FE simulation are listed together as illustrated in Table.5. Good agreement between the actual and FE results can be seen, which promote the analysis of current study.
0
100
200
300
400
500
600
700
0.00 20.00 40.00 60.00 80.00 100.00
Z-Fo
rce
-kN
Stroke - mm
stage1140 kN
stage2411 kN
stage3642 kN
stage4490 kN
stage5160 kN
stage640 kN

Diyala Diyala Journal of Engineering Sciences Vol. 12, No. 02, June 2019, pages 13-34 ISSN 1999-8716 DOI: 10.26367/DJES/VOL.12/NO.2/2 eISSN 2616-6909
23
Table.5: FE simulation and actual load for six stages of part production
Stage No. FE Load kN
Actual Load kN
Max. Stroke mm
Stage 1 140 125-150 4.26
Stage 2 411 400-450 7.48
Stage 3 642 600-650 13.55
Stage 4 490 450-500 27.29
Stage 5 160 150-175 24.76
Stage 6 40 40-50 15.34
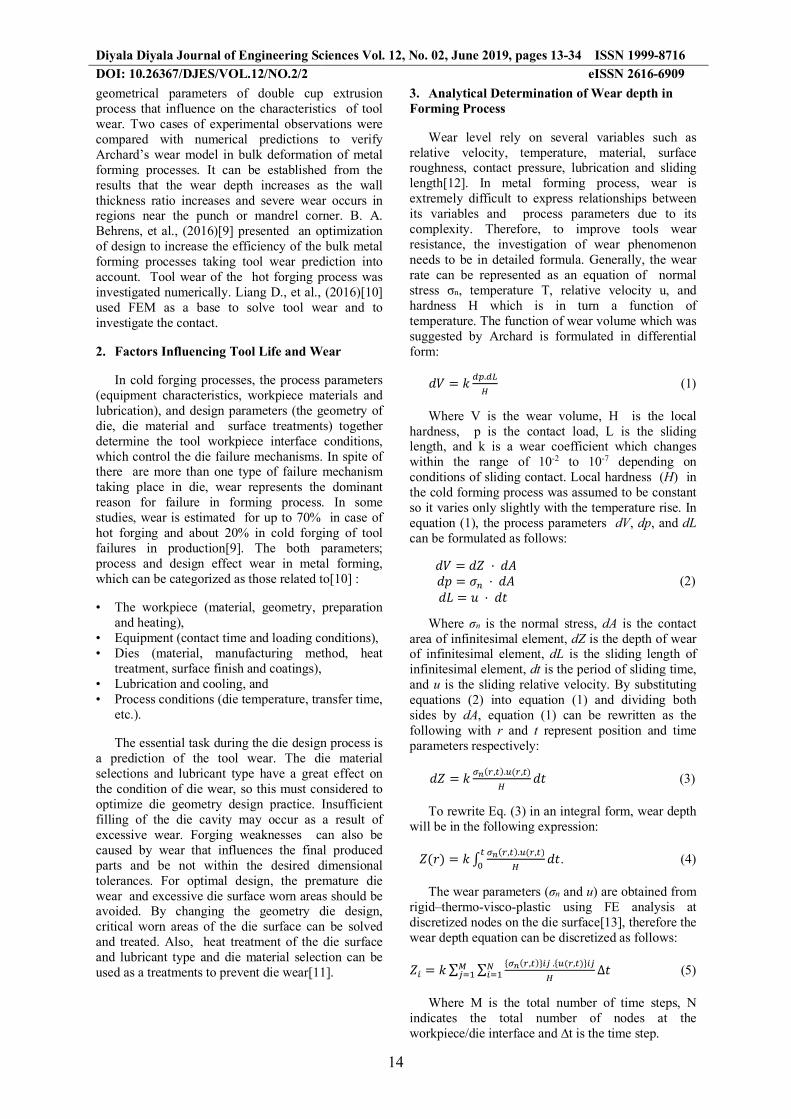
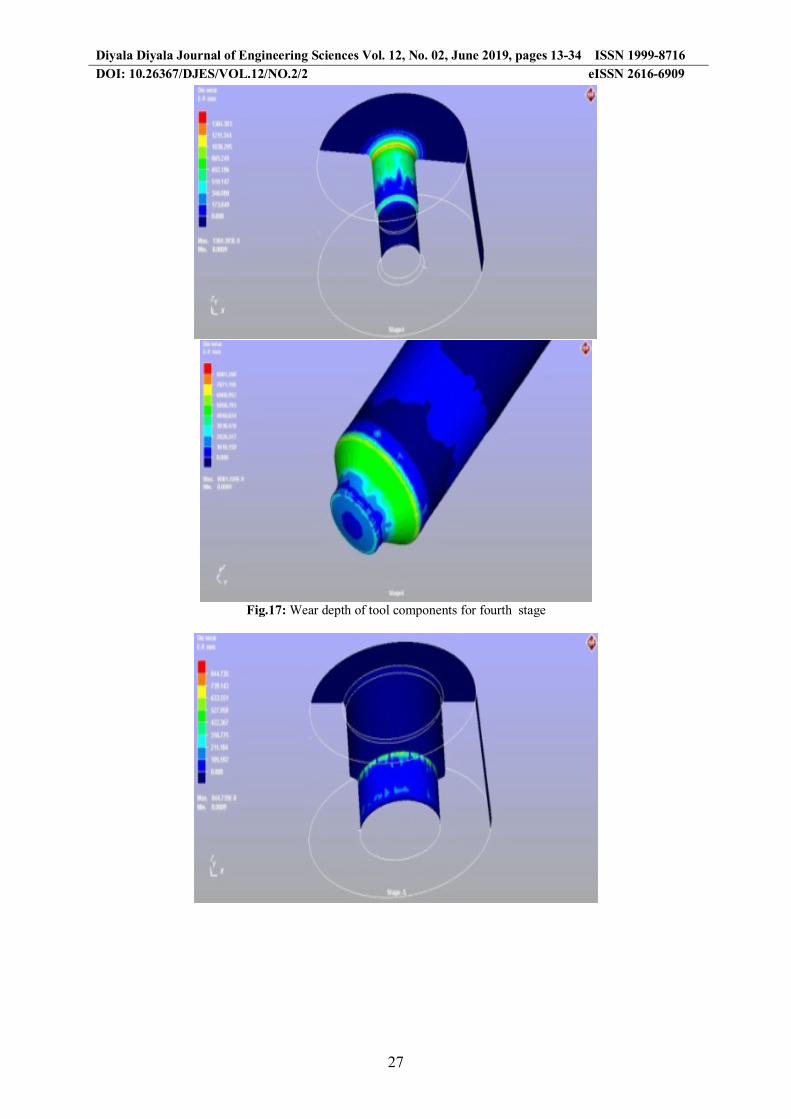
7.3. Wear Analysis for Tool Components
Wear depth of selected tool components (core1, core2 and punch) for each stage will be represented in this section with analysis for each situation. The figures from Fig.14 to Fig.19 are shown the distributions of wear depth regions in selected tool components for first to sixth stages. It is noted that the wear depth is excessive in specified areas more than another such as in the round edges of die inserts (core1 and core2) and nose and shoulder of the punches. The concentration of wear depth specified regions is attributed to the combined effects of contact pressure and relative sliding velocity. So, for
any tool component, if the contact pressure is of high value with trivial value of sliding velocity, the wear depth will be insignificant value. For example the punch of first stage, the contact pressure was of 1314 MPa with slight sliding velocity (34.5 mm/s), so it is noted that the wear depth was of insignificant affect. In the other hand , when the maximum values of contact pressure and sliding velocity are combined together then the wear depth will be of maximum value as in the punches of third, fourth and fifth stages. Also, it can be concluded that the higher geometric complexity the higher wear depth as in intermediate stages (third and fourth).

Diyala Diyala Journal of Engineering Sciences Vol. 12, No. 02, June 2019, pages 13-34 ISSN 1999-8716 DOI: 10.26367/DJES/VOL.12/NO.2/2 eISSN 2616-6909
24
Figure.14: Wear depth of tool components for first stage

Diyala Diyala Journal of Engineering Sciences Vol. 12, No. 02, June 2019, pages 13-34 ISSN 1999-8716 DOI: 10.26367/DJES/VOL.12/NO.2/2 eISSN 2616-6909
25
Fig.15: Wear depth of tool components for second stage

Diyala Diyala Journal of Engineering Sciences Vol. 12, No. 02, June 2019, pages 13-34 ISSN 1999-8716 DOI: 10.26367/DJES/VOL.12/NO.2/2 eISSN 2616-6909
26
Figure16: Wear depth of tool components for third stage
Diyala Diyala Journal of Engineering Sciences Vol. 12, No. 02, June 2019, pages 13-34 ISSN 1999-8716 DOI: 10.26367/DJES/VOL.12/NO.2/2 eISSN 2616-6909
27
Fig.17: Wear depth of tool components for fourth stage

Diyala Diyala Journal of Engineering Sciences Vol. 12, No. 02, June 2019, pages 13-34 ISSN 1999-8716 DOI: 10.26367/DJES/VOL.12/NO.2/2 eISSN 2616-6909
28
Figure.18: Wear depth of tool components for fifth stage

Diyala Diyala Journal of Engineering Sciences Vol. 12, No. 02, June 2019, pages 13-34 ISSN 1999-8716 DOI: 10.26367/DJES/VOL.12/NO.2/2 eISSN 2616-6909
29
Figure.19: Wear depth of tool components for sixth stage
From previous results of wear depth for all
stages, it is noted that the upper punch is more exposed to wear than other tool components especially in third, fourth and fifth stages, as shown in bar chart of Fig.20. Furthermore from simulation results of die wear, it can be seen that the depth of
wear is larger on the round edges of punch or die inserts more than other areas due to the effect of material flow during deformation process and excessive contact pressure and sliding velocity , as shown in Fig.21.

Diyala Diyala Journal of Engineering Sciences Vol. 12, No. 02, June 2019, pages 13-34 ISSN 1999-8716 DOI: 10.26367/DJES/VOL.12/NO.2/2 eISSN 2616-6909
30
Figure.20: Maximum wear depth of tool components for all stages
Figure.21: Excessive wear depth regios is larger at round edges for fifth stage
7.4. Determination of Tool Life
Tool service life is determined according to the tolerance of product parts. The parts of current study are characterized by complex geometries and very close tolerances in some dimentions are required, especially for internal diameters. In general, the range of dimensions tolerance in cold extrusion is
within (0.05 mm to 0.35 mm). Therefore when the product parts become out of the specified tolerance range, the tool should be replaced by new one. Fig.22 shows samples of punches for different stages which are out off work service due to the wear failure.
0.00E+00
1.00E-06
2.00E-06
3.00E-06
4.00E-06
5.00E-06
6.00E-06
7.00E-06
8.00E-06
9.00E-06
stage 1 stage 2 stage 3 stage 4 stage 5 stage 6
Wea
r Dep
th m
m
core1 core2
punch

Diyala Diyala Journal of Engineering Sciences Vol. 12, No. 02, June 2019, pages 13-34 ISSN 1999-8716 DOI: 10.26367/DJES/VOL.12/NO.2/2 eISSN 2616-6909
31
Figure.22: Actual punches for different stages after were scrapped due to wear
In order to determine productivity (product parts per tool) for the tool components, the tolerance of affected dimensions by this tool should be firstly specified. When the range of tolerances is considered as 0.05mm for lower limit and 0.35 mm for upper limit, the tool service life for wear depth results can be calculated by dividing the dimension tolerance to wear depth which occurs at single stroke. For the
simulation results. to adopt values of wear depth for the productivity calculations, the mean values of wear depth in the largest wear affected regions will be considered to determine tool service life. Mean values of wear depth are computed by assigning a plane of concentrated wear area and choose many points (about 25points) on the edge of this plain to read wear depth in assigned plain as shown in Fig.23.
a b
Figure.23: Determination of mean value of wear depth in region of largest wear affected a) plane location b)points indicated on edge of plane

Diyala Diyala Journal of Engineering Sciences Vol. 12, No. 02, June 2019, pages 13-34 ISSN 1999-8716 DOI: 10.26367/DJES/VOL.12/NO.2/2 eISSN 2616-6909
32
Table.6 shows the productivity of tool components according to tolerances range based on mean values of wear depth. As stated previously, the range of tolerance from 0.05 mm to 0.35 mm was considered with increasing step of 0.05 mm then the
corresponding productivities are calculated and listed. According to this table , designer and operator can select the tolerance for any tool components to find its productivity or its service life.
Table.6: Productivity of tool components according to different tolerance ranges based on mean values of
wear depth from FE simulation.
stage No.
Tool compon
ents
FE simulation Mean values
of Wear depth in single stroke (mm)
Productivity or Tool life (part/tool)
Toleranc
e 0.05mm
Toleranc
e 0.1mm
Toleranc
e 0.15mm
Toleranc
e 0.2mm
Toleranc
e 0.25mm
Toleranc
e 0.3mm
Toleranc
e 0.35mm
stage 1
core1 2.94557E-08 1.70E+06 3.39E+06 5.09E+06 6.79E+06 8.49E+06 1.02E+07 1.19E+07 core2 4.27693E-07 1.17E+05 2.34E+05 3.51E+05 4.68E+05 5.85E+05 7.01E+05 8.18E+05 punch 5.4435E-08 9.19E+05 1.84E+06 2.76E+06 3.67E+06 4.59E+06 5.51E+06 6.43E+06
stage 2
core1 8.35952E-07 5.98E+04 1.20E+05 1.79E+05 2.39E+05 2.99E+05 3.59E+05 4.19E+05 core2 1.87489E-06 2.67E+04 5.33E+04 8.00E+04 1.07E+05 1.33E+05 1.60E+05 1.87E+05 punch 8.61664E-07 5.80E+04 1.16E+05 1.74E+05 2.32E+05 2.90E+05 3.48E+05 4.06E+05
stage 3
core1 3.47731E-07 1.44E+05 2.88E+05 4.31E+05 5.75E+05 7.19E+05 8.63E+05 1.01E+06 core2 1.03816E-06 4.82E+04 9.63E+04 1.44E+05 1.93E+05 2.41E+05 2.89E+05 3.37E+05 punch 3.64026E-06 1.37E+04 2.75E+04 4.12E+04 5.49E+04 6.87E+04 8.24E+04 9.61E+04
stage 4
core1 9.0322E-07 5.54E+04 1.11E+05 1.66E+05 2.21E+05 2.77E+05 3.32E+05 3.88E+05 core2 1.16932E-06 4.28E+04 8.55E+04 1.28E+05 1.71E+05 2.14E+05 2.57E+05 2.99E+05 punch 4.76183E-06 1.05E+04 2.10E+04 3.15E+04 4.20E+04 5.25E+04 6.30E+04 7.35E+04
stage 5
core1 1.86597E-07 2.68E+05 5.36E+05 8.04E+05 1.07E+06 1.34E+06 1.61E+06 1.88E+06 core2 5.60481E-07 8.92E+03 1.78E+04 2.68E+04 3.57E+04 4.46E+05 5.35E+04 6.24E+04 punch 2.74303E-06 1.82E+04 3.65E+04 5.47E+04 7.29E+04 9.11E+04 1.09E+05 1.28E+05
stage 6
core1 5.90968E-09 8.46E+06 1.69E+07 2.54E+07 3.38E+07 4.23E+07 5.08E+07 5.92E+07 core2 4.38979E-07 1.14E+05 2.28E+05 3.42E+05 4.56E+05 5.70E+05 6.83E+05 7.97E+05
punch 3.85638E-07 1.30E+05 2.59E+05 3.89E+05 5.19E+05 6.48E+05 7.78E+05 9.08E+05 7.5. Verification of Tool Life
In order to verify the results of FE simulation which are obtained from Simufact.forming software, the punches of three stages (third ,fourth and fifth stages ) will be chosen to check their actual wear depth using CMM machine . These punches are chosen due to their exposed to high wear depth comparing with the other components.
As an actual status that is followed in production planning of most companies, every tool components has a specified range of productivity (tool service life), which is considered as tool life limitation. As soon as this productivity get, tool component should be replaced by new one. For current case study, the production limitation of chosen punches in actual process, which obtained from company documents were as below:
• Punch of third and fourth stages have productivity of (125000 part/ tool) with tolerance of 0.35mm for internal diameters of product parts. The upper limit of tolerance range was considered because the product parts are intermediate products.
• Punch of fifth stage has productivity of 100000 part/ tool with tolerance of 0.25mm for internal diameters of product parts due to this dimensions are considered final at this stage.
Using coordinate measuring machine (CMM) to check the wear depth for punches of the above three stages was executed at different productivities. Table.7 shows the CMM measurements for each situation of the punches and FE simulation results, the errors are calculated and listed in this table according to the equation . 𝐸𝑟𝑟𝑜𝑟% = h
𝐶𝑀𝑀𝑚𝑒𝑎𝑠𝑢𝑟𝑒𝑚𝑒𝑛𝑡 − 𝐹𝐸𝑠𝑖𝑚𝑢𝑙𝑎𝑡𝑖𝑜𝑛𝐶𝑀𝑀𝑚𝑒𝑎𝑠𝑢𝑟𝑒𝑚𝑒𝑛𝑡𝑠
h ∗ 100%

Diyala Diyala Journal of Engineering Sciences Vol. 12, No. 02, June 2019, pages 13-34 ISSN 1999-8716 DOI: 10.26367/DJES/VOL.12/NO.2/2 eISSN 2616-6909
33
Table.7: Comparing of the FE simulation results with CMM measurements of tool wear depth for specified productivities.
Tool Productivity (part)
Wear depth (mm) Error
% CMM results (mean value) FE simulation
Punch of 3rd stage 25000 0.08453 0.09100 7.7%
100000 0.32820 0.36402 10.9%
Punch of 4th stage 25000 0.10458 0.11904 13.8%
100000 0.40558 0.47618 17.4%
Punch of 5th stage 25000 0.064654 0.06857 6.1%
100000 0.25166 0.27430 9.0%
From the Table.7 it is obvious that the FE
simulation results for wear depth are generally higher than the actual results which measured by using CMM machine. The results accuracy relies on the regions which are selected to determine the mean values for both situations ; FE simulation and actual measuring areas on tested punch. Deviations of the results extend between 6.1% to 17.4% which are considered somewhat acceptable. To improve the accuracy of the results, it can be changed the mesh size of elements in simulation software, but in return it will increase the analysis time. 8. Conclusions
1. The dimensions of forged parts obtained from FE simulation have good agreement with the actual parts dimensions, so the deviation of FE results comparing with actual was at up value about 4% .
2. Forging loads of FE simulation were within the range of actual readings of machine control monitor, that's promote the results of FE analyses.
3. Using the results of effective stresses and die contact within the postprocessor of Simufact.forming to determine high wear regions and high stresses concentrations locations gives the designer good depict about deformation of invisible regions in forming processes.
4. Wear depth results obtained from FE simulation comparing with measurements of actual dimensions using CMM were with deviation of 6% to 17% , which can be considered as reasonable accuracy .
5. Tool service life can be determined based on wear depth and dimensions tolerances of product parts using FE simulations of die wear results and can be listed as guide for designers and operators.
6. The die of complex geometry was worn faster than the one of simple geometry, therefore the higher geometry complexity dies the lower productivity.
References
[1] A. Groseclose, , C. Choi, , J. Gonzalez-Mendez, , and T. Altan, (2008), “Estimation of Die Stresses and Wear in Warm Forging of Steel Pinion Shafts”, ERC for Net Shape Manufacturing, Report No. E RC/NSM-08-R-34, The Ohio State University.
[2] G. A. Lee & Y. T. Im, (1999), " Finite-element investigation of the wear and elastic deformation of dies in metal forming", Journal of Materials Processing Technology.
[3] R. S. Lee and J. L. Jou,( 2003), "Application of numerical simulation for wear analysis of warm forging die", Journal of Materials Processing Technology Vol.140.
[4] H.C. Lee, Y. Lee, S.Y. Lee, S. Choi, D.L. Lee, Y.T. Im, (2008), "Tool life prediction for the bolt forming process based on high-cycle fatigue and wear", Journal of Materials Processing Technology, Vol. 201.
[5] Bundale Santosh, Ronge B.P, Misal N.D., (2014), "FEA approach for prediction and validation of die life of hot forging dies", International Journal of Application or Innovation in Engineering & Management (IJAIEM), Vol.3 .
[6] R. Iamtanomchai & S. Bland, (2015), "Study of wear and life enhancement of hot forging dies using finite element analysis", Proceedings of the World Congress on Engineering (WCE 2015), London, U.K. Vol. II.
[7] S.Y. Hsia & P. Y. Shih, (2015), " Wear Improvement of Tools in the Cold Forging Process for Long Hex Flange Nuts" Materials Journal.
[8] J. H. Noh and B. B. Hwang, (2015), " Characteristics of tool wear in a combined double cup extrusion process", Journal of Mechanical Science and Technology, Vol.29.
[9] B. A. Behrens, A. Bouguecha, M. Vucetic, A. Chugreev, (2016), "Advanced wear simulation

Diyala Diyala Journal of Engineering Sciences Vol. 12, No. 02, June 2019, pages 13-34 ISSN 1999-8716 DOI: 10.26367/DJES/VOL.12/NO.2/2 eISSN 2616-6909
34
for bulk metal forming processes", MATEC Web of Conferences, Vol.80.
[10] Liang D., Sergej M., Jens H., Braham P.,·Mats O. (2016),"Numerical study of contact conditions in press hardening for tool wear simulation", International Journal of Material Forming.
[11] F. R. Biglari & M. Zamani, (2008), "Die wear profile investigation in hot forging", Proceedings of the World Congress on Engineering (WCE), London, U.K Vol. II, 2008.
[12] Ömer Necati Cora (2004), " Friction analysis in cold forging", Thesis, Middle East Technical University.
[13] M.W. Fu, (2017),"Design and Development of Metal-Forming Processes and Products Aided by Finite Element Simulation", Springer International Publishing AG.