estimation of the water quality amelioration value of wetlands: a
TRANSCRIPT
Environment for Development
Discussion Paper Series June 2010 EfD DP 10-15
Estimation of the Water Quality Amelioration Value of Wetlands
A Case Study of the Western Cape, South Africa
Jane Tur p ie , E l i zabet h Day, Ver e Ross-G i l l esp i e , and Ant on Louw
Environment for Development
The Environment for Development (EfD) initiative is an environmental economics program focused
on international research collaboration, policy advice, and academic training. It supports centers in Central
America, China, Ethiopia, Kenya, South Africa, and Tanzania, in partnership with the Environmental
Economics Unit at the University of Gothenburg in Sweden and Resources for the Future in Washington, DC.
Financial support for the program is provided by the Swedish International Development Cooperation Agency
(Sida). Read more about the program at www.efdinitiative.org or contact [email protected].
Central America Environment for Development Program for Central America Centro Agronómico Tropical de Investigacíon y Ensenanza (CATIE) Email: [email protected]
China Environmental Economics Program in China (EEPC) Peking University Email: [email protected]
Ethiopia Environmental Economics Policy Forum for Ethiopia (EEPFE) Ethiopian Development Research Institute (EDRI/AAU) Email: [email protected]
Kenya Environment for Development Kenya Kenya Institute for Public Policy Research and Analysis (KIPPRA) Nairobi University Email: [email protected]
South Africa Environmental Policy Research Unit (EPRU) University of Cape Town Email: [email protected]
Tanzania Environment for Development Tanzania University of Dar es Salaam Email: [email protected]
Discussion papers are research materials circulated by their authors for purposes of information and discussion. They have
not necessarily undergone formal peer review.
Estimation of the Water Quality Amelioration Value of Wetlands:
A Study of the Western Cape, South Africa
Jane Turpie, Elizabeth Day, Vere Ross-Gillespie, and Anton Louw
Abstract
Wetlands are commonly understood to have the capacity to reduce the loads of excess nutrients,
pathogens, sediments, and other contaminants generated by various activities in their catchment areas.
However, quantifying these ―services‖ is difficult and most research in this field has concentrated on artificial
treatment wetlands. Understanding the value of their water treatment characteristics, as well as the other
services they provide, is increasingly recognized as essential to achieving a balance between conservation and
activities that degrade or replace wetlands.
The aim of this study is to estimate the water treatment capacity of wetlands on a landscape scale in the
South Western Cape of South Africa and estimate the economic value of the service performed. We collected
samples at the outflow points of 100 subcatchment areas and measured the loads of nitrogen, dissolved
phosphorus, and suspended solids, which were analyzed with respect to detailed spatial data on land cover and
wetlands area. Wetlands play a significant role in the reduction of nitrates, nitrites, and ammonium, but not
dissolved phosphorus or suspended solids. Estimated removal rates range from 307 to 9,505 kg N per ha-1
year-1
, with an average of 1,594 ± 1,375 kg N per ha-1
year-1
. Data from a number of water treatment works
suggest that the cost of removal of ammonium nitrogen is in the order of ZAR 26 per kilogram. Applied to the
wetlands in the study area—assuming wetlands do play a role in total phosphorus removal—this suggests that
the average value of the water treatment service provided by wetlands in the study area is about ZAR 14,350 ±
12,385 ha-1
year-1
. These values are high enough to compete with the alternative land uses that threaten their
existence. The results suggest that wetlands should be given considerably more attention in land-use planning
and regulation.
Key Words: ecosystem services, wetlands, economic valuation, water treatment
JEL Classification: Q57
Contents
Introduction ............................................................................................................................. 1
1. Methods .............................................................................................................................. 4
1.1 Study Area ................................................................................................................... 4
1.2 Timing of the Study ..................................................................................................... 7
1.3 Field Data Collection and Analysis ............................................................................. 8
1.4 Valuation ...................................................................................................................... 9
2. Removal of Nutrients and Sediments by Wetlands ....................................................... 9
3. Valuation of the Water Treatment Service ................................................................... 11
4. Discussion.......................................................................................................................... 14
4.1 Factors Influencing Water Quality on a Landscape Scale ......................................... 14
4.2 Capacity of Wetlands for Water Quality Treatment .................................................. 16
4.3 Valuation .................................................................................................................... 17
4.4 Scale of Study ............................................................................................................ 18
5. Conclusion ........................................................................................................................ 18
References .............................................................................................................................. 19
Environment for Development Turpie et al.
1
Estimation of the Water Quality Amelioration Value of Wetlands:
A Study of the Western Cape, South Africa
Jane Turpie, Elizabeth Day, Vere Ross-Gillespie, and Anton Louw
Introduction
Wetlands are among the most threatened habitats globally, and it is estimated that since
1900 more than half of the world’s wetlands have been destroyed and lost to other land uses
(Barbier 1993). Indeed, despite various forms of international and national legislation ratifying
their protection (Bergstrom and Stoll 1993), wetlands continue to be affected by human
activities, including channelization, drainage, crop production, effluent disposal, and water
abstraction, including in South Africa (Walmsley 1991; Barbier et al. 1997; Turner et al. 2000;
Bowers 1983).
A major factor contributing to this international trend of destroying wetlands is the fact
that their value is poorly understood. In addition to providing habitat to rare or endangered plants
and animals, wetlands host a range of ―ecosystem services,‖ which endow surrounding and
downstream communities with direct and indirect benefits (Barbier et al. 1997). These include
services or goods, such as reeds and fish; regulating services (e.g., the attenuation of floods;
treatment of water quality by the sequestration or uptake of pollutants, including nutrients and
heavy metals; and effective trapping of suspended sediments); and cultural services, such as
opportunities for recreation, scientific research, and spiritual fulfillment (ibid.). The economic
benefits and services provided by wetland ecosystems such as these are frequently overlooked by
governments, developers, private industry, and other land users (Emerton 1998), resulting at
times in distorted decisions. Estimation of the economic value of wetlands is thus seen as a
Jane Turpie, Economic Policy Research Unit, University of Cape Town, Rondebosch 7701, South Africa and
Anchor Environmental Consultants, Suite 8, Steenberg House, Steenberg Office Park, Tokai 7945, South Africa,
(tel) +27 21 701 6420, (email) jane @anchorenvironmental.co.za; Elizabeth Day, Freshwater Consulting Group, 6
Flamingo Crescent, Zeekoevlei 7941, South Africa, (email) [email protected]; Vere Ross-Gillespie, Freshwater
Consulting Group, 6 Flamingo Crescent, Zeekoevlei 7941, South Africa, (email) [email protected];
and Anton Louw, Anchor Environmental Consultants, PO Box 34035, Rhodes Gift 7707, South Africa, (tel) +27
21 701 6420, (email) [email protected].
This project was supported by the Water Research Commission and Sida (Swedish International Development and
Cooperation Agency) through the University of Gothenburg’s Environment for Development Program. We are
grateful to Noah Scovronick for collation of economic data and Barry Clark for assistance with statistical analysis.
Thanks also go to Heather Malan, Jenny Day, and Fred Ellery for discussions and useful inputs.
Environment for Development Turpie et al.
2
potentially significant means of correcting these distortions and achieving a better balance
between conservation and activities that degrade or replace wetlands.
The global value of wetlands and their associated ecosystem services has been estimated
in the past as US$ 14 trillion annually (Costanza et al. 1997). However, the estimation of
wetlands values on a local scale requires a more accurate understanding of their capacity to
deliver services and the demand for those services. While it is relatively straightforward to
quantify harvests of natural resources from wetlands and the value of tourism with survey-based
valuation techniques, valuing the regulating services of wetlands is particularly challenging
because it requires in-depth understanding of complex, interconnected biophysical processes.
The biophysical functioning of different types of wetlands in different ecoregions varies
dramatically and may be difficult to measure and conceptualize. Past valuation studies have been
hampered by a lack of information, particularly regarding the ability of wetlands to ameliorate
the quality of water passing into systems downstream.
The main water-quality constituents that wetlands influence include the loading and/or
concentrations of phosphorus and nitrogen nutrients, ammonia, and various heavy metals, as well
as suspended solids and their load of sorbed compounds. As streamflows (flow of water in
streams, rivers, etc., from land to ocean) enter wetlands, they slow down, with the result that
suspended sediments settle out of the water column. Because many pollutants (e.g., metals and
organic chemicals) attach strongly to suspended matter, this process is also important for
reducing these materials in downstream systems.
While uptake by plants and epiphytes, and sorption to soil surfaces, are primary processes
that change phosphorus concentrations in wetlands water in the short term, plants and their
epiphyton release up to 75% of this phosphorus back into the water column, and long-term
storage (accumulation) relies primarily on sediment and peat accumulation (Kadlec and Knight
1996; Cooke et al. 2005). Removal of heavy metals occurs by short-term uptake into plant
structures, but longer-term storage is achieved in sedimentation.
Wetlands are also effective in processing nitrates (Cooke et al. 2005). They have the
capacity to remove various pathogens from water passing through. Although this is true of many
wetlands when pathogens (e.g., coliform bacteria) are present in high loads, it should be noted
that wetlands themselves include active populations of many bacteria. Wetlands with large
populations of birds or other wildlife may well contribute more fecal bacteria to through-flowing
water than they remove (Kadlec and Knight 1996).

Environment for Development Turpie et al.
3
Seasonality is also important. Wetlands are thought to be better at removing total
suspended solids, phosphorus, and ammonia during high flow periods (when sediment loads
entering the wetland increase), but they can also remove nitrates during low flow periods
(Johnston et al. 1990). During extreme flow events, the sediments and nutrients that have
accumulated in wetlands may be flushed out, temporarily elevating downstream loads. This may
have a smaller effect on the downstream environment than if they were released during lower
flow periods. However, where downstream systems have areas of permanent sediment
entrapment (e.g., basins and lakes), this same net loading may occur with a large, dilute load of
sediments or a smaller but continual supply of sediment.
A number of studies have researched the function of wetlands in the treatment of waste
water (e.g., Peltier et al. 2003; Thullen et al. 2005; Batty et al. 2005), but most have been carried
out in artificial or dedicated treatment wetlands, and few have used a landscape-scale approach.
In treatment wetlands, absolute removal rates of nutrients, such as nitrogen (N) and phosphorus
(P) are often proportional to the concentration of inflowing water, and the proportion of N and P
removed tends to increase as water detention time increases (Jordan et al. 2003). In such
wetlands, inflowing water quality, loading rates, and detention time are usually known variables,
along with outflowing quality and loading, which makes quantification of internal wetlands
services possible to a relatively high level of accuracy. Comparatively little research has looked
at quantifying the water treatment capacity of natural wetlands (Verhoeven et al. 2006), and it
suggests that it is critical to take landscape-level processes into account.
Because of the common perception that wetlands act as pollution filters in a catchment
area, some authors have likened wetlands to a point-source equivalent in a landscape dominated
by nonpoint-source pollution. However, uptake of pollutants does not only occur within aquatic
ecosystems, but also during the drainage process, as surface and sometimes groundwater flows
pass through various environments en route to streams and rivers. In Florida, it was estimated
that 9.3% of total nitrogen inputs of a catchment reached surface water, and 19.6% reached the
groundwater, with the contribution varying for different types of inputs (Young et al. 2008). The
balance was attributed to the assimilation capacity of the soil. Measurement on a landscape scale
allows the assessment of the integrated effect of wetlands on downstream water quality, as well
as the effect on suspended solids, which cannot be easily measured on an individual wetland
scale.
Water-quality amelioration functions of wetlands benefit both the ecology and human
users in downstream systems. For example, preventing contamination of downstream areas may
protect fisheries from harmful pollutants or reduce the impact on human health, for example,
Environment for Development Turpie et al.
4
associated with extensive growth of algae or aquatic macrophytes in response to nutrient loading.
Reduced sediment loads may reduce the frequency of dredging (and thus the cost) needed to
prolong the lifespan of downstream impoundment. Once such services have been quantified, they
can be valued using a damage cost avoided or a replacement cost approach (Pearce and Turner
1990; James 1991; Barbier 1993; Emerton et al. 1999).
The aim of this study is to estimate the water treatment capacity of wetlands in the
Fynbos Biome of the Western Cape, South Africa, using a novel landscape-scale approach, and
to estimate its economic value. The study focuses on the removal of nitrogen, phosphorus, and
suspended solids only.
1. Methods
We valued the water treatment capacity of wetlands using a replacement cost approach,
which entailed quantifying the removal of pollutants by the wetlands in the study area and
estimating the equivalent cost of performing this service with man-made water treatment plants.
Because of the difficulties of measuring flows through individual wetlands, we took a landscape
approach to estimate the service performed by wetlands, where water quality at catchment
outflow points was related to the prevalence of wetlands, as well as other land uses, using
multivariate statistical analysis.
1.1 Study Area
We chose to study the Fynbos Biome within the Western Cape Province, South Africa,
because accurate and recent fine-scale spatial data on land cover was available, collected as part
of the CAPE Fine Scale Planning project (Snaddon et al. 2008). Samples were collected from the
outflow points of 100 subcatchments (figure 1), which collectively covered an area of 797,000
hectares. Of these, 75% were fed only by the immediate subcatchment and the remainder was at
the outflow points of subcatchments fed by other subcatchments. In the latter case, we assumed
that the influence of land cover in the distal subcatchments would be negligible, compared with
land cover in the immediate subcatchment, and only land cover in the immediate subcatchment
was taken into account.
Environment for Development Turpie et al.
5
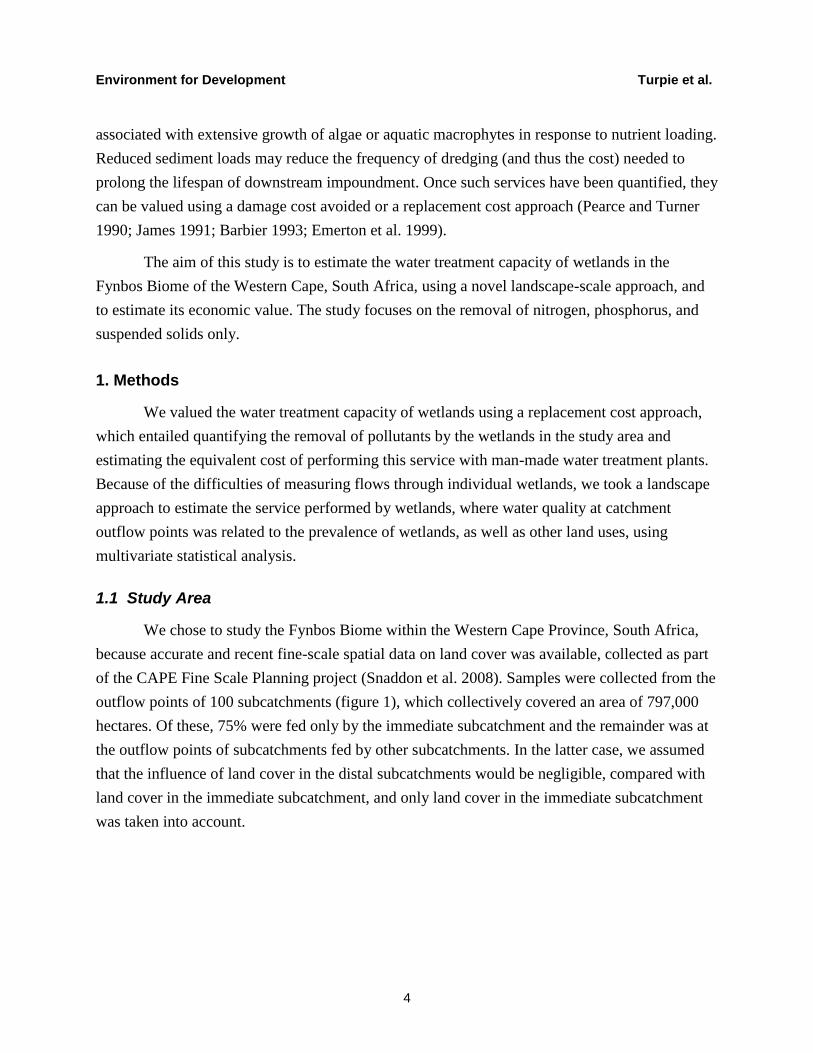
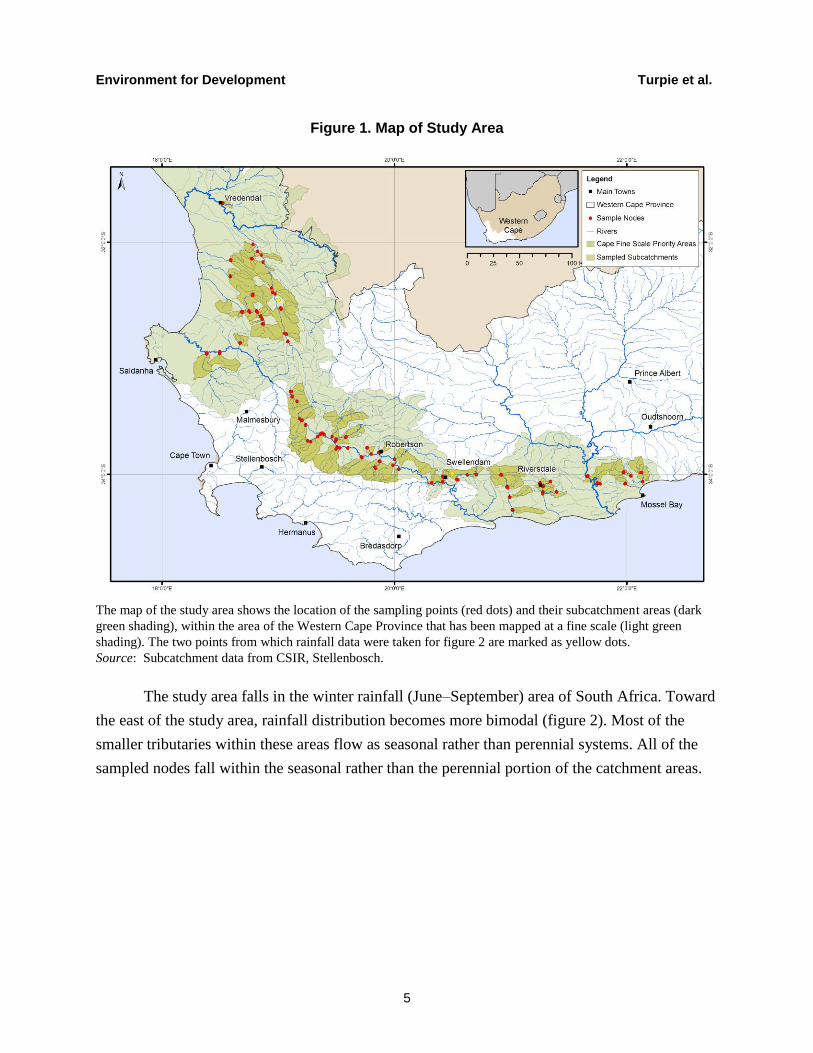
Figure 1. Map of Study Area
The map of the study area shows the location of the sampling points (red dots) and their subcatchment areas (dark
green shading), within the area of the Western Cape Province that has been mapped at a fine scale (light green
shading). The two points from which rainfall data were taken for figure 2 are marked as yellow dots.
Source: Subcatchment data from CSIR, Stellenbosch.
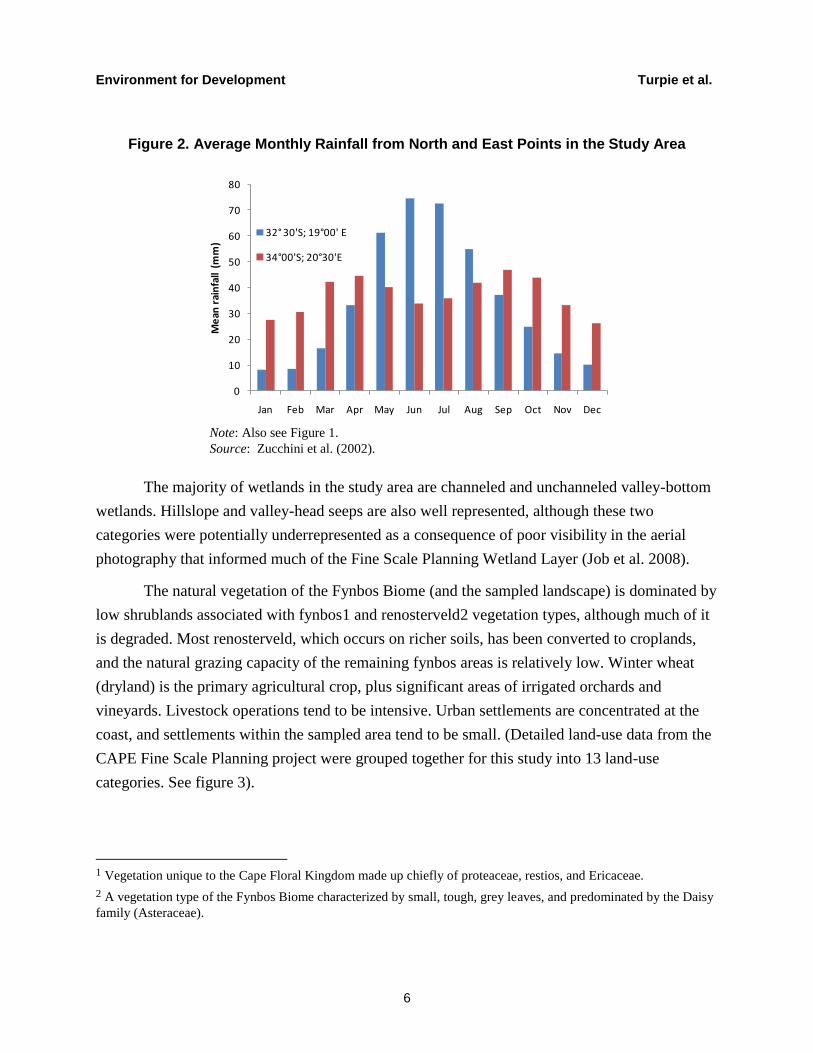
The study area falls in the winter rainfall (June–September) area of South Africa. Toward
the east of the study area, rainfall distribution becomes more bimodal (figure 2). Most of the
smaller tributaries within these areas flow as seasonal rather than perennial systems. All of the
sampled nodes fall within the seasonal rather than the perennial portion of the catchment areas.
Environment for Development Turpie et al.
6
Figure 2. Average Monthly Rainfall from North and East Points in the Study Area
Note: Also see Figure 1.
Source: Zucchini et al. (2002).
The majority of wetlands in the study area are channeled and unchanneled valley-bottom
wetlands. Hillslope and valley-head seeps are also well represented, although these two
categories were potentially underrepresented as a consequence of poor visibility in the aerial
photography that informed much of the Fine Scale Planning Wetland Layer (Job et al. 2008).
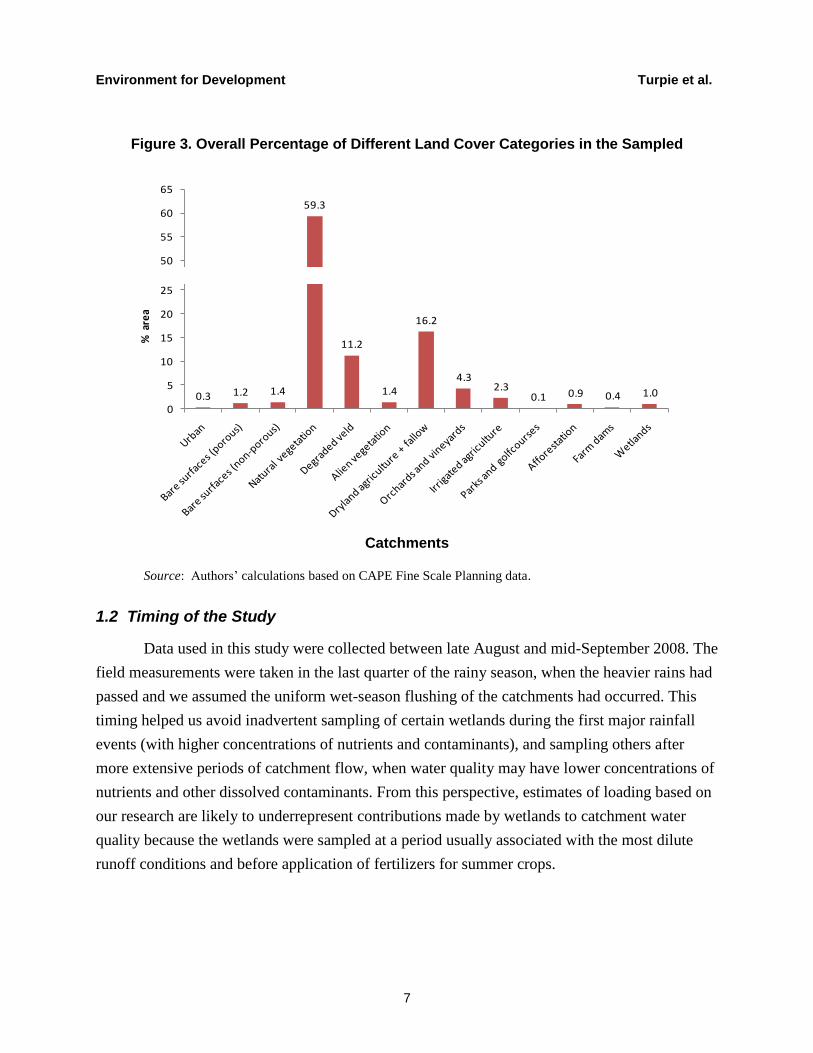
The natural vegetation of the Fynbos Biome (and the sampled landscape) is dominated by
low shrublands associated with fynbos1 and renosterveld2 vegetation types, although much of it
is degraded. Most renosterveld, which occurs on richer soils, has been converted to croplands,
and the natural grazing capacity of the remaining fynbos areas is relatively low. Winter wheat
(dryland) is the primary agricultural crop, plus significant areas of irrigated orchards and
vineyards. Livestock operations tend to be intensive. Urban settlements are concentrated at the
coast, and settlements within the sampled area tend to be small. (Detailed land-use data from the
CAPE Fine Scale Planning project were grouped together for this study into 13 land-use
categories. See figure 3).
1 Vegetation unique to the Cape Floral Kingdom made up chiefly of proteaceae, restios, and Ericaceae.
2 A vegetation type of the Fynbos Biome characterized by small, tough, grey leaves, and predominated by the Daisy
family (Asteraceae).
0
10
20
30
40
50
60
70
80
Jan Feb Mar Apr May Jun Jul Aug Sep Oct Nov Dec
Me
an r
ain
fall
(mm
)
32° 30'S; 19°00' E
34°00'S; 20°30'E
Environment for Development Turpie et al.
7
Figure 3. Overall Percentage of Different Land Cover Categories in the Sampled
Catchments
Source: Authors’ calculations based on CAPE Fine Scale Planning data.
1.2 Timing of the Study
Data used in this study were collected between late August and mid-September 2008. The
field measurements were taken in the last quarter of the rainy season, when the heavier rains had
passed and we assumed the uniform wet-season flushing of the catchments had occurred. This
timing helped us avoid inadvertent sampling of certain wetlands during the first major rainfall
events (with higher concentrations of nutrients and contaminants), and sampling others after
more extensive periods of catchment flow, when water quality may have lower concentrations of
nutrients and other dissolved contaminants. From this perspective, estimates of loading based on
our research are likely to underrepresent contributions made by wetlands to catchment water
quality because the wetlands were sampled at a period usually associated with the most dilute
runoff conditions and before application of fertilizers for summer crops.
0.3 1.2 1.4
59.3
11.2
1.4
16.2
4.32.3
0.1 0.9 0.4 1.0
0
5
10
15
20
25
30
35
40
45
50
55
60
65
% a
rea 0.3 1.2 1.4
59.3
11.2
1.4
16.2
4.32.3
0.1 0.9 0.4 1.0
0
5
10
15
20
25
30
35
40
45
50
55
60
65
% a
rea
Environment for Development Turpie et al.
8
1.3 Field Data Collection and Analysis
Positions of the outflow ―nodes‖ from each subcatchment were identified using
geographic information system (GIS) data and located in the field with a hand-held global
positioning system (GPS). Once located, a sampling site was chosen up to a maximum of 200
meters upstream of the nodal point, where flow could be calculated with relative accuracy (i.e.,
ideal sites had a simple cross-sectional profile). Photographs were taken of each site, a cross-
sectional profile of the river and surrounding area was sketched, and depth and flow were
measured within the channel along a transect at 0.5-meter intervals. In situ measurements were
taken of pH levels, dissolved oxygen concentration, oxygen saturation, temperature, and
electrical conductivity. Suspended solid concentrations were calculated by filtering known
volumes of water on site through pre-weighed filter papers, which were subsequently dried and
weighed, and burned to ash in a muffle furnace (where the material burned is isolated from the
fuel and products of combustion) at 450ºC (842ºF), so we could calculate both organic and
inorganic suspended sediment components. Water samples of 50 mls were collected at each site,
frozen, and later analyzed at the University of Cape Town for concentrations of the following
variables: (NO3 + NO2)-N, ammonium nitrogen (NH4-N), and orthophosphate (PO4-P). We
calculated downstream loading with instantaneous flow data. The concentrations of selected
water quality variables as follows:
Loading (mg/s) = concentration (mg/l) x flow (l/s).
It was hypothesized that nutrient and sediment loads in the water flowing from each
subcatchment would be a function of the relative area of different land cover types, as follows:
Loading (mg/s) = f(Aw, A1, A2….An) ,
where Aw = percentage area of wetlands and A1–An are the percentage area of other land-cover
types 1…n. The sign of each influential land cover type depends on whether it represents a land
cover that is associated with nutrient or sediment input (e.g., irrigated fields) or removal (e.g., as
hypothesized here, wetlands).
Since all variables were continuous, linear stepwise multiple regression analysis was used
(Statistica 8®). For each nitrite + nitrate nitrogen, ammonium nitrogen, orthophosphate, and total
suspended solids, the instantaneous load at the sampling point (quantity per unit time) was
regressed against the percentage area of grouped land-cover categories of the catchment apart
from bare surfaces. Data were not transformed in any way.
Environment for Development Turpie et al.
9
In those cases where wetlands had a significant impact on load, the equation was used to
predict what the load would be for each subcatchment if the percentage area of wetlands was
changed to zero. The difference between measured value and the latter value was the amount
removed by the wetlands. This amount, expressed as a quantity per second, was converted to an
absolute amount removed per year by estimating the total time of flow. In the absence of time
series data, it was conservatively estimated that this level of service would only be performed
during the main rainfall months, and that the elevated loads—expected at the onset of the rainy
season when catchments are ―flushed‖—would largely go untreated due to the high flows during
these flushing events. The estimated amount removed annually was then divided by the actual
area of wetlands to determine the average rate of removal per hectare of wetland per year in each
subcatchment.
1.4 Valuation
The water treatment function was valued using the replacement cost method, based on the
cost of treatment in water treatment plants. The data, collected from 24 water treatment plants,
included the total amount of water treated, the concentration of N and P before and after
treatment, and the capital and operating costs of the plants. Multiple regression analysis was used
to estimate the marginal cost of treatment per unit mass of N and P. It was assumed that any
treatment service provided by the wetlands was fully demanded, in that it was always beneficial
to downstream users, as opposed to a situation where there are few or no users downstream.
This is reasonable, given the scarcity of water in general in South Africa due to low rainfall, and
the scarcity of clean water in particular due to government failure to provide adequate treatment
services (Turton 2008).
2. Removal of Nutrients and Sediments by Wetlands
Both irrigated lands and wetlands studied significantly influenced both nitrite + nitrate
nitrogen and ammonium nitrogen loads, with irrigated lands having a positive influence and
wetlands having a negative influence (tables 1 and 2). In the case of ammonium nitrogen,
degraded veld (rangeland) was also found to have a positive influence (table 2). Although highly
significant, the regressions had a poor fit, which suggests that not all important factors were
taken into account.

Environment for Development Turpie et al.
10
Table 1. Regression Summary for Load (NO3 + NO2)-N mg/s
Beta Std. error
of beta B
Std. error of B
t(92) p-level
Intercept 334.8203 126.9991 2.63640 0.009835
% Irrigated lands 0.218609 0.099158 18.4488 8.3681 2.20465 0.029972
% Wetlands -0.213352 0.099158 -43.7603 20.3381 -2.15164 0.034045
Note: n = 93, F(2,92) = 4.9106, Adjusted R2 = 0.077, p < 0.001
Table 2. Regression Summary for Load NH4-N mg/s
Beta Std. error
of beta B
Std. error of B
t(91) p-level
Intercept 74.95 42.59 1.76 <0.10
% Degraded veld 0.562359 0.097672 9.52 1.65 5.76 <0.001
% Wetlands -0.293469 0.096943 -22.13 7.31 -3.03 <0.01
% Dryland agriculture -0.153267 0.090831 -1.89 1.12 -1.69 <0.10
Notes: R² = 0.27407242; adjusted R² = 0.250; F(3,91) = 11.452; p < 0.001.
The above results yield the following equations:
N (NO3 + NO2) (mg.s-1
) = 334.82 + 18.45*% I – 43.76*% W , and (1)
N (NH4) (mg.s-1
) = 74.95 + 9.52*% DV – 22.13*% W – 1.89 * % DA , (2)
where N (NO3 + NO2) is the load of N leaving a particular subcatchment, % I is the percentage
area of irrigated lands (including orchards, vineyards, pastures, parks, and golf courses) in the
subcatchment, % W is the percentage area of wetlands in the subcatchment, % DV is the
percentage area of degraded veld in the subcatchment, and % DA is the percentage area of
dryland agriculture in the subcatchment.
PO4-P loading was not significantly correlated with any form of land cover. The results
for total suspended solids (TSS) suggest that sediment loads were driven predominantly by the
presence of dryland agriculture, which have a positive impact on sediment loads, while wetlands
did not have a significant impact on downstream sediment loads (table 3).
Environment for Development Turpie et al.
11
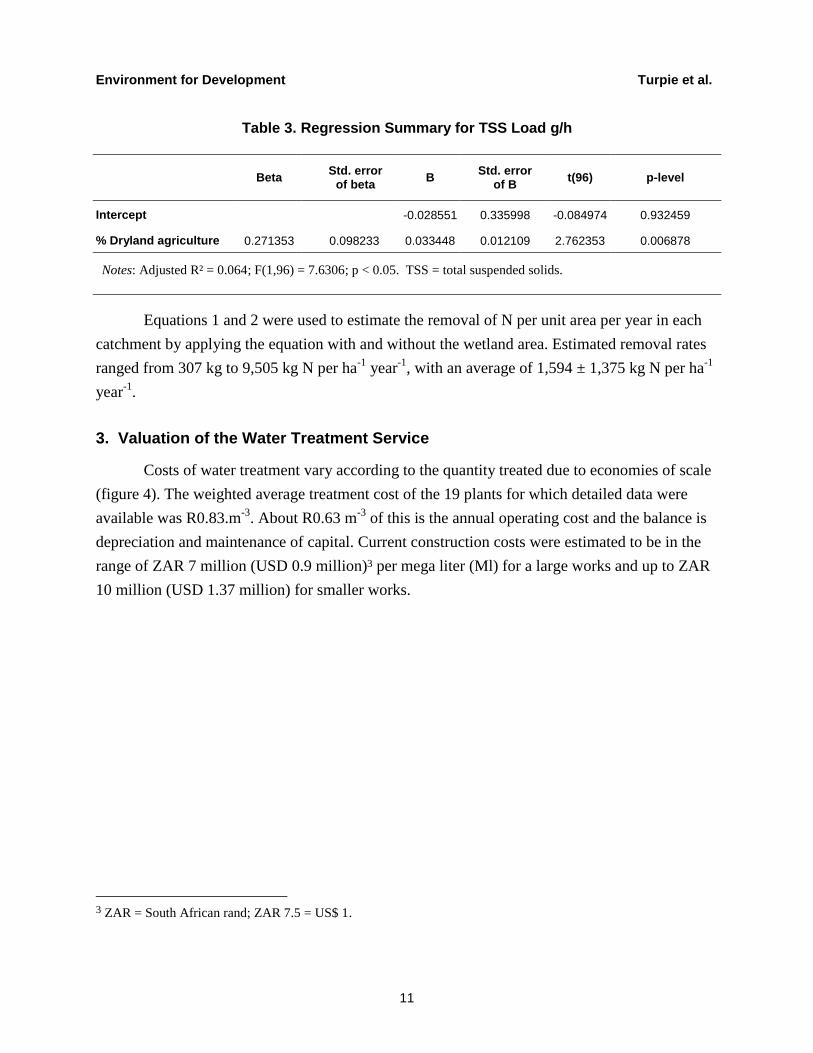
Table 3. Regression Summary for TSS Load g/h
Beta Std. error
of beta B
Std. error of B
t(96) p-level
Intercept -0.028551 0.335998 -0.084974 0.932459
% Dryland agriculture 0.271353 0.098233 0.033448 0.012109 2.762353 0.006878
Notes: Adjusted R² = 0.064; F(1,96) = 7.6306; p < 0.05. TSS = total suspended solids.
Equations 1 and 2 were used to estimate the removal of N per unit area per year in each
catchment by applying the equation with and without the wetland area. Estimated removal rates
ranged from 307 kg to 9,505 kg N per ha-1
year-1
, with an average of 1,594 ± 1,375 kg N per ha-1
year-1
.
3. Valuation of the Water Treatment Service
Costs of water treatment vary according to the quantity treated due to economies of scale
(figure 4). The weighted average treatment cost of the 19 plants for which detailed data were
available was R0.83.m-3
. About R0.63 m-3
of this is the annual operating cost and the balance is
depreciation and maintenance of capital. Current construction costs were estimated to be in the
range of ZAR 7 million (USD 0.9 million)3 per mega liter (Ml) for a large works and up to ZAR
10 million (USD 1.37 million) for smaller works.
3 ZAR = South African rand; ZAR 7.5 = US$ 1.
Environment for Development Turpie et al.
12
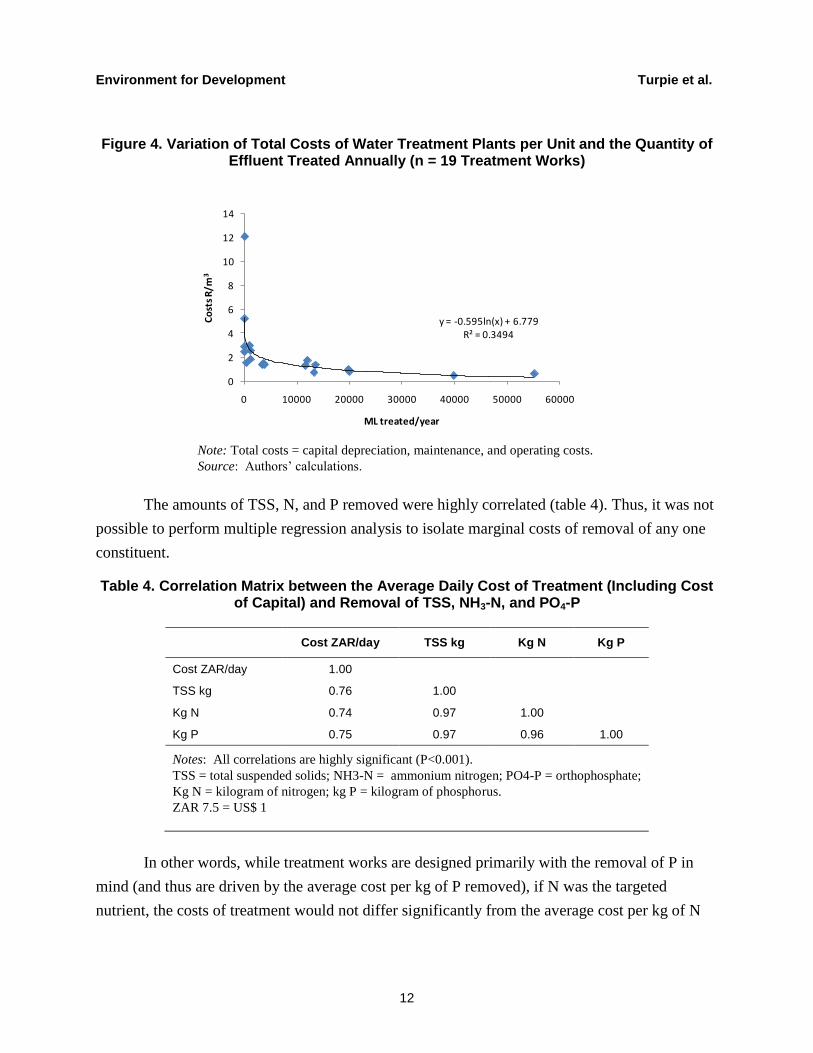
Figure 4. Variation of Total Costs of Water Treatment Plants per Unit and the Quantity of Effluent Treated Annually (n = 19 Treatment Works)
Note: Total costs = capital depreciation, maintenance, and operating costs.
Source: Authors’ calculations.
The amounts of TSS, N, and P removed were highly correlated (table 4). Thus, it was not
possible to perform multiple regression analysis to isolate marginal costs of removal of any one
constituent.
Table 4. Correlation Matrix between the Average Daily Cost of Treatment (Including Cost of Capital) and Removal of TSS, NH3-N, and PO4-P
Cost ZAR/day TSS kg Kg N Kg P
Cost ZAR/day 1.00
TSS kg 0.76 1.00
Kg N 0.74 0.97 1.00
Kg P 0.75 0.97 0.96 1.00
Notes: All correlations are highly significant (P<0.001).
TSS = total suspended solids; NH3-N = ammonium nitrogen; PO4-P = orthophosphate;
Kg N = kilogram of nitrogen; kg P = kilogram of phosphorus.
ZAR 7.5 = US$ 1
In other words, while treatment works are designed primarily with the removal of P in
mind (and thus are driven by the average cost per kg of P removed), if N was the targeted
nutrient, the costs of treatment would not differ significantly from the average cost per kg of N
y = -0.595ln(x) + 6.779R² = 0.3494
0
2
4
6
8
10
12
14
0 10000 20000 30000 40000 50000 60000
Co
sts
R/m
3
ML treated/year
Environment for Development Turpie et al.
13
removed that is achieved while P is being targeted. Thus, the value of treatment by wetlands can
theoretically be determined as follows:
Value (ZAR/y) = Max (kg TSS removed x CTSS, kg N removed x CN, kg P removed x CP),
where:
Ci = total cost of treatment / total kg of substance i removed .
The rates of removal of different substances from water treatment works in the Western
Cape suggested that an average of at least 33 mg of N is removed per liter of effluent, which
translates to 0.033 kg per cubic meter. Based on the above, the average cost of treatment was
about ZAR 26 (US$ 3.47) per kg of N removed (from total ammonium). The analysis was
limited by lack of data on the rate of removal of total P, with ortho PO4-P only accounting for
67% of influent total P. If removal of total P was also correlated with cost of treatment and
removal rates of the other elements, then it could be assumed that the cost of treatment in terms
of P removal was in the order of ZAR 71 ($9.47) per kg of P. Similar estimates could not be
made for total N due to lack of data on influent concentrations of NO3-N. These values are not
additive and are merely calculated for application in the above equations (table 5).
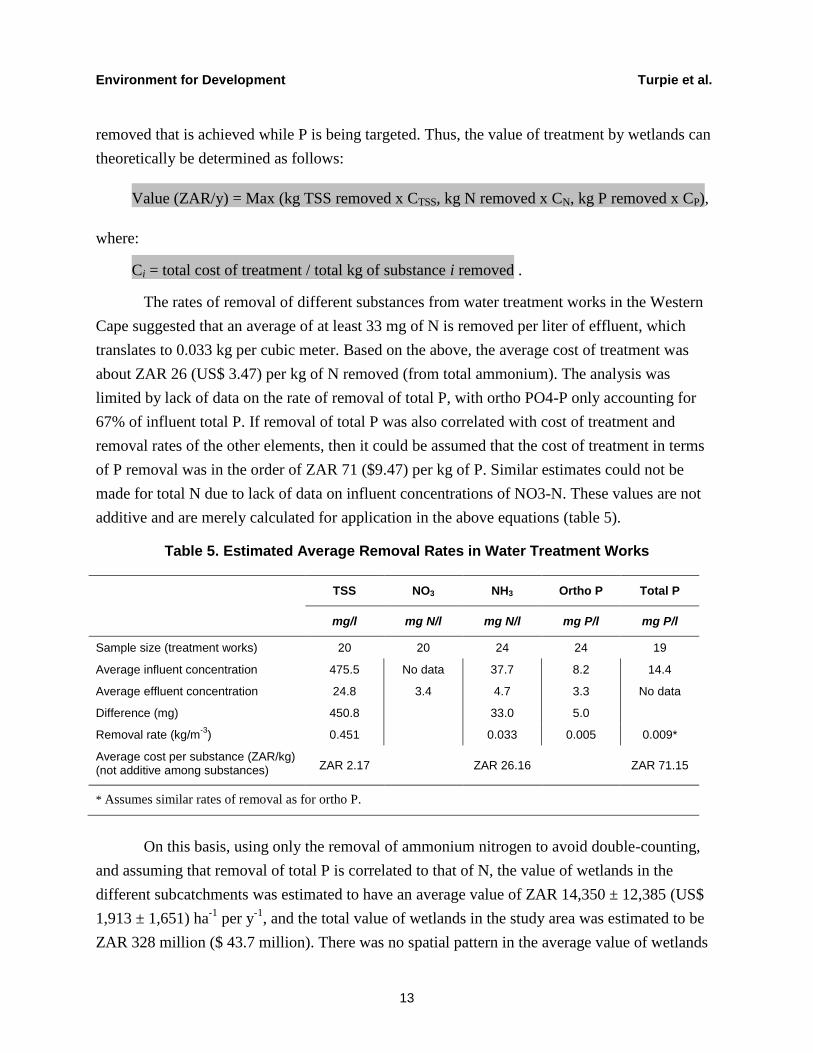
Table 5. Estimated Average Removal Rates in Water Treatment Works
TSS NO3 NH3 Ortho P Total P
mg/l mg N/l mg N/l mg P/l mg P/l
Sample size (treatment works) 20 20 24 24 19
Average influent concentration 475.5 No data 37.7 8.2 14.4
Average effluent concentration 24.8 3.4 4.7 3.3 No data
Difference (mg) 450.8 33.0 5.0
Removal rate (kg/m-3
) 0.451 0.033 0.005 0.009*
Average cost per substance (ZAR/kg) (not additive among substances) ZAR 2.17 ZAR 26.16 ZAR 71.15
* Assumes similar rates of removal as for ortho P.
On this basis, using only the removal of ammonium nitrogen to avoid double-counting,
and assuming that removal of total P is correlated to that of N, the value of wetlands in the
different subcatchments was estimated to have an average value of ZAR 14,350 ± 12,385 (US$
1,913 ± 1,651) ha-1
per y-1
, and the total value of wetlands in the study area was estimated to be
ZAR 328 million ($ 43.7 million). There was no spatial pattern in the average value of wetlands

Environment for Development Turpie et al.
14
in different subcatchments, but higher values tended to be associated with smaller subcatchments
(figure 5).
Figure 5. Variation in the Average Value of Wetlands in the Sampled Subcatchments.
Source: Authors’ calculations.
4. Discussion
The results of this study suggest that both wetlands area and land use do play a role in
determining water quality, as expected, although the regression models were weak, implying that
not all factors had been considered. The results suggested that irrigated lands (including
orchards, vineyards, pastures, parks, and golf courses) and dryland agriculture increase the
concentrations of nitrogen (in ammonium, nitrates, and nitrites), probably due to the application
of fertilizers in these areas, while wetlands have the opposite effect.
4.1 Factors Influencing Water Quality on a Landscape Scale
There were no significant correlations between land cover and dissolved phosphorus
concentrations. This was probably due to the fact that much of the total phosphorous load is
Subcatchment boundaries
Wetland value R/ha2770 - 7530
7530 - 14090
14090 - 2509025090 - 37450
37450 - 85590
100 0 100 200 Kilometers
N
Environment for Development Turpie et al.
15
bound to particles (DWAF 1996). Nevertheless, we would expect effects on total phosphorus to
be similar to the effects on TSS. Dryland agriculture had a weakly positive influence on TSS, but
wetlands were not found to play a role. The influence of dryland agriculture probably relates to
the high potential for erosion in these disturbed areas and the prevalence of drainage channels
across them, which convey water to downstream drainage systems, potentially bypassing
remnant wetland areas which might have had an ameliorating impact. Data on the condition of
the wetlands would potentially have shed some light on this aspect: channelization of valley-
bottom wetlands is a common impact to this type of wetlands and likely to dramatically affect
the efficacy of wetlands functions, such as sediment trapping and associated phosphorus removal
(see Ellery et al. 2009).
Surprisingly, farm dams did not have a significant influence on any of the water quality
parameters considered. Indeed, trapping TSS in farm dams has been hypothesized as a primary
mechanism for reducing downstream phosphorus loading in agricultural areas. The lack of
correlation may be linked to the timing of the water quality study in late winter, when small farm
dams were likely to be full and only have capacity for reduced rates of sediment retention.
The analysis was limited in that it did not take wetlands types and conditions into account
(due to a lack of data) or other factors that might have an influence on water quality, including
antecedent runoff events, natural hydrology, and geology.
Wetlands types and conditions are both are likely to play an important role in determining
the efficacy with which different wetlands are able to ameliorate water quality. Job et al. (2008)
outlined the likely roles of different wetlands on a catchment scale, noting that only those
wetlands directly linked to surface and/or groundwater flows through a catchment area are likely
to exert a measurable impact on water quality. Hence, channeled and unchanneled valley bottom
wetlands (in terms of wetlands types specified by SANBI 2009), river channels, and hillslope
and valley-head wetlands would be the main wetlands types expected to play a role in
catchment-level impacts on water quality. On the other hand, depressional wetlands and flats,
which are not linked to directional flow, are unlikely to affect water quality at this scale.
Kotze et al. (2008) postulated probable levels of delivery of ecosystem services from
different types of wetlands. In terms of sediment trapping and phosphate and nitrate removal,
valley bottom wetlands (which dominate the wetlands of the study area) were attributed low-to-
moderate levels of function (with unchanneled valley-bottom wetlands accruing a higher rating
in terms of sediment trapping than channeled valley-bottom systems), hillslope seeps (which are
also well represented) were attributed higher levels of ecosystem service in terms of nitrate

Environment for Development Turpie et al.
16
removal (but were considered to play no role in phosphorus removal), and floodplain wetlands
(rare, if not absent, in the study area) were assumed to play an important role in phosphorus
removal.
Ideally, the approach should have included multiple site visits, carried out over a full
annual flow cycle. The timing of the study in late winter attempted to standardize the effects of
antecedent rainfall effects to a degree by allowing for data collection at a time when dry season
accumulations of nutrients and other pollutants in the catchments were likely to have been
flushed out of the catchment by rainfall during the early and peak wet season. Although the
impact of abstraction on the efficacy of wetland function was not specifically measured, it was
accounted for indirectly in terms of the presence of farm dams. Accurate present-day mean
annual runoff data were not available for the mapped subcatchment areas. However, real-time
data measured at each sampling ―node‖ allowed at least comparison of estimated loading
between catchments.
Geology was not considered to be a variable and might indeed play a role in the
discrimination of water quality characteristics between different potions of the study area. Since
the study area comprised three broad vegetation zones (mapped for the Fine Scale Planning study
by Helme [2008]), it is likely that these botanical zones respond at least in part to changes in
geology. Future work on this project should include testing for differences in water quality
between catchments in different botanical zones. Budget and logistical constraints in the present
study limited the extent to which such question could be explored, given the limited number of
sites sampled across the three broad botanical areas included in the Fine Scale Planning Study.
4.2 Capacity of Wetlands for Water Quality Treatment
Estimates of the rates of removal of nitrogen by wetlands in the study area were higher
than expected and fell within the broad ranges for nitrogen removal observed in artificial
wetlands, 300–9,000 kg per ha-1
year-1
(Verhoeven et al. 2006).
The high levels of variability in removal rates estimated in this study are likely to reflect
differences in land use, but to some extent may also reflect the unassessed variability in wetlands
types and conditions, as well as regional variation in precipitation, evaporation, and vegetation.
Variability in wetlands characteristics may be associated with greater or lesser efficacy in terms
of facilitating pollutant sequestration (Kadlec and Knight 1996), especially differences in the
degree to which flows are spread through wetlands and affect aquatic contact with microbial
communities. Wetlands conditions, as noted earlier, is also likely to be a primary determinant of
Environment for Development Turpie et al.
17
wetland function on a landscape level, and this in turn is likely to be tied into land use and the
existence of an ecological buffer area or ―setback‖ between wetlands and their surrounding land
use. These uncertainties highlight the importance of providing a measure of wetlands conditions
and types, if greater levels of confidence are to be attached to modeled valuations of wetlands
ecosystem services.
Kadlec and Knight (1996) also found seasonal differences in nitrogen uptake by aquatic
macrophytes, with uptake in temperate climates at a maximum during spring and summer, and
die back (associated with the release of nitrogen nutrients back into wetland soils and waters)
often occurring in autumn and early winter. Seasonal variation in nitrogen uptake was not
investigated in the present study, but should be considered in efforts to fine-tune models for
wetland loading rates.
4.3 Valuation
We used a replacement cost technique in the valuation of the wetlands service. However,
it is difficult to isolate the cost of removal of different water quality variables in the treatment
process. The main costs entailed in design and management of water treatment works are usually
associated with the reduction of phosphorus and total ammonia concentrations to levels that
concur with licensing requirements. These in turn are often dictated by ecological concerns,
where phosphorus is often a limiting nutrient in natural inland aquatic ecosystems.
Elevated phosphorus concentrations are usually associated with increased productivity,
such as increases in algal and/or cyanobacterial blooms, and increased invasion by (often alien)
aquatic macrophytes. Management of ammonia concentrations is also accorded high priority.
Although the total nitrogen loading associated with ammonia is often lower than that associated
with nitrates and nitrites, the un-ionized form of ammonium nitrogen (ammonia-NH3) is highly
toxic to many aquatic organisms, even at very low concentrations (DWAF 1996). It might be
argued that a plant designed purely for the removal of sediment and nitrogen might be less
costly, and the values applied in this study could thus be an overestimate. Furthermore, most of
the waste-water treatment works analyzed in this study are currently operating over-capacity,
with the result that they might not have been as efficient as they were designed to be. These are
areas that deserve further study. Nevertheless, conservative assumptions were applied, and we
are confident that the estimates are in the right order of magnitude.
Because of the economy of scale and the lack of data on the removal of nitrogen in the
form of nitrates and nitrites, it was not possible to derive the marginal cost of removal of

Environment for Development Turpie et al.
18
different substances. The assumption that the average cost of treatment can be attributed to
nitrogen might produce an overestimate of value. This is particularly the case if the assumption
that total phosphorus removal is correlated with nitrogen removal is relaxed. If wetlands do not
remove phosphorus, then water treatment would still be necessary and the wetlands would not
perform a cost-saving service. Thus, the value estimates in this study must be viewed with
caution and taken only to be potential values of the service.
4.4 Scale of Study
This study allows wetlands to be valued at the subcatchment level—assigning an average
value per hectare to all wetlands in a particular subcatchment. In reality, the service performed
will vary among the wetlands, depending on their position in the landscape, their type, and their
condition. Nevertheless, understanding value at this scale may be useful in prioritizing
conservation and restoration action or in analyzing broad-scale conservation trade-offs. In order
to estimate value on a more local scale, it would be necessary to assess the relative value of
different types of wetlands, the influence of their position in the landscape, and the influence of
their condition (Kotze et al. 2008; Turpie et al. 2009).
5. Conclusion
Although in need of further investigation and refinement, the findings of this study
suggest that wetlands should be given considerably more attention in land-use planning and
regulation. If current trends are allowed to persist, then in-stream water quality problems already
being experienced over much of South Africa will be exacerbated. Given the potentially high
value of wetlands, particularly in stressed catchments, efforts should be made to regulate their
protection and, where possible, to incentivize this. Indeed, the results of this study suggest that
the services provided by wetlands could be sufficiently valuable to warrant the introduction of a
payments-for-ecosystem-services mechanism, in which downstream users contribute to the
protection of catchment area wetlands.
Environment for Development Turpie et al.
19
References
Barbier, E.B. 1993. Sustainable Use of Wetlands: Valuing Tropical Wetland Benefits—
Economic Methodologies and Applications. The Geographical Journal 159: 22–32.
Barbier, E., M.C. Acreman, and D. Knowler. 1997. Economic Valuation of Wetlands: A Guide
for Policy Makers and Planners. Gland, Switzerland: Ramsar Convention Bureau.
Batty, L.C., L. Atkin, and D.A.C. Manning. 2005. Assessment of the Ecological Potential of
Mine-Water Treatment Wetlands Using a Baseline Survey of Macroinvertebrate
Communities. Environmental Pollution 138: 412–19.
Bergstrom, J.C., and J.R. Stoll. 1993. Value Estimator Models for Wetlands-Based Recreational
Use Values. Land Economics 69: 132–37.
Bowers, J. 1983. Economics and Conservation: The Case of Land Drainage. In Conservation in
Perspective, edited by A. Warren and F.B. Goldsmith, 375–89. John Wiley & Sons Ltd.
Cooke, C.D., E. Welch, S. Peterson, and S. Nichols. 2005. Restoration and Management of
Lakes and Reservoirs. London: Taylor and Francis.
Costanza, R., R. d’Arge, R. de Groot, S. Farber, M. Grasso, B. Hannon, K. Limburg, S. Naeem,
R.V. O’Neill, J. Paruelo, R.G. Raskin, P. Sutton, and M. van den Belt. The Value of the
World’s Ecosystem Services and Natural Capital. Nature 387: 253–59.
DWAF (Department of Water Affairs and Forestry). 1996. Water Quality Guidelines. Vols. 1–7.
Pretoria, South Africa: DWAF.
Ellery, W.N., S.E. Grenfell, M.C. Grenfell, C. Jaganath, H. Malan, and D. Kotze. 2009. A
Method for Assessing Cumulative Impacts on Wetland Functions at the Catchment or
Landscape Scale. WRC Report K5/1584. Pretoria, South Africa: Water Research
Commission.
Emerton, L. 1998. Economic Tools for Valuing Wetlands in Eastern Africa. Nairobi, Kenya:
IUCN Eastern Africa Regional Office.
Emerton, L., L. Iyango, P. Luwum, and A. Malinga. 1999. The Present Economic Value of
Nakivubo Urban Wetland, Uganda. Kampala, Uganda: IUCN.
James, R.F. 1991. Wetland Valuation: Guidelines and Techniques. PHPA/AWB Sumatra
Wetland Project Report, no.31. Bogor, Indonesia: Asian Wetland Bureau.
Environment for Development Turpie et al.
20
Job, N., K. Snaddon, E. Day, J. Nel, and L. Smith-Adoa. 2008. Freshwater Ecosystems of the
North-West Sandveld and Saldanha Peninsula Planning Domain. Produced for
CapeNature. Cape Town, South Africa: C.A.P.E. Fine-Scale Biodiversity Planning
Project.
Jordan, T.E., D.F. Whigham, K.H. Hofmockel, and M.A. Pittek. 2003. Nutrient and Sediment
Removal by a Restored Wetland Receiving Agricultural Runoff. Journal of
Environmental Quality 32: 1534–47
Kadlec, R.H., and R.L. Knight. 1996. Treatment Wetlands. Boca Raton, FL, USA: CRC Press.
Kotze, D.C., G.G. Marneweck, A.L. Batchelor, D.S. Lindley, and N.B. Collins. 2008. WET-
EcoServices: A Technique for Rapidly Assessing Ecosystem Services Supplied by
Wetlands. WRC Report TT 339/08. Pretoria, South Africa: Water Research
Commission.
Pearce, D.W., and R.K. Turner. 1990. Economics of Natural Resources and the Environment.
Hertfordshire, UK: Harvester Wheatsheaf.
Peltier, E.F., S.M. Webb, and J.-F. Gaillard. 2003. Zinc and Lead Sequestration in an Impacted
Wetland System. Advances in Environmental Research 8: 103–112
SANBI. 2009. Proposed National Wetland Classification System for South Africa. Final Project
Report. Prepared by the Freshwater Consulting Group (FCG). Pretoria, South Africa:
SANBI
Thullen, J.S., J.J. Sartoris, and S.M. Nelson. 2005. Managing Vegetation in Surface-Flow
Wastewater-Treatment Wetlands for Optimal Treatment Performance. Ecological
Engineering 25: 583–93.
Turner, R.K., J.C.J.M. van den Bergh, T. Söderqvist, A. Barendregt, J. van der Straaten, E.
Maltby, and E.C van Ierland. 2000. The Values of Wetlands: Landscape and Institutional
Perspectives. Ecological-Economic Analysis of Wetlands—Scientific Integration for
Management and Policy. Ecological Economics 35 (special issue): 7–23.
Turpie, J.K, A. Menayas, S. Dures, J.M. Shaw, C. Meek, J. Cordingley, M. Hamann, T.
Mzumara, T. Musvuugwa, A. Louw, A. Bewana, T. Quayle, and T. Ditlhobolo. 2009.
The Nature, Distribution, and Value of Ecosystem Services in South Africa. Unpublished
paper. Percy FitzPatrick Institute, University of Cape Town, South Africa.

Environment for Development Turpie et al.
21
Turton, A. 2008. Three Strategic Water Quality Challenges that Decision-Makers Need to Know
About and How the CSIR Should Respond. Unpublished manuscript. Council for
Scientific and Industrial Research, Pretoria, South Africa.
Verhoeven, J.T.A., B. Arheimer, C. Yin, and M.M. Hefting. 2006. Regional and Global
Concerns over Wetlands and Water Quality. Trends in Ecology and Evolution 21: 96–
103.
Walmsley, R.D. 1991. Stream Environments and Catchment Processes: A South African
Perspective. In Water Allocation to the Environment: Proceedings of an International
Seminar and Workshop, edited by J.J. Pigram and B.P. Hooper, 45–57. Armidale,
Australia: University of New England, Center for Water Policy Research.
Young, L.J., E. Roeder, and E. Ursin. 2008. Nitrogen Input Assessment for the Wekiva Study
Area. Educational poster for the Florida Department of Health, prepared by University of
Florida, Institute for Food and Agricultural Sciences, Gainesville, FL, USA.
Zucchini, W., O. Nenadić, and G. Kratz, 2009. South Africa Rain Atlas website. A Web-Based
Rainfall Atlas for Southern Africa. http://134.76.173.220/rainfall/index.html. Accessed
June 2010.