estimation of stature from foot and shoe length: …neiai.org/neiai/uploads/kent...
TRANSCRIPT

1
Estimation of Stature from Foot and Shoe Length:
Applications in Forensic Science
Brenda M. A. Rohren , M.A.1
Nebraska Wesleyan University
Department of Forensic Science, 5000 Saint Paul Avenue, Lincoln, Nebraska 68504-27941
RUNNING HEAD: Estimation of Stature from Foot and Shoe Length

Estimation of Stature from Foot and Shoe Length 2
ABSTRACT: Because time is a critical factor in crime scene investigation, rapid identification
of suspects is important. Stature is one describing characteristic that is used. In the mid-1800s,
Topinard developed a mathematical formula for estimating a person’s height from a foot print
(foot length:stature ratio) and determined this ratio to be 15%. Because Topinard’s formula was
developed over 150 years ago, is this a still valid and reliable formula to estimate stature in the
early 21 century? What is a comparable ratio for computing stature estimations based on shoest
length? Which stature estimation is of better predictive value in forensic sciences? An
experiment was conducted with 40 subjects. The foot length:stature ratio was determined to be
14.73% and the shoe length:stature ratio was 16.63%. The resulting correlation coefficients
indicated that although both foot and shoe lengths have positive correlations in stature
estimation, foot length is a better predictor of stature.
KEYWORDS: forensic sciences, stature, height estimation, foot length, footprints, shoe length,
shoeprints, humans, suspect identification

Estimation of Stature from Foot and Shoe Length 3
Estimation of Stature from Foot and Shoe Length:
Applications in Forensic Science
Time is a critical factor when a crime has been committed and the investigation begins.
The crime scene investigator needs to make rapid and accurate assessments in the field such as
identifying possible suspects, especially when the crime is a violent one such as homicide.
When processing a crime scene, many variables are usually not known about the suspect.
There may be few (if any) witnesses and the perpetrator seldom leaves behind specific
identifying information (e.g., driver’s license). Information about the perpetrator’s identity is
therefore deduced from the evidence left at the scene. A person’s height (i.e., stature) is one
identifying characteristic that is often used (1).
Many different parts of the body can be used to estimate stature. In forensic anthropology,
a common method of estimating stature of victims is to measure the long bone length and
extrapolating the data (1). Measurements of other body parts such as lower leg length, arm span,
and hand span can also be used (2-5) However, the aforementioned measurements are generally
not available about the perpetrator based on evidence left at the scene. Therefore, evidence that
is more readily available is needed to estimate stature.
Evidence that a suspect leaves at a crime scene is likely to include foot or shoe prints.
Because foot length has a biological correlation with stature, the latter can be estimated from foot
or shoe prints (2, 4-17). This evidence may provide the best (or only) opportunity to predict that
aspect of a suspect’s physical description (12). It can also be used to corroborate height estimates
obtained from witnesses (13).
When a foot or shoe print is found at the crime scene, it is photographed and a cast of the
print is made (18, 19). The photographs and cast are then used to provide information about the
person’s identity. Class and individual characteristics of a shoe print can be analyzed to provide

Estimation of Stature from Foot and Shoe Length 4
clues related to the suspect’s identity. However, this information is generally not readily
available at the scene. Therefore, it is more helpful for crime scene investigator to rely on
mathematical formulas to quickly estimate the suspect’s height based on the available foot and
shoe print measurements.
Hypothesis 1
In the mid-1800s, Topinard developed a simple mathematical formula for estimating a
person’s height from a foot print (16). This is referred to as the stature-foot length index (or foot
length:stature ratio) and is calculated as follows: Foot Length / Stature = 15% (11, 14, 16).
Research has shown that there are many factors which influence changes in the size and
morphology of the foot such as: sex, weight, pregnancy, nutrition, age, genetics, disease,
regional and ethnic variations due to heredity, and various environmental conditions such as
climate (9-10, 14, 20-23). (See also the Comments section on Table 1.) Because Topinard’s
formula was developed over 150 years ago, is this a still valid and reliable formula to estimate
stature? If not, what would be a more accurate formula? The research (or alternate) hypothesis
1 0(H ) and the null hypothesis (H ) are:
1H Foot Length / Stature � 15%
0H Foot Length / Stature ' 15%
Hypothesis 2
A review of the literature reveals multiple references to the ratio of foot length to stature.
However, only one reference could be found regarding a similar ratio formula for the calculation
of shoe length and stature (8). Therefore, an additional question is posed: What is the shoe
2 0length:stature ratio? The research (alternate) hypothesis (H ) and the null hypothesis (H ) are:
2H Shoe Length / Stature � 17%
0H Shoe Length / Stature ' 17%

Estimation of Stature from Foot and Shoe Length 5
Comparison of Foot and Shoe Length as Best Estimation of Stature
As indicated previously, a significant amount of research has been conducted on the
relationship between foot length and stature. Some of this research has also focused on the
correlation between shoe length and stature. Although the correlation coefficients have been
provided for each, a literature review indicated comparatively few specific comparisons of the
two as to which is a better predictor of stature (3, 14,15, 17). Therefore, this element was added
to the current study and the results will be reviewed in the Discussion section.
Method
For this experiment, 40 individuals were randomly selected and asked to participate in the
study. As indicated in Table 1, slightly more than half of the subjects were women and the
remainder were men (21 women and 19 men). Because foot length does not typically stabilize
until adulthood (9), only individuals who were 18 years of age or older were invited to
participate. The Ethics section of this report reviews how subjects were identified and selected.
Although it was desired that a diverse group of subjects be involved in the study, 90% of
the individuals were Caucasian and only 10% were of other racial groups (primarily Hispanic).
More diversity was displayed regarding ages of the subjects: the age range was between 18 and
67 (the mean was 36 and the median was 32).
Each subject was first asked to provide age, race/ethnicity, shoe size and to state at what
age his/her foot stabilized to this shoe size. Then the measurement of height (in inches) was
obtained using a standard tape measure. All of this information was recorded on the Data
Collection Form (Appendix A).
In order to obtain the foot and shoe length measurements, the Data Collection Form was
then placed on the floor. The subject was first asked to place a foot (typically the right foot) on

Estimation of Stature from Foot and Shoe Length 6
the paper and an outline of the shoe was traced. Then the person was asked to remove his or her
shoe and sock. The bare foot was then traced on the opposite side of the paper. (Refer to the
Ethics section for accommodations made for some subjects.)
Measurements were then taken from the outlines of the foot and shoe as traced onto the
Data Collection Form. Foot length was determined to be the distance between the extreme point
of the longest toe (Acropodion) and the extreme point of the heel (Pternion) when the foot was
fully stretched (9, 14). Shoe length was determined to be the distance between the heel of the
shoe and the extreme point of the shoe (i.e., the most anterior and posterior points of the shoe).
All measurements for height, foot length, and shoe length were obtained in inches. Prior to
statistical computation, the measurements were converted to centimeters (1 inch = 2.54
centimeters).
Ethics
The majority of the subjects (about 75%) were co-workers of the investigator. They were
approached individually and the purpose and nature of the experiment were explained. The
agency director was informed about the study and he approved the involvement of the
investigator’s co-workers.
The remainder of the subjects were students at a local community college who were
enrolled in classes taught by the investigator. Prior to recruiting student volunteers, the
chairperson of the department was contacted. The purpose and nature of the experiment were
explained to him and approval was given for students to participate in the study.
Regarding informed consent, individuals were asked to participate in a study that involved
obtaining measurements of foot length, shoe length, and height. None of the individuals who
were asked to participate in the study were coerced in any way or provided a reward for their
involvement. It should be noted that several students asked if they could receive extra credit for

Estimation of Stature from Foot and Shoe Length 7
participating and were told that they would not. Their participation was voluntary and data was
collected before or after class sessions.
Due to the nature of the project (an informal course assignment), it seemed important to
respect the boundaries of the volunteer participants. Therefore, as the foot length data was being
collected (i.e., foot prints were traced on the paper), some individuals were allowed to trace their
own bare foot while the investigator observed. In several cases, the subject was allowed to keep
the sock on the foot as the measurement was taken due to the individual’s concern about the
appearance of his/her foot (e.g., warts). If this had been a more formal experiment, the
investigator (or other approved staff) would have taken all of the measurements and ensured
more consistent collection of data. In addition, socks would have been removed from the
measured foot of all subjects.
Statistics
Once the measurements of stature, foot length, shoe length and other information were
obtained, this data was entered into an Excel worksheet (Table 1). A statistical analysis was
performed on all measurements (except stated shoe size) in order to determine the following:
minimum, maximum, mean, median, mode, and standard deviation (to include +/- 2).
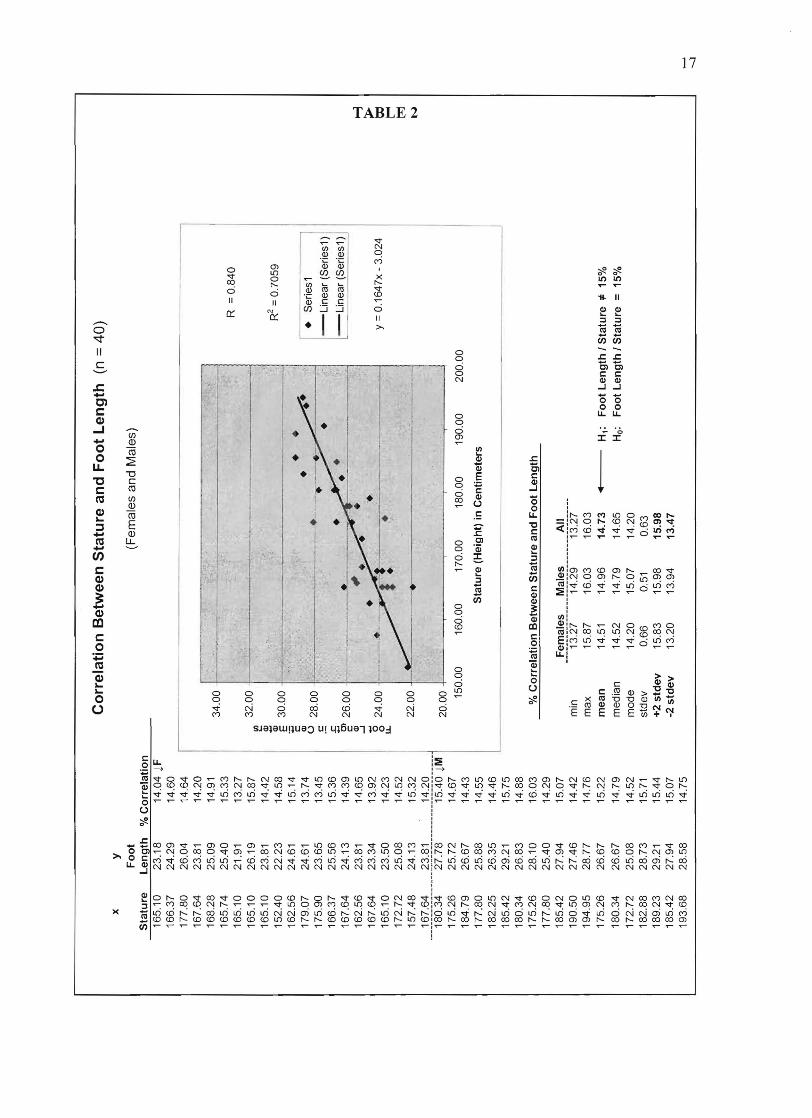
After Table 1 was constructed, scatter diagrams were then drawn on separate Excel
worksheets showing the relationship between foot length/stature (Table 2) and shoe
length/stature (Table 3). A best fit line was calculated for each diagram. (The slopes of these
lines are representative of the average foot or shoe length for each subject expressed as a
percentage of their height.) Correlations between stature and foot or shoe measurements were
established statistically using the Pearson correlation coefficient (r).
As most research on stature estimations based on foot or shoe length provides separate
statistics for females and males, these separate calculations are also provided in Tables 2 and 3

Estimation of Stature from Foot and Shoe Length 8
for the following: minimum, maximum, mean, median, mode, and standard deviation (to include
+/- 2). The respective research (alternate) hypotheses and null hypotheses were indicated on each
table.
Results
Hypothesis 1
As indicated in Tables 1 and 2, the mean foot length:stature ratio of the 40 subjects was
014.73%. Therefore, the null hypothesis (H Foot Length / Stature ' 15%) is rejected and the
1research (alternate) hypothesis is accepted (H Foot Length / Stature � 15%).
Hypothesis 2
As indicated in Tables 1 and 3, the mean shoe length:stature ratio of the 40 subjects was
016.63%. Therefore, the null hypothesis (H Foot Length / Stature ' 17%) is rejected and the
1research (alternate) hypothesis is accepted (H Foot Length / Stature � 17%).
Comparison of Foot and Shoe Length as Best Estimation of Stature
In the study of 40 subjects, the correlation coefficient (r) for estimation of stature using foot
length was 0.8402 and the correlation coefficient (r) for estimate of stature using shoe length was
0.8135. These indicate that both measurements are positively correlated with estimation of
stature. However, as the foot length:stature correlation coefficient has a value closer to +1, this
indicates that a measurement of foot length provide a more accurate estimation of stature than
does shoe length. (A perfect positive linear correlation is indicated by a value of +1).
Discussion
Hypothesis 1
At the beginning of this report, the question was posed: “Because Topinard’s formula was
developed over 150 years ago, is this a still valid and reliable formula to estimate stature?” It
was upon this question that the first research hypothesis was based. Because the null hypothesis

Estimation of Stature from Foot and Shoe Length 9
(Topinard’s formula) was rejected, what are the implications of this result for forensic science
application? Should the formula be revised to more accurately reflect the current world
population (i.e., early 21 century vs. mid 19 century)? How do the results of this studyst th
compare to previous research on the topic?
As indicated in Tables 1 and 2, the current experiment of 40 subjects resulted in a mean
foot length:stature ratio of 14.73%. A similar 2002 study conducted by Burke (22 subjects)
indicated a foot length:stature ratio of 15.2% (8). (The mean of the ratios obtained from these
two small studies is 14.97%.) A cross-cultural archival study by Fessler et al. in 2005 of 31
previous experiments conducted with about 12,000 subjects between 1935 and 2001 indicated a
foot length:stature ratio of 14.99% (9). (This information was extrapolated by the author using
information provided in Table 1 of Fessler et al.’s article “Sexual Dimorphism in Foot Length
Proportionate to Stature.”)
In summary, even though the null hypothesis for this experiment was rejected, comparison
with other studies indicates that the foot length:stature ratio of 15% is still a valid measure and
appropriate to use in the field of forensic science today.
Use of a Range Versus an Absolute. Researchers emphasize that stature is not a fixed trait
as this characteristic changes over the course of a lifetime (1). Therefore, it is important that
when providing an estimate of stature of a living person, the measurement is provided as a range.
This is especially true when extrapolating estimates of stature from body measurements such as
foot length which can be also influenced by morphological changes due to pregnancy, culture,
environment, nutrition, disease, etc. (10, 14). (See also the Comments section in Table 1.)
Another factor in support of using range estimates is that errors often occur regarding
stature measurements. For example, American men tend to exaggerate their height on their

Estimation of Stature from Foot and Shoe Length 10
driver’s licenses by as much as 1 or 2 inches (1). This observation became apparent during the
collection of data for this study. Prior to measuring her stature, one subject was asked to provide
information about her height. She hesitated, then asked if she should provide the measurement
she tells to others (5" 5"), or if she should provide her actual height (5' 4").
As indicated in Tables 1 and 2, the current experiment of 40 subjects indicated a foot
length:stature ratio range of 13.27% to 16.03%. Calculation of the standard deviation indicates
that at +/- 2 standard deviations, there is a 95% confidence that accurate estimations of foot
length:stature ratios would be between 13.47% and 15.98%.
The 2002 Burke study provided a foot length:stature ratio range of 13.90% to 16.70% (8).
The 2005 Fessler et al. study provided a foot length:stature ratio range of 14.50% to 16.11% (9).
The foot length:stature ratio range provided by Topinard in the mid-1800s was 14.90% to
18.10% (7). (No information was available about the 95% confidence ranges for these studies)
In summary, even though Topinard’s foot length:stature ratio of 15% appears to still be a
valid estimation of stature, it would seem that the range used in the mid-1800s is no longer
relevant and needs to be revised. It is therefore recommended that a range such as provided by
Fessler et al. (14.50% to 16.11%) be adapted for current use in forensic science applications.
Hypothesis 2
As discussed in the first section of this report, a literature review revealed only one study
which indicated a shoe length:stature ratio (8). Therefore, the question was posed: “What is the
shoe length:stature ratio?”
As indicated in Tables 1 and 3, the current experiment of 40 subjects resulted in a shoe
length:stature ratio of 16.63%. Burke’s 2002 study indicated a ratio of 17.50% (8). The
comprehensive cross-cultural archival study by Fessler et al. in 2005 did not indicate a shoe

Estimation of Stature from Foot and Shoe Length 11
length:stature ratio (9). The mean shoe length:stature ratio of the first two studies was 17.07%.
Therefore, even though the null hypothesis of a shoe length:stature ratio of 17% was rejected, it
would appear that it may indeed be a valuable formula to estimate stature. However, because
conclusions cannot be based solely on two small and informal experiments, more research is
clearly needed in this area.
Use of a Range Versus an Absolute. The current study of 40 subjects indicated a shoe
length:stature ratio range of 14.29% to 18.12%. (See Tables 1 and 3). Calculation of the
standard deviation indicates that at +/- 2 standard deviations, there is a 95% confidence that
accurate estimations of shoe length:stature ratios would be between 14.88% and 18.38%.
No information could be obtained regarding the Tucker and Fessler et al. studies (8, 9).
Therefore, more research is needed to provide valid and reliable shoe length:stature ratio ranges.
Comparison of Foot and Shoe Length as Best Estimation of Stature
The results of the study of 40 subjects indicated a higher positive correlation between foot
length and stature than for shoe length and stature. This is consistent with the findings of other
researchers (3, 14, 15, 17). Therefore, it is recommended that preference be given to foot length
measurements in estimating stature whenever possible.
Acknowledgments
The author would like to thank several people for their support and encouragement:
Charlyn Shickell, Ph.D. (Community Mental Health Center) and Dave Lamb, B.A. (Southeast
Community College) who are supervisors of the author; and Butch Rohren (the author’s
husband). All have been very patient and understanding with the need to have a flexible
schedule. The author would also like to acknowledge Larry Barksdale (forensic science
instructor at Nebraska Wesleyan University) for providing the opportunity and motivation to
conduct an experiment using statistical calculations (which she has been avoiding doing for over
20 years).

Estimation of Stature from Foot and Shoe Length 12
References
1. Sorg, MH. Forensic Anthropology. In: James SH, Nordby JJ, editors. Forensic science:
an introduction to scientific and investigative techniques. Boca Raton, FL: Taylor &
Francis, 2005; 99-118.
2. Ozaslan A, Koc S, Ozaslan I, Tugcu H. Estimate of stature from upper extremity. Mil Med
2006 Apr;171(4):288-91.
3. Byers S, Akoshima K, Curran B. Determination of adult stature from metatarsal length.
Am J Phy Anthropol 1989 Jul;79(3):275-9. (Abstract)
4. Han TS, Lean ME. Lower leg length as an index of stature in adults. Int J Obes Relat
Metab Disord 1996 Jan;20(1):21-7. (Abstract)
5. Oommen A, Mainker A, Oommen T. A study of the correlation between hand length and
foot length in humans. J Anat Soc India 2005;54(2):55-57.
6. Saxena SK. A study of correlations and estimation of stature from hand length, hand
breadth and sole length. Anthropol Anz 1984 Dec;42(4):271-6. (Abstract)
7. Barker SL, Scheuer JL. Predictive value of human footprints in a forensic context. Med
Sci Law 1998 Oct; 38(4):341-6. (Abstract)
8. Burke TR. Tell tale footprints: determination of stature from foot length in forensic cases.
California State Science Fair, Project Number J1003; 2002 Apr [Abstract]. Retrieved
August 13, 2006, from http://www.usc.edu/CSSF/History/2002/Projects/J1003.pdf
(Abstract)
9. Fessler DMT, Haley KJ, Roshni DL. Sexual dimorphism in foot length proportionate to
stature. Annals of Hum Bio 2005 Jan-Feb;32(1):44-59.

Estimation of Stature from Foot and Shoe Length 13
10. Fessler DMT, Nettle D, Afshar Y, Pinheiro IDA, Bolyanatz A, Mulder MB, Cravalho M,
Delgado T, Gruzd B, Correia MO, Khaltourina D, Korotayev A, Marrow J, de Souza LS,
Zbarauskaite A. A cross-cultural investigation of the role of foot size in physical
attractiveness. Arch Sex Beh 2005 Jun;34(3):267-276.
11. Forensic Sciences: A crime scene investigation unit for senior 3 current topics in the
sciences. Retrieved September 1, 2006, from http://www.edu.gov.mb.ca/k12/cur/
science/found/c_ topics30s/forensics_unit.pdf
12. Giles, E, Vallandingham, PH. Height estimation from foot and shoeprint length. J
Forensic Sci 1991 Jul; 36(4):1134-51. (Abstract)
13. Gordon CC, Buikstra JE. Linear models for the prediction of stature from foot and boot
dimensions. J Forensic Sci 1992 May; 37(3):771-82. (Abstract)
14. Jasuja OP, Singh J, Jain M. Estimation of stature from foot and shoe measurements by
multiplication factors: a revised attempt. Forensic Sci Int 1991 Sep;50(2):203-15.
15. Ozden H, Balci Y, Demirustu C, Turgut A, Ertugrul M. Stature and sex estimate using foot
and shoe dimensions. Forensic Sci Int 2005 Jan 29; 147(2-3):181-4. (Abstract)
16. Robbins LM. Estimating height and weight from size of footprints. J Forensic Sci 1986
Jan;31(1):143-52. (Abstract)
17. Sanli SG, Kizilkanat ED, Boyan N, Ozsahin ET, Bozkir MG, Soames R, Erol H, Oguz O.
Stature estimation based on hand length and foot length. Clin Anat 2005 Nov; 18(8):589-
96. (Abstract)
18. Bodziak WJ. Forensic footwear evidence. In: James SH, Nordby JJ, editors. Forensic
science: an introduction to scientific and investigative techniques. Boca Raton, FL: Taylor
& Francis, 2005; 361-375.

Estimation of Stature from Foot and Shoe Length 14
19. Byrd M. Crime scene evidence: a guide to the recovery and collection of physical
evidence. Wildomar, CA: Staggs Publishing, 2001.
20. Ashizawa K, Kumakura C, Kusumoto A, Narasaki S. Relative foot size and shape to
general body size in Javanese, Filipinaas and Japanese with special reference to habitual
footwear types. Annals of Human Bio 1997 Mar-Apr;24(2):117-129. (Abstract)
21. Kulthanan T, Techakampuch S, Donphongam N. A study of footprints in athletes and non-
athletic people. J med Assoc Thai 2004;87(7):788-93.
22. Wunderlich RE, Cavanagh PR. Gender differences in adult foot shape: implications for
shoe design. Med Sci Sports Exerc 2001 Apr;33(4):605-611. (Abstract)
23. Yuk San Tsung B, Zhang M, Bo Fan Y, Boone DA. Quantitative comparison of planar foot
shapes under different weight-bearing conditions. J of Rehab Res and Dev 2003
Nov/Dec:40(6):517-526.

Estimation of Stature from Foot and Shoe Length 15
APPENDIX A
Foot and Shoe Length Data Collection Form
Measurement # : ____ Age: ____ Race/Ethnicity: ___________________ Height: ______ Shoe Size: _____ since age ___
footprint ______ length in cm
shoeprint ______ length in cm
Note. This appendix is representative of the form that was used to collect information about foot
length, shoe length, and other relevant information. The data collection form was printed on
legal size paper (the shoeprint was on the reverse side of the sheet).

Est
imat
es o
f Sta
ture
Bas
ed o
n F
oo
t L
eng
th a
nd
Sh
oe
Len
gth
Le
ng
th o
f L
en
gth
of
Sta
ted
S
ho
e S
ize
F
oo
t L
en
gth
Sh
oe
Le
ng
th
Pe
rso
n
Se
x A
ge
R
ace
/Eth
nic
ity
He
igh
t F
oo
tpri
nt
Sh
oe
pri
nt
Sh
oe
Siz
e
at A
ge
of
.~ o
f Sta
ture
%
of
Sta
ture
C
om
me
nts
1 F
47
C
auca
sian
1
65.
10
23.1
8 2
4.7
7 7
11
14
.04
15
.00
2 F
19
C
auca
sian
16
6.37
2
4.2
9 28
.58
9 1
4
14
.60
1
7.1
8
3 F
2
0
Ca
uca
sia
n
17
7.8
0
26
.04
2
5.4
0
10
16
1
4.6
4
14
.29
4 F
27
C
au
casi
an
1
67.
64
2
3.8
1 2
6.6
7
8 1
6
14
.20
1
5.9
1 5
F
19
Ca
uca
sia
n
168
.28
25
.09
26.
67
9
14
1
4.9
1 1
5.8
5 6
F
21
Cau
casi
an
16
5.74
25
.40
27
.94
8
.5
13
15.
33
1
6.86
7
F
32
H
ispa
nic
165
.10
21
.91
27.9
4
8 2
0
13.
27
1
6.9
2
8 F
19
C
au
casi
an
1
65.
10
2
6.1
9 28
.89
11
13
15
.87
17
.50
9 F
2
7
Na
t Am
!His
p
165
.10
23
.81
27.9
4
8 13
1
4.4
2
16
.92
1
0
F
18
C
au
casi
an
15
2.4
0 22
.23
25
. 88
9.5
16
1
4.5
8 1
6.9
8 11
F
2
6
Ca
uca
sia
n
162
.56
2
4.6
1 2
5.4
0
8.5
2
2
15.
14
1
5.6
3
12
F
36
C
au
casi
an
1
79.
07
24
.61
28
.10
9
15
1
3.7
4 1
5.6
9
13
F
28
C
au
casi
an
17
5. 9
0
23.6
5
27
.62
9
14
1
3.4
5
15
.70
14
F
29
C
au
casi
an
16
6.3
7
25.5
6 2
6.5
1 8
.5
14
1
5.38
1
5.9
3
15
F 58
C
auca
sian
16
7.6
4
24.1
3 2
6. 5
1 7
20
1
4.3
9 1
5.81
1
6
F
30
H
ispa
nic
162
.56
23.8
1 28
.42
9 2
0
14
.65
1
7.4
8
17
F
23
C
auca
sian
1
67.
64
23
.34
2
6. 5
1 8
14
13
.92
1
5.8
1 18
F
26
Cau
casi
an
165.
10
23.5
0 26
.04
8
14
14
.23
1
5.7
7 1
9
F 4
7
Ca
uca
sia
n
172
.72
25
.08
26.9
9 1
0
18
14
.52
15
.63
20
F
38
Cau
casi
an
157
.48
24
.13
25
.08
7.5
16
1
5.3
2
15.
93
21
F 19
C
auca
sian
16
7.6
4
23. 8
1 2
7.9
4
10
13
1
4.2
0
16
.67
22
M
6
7
Cau
caS
ian
180.
34
27
.78
31 .2
7
11
35
15
.40
1
7.3
4
23
M
47
C
au
casi
an
1
75.
26
2
5.7
2 2
9.6
9
9 2
0
14
.67
1
6.9
4
24
M
41
C
auca
sian
1
84.
79
26
.67
31 .2
7 11
2
0
14.
43
1
6.9
2 25
M
4
2
Cau
casi
an
177
.80
25
.88
31.7
5
10
1
6
14
.55
1
7.8
6
26
M
4
8
Cau
casi
an
182
.25
26
.35
31
.43
1
0
19
14.4
6 17
.25
27
M
3
4
Ca
uca
sia
n
185.
42
29.2
1 31
.91
13
13
15
.75
17
.21
28
M
26
C
auca
sian
18
0.3
4
26
.83
31 .7
5 11
17
1
4.8
8 1
7.61
2
9
M
29
C
auca
sian
1
75.
26
28.1
0
30
.96
1
0.5
18
16
.03
1
7.66
30
M
6
0
Ca
uca
sia
n
177
.80
2
5.4
0
29.6
9 9
.5
16
1
4.2
9 1
6.7
0 31
M
48
C
au
casi
an
1
85.
42
27
.94
31
.43
11
17
1
5.0
7 1
6.9
5
32
M
30
C.a
ucas
ian
190
.50
27.4
6 31
.43
11
17
1
4.4
2
16
.50
33
M
4
3
Cau
casi
an
194
.95
28.7
7 31
.59
12
18
1
4.7
6 1
6.2
1 34
M
5
4
Cau
casi
an
175
.26
26.6
7
31.7
5
10
4
0
15
.22
18
.12
35
M
31
C
auca
sian
18
0.3
4
26.6
7 32
.39
10.5
1
5
14.7
9 1
7.9
6
36
M
4
2
Cau
casi
an
172
.72
25
.08
27
.62
9 18
1
4.5
2 1
5.9
9
37
M
21
B
lack
18
2.88
28
.73
31 .7
5 1
2.5
19
1
5.7
1 1
7.3
6 38
M
5
9
Cau
casi
an
189
.23
29.2
1 31
.27
11
18
1
5.4
4
16.5
3
39
M
58
C
auca
sian
18
5.4
2
27.9
4 31
.27
11
.5
25
1
5.0
7
16
.87
4
0
M
42
C
auca
sian
19
3.6
8 28
.58
34
.45
1
4
18
14
.75
1
7.7
9
min
18
15
2.40
21
.91
24
.77
11
13.
27
1
4.29
m
ax
67
19
4.95
29
. 21
34.4
5
40
16
.03
1
8.1
2
me
an
3
6
174
.32
25.6
8 29
. 01
18
14.7
3 16
.63
m
ed
ian
32
17
5.26
28
.50
28.5
0 16
.5
14.
65
16
.86
mo
de
19
16
5.10
23
. 81
27
.94
14
1
4.2
0
16
.92
st
de
v 13
.67
10.0
7 1.
97
2
.54
5.4
8
0.6
3
0.8
7
+2
std
ev
63
.06
19
4.47
29
.63
34
.08
28.5
8 1
5.98
18
.38
·2 s
tde
v
8.3
9 1
54.
18
21.7
3 2
3.9
4
6.6
7
13
.47
14
.88
foo
tle
ng
th is
lo
ng
er t
han
sho
e le
ngth
; sh
e w
ore
3"
heel
s
shoe
siz
e w
as
6.5
at
age
18, t
he
n f
oo
t g
rew
dur
ing
pre
gn
an
cy
shoe
siz
e w
as
10
.5 a
t ag
e 1
6,t
he
nfo
otg
rew
late
rin
life
shoe
siz
e w
as 9
at
age
2O
,th
en
foo
tgre
wla
teri
n li
fe
No
tes
: 1.
M
ea
sure
me
nts
for
he
igh
t, f
oo
t le
ngth
, an
d sh
oe le
ngth
ar
e in
cen
timet
ers
(cm
) 2
. S
tatis
tical
cal
cula
tions
are
no
t pr
ovid
ed f
or
shoe
siz
e as
th
e w
om
en
's s
hoe
size
s w
ere
no
t co
nver
ted
to a
co
mm
on
st
anda
rd (
i.e.,
me
n's
sho
e si
zes)
.
~ 6; t""I
M -
tI1
en .... 13' a .....
o ::s o .....,
r/)
~.
<Ii i:i1
o :3 "Tj
o o .... ~ 0
r/)
::
r' o <Ii L' g os.
......
0\
Co
rrel
atio
n B
etw
een
Sta
ture
an
d F
oo
t L
eng
th
(n =
40
) x
y
Fo
ot
(Fem
ales
and
Mal
es)
Sta
ture
L
en
gth
%
Co
rre
lati
on
16
5.10
23
.18
14
.04
1F
16
6.3
7 24
.29
14.6
0 17
7.8
0 26
.04
14.6
4 16
7.6
4 23
.81
14.2
0 16
8.28
25
.09
14.9
1 34
.00
165
.74
25.4
0 15
.33
\-"
R =
0.8
40
165
.10
21.9
1 13
.27
32.0
016
5.10
2
6.1
9 15
.87
~
Q)
165
.10
23.8
1 14
.42
" Q)
R2
= 0
.705
9 15
2.40
2
2.2
3
14.5
8 ~
30.0
0 I
•'
,--,
--.
~t-
---:'---
•
------
-:----
----'-
'.~
-::?"
' 16
2.56
24
.61
15.1
4 t:
17
9.07
24
.61
13.7
4 I
• S
erie
s1
IuQ
) 28
.00
175.
90
23.6
5 13
.45
t:
-Lin
ea
r (S
eri
esl
)16
6.37
2
5.5
6
15.3
6 .r:
. -L
ine
ar
(Se
rie
sl)
167.
64
24.1
3 14
.39
g, 26
.00
,..,Q
)16
2.5
6 23
.81
14.6
5 ...
J
167
.64
23.3
4 13
.92
6;g
24.0
0 y
=0.
1647
x -
3.02
4 16
5.1
0 2
3.5
0
14.2
3 lL
. t"'
"17
2.72
2
5.0
8
14.5
2 M
22
.00
157.
48
24.1
3 15
.32
N
167
.64
23.8
1 14
.20
.---f80.-34
------2T78---------:,-5~40-iM-
20.0
0 17
5.2
6 25
.72
14.6
7 15
0.00
16
0.0
0 17
0.00
18
0.00
19
0.0
0 20
0. 0
018
4.79
2
6.6
7
14.4
3 S
tatu
re (
He
igh
t) i
n C
en
time
ters
177
.80
25
.88
14
.55
182.
25
26.3
5 14
.46
185.
42
29.2
1 15
.75
180.
34
26.8
3 14
.88
175.
26
28.1
0 16
.03
% C
orr
ela
tio
n B
etw
ee
n S
tatu
re a
nd
Fo
ot
Le
ng
th
177.
80
25
.40
14
.29
185.
42
27.9
4 15
.07
Fe
ma
les
Ma
les
All
----fi2i-------1~f.29-------13
.-2y---
190
.50
27
.46
14
.42
min
19
4.95
28
.77
14.7
6 m
ax
15.8
7 16
.03
16.0
3 17
5.26
26
.67
15.2
2 m
ea
n
14.5
1 14
.96
14
.73
....~--
H1
: F
oo
t L
en
gth
I S
tatu
re '
" 15
%
180.
34
26
.67
14
.79
med
ian
14.5
2 14
.79
14.6
5 H
o:
Fo
ot
Le
ng
th I
Sta
ture
= 1
5%
172.
72
25.0
8 14
.52
mo
de
14
.20
15.0
7 14
.20
182.
88
28.7
3 15
.7 1
st
de
v 0
.66
0.51
0
.63
189.
23
29.2
1 15
.44
+2 s
tde
v 15
.83
15.9
8 15
.98
185.
42
27.9
4 15
.07
-2 s
tde
v 13
.20
13.9
4 13
.47
193.
68
28.5
8 14
.75
--l

Co
rrel
atio
n B
etw
een
Sta
ture
an
d S
ho
e L
eng
th
(n =
40
)
x y
S
ho
e
(Fe
ma
les
and
Mal
es)
S
tatu
re
Le
ng
th
% C
orr
ela
tio
n
16
5.1
0
24.7
7 1
5.0
0 !F
1
66
.37
28
.58
17.1
8 1
77
.80
25
.40
14.2
9 16
7.6
4 26
.67
15
. 91
168
.28
26
.67
15
.85
34
.00+~--·
165
.74
27.9
4 16
.86
~
•
.1 ·
1 R
=
0.8
13
5
16
5.1
0
27. 9
4 16
.92
(/)
32
.00
·1
65
.10
2
8.8
9 17
.50
R2 =
0.6
617
Q;1
65
.10
27
. 94
16
.92
Qj
15
2.4
0
25
.88
16
.98
30. 0
0 ·1
---
1.s
16
2.5
6
25.4
0 15
.63
c
17
9.0
7
28.
10
15.
69
• S
erie
s1~
I c
28.0
0 . ~-.
-•
.+.
1. ..
.;#F
17
5.9
0
27.6
2 15
.70
--
Lin
ea
r (S
erie
s 1)
.t:
:.1
66.
37
26.5
1 1
5.93
--
Lin
ear
(Ser
ies
1)16
7.6
4 2
6. 5
1 1
5.8
1 g,
26.0
0 ·
....,(1
)16
2.5
6
28.4
2 17
.48
...J
•
(1)
167.
64
26.5
1 1
5.81
~
~
24.0
0 y
= 0
.204
7x -
6.67
3 1
65
.10
26
.04
15.7
7 t""
(/)
tr:l
17
2.7
2
26.9
9 1
5.6
3 w
22.0
0 +1
-----.
15
7.4
8
25.0
8 15
.93
1
67
.64
27
. 94
16.6
7 ·---:f80
.34------31~2T--------1T34-iM--
20.0
0 ·
1 -
1
------,.-
---
.---
-_
--
---,.
----
---1
1
75
.26
29
.69
16.9
4 15
0.00
16
0.0
0 17
0.00
18
0.00
19
0.00
20
0.0
0 1
84
.79
31
.27
16.9
2 S
tatu
re (
He
igh
t) i
n C
en
tim
ete
rs1
77
.80
31
.75
17.8
6 1
82
.25
31
.43
17.2
5 1
85
.42
31
.91
17. 2
1 18
0.3
4 31
.75
17.6
1 1
75
.26
30
.96
17.6
6 %
Co
rre
lati
on
Be
twe
en
Sta
ture
an
d S
ho
e L
en
gth
17
7.8
0
29.6
9 16
.70
18
5.4
2
31.4
3 16
.95
Fe
ma
les
Ma
les
All
----1-4~2-9-------15.99-------14~29----
19
0.5
0 31
.43
16.5
0 m
in
194.
95
31 .5
9 1
6.2
1 m
ax
17.5
0 18
.12
18.1
2
17
5.2
6
31 .
75
18.1
2 m
ea
n
16.1
6 1
7.1
4
16.6
3 •
H2
: S
ho
e L
en
gth
I S
tatu
re *
-1
7%
18
0.3
4 32
.39
17.9
6 m
ed
ian
15
.91
17.2
1 16
.86
Ho:
S
ho
e L
en
gth
I S
tatu
re =
17
%
172
.72
27.6
2 1
5.99
m
od
e
16.9
2 17
.91
16. 9
2 1
82
.88
31
.75
17.3
6 st
de
v 0.
83
0.60
0
. 87
189
.23
31 .2
7 16
. 53
+2
std
ev
17.8
2 18
.35
18.3
8 1
85
.42
31
.27
1 6.8
7 -2
std
ev
14.5
1 1
5.94
14
.88
193
.68
34.4
5 17
.79
00