estimation of marketing efficiency of horticultural commodities under different supply chains in
TRANSCRIPT

1
Report of
The Research Study on
Estimation of Marketing Efficiency of Horticultural Commodities
under Different Supply Chains in India
Submitted to
Prof. Ramesh Chand
Director
National Centre for Agricultural Economics and Policy Research
New Delhi – 110 012
2010

2
Study Team
Leader : Dr. M.B. Dastagiri
Senior Scientist, NCAP, New Delhi
Associates : Dr. B. Ganesh Kumar
Senior Scientist, NCAP, New Delhi
Dr. C.V. Hanumanthaiah
Professor, ANGRAU, Hyderabad
Dr. P. Paramasivsm
Professor, TNAU, Chennai
Dr. R.S. Sidhu
Professor & Head, PAU, Ludhiana
Dr. M. Sudha
Principal Scientist, IIHRI, Bangalore
Dr. Khem Chand
Senior Scientist, CAZRI, Rajasthan
Dr. Basantha Singh
Senior Scientist, ICAR-NEH region, Impahal
Dr. Subhasis Mandal
Senior Scientist, CSSRI, Canningtown, W.B.

3
Index
(I) Excuetive Summary 24-32
(II) Indroduction 33-36
(III) Innovative Models in Horticulture Marketing in India 37-54
1) Introduction 38-39
2) Data and Methodology 40
3) Results and Discussion 40-52
3.1. New innovative public marketing models 40
3.2. New Liberalized Innovative Private Retail Marketing models 46
3.3 Features of different models for marketing of
fruits and vegetables: A case study in Hyderabad, A.P. 50
4) Conclusions and policy implications 53
5) References 54
(IV) Estimating Marketing Efficiency of Horticultural
Commodities under Different Supply Chains in India
With special reference to Andhra Pradesh. 55-121
1) Introduction 56-57
1.1 Background 56
1.2 Policy Research Questions 56
1.3 Objectives of the study 57
S.NO CONTENTS PAGE NO

4
2) Data and Methodology 58-63
2.1 Study Area 58
2.2 Data of Items 58
2.3 Sample Size 58
2.4 Sampling Methods 60
2.5 Statistical Techniques 61
3) Results and Discussion 64-110
3.1 Status of the Vegetables Production in Andhra Pradesh 64
3.2. Economics of Vegetables 67
3.3 Marketing of Vegetables 69
3.4. Innovative Models 70
3.5 Market Intermediaries and their Functions 72
3.6 Supply Chains 73
3.7 Produce quantities crop wise handled under different
supply chains 80
3.8. Marketing Cost and Margins. 81
3.9. Market Margin 87
3.10 Price Spread 89
3.11. Share of different agencies in Consumer Rupee. 95
3.12 Marketing Efficiency 96
3.13 Constraints Perceived by Various Stakeholders 101
3.14. Factors affecting marketing cost, margin and efficiency 107
3.15 Suggestions to increase marketing Efficiency 110
4) Conclusions and Policy Implications 111-115
4.1 Conclusions 111
4.2 Policy Implications 114
5) Annexure 116-118

5
6) References 119
(V) Estimating Marketing Efficiency of Horticultural
Commodities under Different Supply Chains in India
With special reference to Karnataka. 120-167
(i) Synthesis on status of marketing of horticultural crops in India 121-134
i. Status of Marketing of horticultural crops 121
ii. Market regulation, status and constraints 123
iii. Contract Farming 127
iv. Efforts at linking farmers to the markets 128
Different Models
v. Comparisons and contrasts between the three models 131
vi. Scope and future perspective 134
1) Estimating marketing efficiency of selected horticultural
Crops along different supply chains in KARNATAKA 135-1138
1.1 Background 135
1.2 Policy research questions 136
1.3 Objective of the study 138
2) Data and Methodology 139-144
2.1 Study Area 139
2.2 Data of Items 139
2.3 Sample Size 140
2.4 Sampling Methods 140
2.5 Statistical Techniques 142
3) Results and Discussion 143-148
3.1 Status of the fruits and vegetables production 143

6
3.2 Marketing of Fruits & vegetables: Innovative models 143
SAFAL
Namdhari Fresh:
Other traditional / non traditional marketing networks:
3.3 Innovative Models 144
3.4 Marketing channels 149
3.5 Supply chains 151
3.6 Price spread and marketing efficiency along the
marketing channels. 151
3.7 Comparison of marketing arrangements and efficiency across
different marketing networks 155
3.8 Constraints in accessing different marketing channels 157
4) Suggestions for improvement 159
5) Conclusions and policy implications 159-160
6) Annexure 161-166
7) References 167
(VI) Estimating Marketing Efficiency of Horticultural
Commodities under Different Supply Chains in India
With special reference to Tamil Nadu. 168-211
1) Introduction 168
1.1 Background 168
1.2 Policy Research Questions 172
1.3 Objectives of the study 173
2) Data and Methodology 174-178
2.1 Study Area 174
2.2 Data of Items 174
2.3 Sample Size 174

7
2.4 Statistical Techniques 175
3) Results and Discussion 178-206
3.1 Marketing of vegetables 178
3.2 Innovative models 180
3.3 Suggestions by stakeholders for improvement 185
3.4 Market intermediaries and their functions 187
3.5 Marketing channels 193
3.6 Marketing cost in different channels 196
3.7 Price spread 199
3.8 Producer share in consumer rupee 201
3.9 Marketing Efficiency 202
3.10 Factors influencing participation in gherkin contract farming 205
4) Conclusions and policy implication 207
5) References 210
(VII) Estimating Marketing Efficiency of Horticultural
Commodities under Different Supply Chains in India
With special reference to West Bengal. 212-260
1) Introduction 214-215
1.1 Background 214
1.2 Policy research question 215
1.3 Objectives of the study 215
2) Data and Methodology 216-221
2.1 Study area 216
2.2 Selection of crops 216
2.3 Sampling methods 216
2.4 Units of Calculation 217

8
2.5 Financial feasibility analysis for Guava 218
2.6 Analytical Framework / Statistical technique 219
2.7 Constraints analysis (Garrett Ranking) 221
3) Results and Discussion 222-237
3.1 Marketing of vegetables/fruits/flowers 222
3.2 Market intermediaries and their function 222
3.3 Supply chain/ marketing channel 223
3.4 Marketing Cost 225
3.5 Marketing Margins 227
3.6 Price spread 230
3.7 Producers’ share in consumer rupee 231
3.8 Marketing efficiency 232
3.9 Factors affecting marketing efficiency of vegetables marketing 233
3.10 Factors affecting marketing efficiency of guava marketing 235
3.11 Factors affecting marketing efficiency of marigold marketing 236
4) Constraint Analysis 238-241
4.1 Constraints faced by the producer 238
4.2 Constraints faced by the middleman 240
5) Suggestion to Improve Marketing Efficiency 241-242
6) Price Movement at Wholesale Market 242-246
7) Alternative Marketing Channel/Organised Retailer 247-252
7.1 Functioning of Metro cash and carry (wholesale) 247
7.2 Key observation on functioning organized retailer 248
7.3 Possible implications of organized retail agricultural marketing
and few issues 250
8) Conclusion and Policy Implications 253-255
9) Annexure 256-259
9
10) References 260
(VIII) Estimating Marketing Efficiency of Horticultural
Commodities under Different Supply Chains in India
With special reference to Manipur and Mizoram. 261-363
1) Introduction 261
1.1 Background 261
1.2 Objectives of the study 263
2) Data and Methodology 264-268
2.1 Crops studied 264
2.2 Sample size for each crop 264
2.3 Methodology and Analytical techniques: 266
2.4 Price Spread 266
2.5 Producer Share in Consumer Rupee 266
2.6 Factors affecting Marketing Efficiency 267
3) Results and Discussion 268-358
3.1 Tomato 268
3.2 Cabbage 287
3.3 Passion Fruit 312
3.4 Anthurium Flower 333
4) Conclusion and Policy Implications 359-361
4.1 Conclusion 359
4.2 Policy Implications 360
5) References 362-363

10
(IX) Estimating Marketing Efficiency of Horticultural
Commodities under Different Supply Chains in India
With special reference to Rajasthan 364-431
1) Introduction 364-365
1.1 Background 364
1.2 Policy research question 365
1.3 Objectives of the study 365
2) Data and Methodology 366-367
2.1 Study Area 366
2.2 Data of Items 366
2.3 Sample Size 366
2.4 Sampling Methods 366
2.5 Statistical Techniques 367
3) Results and Discussion 368-427
3.1 Status of the fruits and vegetables production 368
3.2 Kinnow 369
3.3 Aonla 387
3.4 Carrot 401
3.5 Tomato 413
4) Strategies for increasing marketing efficiency
of fruits & vegetables 428-429
5) References 430-432
11
(X) Estimating Marketing Efficiency of Horticultural
Commodities under Different Supply Chains in India
With special reference to Punjab. 433-501
1) Introduction 434
1.1 Background 434
1.2 Objectives of the study 435
2) Data and Methodology 436-484
2.1 Scenario of area under vegetables 440
2.2 Marketed surplus of vegetables 443
2.3 Sale pattern 445
2.4 Factors affecting marketing efficiency 475
2.5 Production and marketing constraints as perceived by the
selected farmers 478
2.6 Marketing constraints as perceived by the selected farmers
in Apni Mandi 483
2.7 Constraints as perceived by the selected wholesalers in
the market 484
3) Summary and conclusions 485-490
4) Suggestions to improve marketing efficiency 490-491
5) Annexure 492-501
6) References 502

12
List of Table
Innovative Models in Horticulture Marketing in India
1 New liberalized public agricultural marketing institutions 41
in India during WTO regime
2 Growth of India’s Chain food New Liberalized Marketing Institutions 47
3 Marketing functions models of fruits and vegetables under
different supply chains. 51
Andhra Pradesh
1 Crop wise details pertaining to sample design. 59
2 Crop wise Details of Intermediaries Sample Design. 60
3 Vegetable Productivity Scenario (2004-05). 65
4 Vegetable Area and Production trends in Andhra Pradesh. 66
5 Cost of Cultivation of selected crops (2008-09). 68
6 Crop wise sample farmers preferred market channels in the
existing supply chain system. 73
7 Quantities handled in different supply chains in Kgs per day. 80
8 Crop wise Marketing cost and Marketing Margins. 82
9 Marketing cost and Marketing Margin of Selected 87
Fruits & Vegetables.
10A Price Spread of Potato (per Kg.). 90
10B Price Spread of Tomato (per kg.). 91
10 C Price Spread of Baby Corn (Per kg.). 92
10 D Price Spread of Rose (per big bag which consist of 45 mini
bags with 30 to 35 flowers each). 93
10 E Price Spread of Grapes (per kg.). 94
11 Share of different agencies during marketing of selected crops (%). 95
S.No CONTENTS PAGE
NO

13
12 A Measurement of Marketing Efficiency of Potato. 96
12 B Measurement of Marketing Efficiency of Tomato. 97
12 C Measurement of Marketing Efficiency of Baby Corn. 98
12 D Measurement of Marketing Efficiency of Rose. 99
12 E Measurement of Marketing Efficiency of Grape. 100
13 A Constraints perceived by the farmers, wholesalers
and retailers in marketing of Potato. 102
13 B Constraints perceived by the farmers, wholesalers and
retailers in marketing of Tomato. 103
13 C Constraints perceived by the farmers, wholesalers and
retailers in marketing of Baby Corn. 104
13 D Constraints perceived by the farmers, wholesalers and retailers
in marketing of Rose. 105
13 E Constraints perceived by the farmers, wholesalers and retailers
in marketing of Grape. 106
14 Factors affecting marketing cost, margin and efficiency. 108
Karnataka
(i) Comparison of three models linking farmers to the market in India 132
1 The total sample for the crops selected 140
2 Marketing Channels identified for different crops 150
3 Contraints & Problem in horticultural crop marketing 158
Tamil Nadu
1 Status of Horticultural Crops in Tamil Nadu 169
2 Production strengths of Tamil Nadu 170
3 Vegetables (Main Production areas) 171
4 Major growing Districts of selected vegetables 174
5 Farmers and market intermediaries sample sizes 175
6 Marketing Cost and per cent to consumer price for
Brinjal and Potato (Rs/Q) 194

14
7 Marketing cost for Brinjal (Rs/qtl) 197
8 Marketing cost for Potato (Rs/qtl) 198
9 Marketing cost for tapioca (Rs./q) 199
10 Price spread for Brinjal (Rs./q) 180
11 Price spread for Potato (Rs./q) 200
12 Price spread for tapioca (Rs./q) 201
13 Producer share in consumer rupee of selected vegetables 203
14 Measurement of Marketing Efficiency of Brinjal (Rs./q) 202
15 Index of Marketing Efficiency of Brinjal 202
16 Measurement of Marketing Efficiency of Potato (Rs./q) 203
17 Index of Marketing Efficiency of Potato 203
18 Measurement of Marketing Efficiency of tapioca (Rs./q) 203
19 Index of Marketing Efficiency of tapioca 204
20 Constraints perceived by the farmers, wholesalers and
retailers in marketing Brinjal 204
21 Constraints perceived by the farmers, wholesalers and
retailers in marketing Potato 205
22 Results of Probit Model 206
West Bengal
1 Sampling size and composition 219
2 Major market intermediaries and their key functions 223
3 Estimation of marketing costs and marketing margin for selected
commodities 226
4 Estimation of marketing efficiency of most important marketing channel 228
5 Estimation of price spread of selected commodities 231
6 Estimation of producers’ share in consumer rupee 231
7 Estimation of marketing efficiency of major marketing channel 232
8 Estimation of marketing efficiency of most important
marketing channel 233
9 Determinants of factors affecting marketing efficiency in marketing

15
of vegetables in West Bengal 235
10 Determinants of factors affecting marketing efficiency in marketing
of Guava in West Bengal 236
11 Determinants of factors affecting marketing efficiency in marketing
of Marigold in West Bengal 237
12 Constraints perceived by the farmers in marketing of Fruits
and Vegetables in West Bengal 239
13 Constraints perceived by the middlemen in marketing of Fruits
and Vegetables in West Bengal 241
14 Sowing and harvesting period of selected crops in the study area 243
Manipur and Mizoram States
1 Distribution of sample Tomato cultivators 268
2 Per Hectare Disposal of Tomato (Quantity in quintals) 269
3 Marketing channel of Tomato 270
4 Quantity handled in different marketing channel of Tomato 270
5 Marketing cost and Marketing margin of tomato (Channel 1) 271
6 Marketing cost and Marketing cost of tomato (Channel 2) 272
7 Marketing cost and Marketing cost of tomato (Channel 3) 275
8 Marketing cost and Marketing margin of tomato (Rs./q) 278
9 Price spread of Tomato (Rs./q) 279
10 Share of different agencies during marketing of tomato 280
11 Measurement of Marketing efficiency of Tomato 281
12 Constraints perceived by the farmers in marketing of Tomato 282
13 Constraints perceived by the retailer in marketing of Tomato 283
14 Constraints perceived by the wholesaler in marketing of Tomato 284
15 Suggestions of farmers for increasing marketing efficiency
of tomato 285
16 Suggestions of retailer for increasing marketing efficiency
of tomato 286
17 Suggestions of wholesaler for increasing marketing efficiency

16
of tomato 286
18 Distribution of sample Cabbage cultivators 287
19 Per Hectare Disposal of Cabbage (Quantity in quintals) 288
20 Marketing channel of Cabbage 289
21 Quantity handled in different marketing channel of Cabbage 289
22 Marketing cost and Marketing margin of cabbage (Channel 1) 290
23 Marketing cost and Marketing margin of cabbage (Channel 2) 291
24 Marketing cost and Marketing margin of cabbage (Channel 3) 293
25 Marketing cost and Marketing margin of cabbage (Channel 4) 295
26 Marketing cost and Marketing margin of cabbage (Rs./q) 298
27 Price spread of cabbage (Rs./q) 300
28 Share of different agencies during marketing of cabbage 301
29 Measurement of marketing efficiency of Cabbage 302
30 Constraints perceived by the farmers in marketing of Cabbage 304
31 Constraints perceived by the traders in marketing of Cabbage 305
32 Constraints perceived by the retailers in marketing of Cabbage 306
33 Constraints perceived by the wholesaler in marketing of Cabbage 307
34 Suggestions of farmers for increasing marketing efficiency of
Cabbage 308
35 Suggestions of trader for increasing marketing efficiency of
Cabbage 309
36 Suggestions of retailer for increasing marketing efficiency of
cabbage 309
37 Suggestions of wholesaler for increasing marketing efficiency of
Cabbage 310
38 Factors affecting Marketing Efficiency of Vegetable
(Tomato and Cabbage) in Manipur 311
39 Distribution of sample Passion fruit cultivators 312
40 Per Hectare Disposal of Passion fruit (Quantity in quintals) 313
41 Marketing channel of Passion fruit 314
42 Quantity handled in different marketing channel of Passion fruit 315

17
43 Marketing cost and Marketing margin of passion fruit (Channel 1) 316
44 Marketing cost and Marketing margin of passion fruit (Channel 2) 317
45 Marketing cost and Marketing margin of passion fruit (Channel 3) 319
46 Marketing cost and Marketing margin of passion fruit (Rs./q). 321
47 Price spread of Passion fruit (Rs./q) 322
48 Share of different agencies during marketing of passion fruit 323
49 Measurement of Marketing Efficiency of Passion fruit 324
50 Constraints perceived by the farmers in marketing of Passion fruit 325
51 Constraints perceived by the retailers in marketing of Passion fruit 326
52 Constraints perceived by the wholesaler in marketing of Passion fruit 327
53 Constraints perceived by the society in marketing of Passion fruit 328
54 Suggestions of farmers for increasing marketing efficiency of
passion fruits 329
55 Suggestions of retailer for increasing marketing efficiency of
passion fruit 330
56 Suggestions of wholesaler for increasing marketing efficiency of
passion fruit 330
57 Suggestions of society for increasing marketing efficiency of
passion fruit 331
58 Factors affecting Marketing Efficiency of Passion Fruit in Manipur 332
59 Marketing channel of Anthurium in Mizoram 336
60 Quantity handled in different marketing channel of Anthurium 336
61 Marketing Cost of Anthurium incurred by the Farmers 337
62 Packing cost calculation for Anthurium 338
63 Air Freight calculation for Anthurium 339
64 Cost incurred by ZOPAR (Wholesaler) upto the destination 340
65 ZOPAR (Wholesaler) marketing cost at destination 341
66 Marketing Cost and marketing Margin of Anthurium (Channel 1) 342
67 Marketing Cost and marketing Margin of Anthurium (Channel 2) 343
68 Marketing cost and Marketing margin of anthurium (Rs./stem) 345
69 Price spread of Anthurium (Rs./stem) 347

18
70 Share of different agencies during marketing of anthurium 348
71 Measurement of Marketing Efficiency of anthurium 350
72 Constraints perceived by the farmers in marketing of Anthurium 351
73 Constraints perceived by ZOPAR (Wholesaler) in marketing of
Anthurium 352
74 Constraints perceived by Retailer in marketing of Anthurium 353
75 Suggestions of anthurium growers for increasing marketing efficiency 354
76 Suggestions of ZOPAR for increasing marketing efficiency of
anthurium flower 355
77 Suggestions of retailer for increasing marketing efficiency of
anthurium flower 356
78 Factors affecting Marketing Efficiency of Anthurium in Mizoram 357
Rajasthan
1 Status of fruit and vegetable area (2007-08) 368
2 Status of vegetable production (2007-08) 369
3 Marketing Channels in sale of Kinnow (2008-9) 370
4 Quantity handled in different marketing channels of kinnow (2008-9) 370
5 a Marketing cost and Marketing Margin in Kinnow (Rs/q) 372
5 b Marketing cost and Marketing Margin in Kinnow (Rs/q) 374
6 a Marketing cost and Marketing Margin of Kinnow (Rs/q) 376
6b Marketing cost and Marketing Margin of Kinnow (Rs/q) 377
7 a Price spread in Kinnow(Channel I) 379
7 b Price spread in Kinnow(Channel II) 380
8 a Share of different agencies during marketing of kinnow 381
8 b Share of different agencies during marketing of kinnow 382
9 Measurement of Marketing Efficiency of Kinnow 383
10 Constraints perceived by farmers in Kinnow production and marketing 385
11 Factors affecting Marketing Efficiency of Kinnow 386
12 Marketing Channels in sale of Aonla (2008-9) 387
13 Quantity handled in different marketing channels of Aonla (2008-9) 388

19
14 a Marketing cost and Marketing Margin in Aonla (Rs/q) 389
14 b Marketing cost and Marketing Margin in Aonla (Rs/q) 391
15 a Marketing cost and Marketing Margin of Aonla (Rs/q) 392
15 b Marketing cost and Marketing Margin of Aonla (Rs/q) 393
16 a Price spread in Aonla (Channel I) 395
16 b Price spread in Aonla (Channel II) 395
17 Share of different agencies in marketing of Aonla 396
18 Measurement of Marketing Efficiency of Aonla 397
19 Constraints perceived by farmers in Aonla production and marketing 398
20 Factors affecting Marketing Efficiency of Aonla 400
21 Marketing Channels in sale of Carrot (2008-9) 401
22 Quantity handled in different marketing channels of Carrot (2008-9) 402
23 a Marketing cost and Marketing Margin in Carrot (Rs/q) 403
23 b Marketing cost and Marketing Margin in Carrot (Rs/q) 404
24 a Marketing cost and Marketing Margin of Carrot (Rs/q) 405
24 b Marketing cost and Marketing Margin of Carrot (Rs/q) 406
25 a Price spread in Carrot (Channel I) 408
25 b Price spread in Carrot(Channel II) 409
26 Share of different agencies in marketing of Carrot 410
27 Measurement of Marketing Efficiency of Carrot 411
28 Constraints perceived by farmers in Carrot production and marketing 412
29 Factors affecting Marketing Efficiency of Carrot 413
30 Marketing channels in sale of Tomato (2008-9) 415
31 Quantity handled in different marketing channels of Tomato (2008-9) 415
32 a Marketing cost and Marketing Margin in Tomato (Rs/q) 417
32 b Marketing cost and Marketing Margin in Tomato (Rs/q) 418
33 a Marketing cost and Marketing Margin of Tomato (Rs/q) 419
33 b Marketing cost and Marketing Margin of Tomato (Rs/q) 420
34 a Price spread in Tomato(Channel I) 422
34 b Price spread in Tomato(Channel II) 423
35 Share of different agencies in marketing of Tomato 424

20
36 Measurement of Marketing Efficiency of Tomato 425
37 Constraints perceived by farmers in tomato production and marketing 426
38 Factors affecting Marketing Efficiency of Tomato 427
Punjab
1 Sample size of different types of respondents 436
2 District-wise area under vegetables vis-à-vis total cropped area in
Punjab, 2007-08. 440
3 Per holding marketed surplus of different vegetables of the selected
farmers 444
4 Sale pattern of vegetables of the selected growers 445
5 Price spread of potato in Jalandhar market, January 2009 447
6 Price spread of potato in Jalandhar market, January 2009 449
7 Price spread of potato in Apni Mandi of Jalandhar market, January 2009 451
8 Marketing efficiency of potato under different channels 452
9 Price Spread of tomato in Kapurthala market, June 2009 453
10 Price Spread of tomato in Kapurthala market, June 2009 455
11 Price Spread of tomato in Apni Mandi of Kapurthala market,
June 2009 457
12 Marketing Efficiency of tomato under different channels 458
13 Price spread of green peas in Hoshiarpur market, January 2009 459
14 Price spread of green peas in Hoshiarpur market, January 2009 460
15 Price spread of green peas in Apni Mandi of Hoshiarpur market,
January 2009 462
16 Marketing efficiency of green peas under different channels 463
17 Price spread of brinjal in Jalandhar market, July 2009 464
18 Price Spread of brinjal in Jalandhar market, July 2009 466
19 Price Spread of brinjal in Apni Mandi of Jalandhar market, July 2009 468
20 Marketing Efficiency of brinjal under different channels 469
21 Price spread of okra in Jalandhar market, July 2009 470
22 Price spread of okra in Jalandhar market, July 2009 472

21
23 Price spread of okra in Apni Mandi of Jalandhar market, July 2009 473
24 Marketing efficiency of okra under different channels 474
25 Regression coefficients of Cobb-Douglas type functions
for different vegetables of the selected farmers 476
26 Production and marketing constraints of potato as perceived
by the selected farmers. 478
27 Production and marketing constraints of tomato as perceived
by the selected farmers. 479
28 Production and marketing constraints of green peas as perceived
by the selected farmers. 480
29 Production and marketing constraints of brinjal as perceived
by the selected farmers. 481
30 Production and marketing constraints of okra as perceived
by the selected farmers. 482
31 Marketing constraints as perceived by the selected farmers
in the Apni Mandi 483
32 Constraints as perceived by the selected wholesalers in the market 484

22
List of Figures
Andhra Pradesh
Supply chain Network depicting selected crops produce movement from
farmer - Producer to ultimate consumer
1 Potato 75
2 Tomato 76
3 Baby Corn 77
4 Rose 78
5 Grape 79
Karnataka
1 Average seasonal daily procurement of fruits and vegetables by SAFAL 146
2 Procurement and sale model of SAFAL 147
3 Procurement and sale model of Namdhari 148
West Bengal
1 Arrival and modal price of brinjal at Baruipur (Canning)
market during 2009-10 244
2 Arrival and modal price of bhindi at Baruipur (Canning)
market during 2009-10 244
3 Arrival and modal price of guava at Baruipur (Canning)
market during 2009-10 245
4 Arrival and modal price of tomato at Baruipur (Canning)
market during 2009-10 246
S.No CONTENTS PAGE
NO

23
Punjab
1 Marketed surplus of vegetables 494
2 Potato: Margins and costs in supply chain I 495
3 Potato: Margins and costs in supply chain II:
Producer-retailer (through commission agent)-consumer 495
4 Potato: Margins and costs in supply chain III 496
5 Tomato: Margins and costs in Supply chain I 496
6 Tomato: Margins and costs in Supply chain II:
Producer-retailer (through commission agent)-consumer 497
7 Toamto: Margins and costs in Supply chain III 497
8 Green peas: Margins and costs in Supply chain I 497
9 Green peas: Margins and costs in Supply chain II:
Producer-retailer (through commission agent)-consumer 498
10 Green peas: Margins and costs in Supply chain III 498
11 Brinjal: Margins and costs in Supply chain I 499
12 brinjal: Margins and costs in Supply chain II:
Producer-retailer (through commission agent)-consumer 499
13 Brinjal: Margins and costs in Supply chain III 500
14 Okra: margins and costs in Supply chain I 500
15 Okra: Margins and costs in Supply chain II:
Producer-retailer (through commission agent)-consumer 501
16 Okra: Margins and costs in Supply chain III 501

24
Executive Summary
The study on “Estimation of Marketing Efficiency of Horticultural Commodities under Different
Supply Chains in India” was conducted in 7 states viz Andhra Pradesh, Karnataka, Tamil Nadu,
West Bengal, Manipur, Rajasthan and Punjab and Innovtive Models in Horticulture Marketing in
India study by NCAP. The main objective of the study are to estimate marketing cost, market
margin, price spread and producer share in consumer rupee and suggest suitable strategies for
improvement of marketing efficiency of different horticultural commodities. The executive
summary of these states is furnished below.
The study was taken up in Ranga Reddy, Medak and Hyderabad districts of Andhra Pradesh. The
crops included were Potato, Tomato, Baby corn, Roses and Grapes. A sample of 90 farmers each
for all the selected crops except for grape was selected. The data pertaining to grapes could not be
collected from more than 50 farmers due to limitation of availability of required sample size and
thus the total sample size was 410 farmers.
In terms of supply chains, in the case of potato, the preferred channel was producer-wholesaler-
retailer-consumer (PWRC).The preferred supply chain for tomatoes on the other hand was
producer-middleman-wholesaler-retailers-consumer (PMWRC). The supply chains for baby corn
were producer-middlemen-retailer-consumer (PMRC).Producers of roses preferred producer-
wholesaler-retailer-consumer (PWRC) supply chain, and subsequently roses and grapes followed a
similar pattern, with producer-middleman-wholesaler-retailers-consumer (PMWRC) supply chain.
With respect to marketing costs, the farmer-producer of potato was seen to incur the highest
marketing cost compared to that of producers of the other crops studied. In addition, it was evident
that the market cost incurred by the retailers was lower than that of the wholesalers and
commission agents. In terms of price spread it was evident in the marketing of all the crops that
marketing margins at wholesalers and retailers level and also the market cost was relatively high at
the intermediary level. The data supports the argument that the intermediaries play a crucial role in
realizing better margins to all the crops compared to that of growers. In the case of the share of
different agencies during marketing of fruits and vegetables the highest share was accrued by
retailer followed by wholesalers. In terms of marketing efficiency, it was clear that in the supply
chain model of producer-retailer-consumer (PRC) efficiency was 90% followed by the producer-
wholesaler-retailer-consumer (PWRC) and in the producer-middleman-wholesaler-consumer

25
(PMWC) it was 75%. The information indicated that the more intermediaries there in the supply
chain systems, the lower was the market efficiency. The chief constraints for farmers were
malpractices in auction and faulty weighing; wholesalers cited inadequate storage facilities and
retailers referred to exploitative middlemen and inadequate marketing facilities. Other complaints
by farmers included high market fees. Thus it could be concluded that the marketing cost,
marketing margin, transport cost, labor wages and the length of the market channel had negative
influence on the marketing efficiency.
Bangalore urban and rural districts, which form the most important horticultural belt of Karnataka
state, have purposively been selected as the study area. Data on month wise procurement of
different fruits and vegetables by SAFAL, Bangalore was taken as the primary focus for crop
selection. Banana (Robusta) and tomato formed the ones that are dealt with throughout the year
hence were selected as the crops for this study. Total sample size worked out to 130 and above for
each crop.
Marketing of horticultural crops includes a number of marketing channels involving the traditional
as well as modern marketing networks. In Karnataka several models of marketing networks
involving backward and forward linkages have emerged in marketing of horticultural crops. This
study analyzed the performance of some of these marketing networks on the basis of their
performance and marketing efficiency. The study specifically evaluated three modern systems
Viz., SAFAL, Namdharis and HOPCOMs in comparison to the traditional marketing networks for
banana and tomato crops in the state.
Several channels of marketing could be identified in banana (Robusta) marketing in Karnataka.
Field sale is the most common, followed by self marketing by the producer at the nearby wholesale
market. Sale at the HOPCOMs society is also popular, while the sale to the newly established
corporate house, SAFAL is the latest.
It could be seen from the analyses that producers share in consumers rupee has the largest in the
co-operative channel (62.3%) followed by the traditional wholesale network (51%). Despite all the
hype, the SAFAL network fetches the farmer only 50 percent of the consumers’ rupee.
Total marketing costs incurred in Banana sale was in the range of Rs.2.77 to Rs. 5.1 /kg, with
SAFAL outlet sales taking the largest chunk. Total margins of the different market intermediaries
were in the range of Rs. 2.65/kg in the co-operative channel to Rs. 4.82/kg in the traditional
channels. Marketing efficiency measured in terms of modified Acharya’s formula was the highest

26
for the co-operative channel at 1.65 followed by the 1.05 in the traditional wholesale channel while
SAFAL registered an efficiency of 0.99, which is better than the field sale channel. Price spread
ranged from Rs 4.90 in the cooperative channel to Rs 8.80 in SAFAL outlet route.
Yelaki banana is most popularly grown in and around Ramnagar region of Mandya district,
Karnataka. This has received a boost from the extension of co-operative marketing network of
HOPCOMs at the district.It could be seen from the analyses that producers share in consumers
rupee was the largest in the co-operative channel (70%) in comparison to the 46 .5% in the
traditional wholesale network. Total marketing costs incurred in Banana sale was in the range of
Rs.2.76 to Rs. 4.95 /kg, with co-operative network and wholesale market network. Total margins
of the different market intermediaries were in the range of Rs. 5.42/kg in the co-operative channel
to Rs. 16.39/kg in the traditional channels. Price spread ranged from Rs 4.90 in the cooperative
channel to Rs 8.80 in SAFAL outlet route.The marketing network of tomato included the
traditional marketing channel of sale through Kolar wholesale market, sale through SAFAL and its
outlets, HOPCOMs and their outlets and contract cultivation for Namdhari seeds private limited.
Net farm price varied from Rs. 4.05 /kg in the Namdhari fresh channel to Rs. 5.93/kg in the
channel 3, i.e., the distant market sale. While the procedure adopted by the SAFAL network is
similar to that for Banana, the Namdhari fresh offers farm gate procurement. Producers share in
consumers rupee in case of tomato among the six channels studied was the highest in the co-
operative network involving HOPCOMs at 435 followed by distant market channel and SAFAL.
The lowest was for the producers dealing with Namdhari. Total marketing costs incurred in tomato
marketing ranged from Rs. 2.45/kg in Namdhari sale to Rs. 6.28/kg in Kolar marketing. Total
margins of the different market intermediaries were in the range of Rs. 2.55/kg in the co-operative
channel to Rs. 9.00/Kg in the namdhari market network
Marketing efficiency measured in terms of modified Acharya’s formula was the highest for the co-
operative channel at 0.75 followed by the 0.73 in the traditional distant market channel. Price
spread ranged from Rs 7.15 in the cooperative channel to Rs 11.45 in Namdhari.
In Tamil Nadu data was collected from farmers and market intermediaries for the four selected
vegetables viz brinjal, potato, tapioca and gherkin. The data were based on respondent recall and
as per existing practices and pertain to the year 2009-10. For each of the four vegetables covered
under the present study samples of 120 farmers were selected, and hence the total sample size is
630.

27
Lessons from the study of the vegetables, brinjal, potato, tapioca and gherkins indicate that
marketing issues were larger than mere reduction in the number of middlemen or promoting
adhoc measures. Number of tapioca processing industries in Salem District are said to be
declining in number due to gradual reduction in area under tapioca cultivation in surrounding
districts. Similarly, gherkins processors have been facing major problems since the economic
slow down in the west which is the major importing countries. On the contrary, brinjal and
potato farmers have been reaping greater benefits in recent year due to escalating vegetable
prices. Similar increases in market prices have been observed for commonly consumed
vegetables.
Results presented in the study indicated that in the most common marketing channels for the
studied vegetables the marketing cost was a reasonable 15 per cent of the consumer price and
marketing margins of the intermediaries constituted again a reasonable 10 per cent. Producers get
about 75 per cent of the consumer rupee. However, problems arise to the producers mostly
because of the wider price fluctuations due to production cycles. While production and
marketing costs for the farmers remain fixed, abnormal down trends in prices inflicts heavy
damages in terms of income loss for them. Market intermediaries only suffer loss of turnover
with their margins and fees fixed.
Study has been conducted in three coastal districts of West Bengal, viz, South 24 Parganas,
North 24 Parganas and East Midnapore. Three vegetables, brinjal, bhindi (ladies finger) and
tomato have been selected. Among flowers and fruits, marigold and guava respectively have
been selected. The sample size number of farmers interviewed are 272 and number of
middlemen interviewed are 113, and hence the total sample size is 385.
Brinjal and bhindi are marketed through same marketing channels, in the study area. Marketing
channels for tomato are frequently changing depending on season and local supply. Tomato is
marketed through more number of marketing channels and also passes through more long
channels as compared to other vegetables under study (brinjal and bhindi). Dominating
marketing channels for guava is shorter in length because it has to reach to final consumer as
quick as possible after harvesting to fetch better prices. Guava looses its flavour, vigor
glossiness, freshness and taste very quickly. Marigold is also highly perishable and requires
quick disposal after harvesting. It has to reach to final consumer in quickest possible time,
preferably within a day to realize better prices. Majority of marigold and guava are marketed
28
through wholesale marketing, at Mullick Ghat Ful Bazar, and Machna Ful Patty of Kolkata,
respectively.
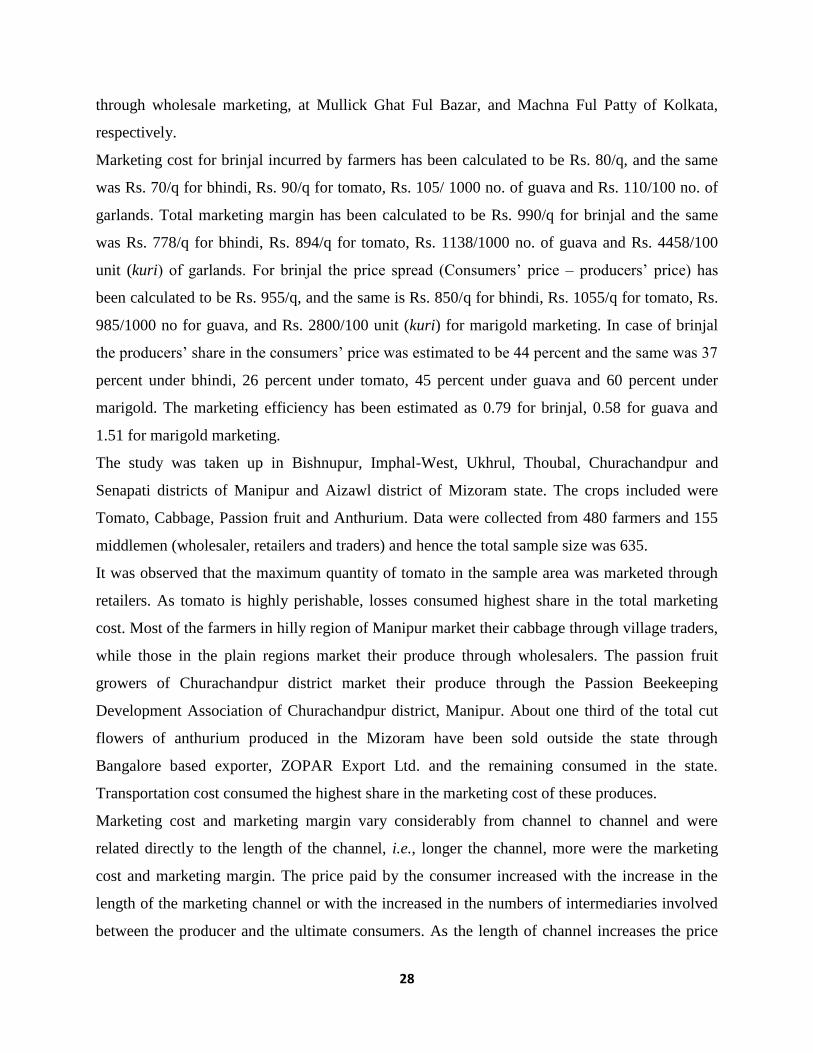
Marketing cost for brinjal incurred by farmers has been calculated to be Rs. 80/q, and the same
was Rs. 70/q for bhindi, Rs. 90/q for tomato, Rs. 105/ 1000 no. of guava and Rs. 110/100 no. of
garlands. Total marketing margin has been calculated to be Rs. 990/q for brinjal and the same
was Rs. 778/q for bhindi, Rs. 894/q for tomato, Rs. 1138/1000 no. of guava and Rs. 4458/100
unit (kuri) of garlands. For brinjal the price spread (Consumers’ price – producers’ price) has
been calculated to be Rs. 955/q, and the same is Rs. 850/q for bhindi, Rs. 1055/q for tomato, Rs.
985/1000 no for guava, and Rs. 2800/100 unit (kuri) for marigold marketing. In case of brinjal
the producers’ share in the consumers’ price was estimated to be 44 percent and the same was 37
percent under bhindi, 26 percent under tomato, 45 percent under guava and 60 percent under
marigold. The marketing efficiency has been estimated as 0.79 for brinjal, 0.58 for guava and
1.51 for marigold marketing.
The study was taken up in Bishnupur, Imphal-West, Ukhrul, Thoubal, Churachandpur and
Senapati districts of Manipur and Aizawl district of Mizoram state. The crops included were
Tomato, Cabbage, Passion fruit and Anthurium. Data were collected from 480 farmers and 155
middlemen (wholesaler, retailers and traders) and hence the total sample size was 635.
It was observed that the maximum quantity of tomato in the sample area was marketed through
retailers. As tomato is highly perishable, losses consumed highest share in the total marketing
cost. Most of the farmers in hilly region of Manipur market their cabbage through village traders,
while those in the plain regions market their produce through wholesalers. The passion fruit
growers of Churachandpur district market their produce through the Passion Beekeeping
Development Association of Churachandpur district, Manipur. About one third of the total cut
flowers of anthurium produced in the Mizoram have been sold outside the state through
Bangalore based exporter, ZOPAR Export Ltd. and the remaining consumed in the state.
Transportation cost consumed the highest share in the marketing cost of these produces.
Marketing cost and marketing margin vary considerably from channel to channel and were
related directly to the length of the channel, i.e., longer the channel, more were the marketing
cost and marketing margin. The price paid by the consumer increased with the increase in the
length of the marketing channel or with the increased in the numbers of intermediaries involved
between the producer and the ultimate consumers. As the length of channel increases the price

29
spread also increases and vice-versa. The marketing efficiency increased with the decrease in
marketing margin and open market price and with the increase in volume of the produce handled
and length of market channel.
The major constraints of marketing horticultural crops include lack of market to absorb the
production, low price for the products, large number of middlemen in marketing system, lack of
marketing institutions to safeguard the farmers’ interest and rights over their marketing (e.g.
cooperatives), lack of coordination among producers to increase their bargaining power, poor
product handling and packaging, imperfect pricing system and lack of transparency in market
information system.
Present study was conducted in Jaipur and Sriganganagar districts of Rajasthan. Sriganganagar
district was selected for study of kinnow and carrot crop while, Jaipur district was selected for
aonla and tomato crop. These districts were selected based on significant area under selected
fruits and vegetables crop. Sample size was kept uniform for all fruits and vegetable crops. For
each crop 120 farmers were selected. Beside this, information was also collected from 30
wholesalers/ traders/ contractors and 30 retailers for each fruit and vegetables crop studied.
There were three important marketing channels through which kinnow produce were sold by
farmers in Sriganganagar district. The marketing channel- I was most famous as about 71 percent
produce was sold through it. In channel-II farmers directly brought produce in the mandi and
sold it through commission agents either in local or distant markets in same or other states. In
channel III producers sell the produce after grading and processing. The produce was either
processed by farmers himself at his processing plant or on payment basis at grading plants
situated around Ganganagar city. Total marketing cost of about Rs 807 was observed in channel-
I when sold to distant markets in south particularly Bangalore city. The cost was shared by
contractors (65.30%), commission agents (3.72 %) and retailers (30.98%). The maximum cost of
marketing was shared by contractors as he arranges labour for fruits harvesting, packing and
pays the cost of packing material and transportation cost. Total marketing cost had 29.49 and
15.67 percent share in consumer price in channel I and II, respectively. There were three
important marketing channels through which aonla produce were sold by farmers in Jaipur
district. The marketing channel-I was the major one as about 87 percent produce was sold
through it. In channel-II, farmers directly brought produce in the mandi and sold it through
commission agents. The marketing cost in channel II was lower than channel I as produce was

30
directly brought by farmers in the mandi and sold through retailers to consumers after paying
taxes of market and fee of commission agents.
There were two important marketing channels through which carrot produce were sold by
farmers in Ganganagar district. The marketing channel-I was the largest one as about 85 percent
produce was sold through it. Traders from adjoining states like Punjab, Haryana and other parts
of Rajasthan were participating in the auction which takes place on the banks of Ganga canal.
The total marketing cost was lower in channel II compared to I because produce was not taken to
distant places and number of intermediaries were also fewer .There were two important
marketing channels through which tomato produce were sold by farmers in Jaipur district.
Produce procured in channel I was sold in different markets of Rajasthan, viz. Jaipur, Sikar,
Ganganagar, Hanumangarh, Sardarshahar, Churu and various cities in Punjab and Haryana etc,
while in Channel II produce is directly procured by retailers and sold in Chomu or Jaipur city.
The total marketing cost was lower in channel II compared to I because produce was not taken to
distant places and number of intermediaries were also fewer.
Strategies to enhance marketing efficiency of fruits and vegetables vary according to nature of
produce and kind of marketing facilities in a particular region. Discussions were held with
farmers, contractors, wholesalers, processors and retailers to get the idea about improvement in
marketing system so that efficiency of the whole marketing system is improved and farmers get
adequate returns from this enterprise to remain in horticulture crops farming. Regarding fruits
both kinnow and aonla are important fruit crops of Rajasthan. More than 50 percent produce of
both fruits are transported outside state for further processing or for direct consumption. There is
not a single fruit processing industry for kinnow in the production region.
In Punjab, five important vegetables were studied in the study. These are potato, tomato, green
peas, brinjal and okra. Jalandhar district was selected for potato, Kapurthala for tomato,
Hoshiarpur for green peas, and Jalandhar for brinjal and okra based on area under these crops.
The convenience sampling technique was used for selection of different types of respondents in
the study. For each vegetable, the sample consisted of 120 farmers except 93 farmers for brinjal.
Further, for each vegetable, 30 wholesalers, 30 retailers and 30 farmers from Apni Mandi were
selected. Thus, the total sample consisted of 573 farmers, 150 wholesalers, 150 retailers and 150
farmers from Apni Mandi. For the present study, the total number of all types of respondents was
1023.

31
The study brought out that the net price received by the producer was about Rs 554/q which in
percentage terms was about 46 per cent of the consumer’s purchase price in supply chain I in
Kapurthala market. The expenses borne by the wholesaler and retailer were Rs 68 and Rs 84/ q.
These respective expenses were about 6 and 7 per cent of the consumer’s purchase price. The
margin of the wholesaler and retailer was 11 per cent and 26 per cent of the purchase price of
consumer. The producer’s net price received was Rs 579/q in supply chain II. This was about 48
per cent of the consumer’s purchase price. The expenses and margins of the retailer were about
12 per cent and 36 per cent of the consumer’s price. The retailer’s margins were comparatively
less in supply chain I as compared to supply chain II. For sale of tomato in supply chain III (Apni
Mandi), the net price received by the producer was Rs 1024/q which was 93 per cent of the
consumer’s purchase price. The marketing efficiency in supply chain III was 13.42 as against
1.01 in supply chain II and 0.92 in supply chain I. The marketing efficiency in supply chain III
was high on account of the fact that no middleman was involved and produce was directly sold
to consumers. As compared to supply chain I, the marketing efficiency of tomato was marginally
high in supply chain II due to less number of the intermediaries in the latter.
In case of potato, market margins and costs were the major explanatory variables significantly
affecting the marketing efficiency. It infers that with one percent increase in marketing margin
and cost, the resultant marketing efficiency declined by 0.61 and 0.37 percent respectively. In
case of tomato, the coefficients of marketing margins and costs were significantly and negatively
related with the marketing efficiency. The coefficient indicated that one percent increase in these
variables resulted into fall in the marketing efficiency by 0.69 percent and 0.38 percent
respectively. In case of green peas, market margins and costs were the major explanatory
variables significantly affecting the marketing efficiency. It infers that with one percent increase
in these variables the resultant marketing efficiency declined by 0.45 and 0.44 percent
respectively. In case of brinjal, the various explanatory variables included in the model were
significantly affecting the marketing efficiency. The coefficients of market margins and costs
were significantly negatively related with the dependent variable. It can be inferred that with one
percent increase in these variables, the marketing efficiency declined by 0.57 percent and 0.32
percent respectively. In case of okra, the various explanatory variables included in the model
were significantly affecting the marketing efficiency. The coefficients of market margins and
costs were significantly negatively related with the dependent variable. It can be inferred that

32
with one percent increase in these variables, the marketing efficiency declined by 0.54 percent
and 0.37 percent respectively.
33
Estimation of Marketing Efficiency of Horticultural Commodities
under Different Supply Chains in India
India with diverse soil and climate comprising several agro-ecological regions provides ample
opportunity to grow a variety of horticulture crops. These crops form a significant part of total
agricultural produce in the country comprising of fruits, vegetables, root and tuber crops,
flowers, ornamental plants, medicinal and aromatic plants, spices, condiments, plantation crops
and mushrooms.
Horticulture development had not been a priority until recent years. In the period 1948-80, the
main focus of the country was on cereals. During 1980-92 there was consolidation of
institutional support and a planned process for the development of horticulture then started. It
was later in the post-1993 period that a focused attention was given to horticulture development
through an enhancement of plan allocation and knowledge based technology.
National Horticulture Mission has been launched in April 2005 as a centrally sponsored scheme
to promote holistic growth of the horticulture sector through an area based regionally
differentiated strategies. The foreign trade policy in 2004-09 emphasized the need to boost
agricultural exports, growth and promotion of exports of horticultural products. The sector is
growing at an average growth rate of 3.6 per cent over the last decade.
India produces around 111.8 MTs of vegetables and 57.73 MTs of fruits (2006-07) which
accounts for nearly 1.90 per cent and 10.90 per cent of country’s share in the world production of
vegetables and fruits, respectively. India is the second largest producer of fruits and vegetables in
the world next only to Brazil and China. The country’s annual requirement is 74.40 MTs fruits
and 175.2 MTs vegetables. However, per capita consumption of fruits and vegetables in India is
only around 46 kg and 130 g against a minimum of about 92kg and 300g respectively
recommended by ICMR and National Institute of Nutrition, Hyderabad. With the present level
of population, the annual requirement of fruits and vegetables will be of the order of more than
production level. Horticultural sector contributes 28% of AgGDP and 54% of Agricultural
Exports in India (2007-08). India plans to increase the production of horticultural crops to 300
million tones by 2012 (Government of India, 2001) from the current level of 202.68 million
tones (NHB, 2008).
34
Based on 11th
Five year plan approach paper, accelerated agricultural growth will require
diversification into horticulture and floriculture which in turn imply structural changes in the
relation between agriculture and non-agriculture. Diversification requires effective marketing
linkages, supported by modern marketing practices including introduction of grading, post-
harvest management, cold chains etc.
The agricultural market in India is dominated by rural primary markets that meet local demand;
secondary markets that serve more distant needs; and wholesalers who gather system parallel to
the existing system was sought to be put in place. This will be outside the produce from different
sources for retail in the country. The objective of the regulated markets established by the
government was to regulate trade practices, increase marketing efficiency by reducing marketing
charges, eliminate intermediaries and protect the interests of the producer seller. Though
regulated markets helped to reduce multiple charges to the producer‐seller, the system failed to
check trade malpractices, making such markets highly restrictive, inefficient and dominated by
traders.
To overcome the defects of regulated markets and to increase productivity, a direct marketing
purview of the Agricultural Produce Marketing Committee (APMC) and will hence ensure
transparency, efficiency, quality control and fair play. Direct marketing by farmers was
experimented with via Apni Mandis in Punjab and Haryana. A modified concept was introduced
in Rythu Bazars (AP) and Uzahvar Santhaigal (TN). In the meantime, private players such as
Cargill India, Mahindra, ITC‐e Choupal, Bharti etc., have emerged with sophisticated supply
chain management systems and vertical co‐ordination.
Past trend in development of horticulture has been satisfying and this trend has been marked as
“Golden Revolution” with India emerging as the second largest producer of fruits and vegetables
and occupying first position in several horticultural crops. Production and export of flowers have
increased manifold and the country has a major stake in global trade of spices and cashew nuts.
Export of medicinal plants, fruits and vegetables have also exhibited rising trend. Even though
India is leading in the productivity of some horticultural crops like grapes, cassava, ginger,
turmeric, still there is a scope to increase the productivity in other horticultural crops in
comparison to other countries. Challenges ahead are numerous with a targeted production of 300
mill tons at the end of XI Plan from the current level of 185.5 million tons in the environment of
dwindling land and water resources . However, today, as a result of synergy between focused

35
research, technological and policy initiatives and high efficiency inputs, horticulture in India, has
become a sustainable and viable venture especially for the small and marginal farmers.
The most important determinants to establish the required linkages are in the area of agricultural
marketing and processing. Since high value agriculture is based on perishable commodities, large
investments are required in modern methods of grading, post-harvest management and
development of cold chains. Such investment in turn requires that new players, including large
corporate players, be able to enter existing markets and set up new marketing channels. The
NHM therefore incentivizes the on-going marketing reforms based on amending existing
Agricultural Product Marketing Committee (APMC) Acts to allow this. This process has started
in earnest, with many business houses investing in the area and with most States having already
made APMC amendments. However, this must be taken to its logical conclusion. Many States
that have made APMC amendments are yet to frame the necessary rules. This uncertainty needs
to be removed as soon as possible. Most States have also endorsed, and many have encouraged,
Contract Farming. This needs to be backed by ensuring effective mechanisms for contract
registration and dispute resolution, along with adequate information and support so that small
farmers are able to enter into collective contracts.
Several studies such as Bansal (1994), Bhatia (1994), Sudha and Gajanana (2001) were done on
traditional areas / conventional crops. Studies such as V.T. Raju and Rao (1993), Ganesh (2004)
were mainly focused on traditional marketing channels. Limited scientific studies on the
emerging / newer institutional marketing models are available. Chengappa (2001). Apart from
these newer crops are coming in this sector and their marketing problems are un-explored.
Further, few studies are available on many horticultural commodities across several states at a
given point of time.

36
This study was carried out with the following specific objectives:
1. to estimate the marketing cost and marketing margin of different functionaries for
selected horticultural commodities under various supply chains,
2. to analyze the price spread, marketing efficiency and farmer’s share in consumer rupee in
various supply chains,
3. to identify the constraints perceived by various stakeholders; and study the factors
influencing the marketing cost, market margin and marketing efficiency, and
4. to suggest suitable strategies to enhance the marketing efficiency for horticultural
commodities
The study has been conducted in 7 states viz Andhra Pradesh, Karnataka, Tamil Nadu, West
Bengal, Manipur, Rajasthan and Punjab. The study estimated marketing costs, marketing
channels, market margins, price spread, and producer share in consumer rupee for vegetables,
fruits and flowers under different supply chains. Both the traditional and modern supply chain
were studied. The data has been collected from farmers, wholesaler and retailers personally
through structured questionnaires. Analytical tools such as logistic regression model, Acharyas
modified formula and Delphi models have been used to estimate marketing efficiency in the study.
The results of the studies conducted in the 7 states and Innovative models in Horticulture
marketing in India are furnished in subsequent chapters.

37
Innovative Models in Horticulture Marketing in India
M.B. Dastagiri, B. Ganesh Kumar1
Abstract : India produces around 111.8 MT of vegetables and 57.73 MTs of fruits (2006-07). Horticultural sector
contributes 28% of AgGDP and 54% of Agricultural Exports in India (2007-08). Horticulture development is
currently constrained by poor marketing arrangements. The gap between prices received by the farmers and those
paid by urban consumers is large, reflecting inefficient marketing arrangements. Studies indicate that the share of
producers varies from 33 to 75 per cent case of fruit and vegetables.
India opened up post 1990, a number of innovative liberalized markets in the WTO regime to eliminate middlemen
and increase distributional efficiency. It is necessary to study and understand their success and operations of these
marketing institutions. The main objective of the paper is to study functions, mandate and trace innovative models,
strategies and policy principles practicing by different innovative marketing institutions in horticulture marketing in
India. The recent changes in functions of agricultural marketing institutions, public and private retail markets were
documented and analyzed their marketing models, strategies and policy principles in improving the marketing
efficiency of fruits and vegetables. The features of different systems operating for marketing of fruits and vegetables
were studied through a survey conducted with the officials of Department of Marketing, Hyderabad
India opened up post-1990, a number of new innovative public liberalized markets in the WTO regime. The main
functions of farmers markets are empowering the farmers to participate effectively in the open market to get a
remunerative price for their produce, and increase by enhancing the distributional efficiency of the marketing
system. The economic reforms lead to the emergence a number of new private retail markets. Organized retailing in
Fresh Fruits and Vegetables (FFV) is gaining a lot of momentum in India with huge investment by leading Indian
corporations.
The features of different systems operating for marketing of fruits and vegetables were shown that the marketing
models of private agencies, particularly Reliance fresh and subhiksha were more efficient than that of Rythu bazaar,
due to their low cost on marketing, transport, and incidental charges.
Therefore, there is an immediate need to replicate such models in a much larger scale to cover not only the cities but
also the interior villages in the country. The study suggests that it is necessary to amend outdated laws restricting the
establishment of markets to allow cooperatives and private entrepreneurs to set up modern markets. Both public and
private retail markets have to adopt the new marketing models to enhance the distributional efficiency of the
marketing system.
1 Dr. M.B. Dastagiri and Dr. B. Ganesh Kumar are senior scientists at National Centre for Agricultural
Economics and Policy Research, New Delhi-110012. E-mail: [email protected]

38
1. Introduction
India produces around 111.8 MTs of vegetables and 57.73 MTs of fruits (2006-07) which
accounts for nearly 1.90 per cent and 10.90 per cent of country’s share in the world production of
vegetables and fruits, respectively. The country’s annual requirement is 74.40 MTs fruits & 175.2
MTs vegetables. Horticultural sector contributes 28% of AgGDP and 54% of Agricultural
Exports in India (2007-08). India plans to increase the production of horticultural crops to 300
million tones by 2012 (Government of India, 2001) from the current level of 202.68 million tones
(NHB, 2008). In the post-1993 period that a focused attention was given to horticulture
development through an enhancement of plan allocation and knowledge based technology.
National Horticulture Mission has been launched in April 2005 as a centrally sponsored scheme
to promote holistic growth of the horticulture sector through an area based regionally
differentiated strategies. The foreign trade policy in 2004-09 emphasized the need to boost
agricultural exports, growth and promotion of exports of horticultural products. Based on 11th
Five year plan approach paper, accelerated agricultural growth will require diversification into
horticulture and floriculture...
Most of the agricultural commodity markets in India generally operate under the normal forces
of demand and supply. The buying and selling of agricultural produce takes place in the market
yards where numbers of market functionaries are involved. Government of India(2001) reported
that as per survey conducted recently, the farmer is getting only one rupee out of every Rs 3.50
paid by the consumer, the retailers is getting Rs 0.75, the wholesaler is getting Rs 0.50 and rest
of the amount Rs 1.25 is going to commission agents and traders.
Anantia (2008) quotes according to Lal Bhuria, Minister of State for Agriculture, the share of
producer in consumer’s price depend upon the types of marketing channels followed in sales
transactions by the farmers. Studies indicate that the share of producers varies from 56 to 83 per
cent in food grains and 79 to 95 per cent in pulses, 65-96 per cent in oilseeds and 33 to 75 per
cent in case of fruit and vegetables. He said in order to provide the remunerative prices to the
farmers, there is a need to eliminate the chain of middlemen etc., by introducing innovative
marketing channels like direct marketing, contract farming, etc. and removal of controls on
movement and storage of agricultural produce across the country which will facilitate
functioning of common Indian market.

39
Horticulture development is currently constrained by poor marketing arrangements. The gap
between prices received by the farmers and those paid by urban consumers is large, reflecting
inefficient marketing arrangements. Horticultural produce is typically collected from farmers
by market agents, who sell it in organized markets established under the Agricultural Produce
Marketing Acts. Unfortunately, these markets are controlled by a few traders and operate on
a highly nontransparent basis. Facilities for grading and handling are poor, and methods of
price discovery in the markets are not transparent. Wastage is high owing to poor logistics
and the absence of cold chains. The net result is much lower realization of income by the
farmer. Jairath (2008) highlights that in India, many producers – growers face barriers to
effective participation in markets for disposal of fruits and vegetables.
It is necessary to amend outdated laws restricting the establishment of markets to allow
cooperatives and private entrepreneurs to set up modern innovative markets with grading
facilities, cold storage, and transparent auction procedures.
World Development Report (World Bank, 2000-01) points out the markets are central to the
lives of poor people. India opened up post 1990, a number of innovative liberalized markets
in the WTO regime to eliminate middlemen and facilitate direct contact between producer
and consumers. It is necessary to study and understand these markets functions, performance
and success.
The main objective of the paper is to study functions, mandate and trace innovative models,
strategies and policy principles practicing by different innovative marketing institutions in
horticulture marketing in India. The specific objectives of the study are:
1. To study the different innovative marketing institutions, their functions, and mandates
in horticulture marketing in India.
2. To trace marketing models, strategies and policy principles practicing by different
marketing institutions in horticulture marketing in India
3. To suggest suitable strategies or policies to guide for effective marketing of fruits and
vegetables of horticulture sector in India.

40
2. Data and methodology
Information on objectives, mandates, and functions of the marketing institutions which deal fruits
and vegetables in the country were collected from the respective institutions, websites and
published secondary sources. Similarly, the status, growth and future plans of public and private
retail markets in the horticulture were collected from websites and secondary sources. The focus
was on change in functions, mandate, models, strategies and principles of marketing institutions
over the years particularly pre and post market reforms. The study used Delphi survey method to
validate the results obtained through secondary data from concerned officials of institutions.
This is basically a quick, diagnostic study. The different marketing institutions, their functions,
and mandates are reviewed and put in matrix format. The status, growth and future plans,
marketing models and strategies of public and private retailing markets in fruits and vegetables
are analyzed along with case study. The recent changes in functions of fruits and vegetable
marketing institutions, public and private retail markets were documented. Finally, suggestions
are made to address marketing problems of fruits and vegetables in India.
3. Results and Discussion
3.1. New innovative public marketing models
It has been realized that the marketing channel for fruits and vegetables which are highly
perishable should be as short as possible. Perishable horticulture produce should move
quickly from farmers to consumers. If farmers directly sell their produce to the consumers, it will
not only save losses but also increase farmer's share in the price paid by the consumers.
Therefore, direct marketing by the farmers is being encouraged as an alternative channel.
India opened up post-1990, a number of new innovative public liberalized markets for fruits and
vegetables in the WTO regime and their key functions and objectives were given in the Table 1.
The main functions of farmers markets are empowering the farmers to participate effectively in
the open market to get a remunerative price for their produce, to avoid the exploitation of both
the farmers and the consumers by the middlemen and increase by enhancing the distributional
efficiency of the marketing system. It will eliminate middlemen, links producers and consumers
directly, reduce price spread, and enhance producer shares in consumer rupee. Forward and

41
Futures markets have been identified as important tools of price stabilization and risk
management. Commodity exchanges for futures trading narrows the marketing, storage and
processing margins, there by benefiting both growers and consumers. E-trading based on buying
and selling of electronic warehouse receipts and with the latest price information has also
become a widespread practice.
Table 1. New liberalized public agricultural marketing institutions in India during WTO
regime
No Public Agricultural
Marketing Institutions Status/ key function/mandate/status
1 Safal Market
- NDDB started a fruits and vegetable unit of SAFAL
at delhi was one of the first fruit and vegetable
retail chain
- NDDB has set up an alternate system of whole sale
markets in Banglore as a pilot project.
- This market is a move to introduce a transparent
and efficient platform for sale and purchase fruits
and vegetables by connecting growers through
Grower’s associations
2 Mother Dairy Booths
- Mother dairy, basically handling milk in Delhi. But
it was asked to handle retail vegetable marketing.
- Mother dairy management has opened retail outlets
in the city for providing vegetables to the
consumers at reasonable prices.
3 Cooperative Marketing
Society
- The need for cooperative marketing arose due to
many defects in the private and open marketing
system
- A cooperative marketing society can eliminate
some or all of the intermediaries

42
- This will make commodities cheaper and ensure
good quality
- Few successful cooperative marketing societies for
fruits and vegetables. eg. Maha-grape- cooperative
federation marketing, Maharashtra, Cooperative
marketing pomegranate, Co-operatives marketing
banana in Jalgaon district, Vegetables co-
operatives in Thane District, Milk co-operatives
in Maharashtra, HOPCOMS,Bangalore and Gujarat
and Co-operative4cotton marketing society.
4 Hardaspar Vegetable
Market
- Hadaspar vegetable market is a model market for
direct marketing of vegetables in Pune city.
- This is one of the ideal markets in the country for
marketing of vegetables
- The market has modern weighing machines
5 Shetkari Bazar
- Shetkari bazaars were established in the
Maharashtra state for marketing of fruits and
vegetables
- It will eliminate middlemen, links producers and
consumers directly, reduce price spread, and
enhance producer share’s in consumer rupee
- Thus these markets increase the farm income, well
being of the farmers and bring stability in prices of
horticultural crops.
6 Krushak Bazaar
- Established in the state of Orissa in 2000-01
- The purpose is to empower farmer-producer to
compete effectively in the open market to get a
remunerative price and ensure products at
affordable prices to the consumer

43
7 Raythu Bazaar in
Andhra Pradesh
- First started in Andhra Pradesh in the direction of
empowering the farmers to participate effectively in
the open market to get a remunerative price for their
produce.
- To avoid the exploitation of both the farmers and
the consumers by the middlemen by creating a
positive atmosphere of direct interface between
them.
- - As of now, there are 96 Raythu Bazaars operating
well and spread over different regions and districts
of the state.
8 Apni Mandi
- First started in Punjab in the direction of ensuring
direct contact of the producer-farmers and
consumers and there by enhancing the distributional
efficiency of the marketing system. This system
does away with the middlemen.
- The price spread is considerable low. These are
working satisfactorily in the case of fruits and
vegetables.
- -These ‘Apni Mandis’ are similar to the Saturday
markets of United Kingdom and United States of
America.
9 Farmers markets
- -Farmers markets initiated in Tamil Nadu in Nov
1999 to eliminate middlemen and traders from the
marketing of vegetables in the farmers markets, and
to establish direct contacts between farmers and
consumers.
- - By Nov, 2000, 95 such markets had been
established in most of the states towns and cities
and over 75, 5000 farmers had been issued cards

44
authorizing them to sell their product in the
markets.
10
Contract
Farming/Contract
Marketing
- Essentially is an agreement between farmer –
producers and the agribusiness firms to produce
certain pre-agrred quantity and quality of the
produce a particular price and time
- This is an important initiative for reducing
transaction costs by establishing farmer –processer
linkages.
- Successful contract farming includes Organic dyes-
Marigold farmers and extraction units in
Coimbatore, Pepsi Company and farmers of Punjab
and Rajasthan for tomato growing,
11 Forward and Future
Markets
- Forward and Futures markets have been identified
as important tools of price stabilization and risk
management.
- Extension of forward and futures markets to all
major agro commodities has, therefore, assumed
great importance.
- -Commodity futures markets in the country are
regulated through Forward Contracts (Regulation)
Act, 1952.
12 Commodity Exchanges
- Commodity exchanges for futures trading narrows
the marketing, storage and processing margins,
there by benefiting both growers and consumers.
- NAFED started National Multi-Commodity
Exchange of India Ltd. on 26th
November, 2002, for
cash crops, food grains, plantations, spices,
oilseeds, metals and bullion among others.

45
- National Commodity and Derivate Exchange of
India Ltd. Was established in Dec, 2003 at Mumbai
with a similar purpose
13 E-trading
- Trading based on buying and selling of electronic
warehouse receipts and providing the latest price
information
- - The services can be accessed by internet,
telephone (by interactive response), from mandi
administration as well.
14 Food retail super
markets
- -Food retail markets in India during 1990s and early
2000 opened up the availability of food products
dramatically. They key functions are
- Higher standards
- Lower prices

46
3.2. New Liberalized Innovative Private Retail Marketing models
The concept of organised retail has been existing in India since early 80s with the existence of
players like Mother Dairy and Safal but it's only in past one year that the fever of retail in FFV
has caught up really fast. Organized retailing in Fresh Fruits and Vegetables (FFV) is gaining a
lot of momentum in India with huge investment by leading Indian corporations. Modern formats
of supermarkets such as Reliance Fresh, Choupal Fresh, Food World, etc. promoted by different
companies are emerging very rapidly in small and large towns around the country. Two of
the major players in the supermarket sector in the country are Reliance Industries and
Bharti- Walmart tie up. Other key players include ITC, Food World., Spencer, Godrej,
Pantaloon (Big Baazar and Food Baazar), Subhiksha and Aditya Birla Group (Abid Hussain,
2009).
The economic reforms lead to the emergence a number of new private retail markets, dealing
with fruits and vegetables, agricultural commodities and non-agricultural consumables.
Traditional markets were seen making way for new formats such as departmental stores,
hypermarkets, supermarkets and specialty stores. Most of them were started with foreign
collaboration or in line with western retail markets. Before 1991, Nilgiris and Trinethra were the
only retail chains existing in the country. However, other retail groups like Margin free,
Spencers, Subhiksha, Reliance retail, Food Bazaar and many others were added to the list in the
post-reforms era. The list of these new generation retail chains along with their functions, area of
operation, ownership, formats etc are presented in Table 2. Most of these operators have highly
ambitious plans of extending their operations to more areas by increasing the number of outlets
and scale of operation in the coming years.

47
Table 2 : Growth of India’s Chain food New Liberalized Marketing Institutions
Private
Retailer
markets
Year
entered Ownership Formats Outlets/plans Locations
Nilgiri’s 1971
Local (part
ownership by
Actis, U.K.
supermarkets,
convenience
stores
40; plans for 500
stores by 2010
Major cities in
South India
Trinethra/
Fabmill
1986 Local (Aditya
Birla Group)
supermarkets,
convenience
stores,
170
Major cities in
A.P.,Tamilnadu,
Karnataka and
Kerala
MarginFree 1994
Local
Cooperative
(Consumer
Protection and
Guidance
Society)
Discount
stores,
Supermarkets
350
Major cities in
Kerala, Tamilnadu,
and Karnataka
Spencers 1996 Local (RPG
Group)
Hypermarkets,
supermarkets,
convenience
stores
97; plans to add
50 hypermarkets
by 2008
Major cities in
South India
Subhiksha 1997
Local
(Subhoksha
Trading
Services Pvt.
Ltd)
Discount stores
520; plans for
1200 stores all
over the country
by 2007/08
Major cities in
Tamilnadu, A.P,
Pondichery and
Delhi region
Foodworld 1999
Local
(Subsidiary of
Dairy Farm
Supermarkets 55; plans to
expand in South
Banglore,
Hyderabad

48
International India
Trumart 2001 Local (Pyramid
Retail)
supermarkets,
convenience
stores
29; plans for 90
stores by end of
2007
Maharashtra and
Gujarat, Banglore,
Chennai,
Hyderabad,
Food Bazaar 2002 Local (Future
Group)
Hypermarkets,
supermarkets,
90; Plans for 250
store by 2010
National (major
metros and large
cities)
Metro Cash &
Carry 2003
Foreign (Metro
AG, Germany)
Wholesale”Cas
h & Carry”
3; plans to add
15-18 new
outlets by 2009
Banglore,
Hyderabad,Mumbai
, Kolkata, Chennai
My Dollar
Store 2004
Local
(Franchisee of
My Dollar
Store of the
US)
convenience
stores
50; plans for 400
stores by 2007 Nationwaide
Shoprite 2004
Local
(Subsidiary of
Shoprite (PTY0
Ltd;South
Africa)
Hypermarket
1; plans to add 2-
3 new outlets by
2007
Mumbai
Star India
Bazaar 2004
Local (Trent;
division of Tata
Group)
Hypermarket 3; plans to add
23 Nationwide
Reliance
Retail 2006
Local (Reliance
Industries Ltd.)
Hypermarkets,
supermarkets,
convenience
stores
230; plans for
3,000 stores,
2500 super
markets and 500
hypermarkets by
Nationwide

49
2010
Spinach 2006
Local
(Wadhwan
Retail)
Super markets
89; plans to add
1500 stores in 90
cities by 2010
Nationwide
Max
Hypermarkets 2007
Local –foreign
joint venture
(Spar
International,
Neth.)
Hypermarkets Plans to develop
7 stores by 2009 Nationwide
Bharti1 2007 Local (Bharti
Enterprises)
Hypermarkets,
Supermarkets
Plans to invest
$2.5 billion by
2014
Nationwide
Bhart Walmart 2007
Local –foreign
joint venture
(Wal-mart,
USA)
Wholesale
“cash & carry)
Plans for 15
stores by 2014 Nationwide
Birla “More” 2007 Local –Birla Super markets
1000 stores
$2 billion by
2010
Nationwide
1 Retail Partner of walmart
Source: USDA, Foreign Agriculture Service, 2006; updated from various reports

50
3.3 Features of different models for marketing of fruits and vegetables: A case study in
Hyderabad, A.P.
The features of different systems operating for marketing of fruits and vegetables were studied
through a survey conducted with the officials of Department of Marketing, Hyderabad and
discussion held with management of government controlled Rythu bazzar, Hyderabad. Other
models being followed in marketing of fruits and vegetables were also studied, these included
Reliance Fresh and Subhiksha. The features of these marketing models have been presented in
Table 3.
The Table 3 compares the public markets (Ryathu bazaars) in operation in Andhra Pradesh with
the new generation private retail markets like Reliance fresh and Subhiksha. It was found that in
private retail markets the produce was mostly procured directly from the farmers at the farm
gate. The farmers get higher share as the size of the channel was reduced and the associated costs
like transportation, margins of the market intermediaries and other incidental costs. The middle
men were completely eliminated which resulted in greater efficiency of these retail markets in
comparison to the public models where intermediaries still indirectly exist and eat away a major
chunk of the margins. It was also found that grading and sorting of the produce were
appropriately done in private retail markets which helped the consumers in easy purchase of the
commodities. However, it is mentioned that the public markets were operating at a no-profit no-
loss basis while the private companies derive certain amount of profit from the operation. The
study concludes that the marketing models of private agencies, particularly Reliance Fresh and
Subhiksha were more efficient than that of Rythu bazaar, due to their low cost on marketing,
transport, and incidental charges.

51
Table 3. Marketing functions models of fruits and vegetables under different supply chains.
Sl
No.
Items Rythu bazaars Reliance Subhiksha
1 Marketing
model
Government acts as
facilitator bet
Farmer and
consumer
Directly purchase
from farmer.
Directly purchase from
farmer.
2 Farmers share
in consumer
rupee
Farmers get good
share compare to
retail markets
because of prices
are fixed higher
than local retail
shops but less than
reliance and
subhisha markets
Farmers get higher
share than
rythubazars because
of marketing model
as it saves transport
cost, marketing cost
and other incidental
charges
Farmers get higher
share than rythubazars
because of marketing
model as it saves
transport cost,
marketing cost and
other incidental
charges
3. Role of
middlemen
Partially and
indirectly existing
Complete
elimination of
middlemen
Complete elimination
of middlemen
4. Consumer
status
Below Poverty Line
people, Middle
Class, village
middle class
High income group,
Software
professional, metro
people
High income group,
Software professional,
metro people
5. Organization Government Private Private
6. Goal No profit/loss Commercial/profit Commercial/profit
7. Consumer No grading Grading Grading

52
choice of
grading
8. Prices Prices low Low/high More or less
similar to reliance
9. Marketing
channel
Farmer –
government-
consumer
Company - farmer Company- farmer
10 Participants Farmers,
unemployed
women, self help
group, unemployed
youth
Government
Agencies: Civil
Supplies
corporation,
OILFED,
MARKFED,
Girijana
Cooperative
societies
Company Company

53
4. Conclusions and Policy Implications
In India, organized retailing in Fresh Fruits and Vegetables (FFV) is gaining a lot of impetus
with huge investment by leading Indian corporations. India opened up post – 1990, a number of
new liberalized public markets for fruits and vegetables in the WTO regime. The main functions
of farmers markets are empowering the farmers to participate effectively in the open market to
get a remunerative price for their produce, to avoid the exploitation of both the farmers and the
consumers by the middlemen and increase by enhancing the distributional efficiency of the
marketing system. It will eliminate middlemen, links producers and consumers directly, reduce
price spread, and enhance producer shares in consumer rupee. Forward and Futures markets have
been identified as important tools of price stabilization and risk management. Commodity
exchanges for futures trading narrows the marketing, storage and processing margins, there by
benefiting both growers and consumers. E-Trading based on buying and selling of electronic
warehouse receipts and providing the latest price information. The economic reforms also lead to
the emergence a number of new private retail markets, in new formats such as departmental
stores, hypermarkets, supermarkets and specialty stores. Their number and scale of operations
have been under going a phenomenal growth in the past few years.
The study concludes that the marketing model adopted by private markets particularly reliance
and Subhiksha is more efficient than government markets like Rythu bazaar because the
marketing agency directly go to farmers field and collect fruits and vegetable resulting in
reduced marketing cost, transport cost and other incidental charges.
Therefore, there is an immediate need to replicate such models in a much larger scale to cover
not only the cities but also the interior villages in the country. The study suggests that it is
necessary to amend outdated laws restricting the establishment of markets to allow cooperatives
and private entrepreneurs to set up modern markets. Both public and private retail markets have
to adopt the new marketing models to enhance the distributional efficiency of the marketing
system.

54
5) References
Abid Hussain (2009). “Fresh Fruits and Vegetables/FFV: Constraints and Opportunities”at
http://www.scribd.com/doc/18678642/FFV-Marketing dated 17th August 2009.
Anantia (2008). “ What is India's share in global vegetable & fruits market?” at
http://www.managementparadise.com/forums/archive/index.php/t-25024.html dated 18-09-
2009
Economic Survey (2007-08), Ministry of Finance, Government of India, New Delhi.
Government of India (2001), Report of the Working Group on Horticulture Development for
Tenth Five Year Plan (Main Report) Planning commission, New Delhi
Jaitath M.S. (2008) “Enhancing Farmers’ Linkage to Markets” Indian Journal of Agricultural
Economics, Vol 63. No.3. pp355-356.
National Horticulture Board (2008), National Horticulture Board Data base (http://nhb.gov.in
World Bank (2001), “World Development Report”, Washington, D.C.

55
ACHRYA NG RANGA AGRICULTURAL UNIVERSITY
COLLEGE OF AGRICULTURE, RAJENDRANAGAR
FINAL REPORT
ON
‘Estimating Marketing Efficiency of Horticultural Commodities
under Different Supply Chains in India’
WITH SPECIAL REFERENCE
To
Andhra Pradesh
Dr. C.V. Hanumanthaiah
Professor & Principal Investigator
Department of Agricultural Economics
College of Agriculture, Rajendranagar
Hyderabad

56
1. INTRODUCTION
1.1 Background
The agriculture marketing system of perishables in the country plays a distinct and dominant role
by virtue of the nature of perish ability that warrants due importance to vegetables, flowers and
fruits. Marketing of these very perishable commodities is very important both in terms of price
realization to the farmer - producer and prices within the reach of consumers. The vegetable
grower always looks for a better price and while consumers prefer a normal price which should
be within their reach, the short lived nature of perishable commodities in the market always
causes a tussle between producers and consumers and in the process, the middleman play a
crucial role to take price behaviour to their advantage and this brings profits to them. The
marketing efficiency reflects the share of consumer rupee by the farmer (producer) to a greater
extent possible especially in the case of horticultural commodities which are perishable in their
nature. The price escalation both at the producer level and consumer level is common
phenomenon as it depends upon the number of players involved in marketing of the produce
to make it available with the consumers in most appropriate way. The farmers on one side
look for highly remunerative price for the produce and in the process there is every possibility of
over exploitation. The marketing system where the exploitation is taking place needs to be
thoroughly understood to check the practices by the middleman/commission agents or any actors
present between producer and consumer. To make the marketing system more efficient,
especially for horticultural commodities, a thorough investigation is required. Keeping this in
view, the present study was under taken for the identified perishable commodities. The
commodities identified for the study were Potato, Tomato, Baby Corn, Rose and Grapes.
1.2 Policy Research Questions
The questions that need to be answered in the study are mainly related to the perishable
commodities movement pattern through several intermediate players and their profiteering
pattern. The efforts of the grower to sustain in the marketing system, the price realizations
aspects for the produced perishable commodity in the competitive market need to be
documented. Price spread of the selected perishable crops and ways to integrate the price level

57
between producers and consumers for marketing efficiency pattern of each commodity and
possibilities for the increasing the marketing efficiency of the selected commodities.
1.3 Objectives of the Study.
To estimate the marketing cost and marketing margin of different functionaries for
selected horticultural commodities under various supply chains.
To analyze the price spread, marketing efficiency and farmer’s share in consumer rupee
in various supply chains
To identify the constraints perceived by various stakeholders; and study the factors
influencing the marketing cost / margin / efficiency
To suggest suitable strategies to enhance the marketing efficiency for horticultural
commodities

58
2. DATA AND METHODOLOGY
2.1 Study Area.
The present study was taken up in Ranga Reddy, Medak and Hyderabad districts of Andhra
Pradesh. In view of highest volume of production of the selected five crops in these districts and
due to large scale marketing activity taking place in relation to these crops in Hyderabad district
and as they are endowed with relatively highest areas under respective vegetable crops, these
districts were very much preferred for the present study. The market infrastructure is relatively
larger in terms of presence of number of Rhytu bazaars, Supermarkets and accordingly corporate
market centres and the volume of transactions are relatively very high in Hyderabad district and
hence selected for the present study. The crops included for the present study were Potato,
Tomato, Baby corn, Roses and Grapes.
2.2 Data on Items
The data on market cost, market margin, and price spread for each selected perishables were
collected. Data related to constraints perceived by the farmers, retailers and wholesalers were
elicited with the help of specially designed schedules for the purpose of Garret rank analysis,
Market efficiency for each selected crops was analyzed using appropriate formula.
2.3 Sample Size
A sample of 90 farmers each for all the selected crops except for grape were selected and
included for the present study. The data pertaining to grapes could not be collected from more
than 50 farmers due to limitation of availability of required sample size and thus the total sample
size was 410 farmers. The details of data collected from different Districts, Mandals and Villages
are presented in Table No.1 along with Crop wise details of selection of Intermediaries.

59
Table 1: Crop wise details pertaining to sample design
S.No Name of
the
Crop
Village Mandal District Sample
size
Total
Sample
size
1 Potato Kupppanagar Jarasangam Medak 47 90
Ranjole Zaheerabad 43
2 Tomato Chenvalli Cheval Ranga reddy 55
90 Peddapur Sadha shivapet Medak 18
Shapur Moinabad Ranga reddy 17
3 Baby
Corn
Narsampalli Wargal Medak 40 90
Begum pet Dowltabad 50
4 Rose Shapur Moinabad Ranga reddy 69 90
Peddamangalarum 21
5 Grape Papireddy guda Imbrahimpatnam Ranga reddy 10
50
Akkanpally Maheshawaram 10
Ghatpally Medchal 10
Raviral gate Shameerpet 5
Gowraram Mulugu 5
Shadnagar Shadnagar Mehaboobnagar 10
For the present study, the sample of Intermediaries i.e., Wholesalers, Retailers and Middlemen
were taken as 30 each for each crop, thus comprising the sample intermediaries to 30 for each
crop and 450 as a whole. (Table2)

60
Table 2: Crop wise Details of Intermediaries Sample Design
Crop Wholesalers Retailers Middlemen
Potato 30 30 30
Tomato 30 30 30
Baby Corn 30 30 30
Rose 30 30 30
Grape 30 30 30
2.4 Sampling Methods
For the present study Multistage Random technique was used.
Selection of crops
Arbitrarily, it was decided to select one crop from Fruits (Grapes), Vegetables (Tomato), Flowers
(Roses), Tuber Crop (Potato) and Coming up Vegetables (Baby corn) in the markets.
Selection of District
Three districts of Andhra Pradesh, i.e., Rangareddy, Hyderabad and Medak were chosen as the
volume of production in these three districts was relatively high.
Selection of Respondent
a. Farmer/ producers
The required sample size of farmer (ie. 90 each for Potato, Tomato, Baby corn & Rose and 50
for Grapes) was selected as per the sample decided from the selected mandals and villages taking
the volume of production into consideration. The farmers were identified randomly.
b. Selection of Intermediaries
For each selected crops for both secondary and primary data collection attempt has been made to
collect the data from wholesalers, Retailers & Commission agents operating in the marketing
system.

61
2.5 Statistical Techniques
Different techniques were used for different objectives.
Tabular analysis : Market margin, Market cost, Price spread,
Marketing efficiency
Graphical : Pie charts for Market costs, Price spread
Flow chart for market channels : For all the identified Vegetables,
Functional Logistic model : Factors affecting marketing efficiency
Garrett’s Ranking Technique : Constraints of the farmers and other market
Intermediaries
Marketing Efficiency
Acharya’s Modified Marketing Efficiency
MME = FP/ (MC+MM)
Where,
MME is modified measure of marketing efficiency
FP is price received by farmers
MC is marketing cost
MM is marketing margin
Price Spread
It is the difference between the two prices, i.e., the price paid by the consumer and the price
received by the producer.
For e.g. P1-P2,
Where,
P1 is price at one level or stage in the market
P2 is price at another level

62
Average Gross Margin method
MT = Σ [(Si-Pi)/qi]
Where,
MT is the total marketing margin
Si is the sale value of a product from the ith firm
Pi is the purchase value paid by the ith firm
Qi is quantity of the product paid by the ith firm
Producer Share in Consumer Rupee
PS = (PF/PR)*100
Where,
Pf is price received by the farmer
Pr is retail price (consumer price)
Marketing Margin of Middleman
Ami = Pri – (Ppi+Cmi)
Where,
Pri is the total value of receipts per unit (sale price)
Ppi is the purchase value of good per unit (purchase price)
Cmi is the cost incurred on marketing per unit
Factors affecting Marketing Efficiency
y = f (x1 …xn)
Where,
y = Marketing efficiency (%)
X1 = Marketing cost (Rs.)
X2 = Marketing margin (Rs.)
X3 = Transport cost (Rs.)
X4 = Open market price (Rs.)
X5 = Lab our wages (Rs.)
X6 = Controlling middlemen (put ‘1’, if middlemen are controlled and ‘0’ if
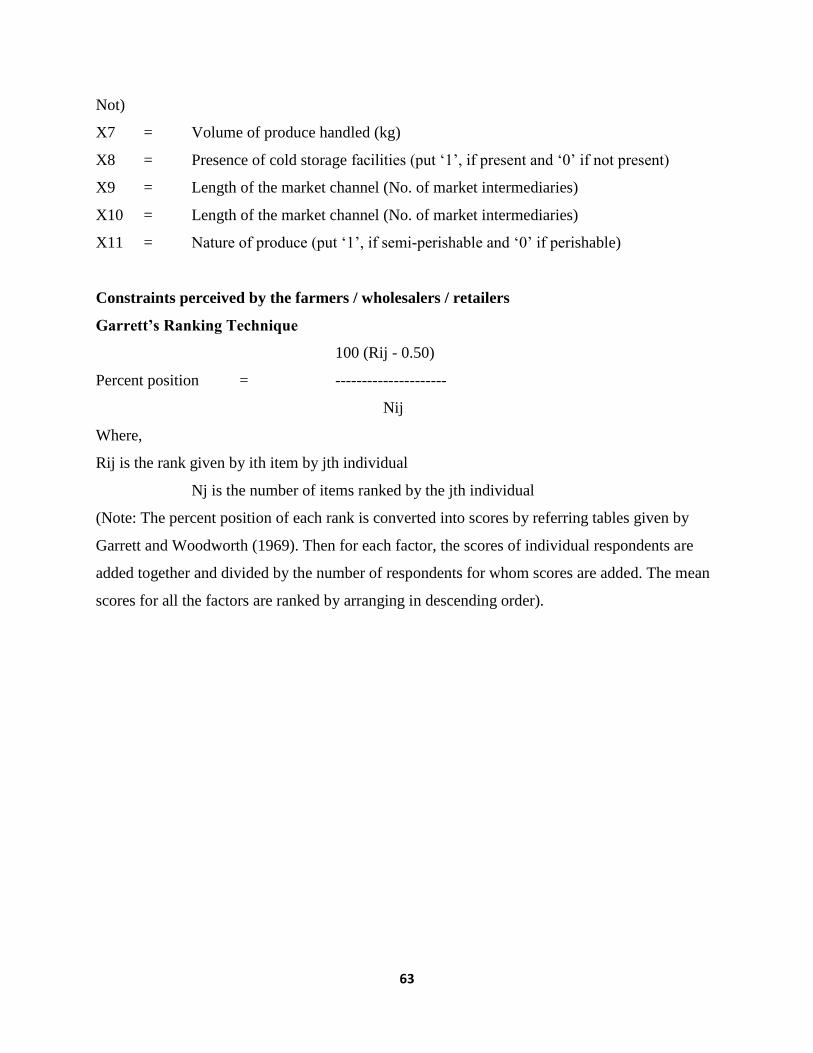
63
Not)
X7 = Volume of produce handled (kg)
X8 = Presence of cold storage facilities (put ‘1’, if present and ‘0’ if not present)
X9 = Length of the market channel (No. of market intermediaries)
X10 = Length of the market channel (No. of market intermediaries)
X11 = Nature of produce (put ‘1’, if semi-perishable and ‘0’ if perishable)
Constraints perceived by the farmers / wholesalers / retailers
Garrett’s Ranking Technique
100 (Rij - 0.50)
Percent position = ---------------------
Nij
Where,
Rij is the rank given by ith item by jth individual
Nj is the number of items ranked by the jth individual
(Note: The percent position of each rank is converted into scores by referring tables given by
Garrett and Woodworth (1969). Then for each factor, the scores of individual respondents are
added together and divided by the number of respondents for whom scores are added. The mean
scores for all the factors are ranked by arranging in descending order).

64
3. RESULTS AND DISCUSSION.
3.1 Status of the Vegetables Production in Andhra Pradesh
Andhra Pradesh comprises seven agro – climatic zones and endowed with rich natural resources
of soil, water and vegetation. The agricultural production system in the state is multi cropped
situation with diversified systems of both agricultural and horticultural crops separately and
together. The state has 2, 03,574 hectares under vegetable area with a production around 34,
32,193 tones (2009-10).
Vegetables, besides providing nutritional security are also a major source of income especially
for small and marginal farmers. The vegetable crops apart from higher productivity and high
value produce, provides more food per unit time and area can improve the economic condition of
the grower as compared to cereal crops. Hence, they are becoming a potential commodity to
provide economic security to the resource poor and marginal farmers in the state. Newly
developed short duration varieties of vegetable crops in the recent years not only fit in the
perennial cropping systems but also in the rice based cropping intensity, can be increased many
fold. The scope for horizontal expansion of area may be limited for want of suitable land in the
state consequent to shifting of cultivated land to real estate and industrial growth and the only
option available is to increase the vertical expansion to increase the productivity adopting newer
production technologies. The productivity of vegetables in the state was 12.35 Mt. / Ha which
quite low as compared to the national average productivity of 15.0 MT/Ha.
There is significant gap in the national average productivity of different vegetable crops as
compared to the world average productivity as well as the potential productivity for the
respective vegetable crops Table 3. Then there is vast scope to improve this productivity of their
crops at national level and more particularly in Andhra Pradesh. This critical gap between
potential yield and national average can be minimized by strong extension services, training and
demonstration. To enhance the vegetable production in the state, our target should be to achieve
25Mt/ha. Productivity by 2020, which is presently around 12.35 Mt/ha. Improvement of the
productivity can be achieved through replacement of varieties/ hybrids and adoption of improved
production/ protection technologies. The low production of vegetable crops in the region could

65
be attributed to a number of biotic, abiotic stresses, irrigation, vagaries of weather conditions and
socio – economic factors.
Table 3: Vegetable Productivity Scenario (2004-05).
Name of the
Crop
India
Average(T/ha)
State
Average
(T/ha)
World Average
(T/ha)
Potential
Productivity
T/ha)
Maximum
Productivity
Achieved (T/ha)
Tomato 14.02 21.80 26.69 60 – 80 70 .45 (USA)
Brinjal 16.08 12.50 17.48 40 -50 34.70 (Japan)
Chili 9.18 6.35 14.40 30- 40 44.50 (Spain)
Okra 9.59 11.70 6.47 15 -20 17.78 (Jordan)
Bean 9.14 5.70 8.35 18-20 20.00 (Ludhiana)
Melon 20.48 15.20 20.95 30-40 45.83(Cyprus)
Cucurbits 9.72 8.30 12.97 25-30 41.33 (Israel)
Cucumber 6.67 7.50 16.98 40-50 67.67(Korea)
Watermelon 12.75 10.25 27.13 30-40 40.96(Spain)
Cabbage 21.43 9.1 25.10 30-40 42.59(Japan)
Cauliflower 17.14 4.5 18.36 35-40 45.25(New Zealand)
Onion 10.38 4.2 17.53 40-50 60.33(Korea)
Garlic 4.17 2.1 12.37 15-20 23.23(Egypt)
Source: Indian Horticulture database 2005

66
However, in the state to maximum open pollinated old and interior varieties with the application
of farmers own package and practices and their traditional vision are followed. In the recent past
(since 2004), continued efforts have been made by vegetable production. Still the area under
hybrid vegetable is very limited.
The state however, has tremendous potential for production of vegetables. The high altitude
zone area in the state has favourable weather conditions. In the agency areas even cool season
vegetables crops can be grown after the harvest of rice during winter season from January to
April every year.
Table 4: Vegetable Area and Production trends in Andhra Pradesh
Year Area(000Ha) Production (000tons)
2005-06 266 4373
2006-07 251 4210
2007-08 299 4942
2008-09 325 5267
2009-10 204 3422
Source: Sakshi Telugu News Paper
The Vegetable Scenario in Andhra Pradesh over the period is not encouraging as the trend of
both area and production has declined between the period 2005-06 and 2009-10. (Table4).
However the Andhra Pradesh Govt. is continuously providing encouragement to Vegetable
growers to improve the vegetable production in the form subsidy on seeds which has been
increased from 50 to 75 percent. The main reason attributable for the declining trend in
vegetables area and production was mainly due to non availability of seeds as per demand and
unfavourable climatic factors.

67
3.2. Economics of Vegetables:
The most important factor impacting the Horticulture sector in growth is the low and declining
productivity. But the potential yield possible for all fruits and vegetables is higher than the
existing yields. The major constraints are non – availability of quality seeds (Hybrid breeds in
all Vegetables), inadequate irrigation facilities, lack of knowledge on nutritient requirement of
these crops, Poor pest / disease management, absence of credit availability in time from
nationalized banks, high cost of production, huge post- harvest losses, lack of road network,
absence of sufficient numbers of cold storage units, poor- market network and high
transportation cost. A great deal is to be done in the field of research, investment to improve the
infrastructure conditions and reduce the post – harvest – losses in the sector do that the per-unit
productivity and per - capita availability of Vegetables could be increased. The general
constraints faced by this sector are timely delivery, grading, packing, production of quality
product, poor market infrastructure, agro processing plants, credit facilities, proper pricing,
uniform grading and standardization of weights and measures, poor post harvest handling low
productivity.
Supply chain
The supply chain has a weak point i.e., it is a multi layered marketing channel lacking required
infrastructure. The efficient supply chain requires strengthening all the levels of infrastructure
such as input delivery, credit, irrigation, procurement, reducing post-harvest loses, creation of
cold store chains, starting of processing units and marketing techniques, improving storage plants
and marketing information.
The infra structure to improve efficiency and the linkages of the supply chain is very poor, which
is affecting the growth potential of the horticulture sector. Timely availability of inputs,
development of organized input market infrastructure for its storage and distribution will add to
the productivity of horticultural crops. The development of cold chain network will help in
reducing the post –harvest losses of fruits and vegetables. Improved post harvest management
means an overall improvement in the per unit productivity. Investment is required to build the
cold storage chain for the refrigerant truckers which procure the produce from the orchard gate,
the pre-cooling chambers, cold area for porting and grading the produce, refrigerated trucks for
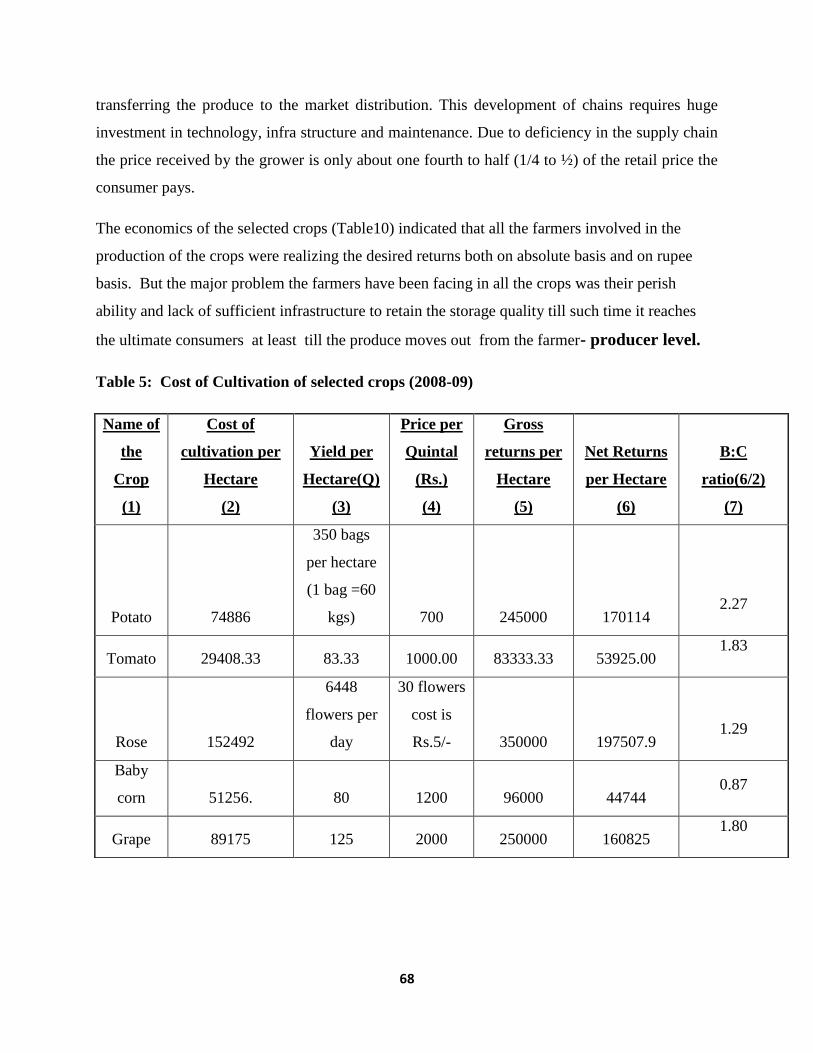
68
transferring the produce to the market distribution. This development of chains requires huge
investment in technology, infra structure and maintenance. Due to deficiency in the supply chain
the price received by the grower is only about one fourth to half (1/4 to ½) of the retail price the
consumer pays.
The economics of the selected crops (Table10) indicated that all the farmers involved in the
production of the crops were realizing the desired returns both on absolute basis and on rupee
basis. But the major problem the farmers have been facing in all the crops was their perish
ability and lack of sufficient infrastructure to retain the storage quality till such time it reaches
the ultimate consumers at least till the produce moves out from the farmer- producer level.
Table 5: Cost of Cultivation of selected crops (2008-09)
Name of
the
Crop
(1)
Cost of
cultivation per
Hectare
(2)
Yield per
Hectare(Q)
(3)
Price per
Quintal
(Rs.)
(4)
Gross
returns per
Hectare
(5)
Net Returns
per Hectare
(6)
B:C
ratio(6/2)
(7)
Potato 74886
350 bags
per hectare
(1 bag =60
kgs) 700 245000 170114 2.27
Tomato 29408.33 83.33 1000.00 83333.33 53925.00 1.83
Rose 152492
6448
flowers per
day
30 flowers
cost is
Rs.5/- 350000 197507.9 1.29
Baby
corn 51256. 80 1200 96000 44744 0.87
Grape 89175 125 2000 250000 160825 1.80
69
3.3 Marketing of Vegetables
The marketing of vegetables in Andhra Pradesh has taken a good turn with the introduction of
Rythu bazars which was mainly aimed to help the vegetable growers to derive maximum
benefits. This public investment influenced private investment in marketing of vegetable crops
with the entering of corporate bodies. The fresh and perishable commodity producers especially
farmers are receiving due price for their valuable produce because of good competition
prevailing in the perishable market scenario. Various costs that are incurred in the marketing of
vegetables and fruits are transport, loading/unloading, market fee and commission. Large
variation may be observed in the cost shares of different commodities. This was mainly due to
high cost of transport borne by the producer farmer located at far-off places from the markets.
For locally produced commodities also transport cost dominated. The variations in the share of
other costs such as commission, loading / unloading, market fees etc. for different commodities
were not high because there were standard norms for charging such cost in the existing
marketing system.
Retailers share in total marketing cost of horticultural products may be dominated by
commission of middle men followed by transport cost. Retailers do not have to pay any
commission to the wholesalers for commodities marketed as they buy directly from the
cultivators in certain cases which were very isolated case.
Traditionally, farmers depend heavily on middlemen particularly in the marketing of fruits and
vegetables. There has been great concern in recent years about the efficiency of marketing of
horticultural produce. It is feared that the low efficiency in the marketing channels accompanied
with poor marketing infrastructure would not only lead to high and fluctuating consumer prices,
but also only a little fraction of the consumer rupee reaching the grower. It may also leads to
deterioration in quality, frequent mismatch between demand and supply over a period of time
resulting to high fluctuating of prices. Therefore, these types of studies address the issues such as
present marketing practices, the seasonal phenomenon, the physical market infrastructure,
existing market channels and the price spread of these fruits, vegetables and flowers.
For improving the marketing of these horticultural products, some major recommendations have
to be considered. Firstly, it is important to bring more markets under regulation and put them
under supervision of market committees. Secondly it is important to promote, and even to
enforce the rules or laws, the practice of open auction in the markets. Thirdly it is essential to
70
bring more number of buyers and sellers to the wholesale markets so as to encourage a healthy
competition in perfect market conditions and better price realization to the growers/ cultivators.
Besides the above measures, improvements in market infrastructure such as storage facilities,
cold storage, better mechanical loading and unloading facilities, better weighing facilities, proper
stalls, good road links etc. would also be helpful to improve marketing efficiency. Finally the
market information system by making available the latest and extensive market information to all
market players through the use of internet facilities, on line marketing facilities, and other means
of communication system need to be paid due attention.
3.4. Innovative Models
Innovative marketing system in case of several crops was different and also from crop to crop
and functionaries to functionaries.
Potato
The innovative marketing system with regard to potato was mainly taking place from producer
to the wholesalers then to the consumers through Self Help Groups (SHGs). The farmers
mainly depend on wholesalers to sell the produce, as they found it more profitable. The
consumer’s interest was taken care by SHGs in all the Rythu Bazars of the Grater Hyderabad city
markets in Potato crop.
Tomato
Tomato produce market was done by the farmers themselves by playing the role of Retailers
which helped them in realizing better price to their Produce.
Baby Corn
Baby corn sales were mainly marketed by few Wholesalers cum Pre Harvest Contractors cum
Processors as this is a new Vegetable crop in the marketing system. It reaches consumer directly
from farmer through wholesalers only and the corporate bodies also play crucial role in this new
vegetable crop marketing.

71
Rose
This highly valuable elegant flowers market was mainly done through involvement of
commission agents. The farmer makes use of the services of commission agents every day to
make roses reach into consumer hands. The Commission agents sell the produce only on the
basis of Commission alone but not on any basis. However, the farmers expressed that the
present system is not to the advantage of the farmers as the market risk is very high.
Grape
Grapes are highly commercial and seasonal crop in Greater Hyderabad city. It was sold by the
farmers on innovative manner by selling the grapes through mobile vans. These mobile vans
have no boundaries. They move the produce throughout the state which helps them in realization
of the satisfactory price despite incurring the sizeable amount on transportation.
Developing supply chains is a new strategy and it is very different from the existing fragmented
traditional markets. There may be several challenges whenever a new system is to be
implemented. Certain aspects suitable for marketing of horticulture produce have to be
considered as furnished below.
Policy environment
Developing linkages with growers
Coordination with growers
Procurement
Post-harvest management
The modern value chains are to be developed by the retail sector. Some concrete investments
have to be made. The government should encourage the establishment of such chains and some
of these efforts needed are
Providing a conductive environment for private sector investment.
Setting standards for products to maintain quality.
Post-harvest management, skilled manpower and infrastructure.
Development of linkages between small and marginal farmers on one side and the retail
sector on the other side.

72
All the above efforts to initiate the retail revolution are likely to have far reaching implications
for the stakeholders including growers, wholesalers and traders in the traditional market. It may
also benefit the small retailers. Of course the extent of impact will depend on the share of
organized retail and the involvement of small and marginal farmers who are involved in the
production of these selected horticultural crops.
Above all the most important aspect which should be given first and fore most thinking is price
stabilization. At present the policy in general deals with a few important commercial crop
products namely tomatos and potatoes. This should be extended to other fruits, vegetables and
commercial flower crops. This policy naturally supports the grower to fetch a better price for his
produce in the market and also benefits the consumer on the other side.
3.5 Market Intermediaries and their Functions
There exist many different shares of the players in the consumer rupee. The grower’s share is
higher if the produce is marketed through co-operative society compared to the private trade.
There is generally no intermediary involved at the primary level of marketing and hence the
growers themselves market the produce at the wholesale market. With regard to other selected
commodities like grapes, market functionaries like village merchants, village contractors etc,
may be involved as intermediaries.
Familiarity on the part of growers because it has been important criterion in determining the
agency of sale i.e. the commission agent and two thirds of growers supply to the commission
agent on the basis of familiarity. The selected non-regulated producers like tomatos and grapes
are not weighed at all during transactions. They may need on the basis of truck loads by grower-
suppliers as well as pre-harvest-contractors. However, at the retail level, their produce is weighed
and sold by the retailers. These tomatoes and grapes are sold basket wise or box wise.
The main function of the commission agent is to mediate between the seller and buyer and some
of them do the functions of assembler and wholesaler.
Although, sale on credit basis may result in higher profit margin for commission agents and or
traders which points to the economic inefficiency of the market. Some times at the wholesale

73
market, the wholesaler and traders of other areas or States followed by retailers are also involved
as intermediaries. Some typical ways of marketing are furnished below.
Up to wholesaling
i) Grower -----------> Commission agent
ii) Grower ---------- > Village merchant/Pre-harvest contractor---------- > Commission
agent
After wholesaling
i) Commission agent ------ > wholesaler/Re-wholesale ----- - >-retailer/hawkers---------->
Consumer.
ii) Commission agent ----- > Retailers------ > Consumers.
iii) Commission agents ---------> Hawkers-----> Consumers
3.6 Supply Chains
The data related to number of farmers adapted by different supply chains for different crops was
presented in Table 6 along with relevant flow charts showing the path of the produce connected
to consumer from producer.
Table 6: Crop wise sample farmers preferred market channels in the existing
supply chain system
Particulars
Supply Chain Potato Tomato Baby corn Rose Grape
Channel 1 P-M-R-C 0 0 44 0 0
Channel 2 P-M-W-R-C 9 43 0 30 28
Channel 3 P-R-C 38 11 11 20 13
Channel 4 P-RELIANCE 0 10 0 0 0
Channel 5 P-W-R-C 43 26 35 40 9

74
Potato
The potato growers mainly preferred the supply chains from Producer to wholesaler, Retailer,
consumer chain. Only less percentage of sample farmers preferred producer, middleman,
wholesaler, retailer and consumer chain. The interesting channel of potato identified was
producer, retailer and consumer. Where, retailers play a usual role in marketing of potato
produce and help the farmers to realize a better price for the produce in the supply chain.
Tomato
The highly perishable crop reaching the consumer through multi channel supply chain
followed by producer, wholesaler, retailer and consumer channel.
Baby corn
The maize product is produced by small group of farmers in isolated places in and around
Greater Hyderabad city. Middlemen supply chain system is playing influential role to the
farmers.
Rose
The elegant flower is reaching consumer through the multi channel supply chains and also with
involvement of retailers between producers and consumers.
Grape
The grapes which is a highly commercial crop reaching the consumer through multi channel
supply chain model and with little role of retailers between producers and consumers in making
grapes reach from producers and consumers.
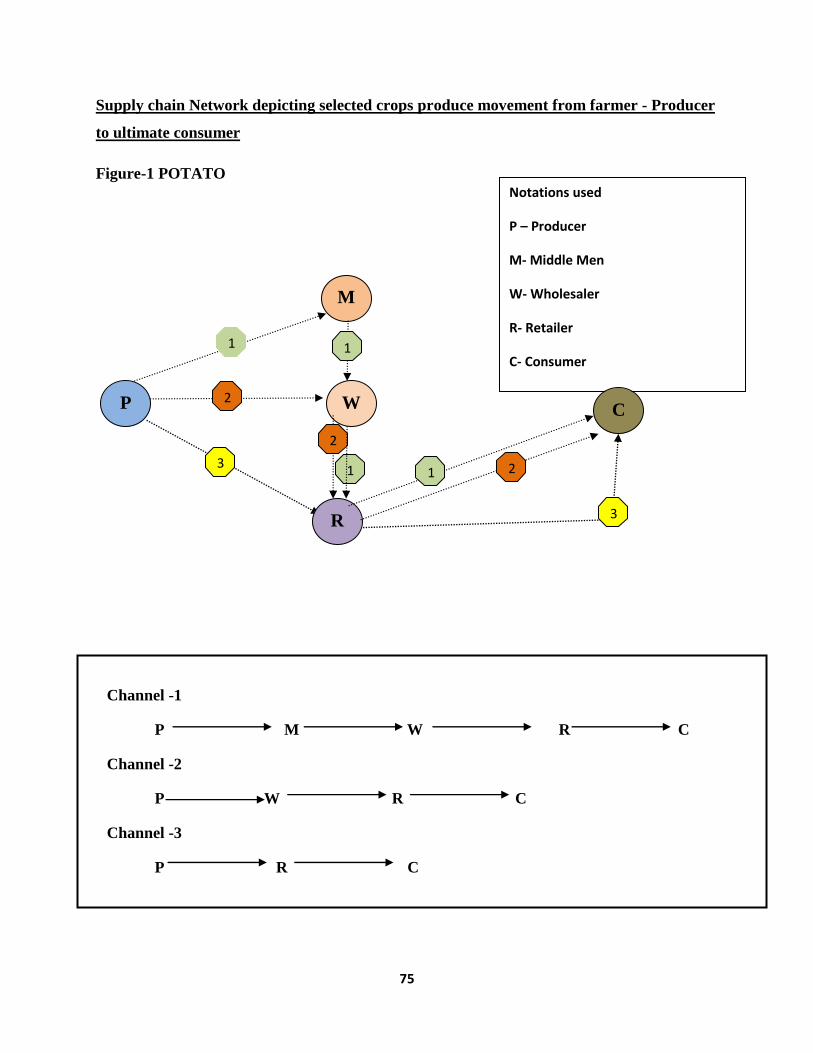
75
Supply chain Network depicting selected crops produce movement from farmer - Producer
to ultimate consumer
Figure-1 POTATO
Notations used
P – Producer
M- Middle Men
W- Wholesaler
R- Retailer
C- Consumer
P
M
W
R
C
3
1 1
1 1
2
2
2
3
Channel -1
P M W R C
Channel -2
P W R C
Channel -3
P R C

76
Figure- 2 TOMATO
M M
Channel -1
P M W R C
Channel -2
P W R C
Channel -3
P R C
Channel -4
P Reliance C
3 4
4 4 4
4
Rel
3
2
2
2
1 1
1 1
C
R
W P
3
2 1 1
R
2
1 1
2 C P W

77
Figure-3 BABY CORN
M
1
Channel -1
P M R C
Channel -2
P W R C
Channel -3
P R C
2 3 1
3
2
2
1 1
C
R
W P

78
Figure-4 ROSE
M
1 1
3
3
2
2
2
1 1
C
R
W P
Channel -1
P M W R C
Channel -2
P W R C
Channel -3
P R C

79
Figure-5 GRAPE
P
M
W
R
C
3
1 1
1 1
2
2
2
3
Channel -1
P M W R C
Channel -2
P W R C
Channel -3
P R C

80
3.7. Produce quantities crop wise handled under different supply chains
The channel wise quantities dealt under different supply chain systems are presented in the Table
7.
Table 7: Quantities handled in different supply chains in kgs per day
Marketing
channel
Potato Tomato Baby Corn Rose Grape
P-M-R-C 0 0 11442 0 0
P-M-W-R-C 24520 56,433 0 375 85214
P-R-C 19657 71956.8 16889 421 94846
P-RELIANCE 0 74957.1 0 0 0
P-W-R-C 15072 64685.7 12774 575 44000
Potato
Multi channel system has handled highest volume of produce (24520 kgs/day)) followed by
producer – retailer - consumer channel (19657 kgs/day) and this channel were preferred very
much in the supply chain system by the producer farmer.
Tomato
The interesting phenomenon in handling of tomato from producer to consumer was almost took
place in all the supply chains including intervention of corporate bodies like Reliance, Spencer’s
etc...
Baby Corn
Baby corn produce was mainly marketed in large quantities through producer –retailer -
consumer supply chain followed by multi channel supply chains.

81
Roses
The highly elegant and highly perishable flower product has to be handled with most care. The
Rose produce reaches the consumer through producer - retailer - consumer (421 kgs) channel
while the other supply chain channel was producer – wholesaler- retailer- consumer (575 kgs.)
Grape
Grape Produce in larger quantities reaching the consumer through producer – retailer-consumer
supply chain. The main reason for this, the retailer playing the role of wholesalers and making
the produce reach the consumer though retailer earns little profit.
3.8. Marketing Cost and Margins.
Marketing cost means the entire expenditure met by the supply chain players to move the
product from different levels and ultimately to respective consumers. The marketing cost items
generally will be packing, storage, transport and commissions to be charged and incurred by the
intermediaries. The selected crops market cost scenario has been presented in table-8 and
discussed crop wise.

82
Table 8. Crop wise Marketing cost and Marketing Margins
Name of the
Crop Potato Tomato Baby Corn Rose Grape
Item Unit Co
st
%
Cons
umer
Price
Unit
Cost
%
Cons
umer
Price
Unit Cost
%
Cons
umer
Price
Unit Cost
%
Consu
mer
Price
Unit Cost
%
Consumer
Price
Farm gate
price at
village
1Q 660 48.35 1Q 1465 49.64 1Q 670 30.66 1 bag
(1bag
consi
st of
40-
50
mini
bags.
each
mini
bag
consi
st of
30 -
40
547 38.77 1Q 2100 75.32
+sorting 1Q 0 0 1Q 0 0 1Q 0 0 0 0 1Q 0 0
+packing 1Q 94.
28
6.91 1Q 134 4.54 1Q 110 5.03 50 3.54 1Q 65 2.33
+transport 1Q 28 2.05 1Q 27.6
8
0.94 1Q 35 1.6 10 0.71 1Q 45 1.61
+others 1Q 28 2.05 1Q 114 3.86 1Q 30 1.37 20 1.42 1Q 20 0.72
Total
marketing
cost
1Q 150
.3
11.01 1Q 275.
7
9.34 1Q 175 8 80 5.67 1Q 130 4.66
Farmer’s
Selling Price
to Local
1Q 720 52.75 1Q 1565 53.03 1Q 925 42.33 600 42.52 1Q 2150 77.12

83
Assembly
Trader at
Rural Market
flowe
rs
+sorting 1Q 0 0 1Q 0 0 1Q 0 0 0 0 1Q 0 0
+packing 1Q 95 6.96 1Q 130 4.41 1Q 110 5.03 45 3.19 1Q 65 2.33
+storage 1Q 0 0 1Q 0 0 1Q 0 0 0 0 1Q 0 0
+transport 1Q 30 2.2 1Q 0 0 1Q 30 1.37 20 1.42 1Q 20 0.72
Total
marketing
cost
1Q 125 9.16 1Q 130 4.41 1Q 140 6.4 65 4.61 1Q 85 3.05
Marketing
margin
1Q 25.
28
1.85 1Q 145.
7
4.93 1Q 35 1.6 15 1.06 1Q 45 1.61
Assembly
traders price
to wholesaler
1Q 838 61.39 1Q 1620 54.9 1Q 1120 51.26 861 61.02 1Q 2242 80.42
+sorting 1Q 0 0 1Q 0 0 1Q 0 0 10 0.71 1Q 10 0.36
+packing 1Q 0 0 1Q 0 0 1Q 0 0 0 0 1Q 0 0
+storage 1Q 20 1.47 1Q 25 0.85 1Q 25 1.14 10 0.71 1Q 25 0.9
+transport 1Q 25 1.83 1Q 28 0.95 1Q 25 1.14 18 1.28 1Q 25 0.9
Market fee 1Q 5 0.37 1Q 10 0.34 1Q 5 0.23 5 0.35 1Q 5 0.18

84
Total
marketing
cost
1Q 50 3.67 1Q 63 2.14 1Q 55 2.51 33 2.34 1Q 55 1.98
Marketing
margin
1Q 75 5.49 1Q 67 2.27 1Q 85 3.89 32 2.27 1Q 30 1.07
Wholesalers
price to
retailers
1Q 970 71.06 1Q 1745 59.13 1Q 1450 66.36 1120 79.38 1Q 2352 84.36
+transport 1Q 20 1.47 1Q 25 0 1Q 20 0.92 16 1.13 1Q 20 0.72
+packing 1Q 15 1.1 1Q 10 0.34 1Q 10 0.46 0 0 1Q 0 0
Total
marketing
cost
1Q 35 2.57 1Q 35 0.34 1Q 30 1.38 16 1.13 1Q 20 0.72
Marketing
margin
1Q 15 1.1 1Q 28 1.8 1Q 25 1.13 17 1.21 1Q 35 1.26
Retailers price
to consumer
1Q 136
5
100 1Q 2951 100 1Q 2185 1411 100 1Q 2788 100

85
Potato
The Potato crop data indicated that the farmer from the farm gate also incurred marketing cost
on packing, transport and others with 11.01% to make the produce reach to local assembler /
trader in rural markets. The marketing cost indicated as 9.16% of the consumer rupee while it
was 3.67% at wholesaler’s level and ultimately by the time reaching from retailers to consumer it
was only 2.57%. The interesting and striking feature was that the farmer producer of potato crop
was incurring highest marketing cost in the consumer rupee compared to that of other players in
the market. Furthermore, the data indicated that the market cost incurred by the retailers was
lowest relatively compared to wholesalers, commission agents. This was mainly due to the
reason that due to fast moving of product and its volatile price situation, the retailers prefer to
sell out the product with minimum storage time hence the marketing cost was low and marketing
margin was also found to be relatively low.
Tomato
The marketing cost scenario in tomato crop indicated that the marketing cost of the tomato
producers in consumer rupee was high with farmer producer in the order followed by village
merchants (4.41%), wholesalers (2.14%) and retailers (0.34%) This data indicates that the
farmers were again major bearers of market cost in consumer rupee compared to other players in
the supply chain system.
Baby corn
The baby corn is a peculiar coming up market product and very much gaining importance in the
market due to its special preference at high end hotels. The market cost borne by the farmer
producer (8%) in the producer rupee followed by other players in the market. The market cost
borne by the farmer producer in consumer rupee was highest among all the supply chain players.
ROSE
The roses are important elegant commodity produced in Rangareddy district in isolated pockets
of the villages. The villages exclusively produce rose flowers and farmers are very much
habituated to produce this crop which was main income source. The roses marketing cost in
consumer price was high at farmer’s level with 5.67% and with assembling trader it was (4.61%)

86
followed by wholesalers (2.34%) and retailers (1.42%). The striking feature of the data suggests
that the producer – farmer incurring more percentage of marketing cost compared to other
players in the supply chain system. However marketing margin in the case of roses indicated
that the market margins have increased from 1.06% of consumer rupee from local Assembly
traders to rural markets (2.27%) and wholesalers (1.21%). The data indicated that the realistic of
market price at farmers level was only 38.77% of consumer rupee in the case of Roses which
was mainly due to the fact that volatile prices of the commodity and perishable nature of the
flower decides circumstantial demand for the product.
Grapes
Grapes is an important crop earlier time in Greater Hyderabad city due to its valuable position
among the fruits. Hyderabad grapes are very famous in early 50s and 60s. Now
the area under grapes has come down drastically due to the fact i.e., lack of sufficient market to
this important fruit crop and also due to its insufficient export importance in Hyderabad city.
However Grape exports have come in to the business both with the forward and backward
linkages. The market cost and margin of the grapes suggest that the producers mainly borne the
marketing cost with greater share of the consumer rupee than other players in the supply chain
system and the trend was in descending order starting from village level merchants to retailers.
Interestingly, it was noticed that the players in the supply chain system were playing dual roles
as wholesalers and retailers to make the product reach from producer to consumers with the help
of mini trucks and they make reach the product from Hyderabad city to far places in Andhra
Pradesh due to the fact of market potential in Hyderabad city and far places in Andhra Pradesh.
The market margins data has also indicated that the realization of margins was very low with
low percentage of consumer price.

87
3.9. Market Margin
The efficiency of marketing system reflects the marketing cost and marketing margins between
different intermediates. Less is .market cost and more is the margins the market is said to be
efficient. The data related to marketing margins and costs are presented in table 9.
Table 9: Marketing cost and Marketing Margin of Selected Fruits & Vegetables
(Rs/q) Potato Tomato Baby Corn Rose Grape
Item Cost
%
Consu
mer
Price
Cost
%
Consume
r Price
Cost
%
Consu
mer
Price
Cost
%
Consu
mer
Price
Cost
%
Consum
er Price
Farm gate price 660 48.35 1465 49.64 670 30.66 547 38.77 2100 75.32
Marketing cost
Producer 150.2
8
11.01 276 9.35 175 8.01
80 5.67 130 4.66
Wholesaler 125 9.16 130 4.41 140 6.41 65 4.61 85 3.05
Retailers 50 3.66 63 2.13 55 2.52 32 2.27 55 1.97
Total marketing cost 325.3 23.83 469 15.89 370 16.93 177 12.55 270 9.68
Marketing margin
Assembler/Trader 25.28 1.85 145.7 4.94 35 1.6 15 1.06 45 1.61
Wholesaler 75 5.49 67 2.27 85 3.89 32 2.27 30 1.08
Retailer 15 1.1 28 0.95 25 1.14 17 1.21 35 1.26
Total marketing
margin
115.3 8.44 241 8.16 145 6.63 64 4.54 110 3.95
Consumer price 1365 100 2951 100 2185 100 1411 100 2788 100

88
Potato
In the case of potato the marketing cost was 23.83% with a major share borne by the producer
farmer with 11.01% followed by the wholesaler with 9.16%. The marketing margin in potato
crop indicated that the wholesaler was gaining more percentage of benefit with marketing margin
of 5.49 % in the total marketing margin of 8.44%.
Tomato
The total marketing cost in the tomato crop supply chain system was 15.89% and the lion share
was borne by the producer himself with 9.35% per Qtl. The market margins comes to 8.16% of
which assembler or trader take the more share with the margin of 4.94% i.e., more than 60% it
accounts.
Baby corn
The Baby corn was less marketed with less number of participation of intermediaries in number.
The product reaches through supply chain to the consumer with 16.93% of market cost of
consumer price while the market margins in the consumer rupee were 6.63% of which
wholesaler major share was 60%.
Rose
In the case of Roses, the marketing cost was 12.55% with a major share borne by producer
(5.67%) as the produce was sold in the market in mini packets consisting 30-35 flowers in
physical number with a major share borne by producer. The share of wholesaler was 4.61%
followed by retailers (2.27%). The total market margin in consumer Rupee was 4.54% since the
chance to make margins in this perishable elegant commodity looks like to be very low. Out of
this the major share is gained by wholesaler i.e., 2.27%. The consumer rupee was shared by
traders (1.06%) and retailers (1.21%) for their active functioning in the supply chain system..
Grape
Grapes are grown in isolated pockets in and around Hyderabad city with less number of
participation of intermediaries. The marketing cost indicated as 9.6% of consumer Rupee. The

89
marketing margin realization was very low in the grape crop to the intermediaries because of its
high perishable in nature.
3.10 Price Spread
The data related to price received by the farmer/ producer and price paid by the consumer
has been worked out under different supply chain system for the sample farmers for all the
selected crops. The information related to market cost and market margins under different supply
chains to different intermediaries incurring cost and making margins was presented crop
wise.(10A-10E).
Potato
The price spread collected for the potato crop under different supply chains system indicated
(Table 10A) that the marketing margins at wholesalers and retailers level and also the market
cost was relatively high at the intermediary level. The data supports the arguments that the
intermediaries play a crucial role in realizing better margins for them compared to that of potato
growers.

90
Table 10A: Price Spread of Potato (per Kg.)
Particulars
Potato
P-M-R-C P-M-W-R-C P-R-C P-RELIANCE P-W-R-C
Price received by the
farmer
0 6.25 6.6 0 6.3
Cost incurred 1.23 1.45 1.8
Margin 0 1.25 2 0 2.1
Wholesaler’s
purchase price
0 7.5 8.4
Cost incurred 0 0 0 0 0
Margin 0 1.5 8.6 0 1.8
Retailer’s purchase
price
0 9 8.6 10.2
Cost incurred 0 2 1.85 0 1.5
Margin 0 4.27 4.9 0 3.7
Price paid by the
consumer
0 13.27 13.5 13.9

91
Tomato
The data related to tomato crop indicated (Table 10B) that the margins were relatively high at
intermediary levels and the price realization by the producers was not that high in consumer
rupee in any of the supply chain.
Table 10B: Price Spread of Tomato (per kg.)
Particulars Tomato
P-M-R-C P-M-W-R-C P-R-C P-RELIANCE P-W-R-C
Price received by
the farmer
0 14.53 14.7 14.8 15.5
Cost incurred 0 1.5 1.5 2.4 1.5
Margin 0 5.37 3.53 7.7 1
Wholesaler’s
purchase price
0 19.9 0 0 16.5
Cost incurred 0 0 0 0 0
Margin 0 3.55 18.2 0 3.3
Retailer’s purchase
price
0 23.45 18.2 0 19.8
Cost incurred 0 0 0 0 0
Margin 0 5.2 6.6 22.5 4.7
Price paid by the
consumer
0 28.65 24.8 22.5 24.5

92
Baby corn
The price spread of baby corn indicated (Table 10 C) that the price spread was relatively very
favorable to wholesalers and retailers when compared to baby corn producers. The farmers were
very limited in number and in the pockets of isolated villages of Medak district where the
middlemen dominate the price structure. The wholesalers and retailers are encashing more
market margins in this new upcoming crop.
Table 10 C: Price Spread of Baby Corn (Per kg.)
Particulars
Baby Corn
P-M-R-C P-M-W-R-C P-R-C P-
RELIANCE P-W-R-C
Price received by
the farmer 4.5 0 6 0 4.95
Cost incurred 0 0 1.5 0 1.8
Margin 11.3 0 9.65 0 5.7
Wholesaler’s
purchase price 15.8 0 0 0 10.65
Cost incurred 0 0 0 0 0
Margin 3.1 0 0 0 4.89
Retailer’s purchase
price 18.9 0 15.7 0 15.54
Cost incurred 0 0 0 0 0
Margin 3.48 0 8.85 0 4.89
Price paid by the
consumer 22.38 0 24.5 0 21.25

93
Rose
The Price Spread data of Roses indicated that the wholesaler and retailer were realizing margins
almost in equal amounts because of its high perishable nature (Table 10D).
Table .10 D: Price Spread of Rose(per big bag which consist of 45 mini bags with 30 to
35 flowers each)
Particulars
Rose
P-M-R-C P-M-W-R-
C P-R-C
P-
RELIANCE P-W-R-C
Price received by the
farmer 0 5.47 6.56 0 5.47
Cost incurred 0 0.5 1.5 0 0.5
Margin 0 3.2 0 0 3.2
Wholesaler’s
purchase price 0 8.67 0 0 8.67
Cost incurred 0 0 0 0 0
Margin 0 4.06 4.17 0 4.06
Retailer’s purchase
price 0 12.73 10.7 0 12.73
Cost incurred 0 0 0 0 0
Margin 0 3.02 3.57 0 3.02
Price paid by the
consumer 0 15.75 14.3 0 15.75

94
Grape
Grape area in Greater Hyderabad city has declined in a most drastic way and also the due to
the fact that the farmers involved in producing this commercial crop lack sufficient
encouragement on several fronts. The data indicated (Table 10E) that the price margins were
high in retailers with 4.5 Rs/kg. And the margin was high when compared to other players.
Table 10 E: Price Spread of Grapes (per kg.)
Particulars
Grape
P-M-R-C P-M-W-R-
C P-R-C
P-
RELIANCE P-W-R-C
Price received by the
farmer 0 19.3 22.1 0 19.7
Cost incurred 0 1.5 1.8 0 1.5
Margin 0 1.7 3.4 0 1.3
Wholesaler’s
purchase price 0 21 0 0 21
Cost incurred 0 0 0 0 0
Margin 0 3 0 0 3
Retailer’s purchase
price 0 24 25.5 0 24
Cost incurred 0 0 0 0 0
Margin 0 11 4.5 0 11
Price paid by the
consumer 0 35 30 0 35

95
3.11. Share of different agencies in Consumer Rupee.
Each intermediary agency will have its due share while moving the produce from producer to the
consumer. Every intermediary will have certain share in consumer rupee for their function and
roll. Accordingly the data has been analyzed and estimated the percentage of share taken by the
each agency for their function to make the produce move from producer to consumer. The data
on different agencies share crop wise presented in Table 11.
Table 11: Share of different agencies during marketing of selected crops (%)
Sl
No.
Particulars Potato Tomato Baby
corn Rose Grape
Agency Function Share in final price
I Retailers Retailing 71.06 59.13 66.4 79.4 84.4
II Wholesalers Breaking bulk 61.39 54.9 51.26 61 80.4
III Commission
agent Market/making 52.75 53.03 42.33 42.5 77.1
IV Trader Packing/transportation/making 48.35 49.64 30.66 38.8 75.3
V Commission
agent Market/making 0 0 0 22.5 0
VI Large farmer Consolidation 54.96 49.03 0 40.4 65.8
VII Small farmer Production 40.35 38.85 25.08 33.8 56.7
Consumer
price 328.9 304.58 215.73 318 440
The striking feature of the data was that in all the selected crops the share of retailers was high
for all the crops followed by wholesalers and traders and lastly farmers. This is quite logical and
true as in the order of descending in the supply chain system. The share of retailers was found to
be high followed by other agencies in the supply chain system. The farmers share in consumer
rupee was low in all the crops because of several explainable and unexplainable reasons such as
poor bargaining power , low capacity of product retention, illiteracy, good market outlets and
due encouragement in the form of price support and suitable storage facilities for the perishable
commodities

96
3.12 Marketing Efficiency
The Acharya’s formula was used to testify market efficiency under different supply chains
system.
Potato
The market efficiency in the case of channel Producer-Retailer-Consumer was 90% followed
by the Producer-Wholesaler-Retailer-Consumer and in this channel Producer-middleman-
wholesaler-consumer it is 75%. The information indicates (Table 12A) that more intermediaries
in supply chain systems market efficiency decrease and vise-versa.
Table 12 A: Measurement of Marketing Efficiency of Potato
S.No. Particulars Unit
Channel 1
P-M-R-C
Channel 2
P-M-W-R-C
Channel 3
P-R-C
Channel 4
P-RELIANCE- C
Channel 5
P-W-R-C
1 Retailer’s sale price
(RP) Rs/q 0 1138 1014 0 1150
2 Total marketing
costs (MC) Rs/q 0 124 97 0 95
3 Total margins of
intermediaries (MM) Rs/q 0 705 660 0 732
4 Price received by
farmer (FP) Rs/q 0 622 680 0 660
5
Value added by the
marketing system
(1-4)
Rs/q 0 516 334 0 490
Index of Marketing Efficiency
Acharya’s method
(MME) [4 / (2+3)] Ratio 0 0.75 0.9 0 0.8

97
Tomato
In case of Tomato crop, the participation of corporate body between producer and consumer
as in intermediary in marketing system has indicated high market efficiency with more than
100% followed by multi channel supply system.(Table 12B).
Table 12 B: Measurement of Marketing Efficiency of Tomato
S.No. Particulars Unit
Tomato
Channel 1
P-M-R-C
Channel 2
P-M-W-R-C
Channel 3
P-R-C
Channel 4
P-RELIANCE –C
Channel 5
P-W-R-C
1 Retailer’s sale price
(RP) Rs/q 0 2810 1780 2550 1720
2 Total marketing costs
(MC) Rs/q 0 550 312 317 544
3 Total margins of
intermediaries (MM) Rs/q 0 1360 1760 1070 1740
4 Price received by
farmer (FP) Rs/q 0 1450 1460 1480 1470
5 Value added by the
marketing system (1-4) Rs/q 0 1360 320 1070 250
Index of Marketing Efficiency
Acharya’s method
(MME) [4 / (2+3)] Ratio 0 0.76 0.7 1.07 0.64
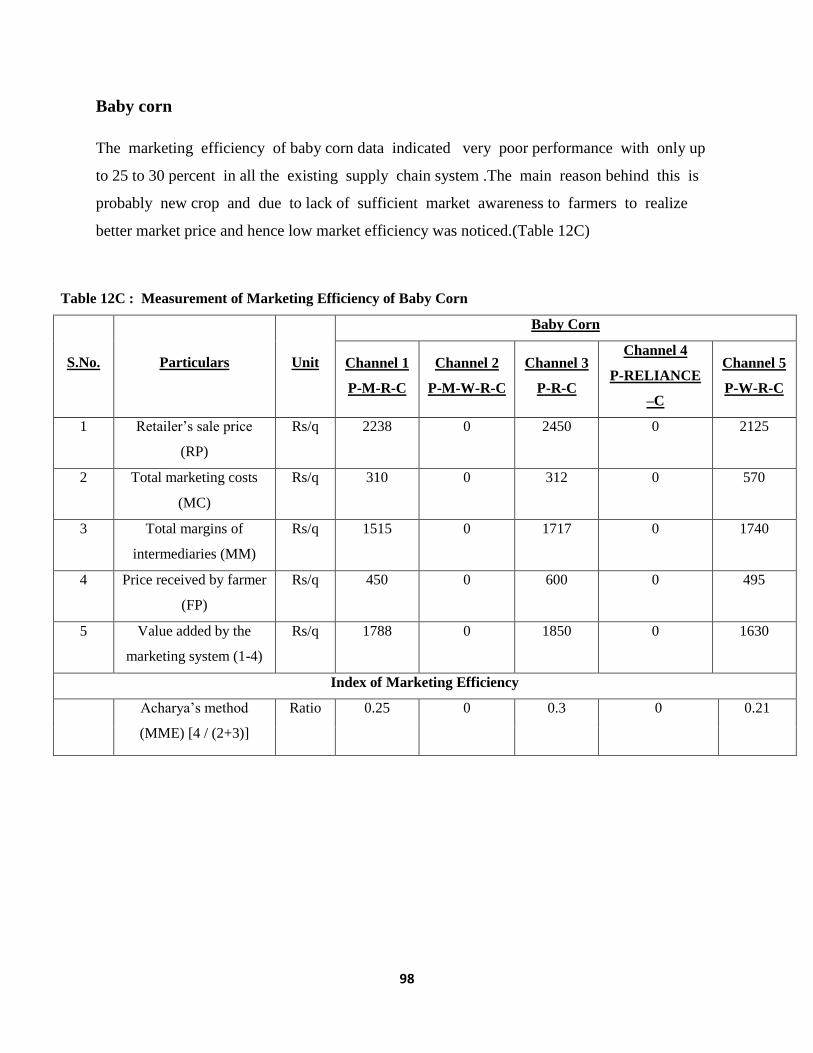
98
Baby corn
The marketing efficiency of baby corn data indicated very poor performance with only up
to 25 to 30 percent in all the existing supply chain system .The main reason behind this is
probably new crop and due to lack of sufficient market awareness to farmers to realize
better market price and hence low market efficiency was noticed.(Table 12C)
Table 12C : Measurement of Marketing Efficiency of Baby Corn
S.No. Particulars Unit
Baby Corn
Channel 1
P-M-R-C
Channel 2
P-M-W-R-C
Channel 3
P-R-C
Channel 4
P-RELIANCE
–C
Channel 5
P-W-R-C
1 Retailer’s sale price
(RP)
Rs/q 2238 0 2450 0 2125
2 Total marketing costs
(MC)
Rs/q 310 0 312 0 570
3 Total margins of
intermediaries (MM)
Rs/q 1515 0 1717 0 1740
4 Price received by farmer
(FP)
Rs/q 450 0 600 0 495
5 Value added by the
marketing system (1-4)
Rs/q 1788 0 1850 0 1630
Index of Marketing Efficiency
Acharya’s method
(MME) [4 / (2+3)]
Ratio 0.25 0 0.3 0 0.21

99
Rose
The market efficiency of roses indicated as 54% under channel producer-retailer-consumer
with a 40% in the producer-wholesaler-retailer-consumer channel the very delegate nature and
perish ability of flowers the farmers may have to sell the produce at the price offered by
the middlemen and commission agents and hence The market efficiency was ranged between
35 to 54 percent.(Table 12D).
Table 12 D: Measurement of Marketing Efficiency of Rose
S.No. Particulars Unit
Rose
Channel 1
P-M-R-C
Channel 2
P-M-W-R-C
Channel
3
P-R-C
Channel 4 P-
RELIANCE-
C
Channel 5
P-W-R-C
1 Retailer’s sale price (RP) Rs/q 0 1575 1430 0 1575
2 Total marketing costs
(MC) Rs/q 0 441 357 0 341
3 Total margins of
intermediaries (MM) Rs/q 0 1110 857 0 1010
4 Price received by farmer
(FP) Rs/q 0 547 656 0 547
5 Value added by the
marketing system (1-4) Rs/q 0 1028 774 0 1028
Index of Marketing Efficiency
Acharya’s method
(MME) [4 / (2+3)] Ratio 0 0.35 0.54 0 0.4

100
Grapes:
The grapes are most liked commercial fruits for its table purpose has indicated high
marketing efficiency in all the supply chain systems. The marketing efficiency indicated
100% and above in all the existing supply chain systems because of the systemized and defined
supply chains to this valuable crop.(Table 12E)
Table 12E: Measurement of Marketing Efficiency of Grape
S.No. Particulars Unit
Grape
Channel 1
P-M-R-C
Channel 2
P-M-W-R-C
Channel
3
P-R-C
Channel 4
P-RELIANCE-C
Channel 5
P-W-R-C
1 Retailer’s sale price
(RP) Rs/q 0 3500 3000 0 3500
2 Total marketing
costs (MC) Rs/q 0 320 212 0 540
3
Total margins of
intermediaries
(MM)
Rs/q 0 1360 1750 0 1450
4 Price received by
farmer (FP) Rs/q 0 1930 2210 0 1970
5
Value added by the
marketing system
(1-4)
Rs/q 0 1570 790 0 1530
Index of Marketing Efficiency
Acharya’s
method (MME)
[4 / (2+3)]
Ratio 0 1.15 1.13 0 0.99

101
3.13 Constraints Perceived by Various Stakeholders
The information pertaining to farmers, wholesalers, retailers perception towards logically
identified constraints were analyzed for their normal and Garret ranking and presented
crop wise (Tables 13A to 13E).
Potato
Both Garrets and normal rankings were analyzed for several constraints and found (Table
13A) that the Garret ranking came first for the constraint Malpractices in auction, while the
normal ranking indicated Faulty weighment. In the perception of farmers, normal ranking
indicated second position in case of constraint related to facilities to farmers to stay in the
market and the rank for the same constraint stood in second position with respect to
wholesalers. Wholesalers perceived highest Garret rank related to storage facilities lacking.
Retailers perceived that Non availability of marketing credit is major constraint for the potato
crop as per the Garret ranking. The second constraint in the order perceived by the farmer as per
the Garratt Ranking forcible sales to pre –harvest contractors when there is lack of sufficient
market while the normal ranking indicated per the same constraint as 12th
position by the
retailer.

102
Table 13A: Constraints perceived by the farmers, wholesalers and retailers in
marketing of Potato
Constraints
Farmer Wholesalers Retailers
Normal
Ranking
Garret
Ranking
Normal
Ranking
Garret
Ranking
Normal
Ranking
Garret
Ranking
Forced to sell to pre-harvest contractor due to
absence of market 3 8 1 3 12 2
Non-availability of marketing credit 12 10 3 7 6 1
Faulty weighment 1 11 4 11 2 5
Very high commission rates 4 7 5 9 3 7
Commission charged more than once 5 9 6 10 4 9
Malpractices in auction 11 1 12 8 5 8
Presence of exploitative middlemen 7 5 9 12 1 12
High Market Fee 8 4 10 6 9 4
Practice of bribing at the market 9 2 8 5 7 6
Inadequate facilities at the market 10 3 11 2 11 10
No storage facility 6 6 7 1 10 3
No facilities for personnel stay at the market 2 12 2 4 8 11

103
Tomato
Tomato is one of the very high perishable crop and was subjected to farmers perception to rank
them as per garrets ranking. The farmer’s perception indicated (Table13.B) those Malpractices in
auction system was main constraint followed by high market fees. The wholesaler’s perceived
lack of sufficient storage facility as first Garret rank while retailers ranked the constraint related
to presence of exploitative middlemen as first Garret Rank. Table 13. B. Constraints perceived by the farmers, wholesalers and retailers in marketing of Tomato
Constraints
Farmer Wholesalers Retailers
Normal
Ranking
Garret
Ranking
Normal
Ranking
Garret
Ranking
Normal
Ranking
Garret
Ranking
Forced to sell to pre-harvest contractor due to
absence of market 1 11 5 3 2 12
Non-availability of marketing credit 3 10 9 7 1 6
Faulty weighment 4 8 7 11 5 2
Very high commission rates 6 7 11 9 7 3
Commission charged more than once 5 9 8 10 9 4
Malpractices in auction 12 1 6 8 8 5
Presence of exploitative middlemen 9 5 4 12 12 1
High Market Fee 10 2 2 6 4 9
Practice of bribing at the market 8 3 12 5 6 7
Inadiquate facilities at the market 11 4 10 2 10 11
No storage facility 7 6 1 1 3 10
No facilities for personnel stay at the market 2 12 3 4 11 8
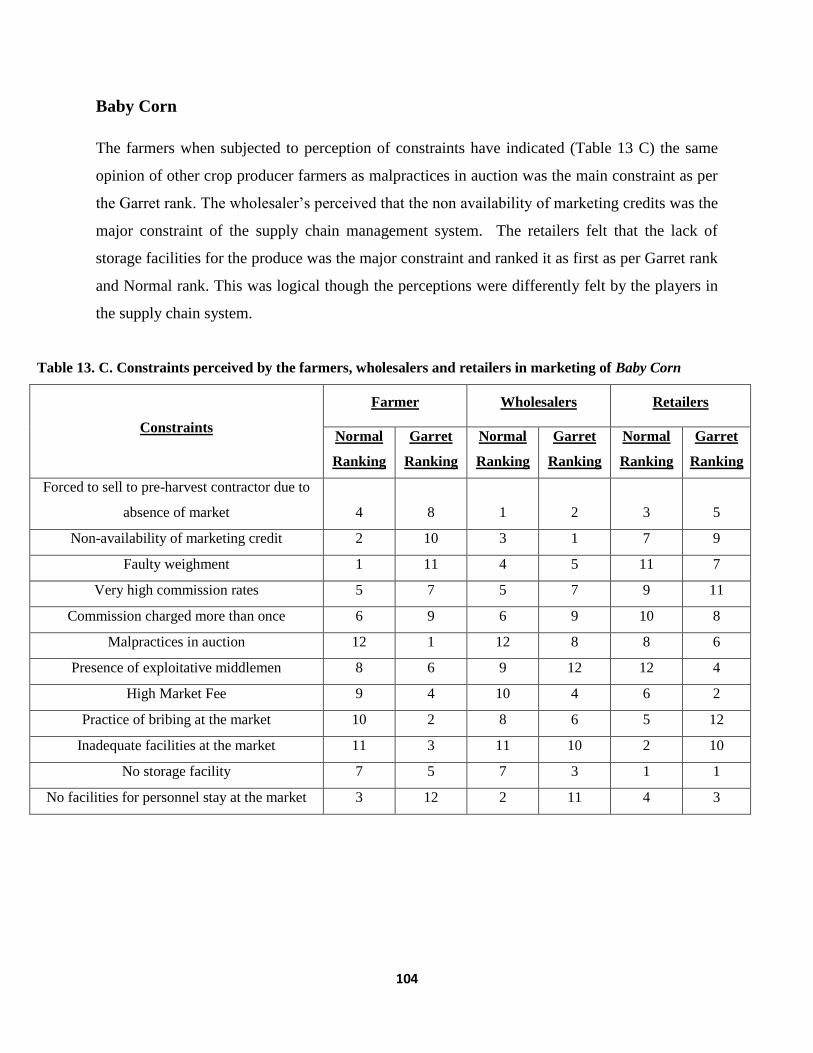
104
Baby Corn
The farmers when subjected to perception of constraints have indicated (Table 13 C) the same
opinion of other crop producer farmers as malpractices in auction was the main constraint as per
the Garret rank. The wholesaler’s perceived that the non availability of marketing credits was the
major constraint of the supply chain management system. The retailers felt that the lack of
storage facilities for the produce was the major constraint and ranked it as first as per Garret rank
and Normal rank. This was logical though the perceptions were differently felt by the players in
the supply chain system.
Table 13. C. Constraints perceived by the farmers, wholesalers and retailers in marketing of Baby Corn
Constraints
Farmer Wholesalers Retailers
Normal
Ranking
Garret
Ranking
Normal
Ranking
Garret
Ranking
Normal
Ranking
Garret
Ranking
Forced to sell to pre-harvest contractor due to
absence of market 4 8 1 2 3 5
Non-availability of marketing credit 2 10 3 1 7 9
Faulty weighment 1 11 4 5 11 7
Very high commission rates 5 7 5 7 9 11
Commission charged more than once 6 9 6 9 10 8
Malpractices in auction 12 1 12 8 8 6
Presence of exploitative middlemen 8 6 9 12 12 4
High Market Fee 9 4 10 4 6 2
Practice of bribing at the market 10 2 8 6 5 12
Inadequate facilities at the market 11 3 11 10 2 10
No storage facility 7 5 7 3 1 1
No facilities for personnel stay at the market 3 12 2 11 4 3

105
Roses
Roses are another important volatile oriented market commodity. The rose farmers when
subjected to study their perception towards constraints to rank them as per Garret rank indicated
(Table 13 D) that malpractices in auction system was main constraint as the ranked it No.1.
Interestingly the wholesalers were perceived the same constraints i.e. malpractices in auction
system as major constraint. The retailers perceived that the presence of exploitative middlemen
in the supply chain system as a major constraint and ranked it as one as per the Garret ranking.
The results concluded here were quite nearer to the actual situation observed in the supply chain
system in the marketing of rose flowers.
Table 13. D. Constraints perceived by the farmers, wholesalers and retailers in marketing of Rose
Constraints
Farmer Wholesalers Retailers
Normal
Ranking
Garret
Ranking
Normal
Ranking
Garret
Ranking
Normal
Ranking
Garret
Ranking
Forced to sell to pre-harvest contractor due to
absence of market 1 11 3 8 4 12
Non-availability of marketing credit 3 7 7 10 2 6
Faulty weighment 4 8 11 11 1 2
Very high commission rates 5 9 9 7 5 3
Commission charged more than once 6 10 10 9 6 4
Malpractices in auction 12 1 8 1 12 5
Presence of exploitative middlemen 9 6 12 5 8 1
High Market Fee 10 3 6 4 9 9
Practice of bribing at the market 8 5 5 2 10 7
Inadiquate facilities at the market 11 2 2 3 11 11
No storage facility 7 4 1 6 7 10
No facilities for personnel stay at the market 2 12 4 12 3 8

106
Grapes
The perception of grape farmers towards constraints when analyzed indicated (Table 13. E)
that the presence of exploitative middlemen was the main constraint and ranked it as No.1. In
the opinion of wholesaler’s perception it was faulty weighment ranked first while that of retailers
indicated that the malpractices prevailing in the auction system.
Table 13 E: Constraints perceived by the farmers, wholesalers and retailers in marketing of Grape
Constraints
Farmer Wholesalers Retailers
Normal
Ranking
Garret
Ranking
Normal
Ranking
Garret
Ranking
Normal
Ranking
Garret
Ranking
Forced to sell to pre-harvest contractor due
to absence of market 3 12 11 3 1 8
Non-availability of marketing credit 7 6 10 12 3 10
Faulty weighment 11 2 8 1 4 11
Very high commission rates 9 3 7 4 6 7
Commission charged more than once 10 4 9 5 5 9
Malpractices in auction 8 5 1 11 12 1
Presence of exploitative middlemen 12 1 5 7 9 5
High Market Fee 6 9 2 8 10 4
Practice of bribing at the market 5 7 3 9 8 2
Inadequate facilities at the market 2 11 4 10 11 3
No storage facility 1 10 6 6 7 6
No facilities for personnel stay at the
market 4 8 12 2 2 12
The Garret rank results have indicated a consistency in perception of constraints perceived by the
farmers in the case of Potato, Tomato and Baby corn. Malpractices in auction system as a
constraint was ranked first as per Garrets in all the three crops. The results were quite true and
very much acceptable fact in supply chain system.
107
3.14. Factors affecting marketing cost, margin and efficiency
The marketing efficiency of Agricultural commodities will be influenced by several parameters
under several circumstances. The marketing efficiency is one where the producer receives higher
percentage of consumer rupee. More the producer shares in consumer rupee more is the efficient
marketing system. Accordingly, it was decided to include certain parameters to study the
influence of these parameters on marketing efficiency. The data related to factors affecting
marketing efficiency are presented crop wise in Table-14.
The data indicated that the marketing margin coefficients of Potato (-0.2385), Tomato
(-0.1041), Baby corn (-0.1136), Roses (-0.1185) & Grapes (-0.0189) indicated negative
coefficients and all are found to be significant at one percent level of Probability. Thus the data
indicated that as the marketing margin is increasing, the marketing efficiency is found to be
decreased.The marketing cost information with respect to Potato (-0.1467), Tomato (-0.0676),
and grapes (-0.0043) indicated negative relationship which indicates that more is the marketing
cost less is the marketing efficiency. The other results related to labor wages and middlemen
controlling has indicated a negative relationship which also indicates that these factors were also
influencing the market efficiency drastically.
The results were quite logical as the variables identified have a direct relationship that influences
marketing efficiency very well. Further, the data also indicated that more is the length of market
channel less is the market efficiency and with respect to tomato and grape crops the data
indicated a significant results.

108
Table 14 : Factors affecting marketing cost, margin and efficiency
Marketing Efficiency = f (x1 --------------- xn)
Factors Potato Tomato Baby Corn Rose Grape
Coefficient ‘t’ value Coefficient ‘t’ value Coefficient ‘t’ value Coefficient ‘t’ value Coefficient ‘t’ value
Marketing cost x1 -0.1467 3.581***
-0.0676 6.2538***
0.0005 6.553***
0.0136 1.455 -0.0043 13.566***
Marketing margin x2 -0.2385 38.189***
-0.1041 25.5595***
-0.1136 14.049***
-0.1185 21.126***
-0.0189 1.459
Transport cost x3 0.0005 0.467 0.0031 1.9694**
0.0006 65.535
-0.0833 3.172***
-0.0084 1.757*
Open market prices x4 0.1218 27.089***
0.0543 16.9106***
0.0831 8.907***
0.0893 22.901***
-0.0011 0.165
Labour wages x5 -0.0002 0.488 0.0006 1.3272 0.0003 0.427 -0.0001 0.228 -0.0006 0.552
Controlling middlemen x6 -0.0019 0.531 -0.0112 2.1357**
-0.0027 0.328 -0.0001 0.037 0.0183 1.134
Volume of the produce
handled x7 0.0008 0.042 0.0001 0.8528 0.0001 0.071 0.0001 0.856 1.70E-07 0.536
Presence of cold storage
facilities x8 0.0004 0.061 -0.0034 0.4722 0.0041 0.333 -0.0049 0.726 0.0337 1.997
**
Length of the market
channel (No. of market
intermediaries) x9
-0.011 0.721 -0.0414 3.5456***
0.0496 1.361 -0.0148 1.417 -0.0409 1.706*
Existence of competition in
selling x10 0.0037 0.262 0.013 0.8527 0.0099 0.421 0.005 0.328 -0.0722 1.893
*
Nature of produce
(perishable/semi-perishable)
x11
0.0021 0.155 -0.0016 0.1079 -0.0207 0.871 0.0004 0.027 0.07185 1.875*

109
( * ) Significant at 10% lead of probability
( ** ) Significant at 5% lead of probability
( *** ) Significant at 1% lead of probability

110
3.15 Suggestions to increase marketing Efficiency
The study has examined the marketing of selected fruits and vegetables; in light of wide
spread concern about poor marketing efficiency and low share of farmers in the consumer
rupee. The objective of the present study was to improve the marketing and efficiency of
these selected products i.e. Potato, Tomato, Baby corn, Roses and Grapes.
These selected crops are known for their perish ability, seasonality in plain and has
exhibited substantially in these crops. The study finds that the extent of contract between
farmers and commission agents was low and needs considerable improvement. It has also
showed that the practice of open auction in the market was very low and so much
potential for gain in market efficiency has not been realized.
Then the present study revealed that the share of the farmer in the consumer price works
out to only 48 per cent for vegetables and 37 per cent for fruits. Further, this explicit cost
makes out to only very measurable percentage of the price difference between the farmer
and the consumer, and the profit margin works out between to 80 to 90 percent of price
difference. Thus it was the relatively poor efficiency of the marketing system despite the
presence of marketing cooperatives, regular markets and Rhytu bazaar, Super markets in
the supply chain system of marketing.
Therefore, the measure required to improve this efficiency should include adaption of
open auction measures to increase the number of buyers and sellers in the market,
improvements in market infrastructure as well as cold storages, Godowns (storage
facilities), loading and unloading facilities, mechanically weighing facilities, and
improved transparency through supervision and making availability of up-to date market
information through electronic media, intranet etc.

111
4. CONCLUSIONS AND POLICY IMPLICATIONS
4.1 Conclusions
The various factors affecting the marketing of vegetables and fruits in Andhra Pradesh
can thus be enumerated and analyzed with specific reference to Potato, Tomato, Baby
Corn, Roses and Grapes.
The need for market intermediaries was seen to vary with the produce. It has been noted
that while producers of potatoes, baby corn and roses prefer to rely on market
intermediaries like wholesalers and commission agents, tomatoes and grapes were
frequently sold efficiently and profitably by the producers themselves. This was probably
due to the fact that baby corn and roses were sold in niche markets that were elitist and
not accessible to the growers/producers for direct retail and in the case of potatoes the
bulk handling and storage required was probably better handled by the middlemen who
have access to transport and mass storage infrastructure. Sometimes there was more than
one intermediary, as wholesalers often buy from commission agents and then forward the
produce to the hawkers and retailers.
An interesting phenomenon of Corporate Farming was emerging with some farmers/
growers selling directly to the representatives of Corporate like Reliance.
In terms of supply chains, in the case of potato, the preferred channel was producer-
wholesaler-retailer-consumer (PWRC) and less often, producer-retailer-consumer (PRC);
very few opted for the long route of producer-middlemen-wholesaler-retailers-consumer
(PMWRC). The preferred supply chain for tomatoes on the other hand was producer-
middleman-wholesaler-retailers-consumer (PMWRC), followed by producer-wholesaler-
retailer-consumer (PWRC), producer-retailer-consumer (PRC) and Reliance. The supply
chains for baby corn were producer-middlemen-retailer-consumer (PMRC) followed by
producer-wholesaler-retailer-consumer (PWRC), and producer-retailer-consumer (PRC).
Producers of roses preferred producer-wholesaler-retailer-consumer (PWRC) supply
chain, and subsequently roses and grapes followed a similar pattern, with producer-
middleman-wholesaler-retailers-consumer (PMWRC) supply chain being the dominant
form followed by producer-retailer-consumer (PRC). Thus the middlemen continue to

112
play an important role, although producers were also trying to reduce their involvement
so as to improve profits.
Thus, most of the potato crops were marketed through PMWRC and PRC; tomatoes
through PRC, Reliance and PWRC; baby corn and roses through PRC and PWRC, and
grapes through PMWRC and PRC.
In the context of marketing costs, the farmer producer of potato was seen to incur the
highest marketing cost compared to that of other producers of the crops studied. In
addition, it was evident that the market cost incurred by the retailers was lower than that
of the wholesalers and commission agents. This was mainly due to the reason that due to
fast moving of product and its volatile price situation, the retailers prefer to sell out the
product with minimum storage time hence the marketing cost was low and marketing
margin was also found to be relatively low.
The marketing cost of the tomato producers in consumer rupee was high with farmer
producer in the order followed by village merchants, wholesalers, and retailers, indicating
that the farmers were again the major bearers of market cost in consumer rupee compared
to other players in the supply chain system.
Baby corn has a niche market and is a new product which has special preference at high
end hotels. The market cost borne by the farmer producer (8%) in the producer rupee
followed by other players in the market. The market cost borne by the farmer producer in
consumer rupee was highest among all the supply chain players.
The marketing cost of roses in consumer price was high at farmer’s level with 5.67% and
with lower for assembling traders followed by wholesalers and retailers. The striking
feature of the data suggests that the producer – farmer incurred a higher percentage of
marketing cost compared to other players in the supply chain system.
The market cost and margin of grapes suggest that the producers mainly borne the
marketing cost in greater of the consumer rupee and other players in the supply chain
system incurred in descending order starting from village level merchants to retailers.
It is thus evident that the producer has to bear the brunt of producing and marketing costs
of these crops thus reducing their profit margins considerably.

113
In terms of price spread it was evident in the marketing of all the crops that marketing
margins at wholesalers and retailers level and also the market cost was relatively high at
the intermediary level. The data supports the arguments that the intermediaries play a
crucial role in realizing better margins to all the crops compared to that of growers. Price
spread was relatively very favorable to wholesalers and retailers when compared to
producers. Particularly in the case of baby corn the farmers were very limited in number
in the pockets of isolated villages of Medak district where the middlemen dominate the
price structure. The area under grapes has declined drastically and the farmers involved in
producing this commercial crop suffer due to the lack of profitability and encouragement.
In the case of the share of different agencies during marketing of fruits and vegetables the
highest share while marketing of the crops studied was shared by retailer followed by
wholesalers In terms of market efficiency, it was clear that in the supply chain model of
producer-retailer-consumer (PRC) efficiency was 90% followed by the producer-
wholesaler-retailer-consumer (PWRC) and in the producer-middleman-wholesaler-
consumer (PMWC) it was 75%. The information indicates that the more intermediaries
there were in the supply chain systems, the lower is the market efficiency. For example,
in the case of tomato , the participation of corporate body (Reliance) between producer
and consumer in the intermediary marketing system has indicated high efficiency up
to 100%. The marketing efficiency of baby corn was very poor due to the fact that it is a
new crop and farmers lack market awareness about it. Roses, due to their perishable
nature also show a low market efficiency of 50% as the farmers were compelled to sell
the produce at the price offered by the middleman and commission agent.
In the case of grapes, however, due to the fact that this was a very popular fruit,
marketing efficiency was very high in all the supply chain systems.
In terms of constraints perceived by various stakeholders, the chief constraints for
farmers were malpractices in auction and faulty weighing; wholesalers cited inadequate
storage facilities and retailers referred to exploitative middlemen and inadequate
marketing facilities. Other complaints by farmers included high market fees,
Thus it can be concluded that the marketing cost, marketing margin, transport cost, labor
wages and the length of the market channel has negative influence on the marketing

114
efficiency. The data has also indicated that open market price has positive influence on
the market efficiency.
4.2 Policy Implications
The creation of sound infrastructure of research on horticultural crops has helped to
increase production. The increased role of research in the recent years also helped to
maintain a sustainable horticulture. However, innovation in institutional support is
required. For example, production under the contract system of farming ensures a
confirmed income to growers along with no or less risk in product marketing. Further,
there may be chance of exporting the produce to other countries and as a result a share of
such profits can be given to the grower.
The identification of Agri -export zones would help in addressing problems of marketing
of produce in the wake of changing global policy environment.
Development of certain critical management inputs particularly that of supply chain
management collaborating with other stake holders along with efficient vertical and
horizontal integration is very much needed. Therefore it is to be prioritized with regard to
horticultural products.
Therefore, further development research on issues like genetic engineering,
biotechnology, integrated and stainable production systems, Post-harvest handling
storage, marketing and consumer education is also as a important as a policy. These
technological and associate institutional changes identified as above naturally become
thrust areas for future development of horticultural sector. Further, it improves the chance
of exporting quality horticulture products. All these efforts in due course of time not
only helps in the overall growth of economy , but also creates employment opportunities
and helps in the upliftment of small and marginal farmers.
Thus the government should create a positive environment that will ensure a mutually
beneficial relationship between farmers and organized sector. Along with investment in
infrastructure, development of extension activities and linkages with farmers is also an
important area where government can play an influential role.

115
The horticulture products are considered as high value products by virtue of their
freshness, export earnings and multinational importance. Therefore both to increase the
income of poor rural and urban families, as well as contribute to improving their
livelihoods (including nutrition and health), it is essential to address the need to promote
value added products is horticultural crops. It must include.
i. Strategic positioning and priority setting in research and development on high
value horticultural crops.
ii. Research in markets, institutions and policies required for value added products in
the context of complex and dynamic relationship between the components.
iii. Post-harvest management and small scale processing units in rural areas.
iv. Market-chain development, involving various forms and levels of linkages (rural-
urban linkage, Private - Public sector linkage and formal - informal markets
linkage.)
v. Identification of policy measures and other mechanism to facilitate increased
income generation from fruits, vegetables and flowers.
vi. Key elements of cropping systems information, processes and tools that provides
insights on business models that reduces poverty.
vii. Identification of nutrition and health opportunities of selected high value crops
and how to exploit those opportunities most effectively.

116
Annexure
Table 1: Latest scenario of Selected Crops
S.No
(1)
Name of the
Crop
(2)
2007-08
Area (Ha.)
(3)
Proposed
Area to be
Covered
during 2008-
09
(4)
Estimate
for 2008-
09 (Ha.)
(5)
Productivity
Mt/Ha.
(6)
Estimated
Production
Metric tons
2008-09
(7)
1 Potato 6637 0 6637 20 132740
2 Tomato 74108 0 74108 19 1408052
3 Baby Corn - - - - -
4 Rose 849 40 889 3. 2667
5 Grape 2764 200 2964 21 62244
Table 2: Highest Districts Area, Production & Productivity of Potato Crop (2008-
09)
S.no District Area (Ha) Production(Mt)
Productivity
Mt/ha)
1 Medak 4402 88040 20.09
2 Chittor 1500 30020 20.01
3 Visakhapatnam 210 4940 23.52

117
Table 3: Highest Districts Area, Production & Productivity of Tomato Crop (2008-
09)
S.No District Area (Ha) Production(Mts)
Productivity
(mt/ha)
1 Adilabad 10860 206378 19.035
2 Kurnool 9500 180785 19.03
3 Medak 5940 112765 18.98
4 Mehboob Nagar 4855 92264 19.39
5 Rangareddy 4562 86982 19.66
Table 4: Highest Districts Area, Production & Productivity of Rose Crop.(2008-09)
S.No District Area (Ha) Production
(Mt/ha)
Productivity
(Mt/ha)
1 East Godavari 179 519 2.89
2 Ranga Reddy 132 423 3.20
3 Vijayanagaram 83 240 2.89

118
Table 5: Highest Districts Area, Production & Productivity of Grape Crop (2008-
09)
S.No District Area (Ha) Production(Mt)
Productivity
(Mt/ha)
1 RangaReddy 2100 44205 21.05
2 Medak 400 6426 16.06
3 Mehboob Nagar 160 3045 19.03

119
6) Reference
Annual reports of Horticultural mission of Andhrapradesh from 2005 to 2008
Seasonal and crop reports – (2007-08) Published by Directorate of Economics
and statistics
Annual reports of Horticultural university (2007-08)
India stat.com
Garratt (1969) Statistics in psychology education .
Aphorticulte.com
Annual report of Maize research center for the year 2007-08 Prepared by Maize
Research station.
Annual report of Kothapet Fruit Market for the year 2008-09.

120
Estimating Marketing Efficiency
Of
selected horticultural commodities along different
supply chains.
Final Report
Chapter: KARNATAKA
Dr. Sudha Mysore
Principal Scientist (Agril Econ)
Section of Economics & Statistics
Indian Institute of Horticultural Research
Hessaraghatta
Bangalore 560089

121
Section 1.
(i) Synthesis on status of marketing of horticultural crops in India.
Horticulture, comprising a number of fruits, vegetables, flowers, spices, medicinal and
aromatic crops has emerged as a key sector in the Indian economy in the last few years,
contributing to over 28 percent to the agricultural GDP. Though, its relative contribution
has been declining over the years, this sector has been identified as a potential export
earner over the years. The increasing budgetary allocation by the Government of India to
this sector from a mere Rs. 38 crores during the IV plan period (1975-80) to over Rs 4
500 crores in the X plan highlights the growing significance of this sector.
The sector’s performance in terms of increased production and productivity, expanding
export earnings are suggestive of growth, while other micro level indicators such as the
unit value realization of different commodities in export earnings, proportionate share of
producer in consumers’ rupee for highly perishable commodities do not indicate
changing trend. This is especially so with regard to the linking of producers to markets,
with the persisting domination of market intermediaries like the pre harvest contractors
and commission agents in the trade of perishables like horticultural crops. In contrast, the
changing institutional and infrastructural support through the public and or private
investment into R&D and marketing have shown success in some pockets. In the
anticipation of huge inflow of FDI into agricultural wholesale/retail marketing in the near
future and its associated objective of linking farmers to markets, it is of significance to
review different models and partnerships that have been in operation involving
horticultural crops. Hence this study attempts to compare three models, one each for
fruits, vegetables and flowers, with an objective to evaluate the partnership patterns,
success factors, lessons learnt and arrives at future perspectives.
i) Status of Marketing of horticultural crops
Horticultural crops being highly seasonal, perishable are also capital and labour intensive
and need care in handling and transportation. Their bulkiness makes the handling and
transportation a difficult task, leading to huge post harvest a loss which is estimated at

122
around Rs. 23,000 crore or nearly 35 percent of the total annual production (CII,
Mckinsey, 1997). Their seasonal production pattern results in frequent market gluts and
associated price risk, thereby forcing the farmers into distress sale to pre harvest
contractors and commission agents. A typical marketing channel of horticultural crop
thus involves a number of intermediaries like the pre harvest contractor, commission
agent, wholesaler, retailer operating between the producer and the final consumer. Each
of these market intermediaries performs a specific market function of assembling or
distribution that involves a cost to then, there by claiming a share in the market margin.
Though, it is said that an efficient market provides for the distribution of market margins
in proportion to the task performed by each market intermediary it is seldom so. The
price spread along the marketing channel is directly proportional to the number of market
intermediaries involved along the channel (Gupta and Rathode, 1998).
In a market function, the physical movement of the produce is along the chain, while the
monetary and information flow is in the reverse direction. It is the access to information
that empowers a market intermediary to bargain or take away a larger share in the
marketing margin (Crawford, 1997).
Most of the fruits being bulky and highly seasonal are sold through the Pre-Harvest
Contractor (PHC) at the field much before they come to harvest. Very often, the PHC
takes most of the production risks due to pests and diseases and also the cost of
maintenance, while he makes his margin through bulking (Sudha and Froukje, 2006).
Vegetables, barring cabbage and cauliflower, are mainly sold through the commission
agents at the market, who intern transports the produce to the distant markets and makes
his margin, traditional flowers are self marketed at the wholesale auction centres
(Subrahmanyam, 1989).
Absence of efforts at percolating market information has been a major constraining factor
in the efficient functioning of the market. In a typical market operation, each one of the
market intermediary contributes by way of either a transfer function or an assembly
function. In this process, each one tries to optimize their risk and maximize their margin.
The distribution of market margin depends purely on the access to information and the
strategy that is being adopted in forwarding the trade. The primary focus therefore is to

123
increase the accessibility to information by all the market intermediaries so as to enable a
level playing ground for them. Such an increased access to market information is
expected to bring about the market regulation automatically there by reducing the
monopoly power of any single market intermediary. Therefore, the main effort so far in
the market regulation activity has been to create marketing infrastructure, such that it
enhances the access to market information, besides the enactment of market regulation
acts and market interventions whenever required.
ii) Market regulation, status and constraints
Though agricultural marketing is inclusive of horticultural commodities, they differ from
the agricultural commodities by way of being highly perishable, seasonal and bulky. This
group of commodities was recognized as the major contributors of farm income much
later than the other crop groups. Hence, they have been included into the standard
marketing system much later than their counter parts. Development of horticulture
marketing attracted attention of policy makers during the 3rd
Five Year Plan.
Most agricultural commodity markets generally operate under the normal forces of
demand and supply. However, with a view to protecting farmers’ interest and to
encourage them to increase production, the Government also fixes minimum
support/statutory prices for some crops and makes arrangements for their purchase on
state account whenever their price falls below the support level. The role of Government
normally is limited to protecting the interests of producers and consumers, only in respect
of wage goods, mass consumption goods and essential goods. The role of Government is
promoting organized marketing of agricultural commodities in the country through a
network of regulated markets. To achieve an efficient system of buying and selling of
agricultural commodities, most of the state Governments and Union Territories have
enacted legislations (APMC Act) to provide for regulation of agricultural produce
markets. The basic objective of setting up of network of physical markets has been to
ensure reasonable gain to the farmers by creating environment in markets for fair play of
supply and demand forces, regulate market practices and attain transparency in
transactions.

124
While by the end of 1950, there were 286 regulated markets in the country, today the
number stands at 7521 (31.3.2005). The Central Government advised all the State
Governments to enact Marketing Legislation to promote competitive and transparent
transactional methods to protect the interests of the farmers. Barring a few, most of the
States and Union Territories embarked upon a massive programmer of regulation of
markets after enacting the legislation. Most of these regulated markets are wholesale
markets. There are in all 7293 wholesale markets in the country. Besides, the country has
27294 rural periodical markets, about 15% of which function under the ambit of
regulation. The advent of regulated markets has helped in mitigating the market
handicaps of producers/sellers at the wholesale assembling level. But, the rural periodic
markets in general, and the tribal markets in particular, remained out of its developmental
ambit.
The purpose of regulation of agricultural markets was to protect farmers from the
exploitation of intermediaries and traders and also to ensure better prices and timely
payment for his produce. Over a period of time these markets have, however, acquired
the status of restrictive and monopolistic markets, providing no help in direct and free
marketing, organized retailing, and smooth raw material supplies to agro – processing,
competitive trading, information exchange and adoption of innovative marketing systems
and technologies. Farmer cannot sell his produce directly in bulk except on retail basis to
the consumers. Farmers have to bring their produce to the Market yard. Exporters,
processors and retail chain operators can not get desired quality and quantity of produce
for their business due to restrictions on direct marketing. The processor can not buy the
produce at the processing plant or at the warehouse. The produce is required to be
transported from the farm to the market yard and then only it can be purchased and taken
to the plant. There is thus an enormous increase in the cost of marketing and the farmer
end up getting a low price for his produce.
Under the APMC Act, only State Governments are permitted to set up markets.
Monopolistic practices and modalities of the State-controlled markets have prevented
private investment in the sector. The licensing of traders in the regulated markets has led
to the monopoly of the licensed traders acting as a major entry barrier for a new

125
entrepreneur. The traders, commission agents and other functionaries organize
themselves into associations, which generally do not allow easy entry of new persons,
stifling the very spirit of competitive functioning.
Agriculture sector needs well functioning markets to drive growth, employment and
economic prosperity in rural areas of the country. In order to provide dynamism and
efficiency into the marketing system, large investments are required for the development
of post harvest and cold chain infrastructure nearer to the farmers’ field. Projection of
production and marketable surplus of various farm products was recently assessed by an
Task Force set up by the Ministry of Agriculture which estimated that an investment of
Rs.12,230 crore in next 10th
Plan would be necessary for infrastructure development for
agricultural marketing. A major portion of this investment is expected from the private
sector, for which an appropriate regulatory and policy environment is necessary.
Alongside, enabling policies need to be put in place to encourage procurement of
agricultural commodities directly from farmers’ field and to establish effective linkage
between the farm production and the retail chain and food processing industries. Towards
this end, the Inter-Ministerial Task Force on Agricultural Marketing Reforms constituted
by this Ministry in its report of 28.06.2002 has made the following important
recommendations:
i. Promotion of competitive agricultural markets in private and cooperative sectors,
direct marketing and contract farming programmes by amending the State Agricultural
Produce Marketing Regulation Acts and to provide central assistance for the development
of marketing infrastructure subject to such deregulation and reforms;
ii. Progressive dismantling of controls and regulations under the Essential
Commodities Act to remove all restrictions on production, supply, storage and movement
of, and trade and commerce in respect of all agricultural commodities;
iii. Substantial step up in flow of institutional credit to farmers for marketing of crops
(pledge financing) to enhance their holding capacity to obtain remunerative price for their
produce;
iv. Expand availability of warehousing services in rural areas by introducing negotiable
warehousing receipt system for agricultural commodities; and

126
v. Allow futures trading in all agricultural commodities to improve price risk
management and facilitate price discovery by amending the Forward Contracts
(Regulation) Act, 1952;
The recommendations contained in these Reports were discussed with the State
Governments at a National Conference on 27th
September, 2002 and later by a Standing
committee of State Ministers on 29th
January, 2003. It was opined, that in view of the
liberalization of trade and emergence of global markets, it was necessary to promote
development of a competitive marketing infrastructure in the country and to bring about
professionalism in the management of existing market yards and market fee structure.
While promoting the alternative marketing structure, however, Government needs to put
in place adequate safeguards to avoid any exploitation of farmers by the private trade and
industries. For this, there was a need to formulate model legislation on agricultural
marketing.
The Ministry of Agriculture accordingly formulated a model law on agricultural
marketing in consultation with the States Governments. The draft model legislation
provides for establishment of Private Markets/Yards, Direct Purchase Centres,
Consumer/Farmers Markets for direct sale and promotion of Public Private Partnership in
the management and development of agricultural markets in the country. It also provides
for separate constitution for Special Markets for Commodities like Onions, Fruits,
vegetables, Flowers etc. A separate Chapter has been included in the legislation to
regulate and promote contract-farming arrangements in the country. It provides for
prohibition of commission agency in any transaction of agricultural commodities with the
producers. It redefines the role of present Agricultural Produce Market Committee to
promote alternative marketing system, contract farming, and direct marketing and
farmers/consumers markets. It also redefines the role of State Agricultural Marketing
Boards to promote standardization, grading, quality certification, market led extension
and training of farmers and market functionaries in marketing related areas. Provision
has also been made in the Act for constitution of State Agricultural Produce Marketing
Standards Bureau for promotion of Grading, Standardization and Quality Certification of
agricultural produce. This would facilitate pledge financing, E-trading, direct purchasing,

127
export, forward/future trading and introduction of negotiable warehousing receipt system
in respect of agricultural commodities.
iii) Contract Farming
Contract farming has been prevalent in various parts of the country for commercial crops
like sugarcane, cotton, tea, coffee, etc. The concept has, however, gained importance in
recent times in the wake of economic liberalization. The main feature of contract farming
is that farmers grow selected crops under a buy back agreement with an agency engaged
in trading or processing.
There are many success stories on contract farming such as potato, tomato, groundnut
and chilli in Punjab, Safflower in Madhya Pradesh, oil palm in Andhra Pradesh, and seed
production contracts for hybrids seed companies in Karnataka, cotton in Tamil Nadu and
Maharashtra etc. which helped the growers in realization of better returns for their
produce.
Model law on marketing has been formulated keeping these requirements in view. This
law inter-alia provides for an institutional arrangement for registration of sponsoring
companies, recording of Contract Farming Agreement, indemnity to farmers’ land and
lays down a time bound dispute resolution mechanism. The Model law has been
discussed with the State Governments and the representatives of Trade and Industries at
the National Conference of State Agriculture Ministers on 7th
January, 2004 and again on
19th
November, 2004 and a consensus has been arrived at to give a major thrust to this
programme. Several State Governments have already initiated legal amendments to
APMC Act. Haryana and Gujarat are among the first States to take steps in establishing
an institutional set up for supporting contract farming in these States.
With a view to induce large investment in the development of marketing infrastructure as
envisaged above, the Ministry has formulated a scheme for “Development/Strengthening
of Agricultural Marketing Infrastructure, Grading and Standardization”. Under this
scheme investment subsidy is provided on the capital cost of general or commodity
specific infrastructure for marketing of agricultural commodities and for strengthening

128
and modernization of existing agricultural markets, wholesale, rural and periodic or in
tribal areas. The scheme is reform linked, to be implemented in those States/UTs that
amend the APMC Act wherever required to allow setting up of agricultural markets in
private and cooperative sectors. The States of Madhya Pradesh, Tamil Nadu, Kerala,
Manipur, Himachal Pradesh, Andhra Pradesh, Punjab, Sikkim, Nagaland and Andaman
& Nicobar Islands (U.T.) have notified for implementation of the Central Sector Scheme,
being the reforming States. Under the scheme, back ended subsidy @ 25% of capital cost
of the project is provided in all States and @ 33.3% of capital cost in case of NE States,
hilly areas and SC/ST entrepreneurs. In respect of infrastructure projects of State
Agencies, there is no upper ceiling on subsidy to be provided under the scheme. There is
central allocation of Rs. 190.00 crore under the scheme 10th
Plan. An amount of Rs. 25
crore has been released under the scheme during 2004-05.
iv) Efforts at linking farmers to the markets
Linking farmers to markets and to processors has been a well recognized means of
augmenting seasonal gluts and associated price crash, especially for perishables (Charles
and Andrew, 2001; Subrahmanyam, 2000; Sudha and Gajanana, 2001). However, the
linkage between producers and processors is rather weak under Indian conditions
attributable to reasons like high cost of processing, inadequate supply of right quantity of
raw material for processing, dual taxation policies etc besides inconsistent demand for the
processed produce. Efforts have constantly been on to link farmers to the markets so that
the marketing channels and the role played by different market intermediaries are
minimized. These efforts include creation of alternate marketing channels which provide
better pricing policies and reduce the margins, contract farming for assured buy back and
hence assured price and supply chains for creating and sustaining value addition for some
commodities (Dileep, et al, 2002)
The earliest attempt of contract production in horticultural crops could be traced way
back to the early 70s, with the Indo Bulgarian production complex, involving cultivation
of tomato. The Indo-Bulgarian project which was initiated during April 1974, aimed at
linking production, processing with marketing based on the experience of the Agro-

129
Industrial complexes of Bulgaria. Two centers were identified, with one based at
Karnataka and the other based in Bihar, involving a total financial commitment of Rs.
10.97 lakhs (ICAR, 1976). The project was planned with a three phase development plan,
involving the objectives of introduction and expansion of the cultivation of some of the
popular Bulgarian varieties in India. The Karnataka State Agro-Industries Corporation
(KSAIC) was identified as the nodal point for processing tomatoes, which were to be
delivered at the factory by the growers themselves.
Initiated during the Kharif season in 1976, the scheme could not make much head way
due to the failure by the farmers to supply their produce to the processing industry.
However, during Rabi season the same year, farmers were willing to supply the produce.
Analysis of the reasons for this behavior highlighted that the market price was the main
contributing factor for the farmers’ disinterest for supplying to the processors. The
significant feature of the model was the introduction of Bulgarian varieties for
demonstration purposes, which did not get adapted to Indian conditions.
Among the others, contract cultivation of tomato under PepsiCo in Punjab (Singh, 2000;
Dileep et al, 2001), contract production of hybrid seed production of vegetables (Sudha et
al, 2006), contract production of cotton, gherkins etc., to name a few. In all these contract
cultivation models, the linkage of farmer with the market is only partial as the farmer is
not directly linked to the market. Further, the model does not include creation or
strengthening the infrastructure or the objective of empowering the farmer to operate
independently in a new market, there by making them unsustainable in the long run.
Several others are in operation, of which, three successful ones, each representing fruits,
vegetables and flowers has been considered for a discussion in this presentation.
Model 1
Export oriented production of grapes in Maharashtra: Initiated during the mid 90s,
this model depicts spatial and vertical integration along the supply chain for grapes with
the cooperative and public sector partnership between the farmers and the state
government. The three tier structure of the model constitutes farmer groups or association
at the base (village) level, district cooperative at the second and federation of

130
cooperatives at the state level. Each farmer needs to enroll as a member of the association
closer to his production base with a nominal payment (in the range of Rs. 5000/farmer).
All such associations then become a part of the district level cooperative, which in turn is
grouped under the state level federation. State government has helped set up cold storage
units at district level so as to enable all the members coming under its purview can
assemble and store their produce at a nominal fee. The federation then helps in accessing
distant domestic markets and the export markets so as to maximize returns. The model,
thus empowers the farmer a better bargaining power by creating infrastructure to come
out of the clutches of the distress sale to PHC, prolonging the marketing season, access to
alternate and distant markets to reap the advantage of better and higher price. Through
collective action farmers also have access to import better technical know-how for value
addition on farm. This model also helped farmers plan the area under grape for different
purposes, i.e., for exports, for raisin making or for distant domestic markets.
Model 2
Precision farming for vegetables in Tamil Nadu: A government initiative, this model
is in operation in the Dharmapuri district of Tami Nadu state. The model involves a
budget of over Rs. 7.2 crores, spread over a period of three years in Dharmapuri and
Krishnagiri districts of Tamil nadu state covering an area of 400 ha. Crop diversification
with vegetables is the primary focus of the project. Each one of the willing farmer needs
to cultivate at least one hectare under this scheme. The model provides for fertigation
system involving a cost of Rs. 75,000/ha along with cultivation expenses up to Rs.
40,000/ha. The beneficiary is required to incur only 10 percent of this expenditure as
equity, besides the land and labour contribution towards cultivation. The farmer is
expected to choose from a set of vegetables to be cultivated under fertigation conditions.
The technical guidance for crop production is provided by periodic visits by an expert
team. The team also advises and helps farmer market his produce by providing market
information. Tomato, cabbage, cauliflower and chili were the vegetables included under
this model. Farmers observed a 20 percent saving in cost due to the use of fertigation and
a yield increase to the tune of over 25 to 60 percent in different crops.

131
Model 3
Integrated Cut flower production: Due to frequent fluctuations in the international tea
prices, the farmers from Nilgiris, who are tea planters, have diversified into cut flower
production in the recent times. Formed as a small farmer’s consortium, the Nilgiris
Integrated Floritech Co Ltd (NIFCO) pools the flower produce and markets it under a
common brand. This initiative by small farmers and cut-flower growers is neither a mass
movement nor a co-operative, but has a unique production model envisaged as being
operative on a cluster basis. With a total project outlay of over Rs. 10 crore, the project
promotes export-oriented floriculture cluster development zones in the 12 watershed
areas of Nilgiris district. Each of these clusters would comprise a minimum of 40 units,
taking the total number to 500 units in the 12 clusters. A small farmer willing to take part
in the consortium could take 500 mts2 polyhouse on lease for three years from the
company and choose to cultivate among the 12 exotic flowers identified. The consortium
organizes to provide a tripartite agreement with the bank for the necessary financial
assistance and also provides the farmer with the centralized facilities for packing,
transport and export sales. As per the projected production plan, by 2005-06, the annual
production from the 200-odd integrated units is expected to cross 300 lakh cut-flowers.
The project implementation team envisages the integration of 500-plus units by 2007-08
and the production rising commensurately to touch a high of 825 lakh cut flowers.
v) Comparisons and contrasts between the three models
The three models presented above represent the changing pattern of commercial
horticulture under Indian conditions that envisages an effective linkage of farmers to the
market. A comparison of the three models on the objectives, partnership pattern,
organizational structure, and other aspects provide an evaluation of the functional
success.
As could be seen from the table, though the three models address different commodities
and regions, have some common features. Infrastructure creation, either at individual
farmer or regional level is the primary focus, followed closely by technical assistance. All
the three models envisage empowering the farmers through improved quality produce,

132
there by enhancing their bargaining power at the market. While the first and the third
models signify collective action as a means of better bargaining power, model 2, primary
focuses on crop diversification and cost effective production of quality produce as a
means for increased returns. While the models 2 and 3 lay emphasis on credit as one of
the critical factors increased profitability, model 1 lays emphasis on prolonging the
season of availability as a means to increasing bargaining power.
Table (i): Comparison of three models linking farmers to the market in India
Sl No Particulars Model 1 Model 2 Model 3
1 Initiated since Early 90s Early 2000 2003
2 Area covered Covers all grape
growing districts
of Maharashtra
Dharmapuri district
of TN covering 400
ha
Exclusively in the 12
Zones of Nilgiri
district of TN
3 Commodities
involved.
Single crop
model, Grape
Multiple, Vegetables,
tomato, cabbage,
chilli and cauliflower
Multiple, covering 12
cut flowers grown
under polyhouse
conditions
4 Partnership
pattern
Cooperative and
public sector
Individual and
Government
Individual, private
sector
5 Pattern and extent
of Financial
assistance
Creating public
good, No
financial
assistance
Creating individual
infrastructure and
financial assistance
Creating common
pool infrastructure,
market linked
financial assistance to
individuals.
6 Technical know-
how
Provided if
required
Provided on day-
today basis
Provided
7 Market linkages Indirect but Indirect and limited. Indirect. Undertakes

133
complete, as final
product is sold on
one brand name.
Only provides the
market information
responsibility of
exports under one
brand name
8 Benefit to the
producer (
enhanced yield
and returns
through)
Provides
bargaining power,
market access
Better quality
produce so that
farmer gets a higher
price
Provides bargaining
power, market access
9 Envisaged
success
Proven success Successful, but
sustainability yet to
be seen
Yet to realize the
benefits
10 Limiting factor Strengthening
cooperative spirit
at farmer level
Sustainable only till
the model is in
operation
Sustainability is yet to
be seen
All the three models also try to eliminate a number of market intermediaries from the
market chain and suggest self marketing as a better means for increasing profits. Model 1
lays stress on the last stage of the production process i.e., marketing, model 2 on the
production process, while model 3 seems to hold an integrated approach

134
vi) Scope and future perspective
Based on the review of literature and the examination of the three models in operation
under Indian conditions, it could be inferred that a lot of effort has been on for increasing
the access to market information by all the market intermediaries, especially in case of
perishables like horticultural crops. Efforts also have been made at linking farmers to the
markets and contract cultivation has been one of the most popular models. There have
been other efforts as well, as has been presented in the three models examined in this
paper.
As has been seen, all the three models attempted at creating infrastructure and provide
technical support for improving the performance of the producers, and at the same time
try to create a collective barging power to the producers. However, the primary objective
of creating a direct link between the farmer and the market is not totally been achieved.
However, these models do indicate an effort in the direction of organizing farmers into
self-help groups and provide the direction for a larger globally active organization.
However, the main effort at breaking the supremacy of the PHC or a commission agent in
the wholesale market has been left untouched. Since it has been seen in a number of
studies that the wholesaler/ commission agent takes away a disproportionately high
margin, effort is needed at linking farmers to the market at this level.

135
Section 2: Estimating marketing efficiency of selected horticultural crops
along different supply chains in KARNATAKA
1 INTRODUCTION
1.1 Background
Karnataka is the second most important states next to Maharashtra for the production of
horticultural crops. The agro climatic suitability provides a unique position for the state to
be a natural home for a large number of horticultural crops that can be grown all round
the year. Out of a total of 121.86 lakh ha cultivable area, nearly 17.64 lakh ha is under
horticultural crops accounting for 8 % of area contributing to over 136.66 lakh tones
(2007-08) ( 6 % of total production) (Anonymous 2008). Around 2.46 lakh ha is under
fruit crops and 2.99 lakh ha is under vegetables. Fruits contribute to 73.62 lakh tones
while vegetables 6.23 lakh tones. The state leads in country’s area and production of
brinjal, tomato, mango and cut flowers.
Being the horticultural capital, Bangalore district is the hub of activity for various
horticultural crop research and development. Estimates indicate that the state capital with
a total population of over 80 lakhs consumes nearly one third of the states horticultural
crop production. It is also a major hub for interstate transactions and movement of
horticultural crop products to distant locations within and outside the country. The
metropolis is also the home for the recent retail revolution in the country. Spensors, food
world, reliance and more, SAFAL and Namdharis retail outlet chains have set up
operations in the metros. Thus, besides production, horticultural crop marketing also is of
significance both from their highly seasonal and perishable nature as well as employment
generation perspective.
While the agricultural marketing system in the country is due for an over haul, given the
changing global trade order, that specific to horticultural crops are no exception.
However, the sheer commercial nature of these set of crops besets their marketing
systems with contradictions. On one hand, perennial and seasonal produce like mango
show persisting domination of Pre Harvest Contractors (PHC), others like grapes have

136
advanced systems of marketing that are international in operations ensuring quality
product supply chains. Individual or group effort in organizing and integrating production
with marketing has been the critical factor responsible for their success, institutional
support through favorable policy cannot be over looked.
1.2 Policy research questions
In recognition of the growing significance of integrated marketing in highly perishable
and seasonal horticultural crops, efforts have been on for a while to modernize
agricultural/ horticultural marketing through government interventions and policy
changes.
Notable among these are the constitution of various high powered marketing committees
and marketing boards that analyzed the pitfalls in the existing system and proposed
requisite changes. The primary objective of these initiatives has been to reorient the
current marketing system, upgrade basic infrastructure to enable the marketing system to
absorb the enhanced production. The main focus of these initiatives has been to reducing
the length of the marketing network such that the producer is directly in contact with the
ultimate consumer as also to ensure higher share of the consumer rupee to the producers.
Some of these efforts include,
(i) initiation of alternate marketing channels with reduced number of
market intermediaries,
(ii) efforts at enhanced price stability and consistency, i.e., contract
farming and
(iii) State interventions at market regulation and procurement as and when
situation warrants.
Most of these initiatives have been successful in reducing the number of market
intermediaries along the marketing chain and assisted in increasing the producers share in
consumers rupee to a large extant.

137
However, with the changing global trade order initiated by the WTO and world trade
reforms, the focus shifted towards assured quality of produce and efficient marketing
system that is in line with the state-of the art infrastructure with international standards
for weighment, auction and sale procedures.
This was assured by the gradual privatization of the marketing system and allowing
corporate interventions to enter into the agricultural/ horticultural marketing arena. Since
agriculture is state subject and the transformations could not be brought forth easily under
the existing legislative, reforming the legislature became a necessity. Few of the state
governments, including that of Karnataka, amended their marketing legislature to permit
the entry of corporate houses into the area of agricultural marketing. The primary focus
being reduced length of marketing channels; quality based pricing and fair deal for all.
Several models of corporate led marketing initiatives came forth, at different levels of
marketing system, be it at the level of wholesaling or at retailing. The establishment of
SAFAL by the National Dairy Development Board was one such initiative, which set up
a state-of the art infrastructure costing over Rs.1600 crores at about 30 kms from
Bangalore during the mid 90s. Among the other such initiatives are the reliance fresh,
subhiksha, more and farm fresh etc,
Many of these initiatives have set up their own retail marketing chains besides the
wholesale procurement centre, there by starting up a ‘whole new supply chain’ especially
for handling fresh fruits and vegetables.
Among such supply chain initiatives are others as well, initiated by private seed
companies, but with a different objective. Important among them is the initiative by the
Ms. Namdhari seed company operating around Bangalore with an objective of helping
farmers get better price through a form of contract production of selected vegetables.
Important features of all these initiatives are, (i) a backward linkage of contact farming or
agreement with the farmers that ensures continuous supply; (ii) a forward linkage or
supply chain that ensures quick and easy disposal of the produce and assured quality and
(iii) quality based pricing.
Since most of these marketing practices and systems are in their initial stage of
establishment, it is of interest to assess the feasibility and suitability of a few such models
and compare them with the traditional ones.

138
2.3 Objectives of the Study
How successful have these initiatives been in achieving their objectives of backward
linkage, quality supply of produce for satisfying the consumer needs along with improved
marketing efficiency is the basic question that is being assessed?
Keeping this in view, this study is beset with the objectives of
(i) assessing different models of modern marketing of horticultural
crops involving the corporate organizations and
(ii) Compare them with the traditional or other models and evaluate
the same based on marketing efficiency and other parameters.
139
2. Data and Methodology
2.1 Study area
Bangalore urban and rural districts, which form the most important horticultural belt of
Karnataka state, have purposively been selected as the study area. The objective of the
study being an assessment of marketing efficiency along different marketing channels,
various marketing arrangements that exist for horticultural crops formed the basis for the
selection.
Besides the traditional marketing network involving PHC, commission agents and
retailers, several alternate channels have sprung into action in metropolis like Bangalore.
These include,
A state initiated producers’ cooperative society, HOPCOMS
Karnataka Horticultural Marketing Society
SAFAL ; Reliance Fresh ;Namdhari Fresh ;More, to name a few.
In order to arrive at a comparison of different marketing arrangements for horticultural
crops, this study attempted to compare the marketing operations and performance of the
traditional marketing channel, Co-operative marketing system and the two most
important corporate horticultural marketing networks, viz., SAFAL and Namdhari fresh.
2.2 Data on items
The marketing system of the corporations formed the starting point for this study.
Therefore, the crops that figured in relative abundance in corporate marketing system
were selected for this study.
Data on month wise procurement of different fruits and vegetables by SAFAL, Bangalore
was taken as the primary focus for crop selection. Banana (Robusta) and tomato formed
the ones that are dealt with throughout the year hence were selected as the crops for this
study. The data on costs of marketing, price realized and proportion of produce sold
through different marketing channels was obtained from the sample farmers for different
crops. Similar information on the trade aspects and the cost and sale price, wastage and

140
other information were obtained from traders and other market intermediaries. Effort was
made to obtain time series data on price and arrival of the selected commodities into
different marketing networks for arriving at appropriate price for estimating the costs,
margins and efficiency.
2.3 Sample size
Data on marketing of banana and tomato were collected from different stakeholders
along the marketing chain. These included the producers, the wholesalers, retailers, co-
operative societies, corporate houses and consumers as the total sample for this study.
Total sample size worked out to 130 and above for each crop and the split up of sample
for different stakeholders is presented crop wise.
2.4 Sampling methods
Two corporate houses dealing in fruit and vegetable sales have been selected purposively
for this study. Producers who supplied to the corporate houses were randomly selected
from the list of villages provided by the corporate houses. Effort was made to select an
equal number of producers who were not suppliers to the corporate house from the same
villages for comparison. A total of around 30 wholesalers and other market
intermediaries were selected from different markets for the selected fruit and vegetables.

141
Table 1: The total sample for the crops selected
Sl No Stakeholder Crop & Region
Banana Tomato
Robusta No. Yelaki No Tomato No
1 Producers Kolar 25 Ramnagar 45 Kolar 20
Chickballapur 20 Chickballapur 45 Srinivaspura 15
Dodballapur 20 Chickballapur 25
Theni 25 Bidadi 30
Sub-total 90 90 90
2 Wholesalers
&
Commission
agents
Bangalore
(SAFAL),
Market
7 HOPCOMS
co-operative
society,
Bangalore
1 Kolar 10
8
Binny market 5 HOPCOMS 1 Bidadi 5
Ramnagar
Theni 5 Theni 10
Sub-total 25 2 25
3 Retailers Bangalore
market
10 Bangalore
market
8 Kolar 7
SAFAL
outlets
6 Ramnagar 6 Bangalore 8
Binny market 8 Binny market 5 SAFAL outlets 6
Theni 6 HOPCOMS
outlets
4 Namdhari
Outlets
9
Sub-total 30 23 30
4 Consumers Bangalore 10 Ramnagar 10 Kolar 10
Theni 10 Bangalore 10 Bangalore 10
Sub-total 20 20 20
Crop total 165 135 165
Grand Total 465

142
2.5 Statistical techniques
The study uses simple statistical tools such as tabular analysis, percentages for estimating
the marketing costs and margins of different market intermediaries along different
marketing channels.
The study utilizes Acharya’s method of estimating the marketing efficiency as given below.
Acharya’s Modified Marketing Efficiency
MME = FP/(MC+MM)
Where, MME is modified measure of marketing efficiency
FP is price received by farmers
MC is marketing cost
MM is marketing margin
Constraints perceived by the farmers / wholesalers / retailers
Garrett method of ranking has been adopted for arriving at the important constraining
factors in marketing of the horticultural crops.
Garrett’s Ranking Technique
100 (Rij - 0.50)
Percent position = ---------------------
Nij
Where, Rij is the rank given by ith item by jth individual
Nj is the number of items ranked by the jth individual

143
3. Results and Discussion
3.1 Status of the fruits and vegetables production
The horticultural crops gained around 101 lakh thousand hectares in the last one decade
and half. Nearly 67 percent of this increase comes from fruits and vegetables (Sudha,
2009). Tomato among vegetables and banana among fruits has shown significant growth in
area and production during the period from 1992 to 2007-08. One of the important reasons
for this increased focus towards horticultural crops is their definite profitability over other
crop groups.
Increasing income and standard of living, greater awareness towards nutritional security
also contribute towards the increasing consumption of horticultural crops. Availability of
high yielding varieties and other technical support also has led to the growing acreage
under this group of crops.
With the increased area and production of horticultural crops, the marketable surplus also
increases. If there is no sufficient demand or appropriate marketing facility to absorb this
increased production, or the failure of markets to transmit price would result in frequent
market gluts and associated price crash. Tomato is one such vegetable that exhibits such
high variability in prices across the regions and markets.
3.2 Marketing of Fruits & vegetables: Innovative models
Marketing of fruits and vegetables attracts special attention given their highly seasonal and
perishable nature. Being bulky, harvesting and transporting them to the market is a very
cumbersome process requiring special skills. Traditionally, traders or few larger scale
growers themselves undertook this task by assessing the value of the harvest and making an
agreement with the farmer for a pre fixed amount.
Marketing activity of fruits and vegetables was dominated by few traders with inadequate
infrastructure as well as institutional and legislative support for regulated trade in these
commodities. Absence of marketing infrastructure ensuring proper weighing and fair trade,
trade in few hands led to the domination of pre harvest contractors. High post harvest
losses to the tune of 35%, high price spread, lower share of producers in the consumers

144
rupee, frequent market gluts and associated price crash leading to distress sale were the
most common features of horticultural crop marketing. Several innovative models with
backward and forward linkages emerged in the recent past to help augment horticultural
crop marketing.
3.3 Innovative models
This study attempts to evaluate the marketing practices and methods adopted under two
distinct models involving corporate houses in fruits and vegetables. This section provides a
description of the models adopted by these corporate houses.
3.3.1 SAFAL
The Safal Fruit and Vegetable Auction Market (SFVAM) were established near Bangalore
in July 2004. The Department of Agriculture and Cooperation, Government of India,
requested NDDB to suggest a system to modernize the procurement and marketing of the
horticultural produce. NDDB has taken up a project in Bangalore as an alternate set up that
will operate to the parallel system of marketing like Agriculture Produce Marketing
Committee. An investment of Rs.1500 crores was made in to this project with the support
of GOI.
A trading capacity of 1600 tons per day; transact about 300 tons; commercial cold storage
facility with capacity of 10000 metric tons. Fruit ripening chambers – banana, 100 -
Spacious and well designed shops available for the buyers for their use. Trained
professionals in different areas of Backward and forward linkages are the specific features
of this modern marketing network.
The operation model:
SAFAL encouraged farmers to form associations (FA) across different production regions
such that they would ensure regular supply to SAFAL and get higher share in consumers
rupee. The FA supports the farmers in backward and forward linkages with the support of
Safal Market. 200 such associations have been initiated by SAFAL with appropriate field
staff to over see the operations. On an average each of the Farmers Association transacts
business of Rs.50-60 lakhs annually.

145
The farmers give their indent of supply to the FA indicating how much they will supply on
the day. The SAFAL also send an indent to FA of its requirements based on the need of the
buyers. The farmers themselves are encouraged to grade their produce and bring in to the
FA. The produces are labeled as A or B/ market quality grade The Transport facilities are
arranged to transport the produces from FA or from the farm itself, depend upon the
quantity.
This market uses the Dutch auction system (with an auction clock on which prices are
reduced) for fruit and vegetables and the English system (with the auction clock counting
upwards) is used for onion, potato and garlic. With two auctions per day, the reference
price for the morning auction is the wholesale price of the day before, while the afternoon
auction uses the morning wholesale price of that day. The produce is procured from 200
farmer associations through local collection centres. The produce is transported to the
auction hall, graded, shown in lots and sold the day after the farmers deliver it to the
collection centre. Farmers receive payment based on a weighted average of the auction
price the next day. Any produce that is not sold through the auction is sold in small outlets
at the Safal premises.
Three types marketing systems:
1. Electronic Auction Hall: The selling and buying take place at the press of a button. The
retail and whole sale buyers participate in the auction and bid through the electronic button
system.
2. Safal Daily Fresh outlets: There are 7 outlets in Bangalore city for the consumers to buy
them directly from the shop.
3. Outstation Sale
Using a specially designed questionnaire the daily procurement of different fruits and
vegetables at the SAFAL market has been collected and are analysed. Based on the
volumes procured, seasonality and regularity of procurement, two crops namely banana
and tomato have been identified for further analysis.

146
Since the organisation procures only through registered safal farmers associations (SFA),
a list of all farmer associations was obtained and five for each crop viz., banana and
tomato were identified for colleting producer level data. Each association includes 200
farmers as members. Kolar, Chickballapur, Dodballapur from Karnataka and then from
Tamil Nadu were identified for banana sample growers, while Kolar and chickballapur
for tomato. A sample of 25 farmers supplying to SAFAL were selected for each crop, an
equal number of farmers not supplying to SAFAL were selected from the same village
for comparison. As per the model of linkage suggested, wholesalers or registered safal
buyers who took part in SAFAL auction were selected. Out of the seven SAFAL retail
outlets that operated in Bangalore, 6 were selected for obtaining retailer level data,
besides the regular market based retailers.
Average Seasonal Daily Procurement details of
Fruits and vegetables by SAFAL
0
10000
20000
30000
40000
50000
60000
70000
80000
90000
Tomato Onion MangoBananaPotato
Qu
an
tity
(K
g)
0
100000
200000
300000
400000
500000
600000
700000
800000
900000
Valu
e (
Rs)
Quantity (t) Value (Rs)

147
The procurement and sale model adopted by SAFAL is as follows
3.3.2 Namdhari Fresh:
Ms Namdhari seeds private limited is one of the popular seed companies that has been in
operation since mid 90s. The company along with its research and development wing and
experimental farm is located in Bidadi village close to Ramnagar near Bangalore.
Company is into vegetable seeds business for long, started contract cultivation in 2001.
Totally there are 1000 farmers involved in contract production for the company which
includes the 58 farmers for tomato. Company’s procurement target is 10ton as per
production schedule. They give preference to small farmers. They provide direct
seedlings to farmers for 1(or) 2 acre at free of cost. Actual cost for seeds I s Rs3000/acre
but they charge only Rs 500/acre. They also provide inputs like fertilizers and chemicals
and deduct the amount at the end of the procurement. Though the company officials said
they pin their procurement price to SAFAL/ Kolar wholesale market, for tomato and offer
Rs 1 less than the market price from the farmers. However, the farmers expressed that the
get Rs 5/kg of tomato or corn irrespective of the season at the farm gate. Entire produce is
graded as A, B & C grade based on size, appearance, firmness colour, tenderness,
damage etc. They prefer only A grade Tomato. Yield per acre: 10-25t/acre, total cost of
cultivation is around Rs 20000-25000/acre. The produce procured is transported to the
company’s warehouse, where it is cleaned and packed and transported to the 19 retail
outlets (Namdhari fresh) located around Bangalore. They use more quantity of tomato for
domestic purpose only. The retail outlets do not store produce for more than two days
SAFAL market Farmers field
Retail outlet
Consumers
Auction sale
Retailers
SFA
SRB

148
and the unsold is returned back to the company for use elsewhere in the preparation of
value added products. Thus the Namdhari fresh tries to minimize the wastage and losses
at the retail level. While other products like corn and maize are procured to meet the
international demand, tomato is taken up especially to help small scale farmers located in
and around the factory premises.
Namdhari Fresh Marketing Network
3.3.3 Other traditional / non traditional marketing networks:
HOPCOMS: Horticultural Producers Cooperative Marketing Society (HOPCOMS) is a
cooperative society set up in Karnataka to provide the producers an alternative marketing channel
to safe guard against powerful market intermediaries such as the PHC and commission agents.
HOPCOMS, set up in the 1970s has 230 outlets in the state of Karnataka and employs around
1800 people. Fruits and vegetables are only procured from the approximately 16,000 members of
the cooperative. Facilities are provided for farmers to stay overnight and have their produce
graded and sold early the next day. The daily price of HOPCOMS is established based on the
daily retail market price, the farmer receives a 75% share of the final HOPCOMS retail price, but
has slightly higher costs than those trading in the traditional markets as the cooperative members
have higher transport costs and pay a (small) membership fee. One of the major constraints of this
marketing system is a lack of appropriate infrastructure to handle large quantities. A total of
around 805 tonnes is traded annually, which is a marginal proportion of the total quantity that is
Pack House
(Cleaning, sorting,
grading, packing etc) Farmers field
Retail outlet
Consumers

149
traded at the wholesale market. HOPCOMS will thus only be able to provide an alternative to a
relatively small proportion of farmers.
HOPCOMs also have initiated cooperative societies in the neighbouring districts within
the state to help producers benefit from the sale through cooperatives. Such a facility also
is expected to promote regional specialisation. One of the beneficiaries of this
programme is banana (Yelaki) which has a production base in Ramnagar, Mandya and
Mysore region of the state. Farmers bring their produce to the society and get a fair price
based on quality. The produce is then transported to HOPCOMs main centre at Bangalore
and is sold through its retail network.
3.4 Marketing channels
The movement of produce through different market intermediaries before it reaches the
ultimate consumer is referred to as a marketing channel. The traditional marketing
channels include the Pre harvest Contractor (PHC), the wholesaler/ commission agent,
the retailers and other petty shop owners or pushcart vendors. The non-traditional or
modern marketing channels include the contracting agencies of the corporate houses and
their assembly centres, packhouses with sophisticated infrastructure for cleaning and
packing the produce. Besides these, the modern marketing channels have retail marketing
outlets of the corporate houses that directly sell the produce to the consumers. In view of
the better ambience and clean surroundings, these retail outlets are able to provide greater
consumer satisfaction and hence charge higher price or transfer greater proportion of
transaction cost to the consumers. However, in view of the better quality, the consumer is
willing to pay higher price to the commodities from these outlets. In order to provide a
comparison of alternate marketing networks, this study has identified the following
marketing channels for the crops selected.

150
Table 2: Marketing Channels identified for different crops
Sl No Marketing channel Proportion of
produce disposed
Banana ( Robusta)
1 P - Field sale ( PHC or CA)– Retailer - Consumer 40%
2 P – Wholesaler – Retailer – Pushcart vendor - Consumer 35%
3 P (SFA) – SAFAL – SAFAL Buyer – Retailer -
Consumer
10%
4 P (SFA)- SAFAL – SAFAL Retail Outlet - Consumer
5 P - HOPCOMs - HOPCOMs Retail outlet - Consumer 10%
Sl No Marketing channel Proportion of
produce disposed
Banana ( Yelaki)
1 P – Wholesaler – Retailer – Pushcart vendor - Consumer 35%
2 P - HOPCOMs Society Ramnagar - HOPCOMs Retail
outlet (Bangalore) - Consumer
60%
Sl No Marketing channel Proportion of
produce disposed
Tomato
1 P – Wholesaler/ CA ( Kolar) – Retailer – Consumer 35%
2 P – Chennai WS market – Retailer- Consumer 25%
3 P (SFA) - SAFAL – SAFAL buyer - Retailer -
Consumer
15%
4 P (SFA)- SAFAL – SAFAL Retail Outlet - Consumer
5 P - HOPCOMs - HOPCOMs Retail outlet - Consumer 5%
6 P – Namdhari fresh contract – Namdhari Retail outlet -
Consumer
5%

151
3.5 Supply chains
Almost all the marketing channels described above present a supply chain that ensures the
smooth flow of produce from the source of origin to its ultimate destination. In a typical
supply chain, the movement of produce is from the producer to the consumer, while the
market information and monetary benefits move in the opposite direction. Since both are
not integrated and the one who holds access to market information is stronger than the
other, there is an unequal power play leading to in equal distribution of benefits across
different stakeholders along the supply chain. The effort is to equalize the power play such
that each one of the marketing network stakeholder gets benefit proportional to the role
played by him in the process of marketing.
In a modern supply chains operated either by a homogenous group or by a single corporate
house, the effort is to minimize the number of stakeholders and or have as little a number
of independent stakeholders as possible. This is amply visible from the list of marketing
channels selected for analysis that all the alternate channels tend to have a component of
‘supply chain’ in terms of own retail network. In essence, more than the backward linkage
for sourcing of the produce, having an assured means of disposal is a must in handling
fresh fruits and vegetables with very low shelf life.
3.6 Price spread and marketing efficiency along the marketing channels.
This section presents the comparison of marketing costs, margins, price spread and
marketing efficiency taking three cases along different marketing channels.
Case Studies
3.6.1 Banana CV Robusta:
Marketing of banana is unique as the produce is dealt in bunches. Traditionally, the un ripe
banana bunches harvested, transported to the market get auctioned at the wholesale market.
It is the wholesaler who ripens the banana in special ripening chambers prior to further
marketing the same. However, the practice differs widely across banana growing regions.
In Karnataka, it is the commission agent who undertakes field sale who takes the
responsibility of ripening the bunch. In Jalgoan, the banana growers association undertakes
the ripening as well as long distance transport of the produce (Gajanana etal, 2005 ).

152
Growers from Rajahmundry region of AP adopt a unique method of transporting the semi-
ripe bunches to the wholesale market on bicycles (Sudha etal, 2006).
Several channels of marketing could be identified in banana (Robusta) marketing in
Karnataka. Field sale is the most common, followed by self marketing by the producer at
the nearby wholesale market. Sale at the HOPCOMs society is also popular, while the sale
to the newly established corporate house, SAFAL is the latest. Table 3 presents detailed
information on the marketing practices and procedures, costs, margins and measures of
marketing efficiency for banana (Robusta). It should be noted that both SAFAL and
HOPCOMs have their own retail marketing networks for product disposal, while the other
is follow the traditional route.
Producers need to have membership in the Safal Farmers association (SFA) or hold a
membership card for HOPCOMs, to be able to supply their produce to either of the two
marketing networks. Similar to the wholesale market, producers face an auction at both
markets. Market fee and a fixed percentage as commission are the other marketing costs
incurred by the producers in supplying banana to these markets. Post auction, banana
bunches change hands to SAFAL auction buyer or retailer at HOPCOMs and passes
through the network to reach the ultimate consumers.
Each market intermediary incurs a cost and adds a margin while passing the produce to the
nest market intermediary. These costs include the cost of handling, transport and repacking.
It could be seen from the table 3, that cost to the producer is the least when he undertakes
field sale, as he only needs to harvest the produce. Participation in any other market
involves a cost towards transport and other associated costs. It is the highest in sale through
the wholesale market channel, followed by that through SAFAL and HOPCOMs. Both in
the field sales and wholesale channel, the produce changes hands to retailers and other
intermediary like pushcart vendors before reaching the consumer. In case of SAFAL, the
produce is auctioned to SAFAL registered buyers who in turn sell it to retailers either local
or distant ones. Besides this channel, SAFAL also disposes at least about 25% of the
produce through its own retail outlets, 7 of which are located in different parts of
Bangalore. Similarly, HOMCOMs also sells through its own retail network within the city.

153
Producers share in Consumers Rupee:
It could be seen from the analyses that producers share in consumers rupee is the largest in
the co-operative channel (62.3%) followed by the traditional wholesale network (51%).
Despite all the hype, the SAFAL network fetches the farmer only 50 percent of the
consumers’ rupee.
Marketing Costs:
Total marketing costs incurred in Banana sale was in the range of Rs.2.77 to Rs. 5.1 /Kg,
with SAFAL outlet sales taking the largest chunk. Total margins of the different market
intermediaries were in the range of Rs. 2.65/Kg in the co-operative channel to Rs. 4.82/Kg
in the traditional channels.
Marketing Efficiency & Price Spread:
Marketing efficiency measured in terms of modified Acharya’s formula was the highest for
the co-operative channel at 1.65 followed by the 1.05 in the traditional wholesale channel
while SAFAL registered an efficiency of 0.99, which is better than the field sale channel.
Price spread ranged from Rs 4.9 in the cooperative channel to 8.8 in SAFAL outlet route.
3.6.2 Banana CV Yelaki
Creation of a marketing infrastructure can encourage specialized production of horticultural
crops in specific regions thereby enhancing the comparative advantage of its cultivation.
Several such examples can be cited, some of them being specialized cultivation of Tella
Chakkira Keli banana in Rajahmundry region of AP. Similarly, Yelaki banana is most
popularly grown in and around Ramnagar region of Mandya district, Karnataka. This has
received a boost from the extension of co-operative marketing network of HOPCOMs at
the district.
With a view to highlight this point, this study also analyzed the marketing practices and
channels involving Yelaki banana in Bangalore region. Typically, Yelaki banana is
produced around Ramnagar, besides Chiballapur. The growers from all over Karnataka sell
their produce, especially Yelaki banana in a wholesale market exclusively for fruits at
Binny market in Bangalore. However, the growers from Ramnagar have the opportunity to
sell their produce through the HOPOMs extension wing. The produce is transported by
HOMCOMs to its main centre in Bangalore and the produce disposed off through its

154
network of retail outlets. Farmers get higher net price for yelaki banana in comparison to
the Robusta type in both the channels studied. While the realization is Rs 11.16 /Kg in
wholesale market, it is nearly Rs. 18.72 /kg for sale through HOPCOMS society at
Ramnagara. These growers also benefit from lower costs as they need to harvest and the
produce is picked from the farm gate by the society. The HOPCOMs society transports the
produce to the main centre and distributes through its own retail outlets.
Producers share in Consumers Rupee:
It could be seen from the analyses that producers share in consumers rupee is the largest in
the co-operative channel (70%) in comparison to the 46 .5% in the traditional wholesale
network.
Marketing Costs:
Total marketing costs incurred in Banana sale was in the range of Rs.2.76 to Rs. 4.95 /Kg,
with co-operative network and wholesale market network. Total margins of the different
market intermediaries were in the range of Rs. 5.42/Kg in the co-operative channel to Rs.
16.39/Kg in the traditional channels.
Price spread ranged from Rs 4.9 in the cooperative channel to 8.8 in SAFAL outlet route.
3.6.3 Tomato
The marketing network of tomato included the traditional marketing channel of sale
through Kolar wholesale market, sale through SAFAL and its outlets, HOPCOMs and their
outlets and contract cultivation for Namdhari seeds private limited. The marketing costs,
margins and price spread along these six channels are presented in Table 5.
Net farm price varied from Rs. 4.05 /kg in the namdhari fresh channel to Rs. 5.93/Kg in the
channel 3, i.e., the distant market sale. While the procedure adopted by the SAFAL
network is similar to that for Banana, the namdhari fresh offers farm gate procurement.
Producers share in Consumers Rupee:
Producers share in consumers rupee in case of tomato among the six channels studied was
the highest in the co-operative network involving HOPCOMs at 435 followed by distant
market channel and SAFAL. The lowest was for the producers dealing with Namdhari

155
Marketing Costs:
Total marketing costs incurred in tomato marketing ranged from Rs. 2.45/Kg in Namdhari
sale to Rs. 6.28/Kg in Kolar marketing. Total margins of the different market
intermediaries were in the range of Rs. 2.55/Kg in the co-operative channel to Rs. 9.00/Kg
in the namdhari market network
Marketing Efficiency & Price Spread:
Marketing efficiency measured in terms of modified Acharya’s formula was the highest for
the co-operative channel at 0.75 followed by the 0.73 in the traditional distant market
channel. Price spread ranged from Rs 7.15 in the cooperative channel to 11.45 in
Namdhari.
3.7 Comparison of marketing arrangements and efficiency across
different marketing networks
An attempt has been made in this section to compare and contrast the conceptual
framework, operations, costs and margins under different marketing networks analyzed in
this study. Reorganization of agricultural marketing has been the most felt need in the
recent past both from the point of benefit to the producers and for meeting the changing
global order. Flow of investments into agriculture in general and that for marketing in
particular have been low, several policy changes have been brought forth in the last decade
or so. Corporatization of agriculture has become the order of the day. Hence, a number of
private seed companies or other corporate houses have started getting involved into
agricultural marketing. The primary objective of these initiatives has been to modernize
agricultural marketing as also provide the consumer an opportunity of picking quality
produce under clean surroundings. Any attempt at assessing the impact of these changes
should include parameters other than the shear marketing efficiency and price spread.
The parameters like marketing cost and margins are correlated to the number of marketing
intermediaries involved in the marketing system. The traditional marketing system
involves several market intermediaries each operating at different scale, there by
increasing the costs of marketing. In contrast, an organized marketing system having well
defined backward or forward linkages is much better equipped to handle the rising costs
and thus have cost effective marketing system. Similarly, marketing efficiency as a
parameter is a ratio of net price realized by the producer to the total of costs and margins in
the marketing network.

156
An organized marketing network likes SAFAL or Namdharis involves higher
establishment and operating costs due to their higher volume of operation. At the same
time having set up their own marketing network, they have better control over the business
operations and may be able to better perform in the long run. Also, the objective of quality
based pricing and assured quality to the consumers are better addressed by such networks.
In terms of marketing efficiency or marketing costs, the corporate houses may not match
up with either the traditional marketing network or the co-operatives, however, they are
successful in enhancing the value of the produce, there by creating the concept of value
based pricing, which is absent in the traditional system. Further, they could help producers
and traders by enhancing the shelf life of the produce and spread the marketability of the
produce. Being large scale operators they could create larger employment opportunities. It
is reasonable that the co-operative system has emerged the most efficient with least price
spread for all the selected crops. However, co-operative marketing system can cater only to
around 20 % of the produce that reaches the market.
The other corporate venture, i.e., the Namdharis is helping farmers in the vicinity of their
warehouse to get better realization at their farm gate. The value addition is the largest in
this channel. By grading and sorting, they are catering to the needs of different section of
consumers who have the affordability to pick better quality produce. Such value addition is
not clearly demonstrated in other marketing channels. The fact that this value addition is
not necessarily been distributed to the farmer is a matter of concern.
The SAFAL system of operations is conceptually unique and is futuristic. However, the
network could not sustain the marketing practices as envisaged in the long run. Dissatisfied
producers, traditional buyers blocking the operations and sheer lack of management appear
to have blocked the progress of SAFAL. Much of the capacity lying unutilized or under
utilized may soon led to huge over heads and reduced profit margins.
The traditional wholesalers’ role in marketing and distribution cannot be over looked. The
fact that the organized marketing as well as co-operative marketing is only price takers
while his traditional wholesale market is still the price setter is indicative of the importance
of this marketing network. There is however a need to regularize his operations and
redistribute the market margins based on the activity performed.

157
3.8 Constraints in accessing different marketing channels
Effort was made to obtain the opinion of different stake holders on the problems and
constraints faced by them under the different marketing arrangements. Each one of the
sample member was posed different questions on their experience and were asked to rank
the constraints in a descending order.
The respondents were widely divided on their opinion on the new marketing networks.
Producers who have been involved with SAFAL marketing network expressed that there
have been delays in payments from the market. Some of the SFA members from far off
places were extremely unhappy with the processes and the delays. Lack of information on
the price that is likely to prevail on the day of their participation was a major constraint for
participation in the network. Majority of the producers were happy with the co-operative
marketing network rather than the organized network. Since the cooperative market
network cannot absorb all the produce, they are forced to depend on the wholesale
markets.
The namdhari contract farmers were very happy with the system as the network provides
them a technical guidance, advance towards meeting their farm input needs and also
collect the produce from their farm gate. There was a sense of assured buyback even
though the price was slightly on the lower side.

158
Table 3: Constraints and problems in horticultural crop marketing
Constraints Rank Score *
Producers
Forced to sell to pre-harvest contractor due to absence of market
Non-availability of marketing credit 1 85.7
Faulty weighment & Loss while grading
Delay in payment ( by organized networks) 2 74.6
Less price as compared to the traditional market prices ( Chennai &
Bangalore)
3 65
Malpractices in auction
They fix minimum target to supply vegetables 4 25
Practice of bribing at the market
Inadequate facilities at the market 5 42.05
No storage facility
No facilities for personal stay at the market
Any other ( Specify)
Wholesalers
Organized marketing networks deprived them 4 31.45
Malpractices in auction 2 45.67
Faulty weighment 5 27
Practice of bribing or preferential treatment at the market 1 65.08
Inadequate facilities at the market 3 35.43
Retailers
Organized marketing networks deprived them 4 32
Non-availability of marketing credit 1 55.25
Retail chains affect their business 3 35
Malpractices in auction 2 45
Inadequate facilities at the market 5 45
* Percentage of interviewed persons agrees with the score

159
4. Suggestions for improvement
Horticultural produce marketing in India is in the process of being modernized. The
entry of corporate houses and other private and public sector organizations have initiated
investment into this sector is indicative of the changing trend. While much has been
changed and the process of creating infrastructure has begun, there is a lot of scope for
improvement. The specific features that need special attention include,
Entry of corporate houses into the arena of horticultural marketing has helped in
modernizing the marketing network of this set of crops. However, the process of price
discovery and price percolation is yet to be standardized.
There is ample scope to improve the mechanism and access to ‘market information
service’ at all levels irrespective of the type of channel in question.
5. Conclusions and policy implications
This study is an attempt to assess the economics of corporatization of horticultural
marketing system in India, with special reference to Karnataka. The analysis based on a
sample of over 400 stakeholders involved in marketing of three important horticultural
crops Viz., Banana ( Robusta and Yelaki) and tomato in and around Bangalore region,
brought forth the following.
Marketing of horticultural crops includes a number of marketing channels involving the
traditional as well as modern marketing networks. With a view to augment
modernization process, state governments have amended their existing legislature to let
corporate houses into the horticultural marketing arena. This has led to the creation of
marketing infrastructure exclusively for horticultural crops. Several models of marketing
networks involving backward and forward linkages have emerged in marketing of
horticultural crops. This study analyzed the performance of some of these marketing
networks on the basis of their performance and marketing efficiency. The study
specifically evaluated three modern systems Viz., SAFAL, Namdharis and HOPCOMs in
comparison to the traditional marketing networks for banana and tomato crops in
Karnataka. The following are the conclusions and inferences that emerged out of this
study.

160
The option to open up horticultural marketing to corporate houses has resulted in
creation of state-of the art infrastructure for facilitating horticultural crop
marketing.
The traditional and the modern marketing networks co-exist opening better
alternatives for the producers and consumers.
Modern marketing networks have been successful in creating the concept of
quality based pricing, thereby enhancing the value of horticultural crop produce
marketed along the supply chains.
The corporate houses were comparable to the traditional marketing channels in
terms of marketing costs and margins.
In terms of marketing efficiency, corporate house based marketing networks were
lower in comparison to the co-operative based networks.
Modern marketing networks were better off in product disposal as they had their
own ‘supply chains’ in operation.
Irrespective of the type of marketing network, all the modern marketing systems
were pinned with the traditional wholesale marketing system for price discovery.
Better and alternate parameters other than marketing efficiency need to be
evolved while measuring the effectiveness of corporatization of horti marketing.
Creation of market infrastructure and elaborate network of institutional support
could not address the issue of ‘price risk’ as effectively as a ‘predetermined price
contract’ in gaining producer confidence.
Policy Implications
Effectiveness and implications of creation of marketing infrastructure versus measures
that augment price risk need debate and further research.
Introduction and implementation of mechanism of price support need emphasis.
Policy and conceptual framework for regularizing the activities of exploitative
middlemen along the horticultural crop based supply chains is needed.
Conceptualizing and mitigating risks in horticultural crop based production systems need
critical view.

161
6) Annexures
Banana
Particular
s
Safal Market -1-Apr-2009 to 31-Mar-2010
(in Rupees )
Inwards Outwards Closing Balance
Quantity Value Quantity Value Quantity Value
Opening Balance 3376542 22352710
April 1124020 9224926.7 954206 9374536 3546356 23476878
May 1028318 9526604.6 929264 9878445 3645410 24132616
June 1076124 11541216 920172 10894110 3801363 25165021
July 952619.2 10167432 831919 10974245 3822063 25302056
August 949973.9 11211803 765898 10842934 3906139 25858639
September 980821.6 11442748 789300 10390600 3997660 26464512
October 1148886 13614850 1000474 12884663 4146072 27447000
November 862185.8 10340634 1028174 13653233 3980084 26348158
December 2171121 13199329 1020998 12826355 4130249 27342251
January 800041 8803816 948648 12029066 3981648 26358509
February 1046707 11165904 797054 9929150 4231301 28011214
March 2103466 21908852 972051 21849755 5362717 35501184
Grand
Total 14244285 142148116 10958158 1.46E+08 48551063 321408036
Average price 9.98 13.28

162
Tomato
Safal Market 1-Apr-2009 to 31-Mar-2010
(in Rupees )
Inwards Outwards Closing Balance
Quantity Value Quantity Value Quantity Value
19743803 57488536.02
588059 1846218 36820 102926 20295042 58947547.7
526863 5657254 55080 361764 20766825 64025893.85
723723 7440152 43105 355896 21447443 71012831.28
735566 5306463 32350 184804 22150659 75979065.96
1007769 8939928 99682 2267456 23018746 83450793.23
1193466 7677778 29260 1007911 24182952 90820867.25
1413410 10507987 30280 155143 25566082 101010390
792036 8122242 25280 225246 26332838 108867033.3
618025 8095249 34700 379486 26916163 116597380.1
590513.4 4479003 35980 273143 27470696 120700552
409128 1709915 30380 114866 27849444 122551602
727744.7 2326412 31480 104118.1 28545709 125233301.9
9326303 72108599 484397 5532759 294542600 1139197259
7.731745 11.42195

163
Table 3: Banana Price Spread and marketing Efficiency
Sl No Field sale Wholesale SAFAL SAFAL Outlet HOPCOMS
Channel 1 Channel 2 Channel 3 Channel 4 Channel 5
Value
Rs/Kg
% to
Total
Value
Rs/Kg
% to
Total
Value
Rs/Kg
% to
Total
Value
Rs/Kg
% to
Total
Value
Rs/Kg
% to
Total
Net Farmer price 6.91 47.65 7.41 51.10 8.7 49.71 8.7 49.71 8.1 62.31
Cost 0.32 2.21 1.45 10.00 1.3 7.43 1.3 7.43 1 7.69
WS Price 7.23 49.86 8.86 61.10 10 57.14 10 57.14 9.1 70.00
Cost 0.85 5.86 0.85 5.86 2 11.43 2.1 12.00 1.25 9.62
Margin 1.92 13.24 2.29 15.79 1.5 8.57 1.4 8.00 2.65 20.38
Retail Price 10 68.97 12 82.76 13.5 77.14
Cost 0.4 2.76 1.6 11.03 1.8 10.29
Margin 1.6 11.03 0.9 6.21 2.2 12.57
Pushcart Price 12 82.76 13.5 77.14
SAFAL
outlet
Cost 1.2 8.28 1.2 6.86
Margin 1.3 8.97 2.8 16.00
Consumer Price 14.5 100 14.5 100 17.5 100 17.5 100 13 100
Cost 2.77 3.9 5.1 4.6 2.25
Margin 4.82 3.19 3.7 4.2 2.65
Efficiency 0.91 1.05 0.99 0.99 1.65
Price spread 7.59 7.09 8.8 8.8 4.9

164
Table 4: Banana marketing Efficiency & price Spread, Yelaki
WS Binny HOPCOMS society
Channel
1
Channel 2
Value
Rs/Kg
% to Total Value
Rs/Kg
% to Total
Net Farmer price
11.16 46.50 18.72 69.59
Cost 2 8.33 0.76 2.83
WS Price 13.16 54.83 19.48 72.42
Cost 0.85 3.54 2 7.43
Margin 9.99 41.63 5.42 20.15
R Price 15.5 64.58
Cost 0.85 3.54
Margin 2.25 9.38
Pushcart Price 18.6 77.50
Cost 1.25 5.21
Margin 4.15 17.29
Consumer Price 24 100.00 26.9 100.00
Cost 4.95 20.63 2.76 10.26
Margin 16.39 68.29 5.42 20.15
Efficiency 0.52 0.52 2.29 2.29

165
Table 5: Tomato Price Spread and market Efficiency
SAFAL SAFAL outlet MAS Market HOPCOMs APMC, Kolar Namdharis
Channel 1 Channel 2 Channel 3 Channel 4 Channel 5 Channel 6
Rs/Kg
% to
Total Rs/Kg
% to
Total Rs/Kg
% to
Total Rs/Kg
% to
Total Rs/Kg
% to
Total Rs/Kg
% to
Total
Farmer Net price
5.73 40.93 5.73 40.93 5.93 42.35 5.35 42.79 4.62 33.01 4.05 26.13
f cost 2.00 14.29 2 14.29 3.74 26.72 4.15 33.21 3.18 22.70 0.95 6.13
WS Price 7.73 55.21 7.73 55.21 9.67 69.07 9.50 76.00 7.80 55.71 5.00 32.26
cost 1.5 10.71 1.5 10.71 0.35 2.50 0.45 3.60 0.6 4.29 1.5 9.68
margin 0.77 5.50 1.77 12.64 1.98 14.14 2.55 20.40 0.60 4.29 9.00 58.06
Retailer price 10 71.43 12 85.71 9 64.29
cost 1.2 8.57 0.85 6.07 1 7.14
margin 0.8 5.71 1.15 8.21 1.5 10.71
Pushcart 12 85.71 11 78.57 11.5 82.14
SAFAL
Outlet cost 0.7 5.00 1.3 9.29 1.5 10.71
margin 1.3 9.29 1.7 12.14 1 7.14
Price 14 100.00 14 100.00 14 100.00 12.5 100.00 14 100.00 15.5 100.00
Cost 5.40 4.80 4.94 4.60 6.28 2.45
margin 2.87 3.47 3.13 2.55 3.10 9.00
Efficiency 0.69 0.69 0.73 0.75 0.49 0.35
Price Spread 8.27 8.27 8.07 7.15 9.38 11.45

166
Table 5: Tomato Price Spread and market Efficiency
Statement of Expenditure of Network Project “Estimating Marketing Efficiency of
Horticultural Commodities Different
Supply Chain in India”. From 01.08.2009 to 30.06.2010.
Sl.No Particulars Opening
Balance
Budg
et
Remittanc
e
Received
Payments
Made
Refunds Closing
Balance
1
Salaries/Hon/SRF
-
-
-
1,71,600.00
0.00
-
2
Travelling
Allowance
-
-
-
6,136.00
0.00
-
3 Recurring
Contingencies
68,675.00
4 Receipts
- - 3,00,000.0
0
0.00 0.00 0.00
5 Total
- - 3,00,000.0
0
2,46,411.00 0.00 53,589.0
0

167
6. References
Anonymous, 2008, Horticultural crop statistics of Karnataka State at a glance,
Directorate of horticulture, lalbaugh, Karnataka
Acharya, S.S. and N.L.Agarwal , 2001, Agricultural marketing in India, New Delhi,
oxford and IBH Publishing Co.
Crawford, I.M, 1997, Agricultural and food marketing management, FAO publication
www.fao.org/docrep/004/W3240E/W3240E00.HTM
CII, Mckinsey Report, 1997. The Fruit and Vegetable Opportunity, In: Food and
Agriculture Integrated Development (FAID) Action Report, pp.140-152
Gajanana, T.M.,D. Sreenivasa Murthy and Sudha M, 2002, Marketing practices and post
harvest loss assessment of banana var. poovan in Tamil Nadu, Agricultural
Economics Research Review, 15(1): 56-65.
Gupta, S. P. and N. S. Rathore, "Marketing of Vegetables in Raipur District of
Chhattisgarh State: An Economic Analysis", Indian Journal of Agriculture
Economics, July-Sept. 1998, Vol. 53, No.3, p. 393.
Indian Council of Agricultural Research (ICAR) 1976, Rural Agro-Industrial Complex
for Karnataka. A joint effort of India and the Peoples Republic of Bulgaria
Brochure released on the occasion of the visit of His Excellency the President of
Bulgaria to inaugurate the Agro-industrial Complex, Indian Institute of
Horticulture Research, Bangalore Pp1-20
Subrahmanyam, 1989, Economics of cultivation of horticultural crops in South India,
Technical bulletin 7, Indian Institute of Horticulture Research, Bangalore-89
Sudha,M, T.M. Gajanana and D. Sreenivasamurthy, 2005, Post Harvest Handling and
Marketing of Banana CV Tella Chakkara Keli in Rajahmundry region of Andhra
Pradesh, Indian J of Agricultural Marketing, 19 (1): 25-37
Sudha, M., T.M. Gajanana, D. Sreenivasa Murthy and V. Dakshinamoorthy, 2002. Post
harvest Loss Assessment of Pineapple in Kerala, Indian Journal of Agricultural
Marketing,16(1):10-21
Sudha, M. and F. Kruijssen, 2006. Varietal differences in the supply chain of two mango
varieties in South India. Paper presented at the “International symposium on
tropical and sub-tropical fruits”, 27-30 November 2006, Chiang Mai, Thailand

168
Estimating Marketing Efficiency of Vegetables under
different supply chains in Tamil Nadu
1. INTRODUCTION
1.1 Background
Compared to field crops horticultural crops offer wider scope for income increase to
farmers. They are also amenable for higher value addition. Greater employment
opportunities coupled with higher remuneration is an incentive to go in for
horticultural crops. However the flip side is that they are highly resource intensive,
perishable and seasonal in nature. Storability is limited and need special
arrangements like cold storage with higher levels of investments, normally not
affordable by farmers. Yet, growing income levels of Indian population and
increasing awareness of nutritional requirements have led to a gradual increase in
the demand for horticultural crops.
Tamil Nadu is one of the prospering states with higher scopes for horticultural crops.
While agriculture accounts for about 12% of the State GDP that of Horticulture is
estimated at 3.5%. The area under Horticulture at 8.24 lakh Ha accounts for 15.5% of the
total cultivable area in the State, with an annual production of 99.47 lakh tonnes.
Production strengths of Tamil Nadu in Horticulture
Tamil Nadu accounts for nearly 6% of the area under fruits and 4% of the area under
vegetables in the country. In terms of production, the state's share is nearly 10% in fruits
and 6% in vegetables. Tamil Nadu is also a leading state in production of flowers. The
estimated total production of horticultural crops is 10.95 Lakh ha during 2008-09. As the
figures indicate there has been a slow but steady increase in the cultivation of different
components of the horticultural crops compared to the base year as per realizations and
estimates.

169
Table 1. Status of Horticultural Crops in Tamil Nadu
(Area: Lakh Ha., Production: Lakh MT., Productivity: MT/Ha.)
SI.
Crops 2000-01
(Base year)
2006 07 2007-08
(provisional)
2008-09
(Estimated)
Area Pdn Pdy Area Pdn Pdy Area Pdn Pdy Area Pdn Pdy
1 Fruits 2.23 40.06 17.96 2.69 69.4 25.79 2.92 75.30 25.80 3.18 82.08 25.81
2 Vegetables 2.20 59.39 26.99 2.41 73.06 30.32 2.61 79.27 30.37 2.84 86.4 30.42
3 Plantation
crops 2.20 7.73 3.51 2.33 7.92 3.4 2.53 8.6 3.41 2.76 9.37 3.43
4 Spices&
condiments 1.68 6.62 3.94 1.55 8.02 5.17 1.68 8.7 5.18 1.83 9.48 5.19
5 Medicinal &
Aromatic 0.01 0.02 0.02 0.05 0.08 1.6 0.05 0.09 1.8 0.06 0.11 1.83
6 Flowers 0.19 1.45 7.75 0.24 2.01 8.37 0.26 2.18 8.38 0.28 2.38 8.5
TOTAL 8.51 115.27 13.55 9.27 160.49 17.31 10.05 174.14 17.33 10.95 190.0 17.35
Source - Tamil Nadu state horticultural department
Among varied horticultural crops grown, the state ranks first in the production of
flowers and tapioca. The state accounts for about 59 percent of the total tapioca
production in the country. Besides, the state ranks second in the production of mango
and third in the production of Sapota. Fruits dominate both area and production

170
followed by vegetables and both groups exhibit higher growth rates. Banana, mango
and sapota are the major fruits grown in the state.
Table 2 - Production strengths of Tamil Nadu
Area Production Share of All India All India Rank
(`000 Ha) (`000 tonnes) Area Prodn Area Prodn
Total Fruit 228 4342 6% 10% 7 3
Mango 111 439 7% 4% 6 8
Banana 85 3544 18% 25% 1 2
Sapota 3 72 5% 12% 5 3
Vegetables 214 5445 4% 6% 10 5
Tapioca 102 3835 43% 59% 2 1
Onion 32 282 6% 5% 4 5
Tomato 27 258 6% 4% 7 10
Source - NHM Database
Vegetables
Bhendi, Tapioca, Tomato, Onion, Brinjal potato and Drumstick are some of the major
vegetables grown in Tamil Nadu. These vegetables account for about 85% of the total
vegetable area and production. While fruits are mainly grown in large areas where
water and labor are relatively scarce, vegetables are generally grown in small areas
manageable mostly with family resources. Vegetable growing areas are far more
distributed in nature compared to fruits and are mostly concentrated around large urban
centres. Besides there are some belts in the state more conducive for vegetables in
terms of weather and water resources around which vegetable cultivation is more
intensive. Specialised vegetable markets dominated by mandies and commission agents
have evolved to become major market intermediaries in such areas. While cultivation
of major vegetables is widely distributed across different districts, certain districts
account for concentration of cultivation of specific vegetables as indicated in the table.

171
Table 3. Vegetables (Main Production areas)
Vegetable Main production areas
Tapioca Namakkal, Salem, Dharmapuri
Drumstick Thoothukudi, Dindigul, Karur
Tomato Coimbatore, Dharmapuri, Salem, Krishnagiri
Onion Perambalur, Thiruchirapalli, Namakkal, Dindidul
Brinjal Vellore, Kanchipuram, Theni, Coimbatore
Cabbage Nilgiris, Krishnagiri, Dindigul
Potato Nilgiris, Dindigul
Bhendi Kancheepuram, Vellore, Dindigul
Horticultural Scenario in Tamil Nadu
Strengths
The state is ideally suited for exports given the strategic location of airports and sea
ports
Prevalence of off-season cropping (e.g. mango, grapes, etc.) is unique to Tamil Nadu.
Presence of leading institutions like Tamil Nadu Agricultural University (TNAU) and
other Research Institutions.
State Government policies facilitate growth of the sector (TANFLORA, AEZ's).
Weaknesses
There is a lack of awareness on Hi-tech horticulture / quality consciousness among
growers
Lack of Adherance to phyto-sanitary standards hinders acceptance in foreign markets.
The presence of small land holdings hampers adoption of best practices.
Lack of price discovery mechanism often leads to wide fluctuation in market prices.
There is low focus on post harvest management and facilities like cold storage, pre-
cooling and waxing centers, processing units etc.
The marketing channels are not well developed
Opportunities
Large tracts of drylands / rainfed areas / wastelands can be utilized for promotion of
horticulture.

172
There is an opportunity to set up processing industries for horticultural crops on the
back of improved post harvest practices
There are export opportunities to the Far East which can be tapped (Tamarind,
Chillies, Mango etc)
There is an increasing demand in developed countries for Green foods / Organic
foods.
There is a growing trend in contract farming initiatives which needs to be encouraged
through supportive policies.
Threats
The dwindling water resources could pose a serious issue in the coming years
Non-availability of work force for agriculture during season.
Existing and Potential Market Linkages
Horticultural crops being perishable in nature are subject to post harvest losses. Post
harvest facilities from production linking to the market and consumption points help in
the reduction of losses due to wastage. Agri Export Zones (AEZs) are promoted with the
objective of promoting exports of agricultural produce from selected areas of
productivity prominence, while food parks provide an opportunity of increasing
processing capabilities in the state. The AEZs and the Food Parks are two important
linkage points which helps in absorption of Fruits and Vegetables for further value
addition.
1.2 Policy research questions
Emerging Supply Chain Alternatives
Horticultural crops being perishable in nature are subject to post harvest losses. Post
harvest facilities from production linking to the market and consumption points help in
the reduction of losses due to wastage. Recent efforts in the horticultural sector revolve
around maximizing farmer’s returns by ensuring a greater share of consumer’s rupee and
by avoiding post harvest losses. Creation of better infrastructural facilities in the form of
cold storage and supply chain management, provision of market intelligence are some of
the measures emphasized in developmental plans. Agri Export Zones (AEZs) are
promoted with the objective of promoting exports of agricultural produce from selected
areas of productivity prominence, while food parks provide an opportunity of increasing

173
processing capabilities in the state. The AEZs and the Food Parks are two important
linkage points which helps in absorption of Fruits and Vegetables for further value
addition.
Public private partnerships are being encouraged to invest in marketing infrastructure.
Similarly corporate houses are entering horticultural produce marketing in a significant
manner. Various state governments have been promoting direct sale of horticultural
produce like vegetables and fruits by farmers to consumers through markets like farmers
shandies. These steps are expected to reduce the number of middlemen involved in
moving horticultural produce from farmers to consumers and in that process cut down
the market margins going to them. It is also expected that these gains will be shared by
both producers and consumers.
However, it is a moot question whether big corporate once they get themselves firmly
established will pass on the benefits either to the consumer or the producer rather than
appropriating it to themselves. Their success in penetrating the retail horticultural
marketing is as yet uncertain as is the case with other market attempts like farmers
shandies. There is need for examining the changes that are happening in the market place
for horticultural products in the light of emerging alternative supply channels. To
understand the effectiveness of these newer supply channels the present study is
contemplated with the following objectives.
1.3 Objectives of the Study
To estimate the marketing cost and marketing margin of different functionaries
for vegetables Tapioca, Potato, Brinjal and Gerkins under various supply chains
in Tamil Nadu
To analyze the price spread, marketing efficiency and farmer’s share in consumer
rupee in various supply chains
To identify the constraints perceived by various stakeholders; and study the
factors influencing the marketing cost, market margin and marketing efficiency
To suggest suitable strategies to enhance the marketing efficiency for
horticultural commodities and

174
2. Data and Methodology
2.1 Study area
Most of the common vegetables are widely grown across regions of the state are
consumed locally. Certain pockets, where the environments are conducive concentrate
on few or more vegetable crops. Table below lists the predominant districts in which the
vegetables selected for the present study are grown. The status of area and production of
various vegetables and those selected for the study across different districts of the State
are discussed in a subsequent section.
Table 4. Major growing Districts of selected vegetables
Vegetable Main production areas
Brinjal Salem, Coimbatore, Dindigul
Potato Nilgiris, Dindigul
Tapioca Namakkal, Salem, Dharmapuri
Gherkins Dindigul, Madurai, Theni
.
2.2 Data on items
Data was collected from farmers and market intermediaries for the four selected
vegetables brinjal, potato, tapioca and gherkin. Separate interview schedules were used
for collecting information from the sample respondents selected as per sampling
methodology detailed in section 2.4. The data were based on respondent recall and as per
existing practices and pertain to the year 2009-10. Details regarding harvesting and post
harvesting operations along with their expenses, post harvest marketing expenses
incurred by the farmers till their produce was sold by them to different intermediaries or
directly to the consumers were also collected.
From the market intermediaries details of market expenditures incurred by them from the
time they buy the produce from their sources and till they disposed of them to the next
functionary or final consumers were collected. These details are relevant for calculating
various market related indicators and parameters like marketing cost, marketing margin,
price spread and marketing efficiency.
2.3 Sample size
Sample size in general is a function of population size. Wherever the population size is
large, however, for practical reasons its size is limited. Considering the nature of
cultivation it was agreed that for farmers survey a sample size of 120 would be adequate

175
and the same was adopted in the present study. For each of the four vegetables brinjal,
potato, tapioca and gherkin covered under the present study a sample of 120 farmers
were selected as detailed in the next section and interviewed. For market intermediaries
different sample sizes were adopted depending on the number of such intermediaries
involved in market operations in the selected locations. Details of the intermediaries and
the sample size for each of them for the vegetables covered in this study are presented in
the table.
Table 5. Farmers and market intermediaries sample sizes
Sample Brinjal Potato Tapioca Gherkin
Farmers 120 120 120 120
Wholesalers 15 15
Retailers 30 30
Commission Agents/processors 15/0 15/0 15/5 0/ 5
Farmers from Uzhavar shanti 30 30
2.4 Statistical techniques
One of the main focus of the study was to estimate various indicators of the status of
vegetable markets. These indicators help to assess the market margin, market cost, price
spread and marketing efficiency. Besides, factors affecting marketing efficiency,
constraints faced by the farmers and other market intermediaries are also to be assessed.
Data collected through primary surveys of the farmers growing the selected vegetables
and market intermediaries engaged in marketing of the vegetables were analysed for
assessing the above indicators. Conventional descriptive analysis using tables and
descriptive statistics were used for calculating the components of marketing costs and
marketing efficiency.
Marketing Efficiency:
Markets and intermediaries undertake various functions in transferring the produce from
the producer to the final consumer. The transferring process involves various costs in
terms of assembling, grading, packing, loading, transport, fees and a component as
margin to the intermediaries. Efficiency is a concept that invokes the notion of how these
costs compare with the services offered. It is calculated using Shepherd Formula and
Acharya’s Modified Marketing Efficiency using the following definitions

176
Shepherd formula :
ME = (VA/MC)*100 where, ME = index of Marketing efficiency
VA = value addition by the marketing
system and
MC = marketing costs including margins
Acharya’s Modified Marketing Efficiency
MME = FP/(MC+MM)
Where, MME is modified measure of Marketing efficiency
FP is price received by farmers
MC is marketing cost
MM is marketing margin
Price Spread is calculated as the difference between the price paid by the consumer and
the price received by the farmer, the Average Gross Margin as the sum of average of
the margins received by specific intermediaries of a channel for a vegetable weighed by
volumes handled by them ie.,Producer Share in Consumer Rupee is calculated as the
percent consumers price received by the farmer and the Marketing Margin of a
Middleman is calculated as the difference between the sale price received by him and
the price at which he bought the produce, reduced by the extent of costs incurred by him
all calculated per unit of the produce handled.
Factors affecting adoption of gherkin contract farming
In the present study, Probit model was applied to identify the factors influencing the
farmers’ participation in the gherkin contract farming. For gherkins the sample farmers
are actual contract farmers with a sample of equal number of non gherkin farmers from
whom data were collected mainly for determining the factors influencing adoption
decision. The probit model is based on utility theory or rational choice perspective on
behavior. Probit analysis can be used to estimate the effects of one or more independent
variables on a dichotomous dependent variable. The qualitative dependent variable
assumes only two values viz., 0 and 1. In this model, it is assumed that the factors
influencing participation in contract farming depended on the variables such as age,
farmsize, education of head of family, environment awareness, debt, net income and
percentage of villagers growing gherkins in the village. The model used in this study is
given below.
Ii = β0 + β1 X1 + β2 X2 +β3 X3 + β 4X4 + β5 X5 + β6 X6+ β7 X7+ e

177
Where,
Ii = Y =1, if the farmer participates in gherkin contract farming
= 0, if the farmer does not participate in gherkin contract farming
X1 - Age of the farmer (in years )
X2 - Farm size ( ha)
X - Educational status of the farmer indicated by grades viz. Illiterate - 1; Below
primary- 2;
Primary- 3; Upper primary- 4; Secondary College -5; High school- 6 and
Others- 7
X4 -One for environment awareness and zero for environment awareness
X5 - Debt of household ( in Rupees)
X6 - Net income from contract farming/non-contract farming (Rs /ha).
X7 - Per cent of farmers adopted gherkin contract farming in the village
β1 to β7 - Co-efficients of independent variables
β0 - Intercept
Constraints perceived by the farmers / wholesalers / retailers
Garrett’s Ranking Technique:
Constraints in vegetable marketing were prioritized by using Garrett’s ranking technique
in the following manner using Garrett’s Ranking Technique:
100 (Rij - 0.50)
Percent position = ---------------------
Nj
Where, Rij is the rank given by ith item by jth individual
Nj is the number of items ranked by the jth individual
The percentage position of each rank was converted into scores using Garrett table. For
each constraint, scores of individual respondents were added together and were divided
by total number of respondents for whom scores were added. Thus, mean score for each
constraint was ranked by arranging them in the descending order. In the same manner,
opinion about the problems and prospects was obtained and then Garrett’s ranking
technique was used for prioritizing the constraints. An Excel macro was developed to
automate the computations.

178
3. Results and Discussion
3.1 Marketing of vegetables
Several institutional interventions have been planned and promoted by the State and
Central Governments to improve marketing of agricultural and horticultural crops.
Majority of these measures are aimed to reduce the intermediaries, improve market
infrastructure and facilities so that small and medium farmers could be benefited and that
they receive a higher share of the consumer price. Promotion of cooperative marketing
societies is one such institutional arrangement that has been promoted with various
incentives. However its success depends on client patronage namely farmers
participation. Wherever homogenous producer groups could be formed with continuity
of cropping there is a possibility of cooperation to succeed.
By and large vegetables are grown in small areas compared to agricultural crops due to
their resource use intensity, especially labour and capital. Perishability of the produce
demands that delays in harvesting and disposal of the produce to the consumers is
minimised. Most of the vegetables harvested are brought to nearby assembling centres,
either wholesale markets in nearby towns or commission mandies where there is
concentrated production of vegetables. In far flung areas assembling function is taken
care by village traders in local shanties.
Most common market channel for vegetables observed involves the produce moving
from producers to assemblers who are either village traders of commission mandies from
whom wholesalers purchase the produce mostly through auctions. While village level
trader assemblers usually buy and trade commission mandies undertake the functions of
major assembly and forwarding to consuming centres for fixed commission charged that
ranges from six to 15 per cent of the value of transactions. Wholesalers procuring from
the man dies arrive from different consuming centres and bid in the auctions conducted
at these mandies. Often farmers voice concerns about unbiasedness of the commission
agents and do not rule out the possibility of collusion between them. Wholesalers
distribute the produce to the final consumers through local retailers. Thus,
ProducerTrader/Commission agentWholesalerRetailerconsumer
is the predominant channel through which major share of the vegetables produced are
observed to be marketed. Specifically this holds true for those vegetables that reach the
consumer without changes in its form. In this channel traders and commission mandies

179
undertake the assembling function, the wholesalers the twin functions of translocation
and distribution and the retailers the final distribution function. Observations indicate
that the risks of wastages and losses travel in the inverse direction
starting from the retailers, to wholesalers and minimally to the commission agents.
However the absolute price risks are born by the producers and consumers at both ends
of the channel. This channel is cut short when the produce is marketed locally or when
farmers take advantage of institutional arrangements to market their produce. For
instance, small proportions of farmers sell their produce directly to consumers through
local markets or farmers markets or to local retailers. In such cases one gets the
following channels
ProducerInstitutionWholesalerRetailerconsumer
Producer (through local shanties/farmers market)consumer
ProducerRetailerconsumer
These were the major channels observed for the vegetables brinjal and potato
covered in the present study. Nilgiris Cooperative Marketing Society (NCMS) was the
major institution involved in the marketing of potato grown in Ooty which has mainly
replaced the functions of the commission agents in potato marketing.
Additional intermediaries enter into the market depending on the specificity of the
vegetable be it in the form of the need to be processed, stored, targeted for specific
segments of the markets and or institutional interventions. In cases where produce is
purchased by processing units the final produce is either distributed as manufactured
product with better shelf life through general merchandise distribution channels or
exported to long destinations both within and outside the country. In such vegetables
depending on the nature of the crop the processing units source their raw materials either
directly from the producer or through agents and/or commission agents. For instance,
tapioca covered in this study and cultivated in large areas by farmers compared to other
vegetables is procured directly by the processors employing agents. The final produce of
the tapioca processing units are starch and sago that go mainly for industrial uses and are
mainly sold through commission agents and/or SagoServe an industrial cooperative to
wholesalers. Wherever farmers supply their produce to the commission agents some
amount of informal contract farming in a loose sense is practised with the commission
agents mostly providing the capital requirements of cultivation and some amount of
input provision which are adjusted during the payment of the farmers for their produce.

180
Gherkins produce covered in the study is completely exported after minimal processing
by processing and despatching units. The crop is cultivated entirely under contract
farming and the processors undertake periodical supervision of the cultivation besides
providing all the resources needed for cultivation. Complete accounting is done by the
firms and farmers are paid for their produce after deducting for the expenses of the
resources provided. Though contract farming is the rule, farmers are paid at prevailing at
market prices and hence have to bear both production and marketing risks to a large
extent till the produce reaches the processor.
3.2 Innovative models
Cooperative tapioca marketing (SagoServe) society:
In case of tapioca there has a success story of marketing cooperative institution in the
form of SagoServe. It is to be noted that Sagoserve serves not the tapioca producers
directly, but helps only the processors of starch and sago to market their final produce.
Benefits to farmers are indirect in the sense that processing firms directly procure the
raw tubers from farmers and market most of their final produce through Sagoserve and
thereby some of the traditional middlemen are eliminated. It would be more
advantageous to the farmers if they could have organised cooperative processing units of
their own but none of the units operational in the area are cooperatively organised.
It is estimated that in India, tapioca is grown over an area of 3.5 million hectares with a
production of over 60 lakh tonnes of tubers. Though Kerala ranks first in cultivation and
production, the Tamilnadu stands first in respect of processing of tapioca into sago and
starch throughout the country meeting about 85% of country's demand. -There are about
800 sago and starch industries in Small Scale sector scattered throughout the State.
Erstwhile Salem District now divided into Salem and Namakkal districts has
traditionally been the Land of Sago and Starch. The region offers good raw material,
cheap labour and good sunshine for a longer period of the day throughout the year,
helping manufacturers to produce more tapioca based products sago and starch.
SagoServe
Prior to the formation of the SagoServe an Industrial Co-operative Service Society the
manufacturers of starch and sago in this district faced a lot of problems pertaining to
credit and marketing of tapioca products. Merchants used to offer low prices for their
goods and middlemen exploited this situation in the absence of organised marketing and

181
warehousing facilities. To get over these problems the sago/starch manufacturers
formed "The Salem Starch and Sago Manufacturers' Service Industrial Co-operative
Society Ltd.", Salem in 1981 under the Tamil Nadu Co-operative Societies Act 1961.
This society, popularly known as "SagoServe" throughout the world, is functioning
under the administrative control of Director of Industries and Commerce, Govt. of
Tamil Nadu.
After the emergence of SagoServe, the bargaining power of manufacturers has
substantially increased in the field of marketing and the menace of middlemen in this
trade has been completely overcome. Due to sustained efforts of the society, sago/starch
industry has now become the backbone of Salem District's Rural Economy, providing
employment to more than 5 lakh persons both in field as well as factories.

182
INCENTIVES OFFERED BY THE GOVERNMENT:
(1) State participation in the share capital structure of the society.
(2) Exemption on payment of A.S.T.
(3) Reduction of VAT Rate from 4% to 2% sales routed through SagoServe.
(4) CST exemption for the goods sold to other State out of the stocks purchased from
SAGO SERVE.
(5) Subsidy for modernization of Sago and Starch Manufacturing units
These incentives have played a vital role in strengthening SagoServe and helped the
sago/starch industry thrive.
Working of SagoServe:
SagoServe members send their finished goods for sale to the society. On receipt of
goods, the member is paid 60% of the value of the goods as advance and consignment is
assigned a 'Lot Number'. Samples drawn from this consignment are put to 'Tender Sale'
conducted daily except on Sundays and the days of State, National holidays. After
paying a tender deposit of Rs.2,00,000/- or any amount as may be fixed from time to
time the buyers are registered with the society and only then they can participate in the
tenders. At present both industrial concerns as well as private traders have registered
themselves as buyers at the SagoServe.
After verification of sample of starch and sago in the Tender hall the traders quote their
rates in secret tender forms and the results are announced after tabulation around 2.30
P.M. The member-producer has the option of confirming the highest rate against his
goods. Once he confirms the sale he is paid another additional advance calculated with
reference to the sales rate after keeping Rs.40/- for Starch and Rs.SO/- for Sago per bag
for recoverable expenses. The goods of the members, till the confirmation of the sale and
those of the buyers, till they take delivery, are stored in the SagoServe godowns at a
nominal godown rent.
Besides this tender system, SagoServe is executing the orders directly received from the
consumers/end users against 100% payment from private merchants and Co-operative
societies respectively on behalf of the members.

183
Farmers’ Market
Farmers’ markets have been established in Tamil Nadu with a view to improve the
efficiency of marketing fruits and vegetables, and to increase the farmers’ share in
consumers’ expenditure on purchase of fruits and vegetables. Started in the year 1999,
about 100 farmers markets have been set up so far in different districts throughout Tamil
Nadu under the organizational control of the respective district market committees.
Farmers’ markets are the new institutional arrangements that eliminate the middlemen in
fruits and vegetables marketing by bringing producers and consumers of these
commodities in direct contact with each other. The elimination of intermediaries helps
farmers in getting good price and consumers in getting fresh vegetables and fruits at a
reasonable price. Farmers’ markets are not only outlets for locally produced fresh fruits
and vegetables. They help establish connections between consumers and food producers,
provide an additional income source for farmers, and in general, serve as a tool for
community development.
There is wide support for the farmers’ markets from consumers as they are benefited in
many ways. In addition to low prices of vegetables sold in the market, the consumers are
benefited by good quality and freshness of the vegetables besides getting a wide variety

184
of vegetables in a single place. Some of the consumers feel that it gives them a special
experience to buy from the actual producers of the commodities which is a rare chance
in the modern economy.
Farmers’ market helps to avoid the exploitation by wholesale traders. The prices of
vegetables sold in the farmers’ markets are fixed above the wholesale price (at which the
wholesalers buy vegetables from farmers) and below the retail prices (at which the
consumers buy vegetables from vegetable retailers). Hence prices prevailing in the
farmers’ market are beneficial to both producers and consumers of vegetables.
Problems and constraints in Farmers’ Market
Most of the farmers reported the reduction in bus service to the market during the
last five years which was the single major constraint faced by them in bringing
vegetables to the market on time. Though some farmers resorted to their own
arrangements to transport the vegetables many farmers stopped or reduced their
sales in the farmers’ market. The reduction in transport facilities to the market
during the last five years was the major reason for the reduction in average annual
arrival of vegetables in the farmers’ markets.
In large towns consumers report that allowing traders to buy vegetables from the
market is a problem. This was a major problem faced by the consumers when the
farmers’ market was not properly regulated and monitored during the last five years.
The retail vegetable sellers buy vegetables early in the morning which deprived the
consumers of quality vegetables. However, farmers point to the fact that unless the
traders are allowed to some extent, it is not possible for them to sell the entire stock
in a single day. Further, the retail vegetable sellers who buy from the farmers’
market also serve the consumers who are located far from the farmers’ markets and

185
those who are not able to travel to the farmers’ market. At present almost all the
farmers markets depend on the state government for most of their financial and
manpower requirements. The cost of managing the farmers’ markets far exceeds the
income even though there is scope for increasing the income from the markets thus
making them financially self-supporting.
Consumers in many of the small towns reported that non-availability of variety and
hill vegetables is a major problem faced by them in supporting the farmers’ markets.
Farmers in about two thirds of the farmers’ market felt the need for establishing
mini-cold storage facility inside the premises of the market so as to store the unsold
vegetables for a few days.
Farmers and consumers in markets surveyed reported that wholesale vegetable
market is already located close to the farmers’ market which hinders the smooth
functioning of the farmers’ markets.
3.3 Suggestions by stakeholders for improvement
A) Location
Locating the markets close to large residential areas in big cities and close to the bus
stand in smaller towns.
Relocate the vegetables market adjacent to farmers’ market since it reduces both
farmers and consumers to farmers’ market.
There is a scope to establish new markets in residential areas of medium sized towns
and more markets in big cities after examining the scope.
B) Availability of vegetables and market timing
Arrangements have to be made for vegetables during lean production periods.
Fruits and flower stalls may be started within the farmers’ market premises –
Women self-help groups in the area may be encouraged to put up fruit and flower
stalls.
Increasing number of stalls, wherever possible
Ensure availability of vegetables during lean season by providing extension support
to farmers to grow vegetables throughout the year. Popularization of vegetable crops
and varieties suitable for different agro-climatic and soil conditions during different
seasons is essential.
Consumers in farmers’ markets located in most of the smaller towns reported the

186
non-availability of hill vegetables and lack of variety. Local self-help groups in
these towns may be motivated to put up stalls to sell these vegetables in farmers’
markets so as to increase the availability. Similarly, the self-help groups may be
permitted to put up fruit stalls inside the farmers’ market so as to facilitate the
consumers to purchase fruits from farmers’ market.
C) Infrastructure
Feasibility of establishing mini cold storage facilities may be explored at least in big
markets.
Most of the farmers’ markets have fairly good arrangements for disposal of
vegetable wastes. This should be made more systematic and productive.
D) Administration and management of the market
Allowing retail vegetable traders to buy vegetables in large quantities from the
farmers’ market is one of the contentious issues facing the farmers’ market. While
farmers strongly support the purchase by retailers, consumers report that they are
deprived of important vegetables especially during lean seasons. A careful
consideration of the problems faced by both the farmers and consumers leads us to
the conclusion that the retail traders may be allowed to purchase from the farmers’
market. However, considering the interests of the consumers buying from the
farmers’ market, it is necessary to regulate the entry of retail traders by issuing entry
permit cards and they may be allowed on alternate days on rotation basis. During
lean seasons for important vegetables such as tomato and onion, a strict vigil should
be maintained to ration the purchase of these vegetables by the retail traders in bulk
quantities.
Morning and evening markets by introducing rotational system of card distribution
to the farmers. The farmers who are selling in the morning during odd month shall
be permitted for evening sales during even months and vice versa. This will the
farmers’ market accommodate more farmers and attract more consumers who are
used to the habit of purchasing vegetables in the evening.
Bulk consumers of vegetable such as college hostels, canteens, hospitals, jails, etc
may be encouraged to purchase vegetables from the farmers’ markets.

187
3.4 Market intermediaries and their functions
Delivery options to farmer producers
Direct selling to consumers: Direct selling to consumers is mainly through weekly
shanties. Most of the producers who cultivate small areas under assorted vegetables
prefer selling their produce through weekly shanties. They visit more than one local
shanty a week, depending on harvest. Area limitations is due to many reasons, the more
important being water availability, plant protection needs and labour availability. Selling
to merchants (At the farm level, at shanties)
Selling to retailers: If the volume is high, some producers prefer selling wholesale to
local retailers and assemblers in weekly shanties. Farm level sales to local retailers and
merchants are done in some cases.
Selling to wholesalers: In areas where vegetable cultivation is intensive and
concentrated, wholesale markets and commission mandies develop. Farmers dispose
their produce mostly through auction in such centres. Running accounts are maintained
with the commission agents and settlements are done on a continuing basis. Yet formal
supply contracts are rare in commonly cultivated vegetables.
Contract supply: These exist mostly with reference to special crops like medicinal
plants or when the production is on a large scale. In such cases the counter party is
usually a corporate or established processor or exporter. Mostly contracts are informal
and production risks are borne by the producers. Marginal market risk protection exists
in some cases.
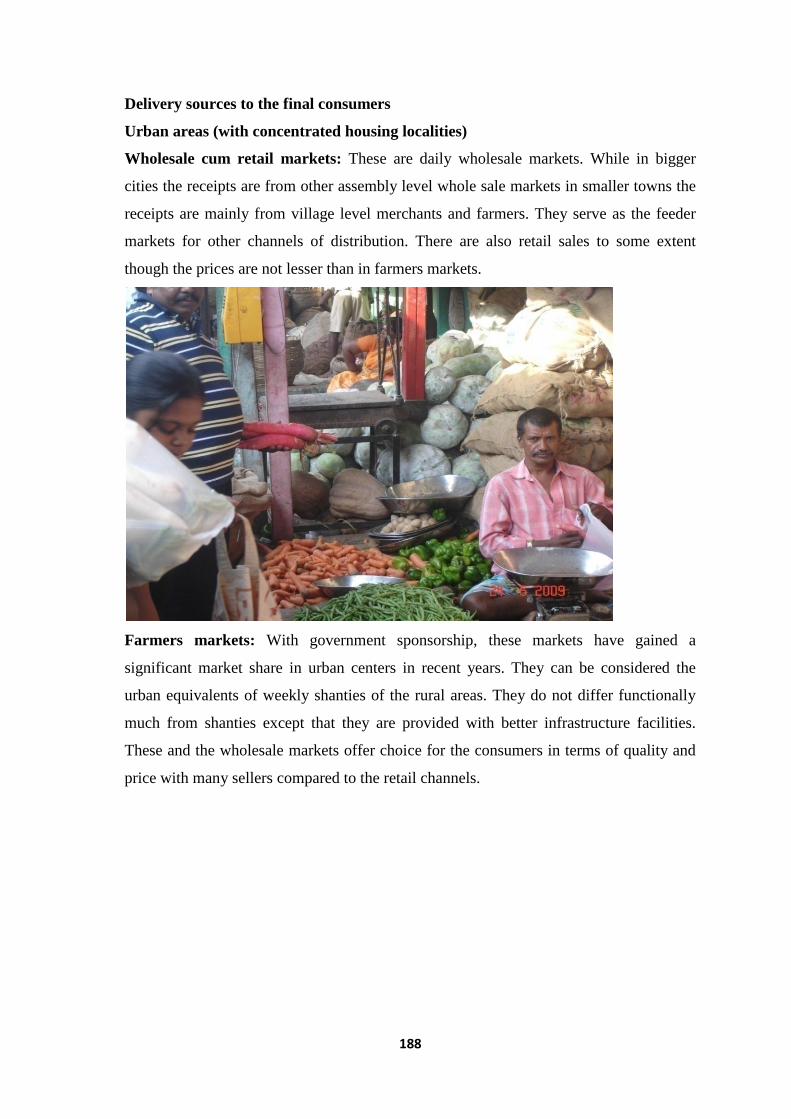
188
Delivery sources to the final consumers
Urban areas (with concentrated housing localities)
Wholesale cum retail markets: These are daily wholesale markets. While in bigger
cities the receipts are from other assembly level whole sale markets in smaller towns the
receipts are mainly from village level merchants and farmers. They serve as the feeder
markets for other channels of distribution. There are also retail sales to some extent
though the prices are not lesser than in farmers markets.
Farmers markets: With government sponsorship, these markets have gained a
significant market share in urban centers in recent years. They can be considered the
urban equivalents of weekly shanties of the rural areas. They do not differ functionally
much from shanties except that they are provided with better infrastructure facilities.
These and the wholesale markets offer choice for the consumers in terms of quality and
price with many sellers compared to the retail channels.

189
Special vegetable and fruit retail stores: These are concentrated more in cities with
higher population and better standards of living. They offer value for money and
concentrate on branding and quality. Often, like corporate retails they enter into contracts
with potential suppliers; both from big farmer producers and agents from other
assembling markets. These are major sources of fruits supply to consumers compared to
vegetables.
Corporate retail stores: These, like special purpose vegetable and fruit outlets,
concentrate on branding and quality and source mainly from contract suppliers. Initially
many corporate retails evinced keen interest in specialized dealing of fruits and
vegetables. Many of them have diversified into general purpose retailing. They follow a
top down approach to market penetration starting from big cities and moving down to

190
tier II and III cities. Of late there is said to be some stagnation in their branch expansions
as they find it difficult to match the local shops in lower order cities.
General purpose retail stores: They are ubiquitous and are the most common suppliers
of the immediate needs of the consumers. They offer convenience and nearness. Almost
every retail store also offers some vegetables of daily use. Fruit supply though is
insignificant compared to vegetables. They are the most common outlets for satisfying
daily needs of urgently needed vegetable ingredients. Many of them establish customer
relationships in the neighbourhood and sometimes provide vegetables and other items on
loans. These stores procure the vegetables from nearby wholesale markets and sell by
marking up the prices by 20 to 25 percent. These units have to take the risk of losses in
case the vegetables are not disposed off in time and get spoiled. They can be considered
the micro market makers for the vegetables.

191
Push cart vendors: Prices of vegetables supplied by these sources are usually costlier
than from other sources. But they offer convenience of purchase at the doorstep and is
useful to those who cannot travel to other supply sources. These vendors mostly
concentrate on one or few vegetable(s) or fruit. They also concentrate on seasonally
available vegetables. The rates at which they sell the produce is comparatively higher
than those prevailing at retail stores by about 15 to 20 per cent. In many cases the traders
rent the push carts and get small loans on discount basis to procure the produce in the
early morning and settle the rents and loans by end of the day.
Head load/cycle vendors: They are similar to push cart vendors, operating with still
lesser volumes. The persons involved are usually those who want to make a living out of
it. Rates are similar to those of the cycle and push cart vendors.

192
Rural areas
Weekly shanties: These are the primary source of delivery of vegetables and fruits to
consumers in the rural areas. Unlike in other delivery channels these are loose
congregations of buyers and sellers coming together on a particular day of a week at a
specific place. Locations are historical, decided mostly on population. Every hamlet has
the option of participating in more than one such shanty around its perimeter and thereby
offers scope for choice. Most of the delivery is direct from producer to consumers though
the shanties also serve as assembly lines for wholesale markets. Famers sell either
directly to consumers or to retail merchants who buy in bulk and deliver to consumers.
These shanties can be considered as the model on which the uzhavar shanties of the
State.

193
Local general purpose retail stores: These are similar to their urban counterparts albeit
in a smaller scale.
Neighbourhood purchases (cash/barter): This cannot be considered as marketing
proper. Yet there are some minor farm level direct sales to local consumers. Barter
exchanges are common among neighbourhood farmer producers and consumers
3.5 Marketing channels
Urinal marketing channels
The Different channels in Brinjal marketing are
Ch1: Farmer Commission Mandi Wholesaler Retailer Consumer
Ch2: Farmer Commission Mandi Retailer Consumer
Ch3: Farmer Traders Commission Mandi Corporate Retailer Consumer
Ch4: Farmer Retailer Consumer
Ch5: Farmer Consumer
%The Niligiris Cooperative Marketing Society (NCMS) through which most of the Ooty
produce is routed to wholesalers from different cities is located in Mettupalayam. The
market channels for potato are
Ch1: Farmer NCMS Wholesaler Retailer Consumer
Ch2: Farmer Commission mandi Wholesaler Retailer Consumer
Ch3: Farmer Retailer Consumer
Ch4: Farmer Consumer

194
Tapioca
Unlike other vegetable crops tapioca produce goes for processing and industrial use
almost entirely. The processing units procure the produce directly from producers or
using their agents. Once processed the final produce is disposed off for industrial and
commercial use through SagoServe and wholesalers in commercial channels. Very small
quantities of the produce are sold for direct consumption be consumers. The marketing
channels identified for tapioca are
Ch1: Farmer ProcessorSagoserve Wholesaler……
Ch2: Farmer Retailer Consumer
Ch3: Farmer Consumer
Gherkin
Gherkin is produced completely under contract forming with the processors undertaking
to supply inputs and purchase the produce from the farmers. After minimal processing
the entire produce is exported by the processors to international destinations and there
are no domestic distribution channels.
Marketing cost
Table 6. Marketing Cost and per cent to consumer price for Brinjal and Potato
(Rs/Q)
Brinjal Potato
Item Cost % Item Cost %
Marketing cost Marketing cost
Producer 110 5.00 Producer 120 4.84
Wholesaler 125 5.68 Wholesaler 125 5.04
Retailers 160 7.27 Retailers 150 6.05
Total marketing cost 395 17.95 Total marketing cost 395 15.93
Marketing margin Marketing margin
Wholesaler 85 3.86 Wholesaler 115 4.63
Retailer 120 5.46 Retailer 160 6.45
Total marketing margin 205
9.18 Total marketing
margin 275
11.09
Consumer price 2200 100.00 Consumer price 2480 100.00
Marketing costs were incurred by producers and market intermediaries that included
packing, transport, weighing, market fees, loading and unloading etc. Besides, each

195
intermediary also received remuneration for the services rendered by them in the form of
market margins. The market charges and margins for the producers and intermediaries
for brinjal and potato that have similar marketing structure are presented in table 14. It is
seen that in the major channel the marketing costs account for about 16-18 per cent and
margins for the intermediaries for about 10 per cent. Thus the farmers receive about 70
to 75 per cent of the consumer price in normal circumstances.
The marketing costs for tapioca account for about 30 (refer table 20) rupees per quintal
which includes mainly harvesting and transportation to the processing units and are
usually paid by the processors and deducted from the money payable to the farmers. In
case of the small quantity distributed for direct consumption by consumers an additional
marketing cost of R.35 per quintal is incurred in terms of loading and unloading charges
and market fees. When the processors sell their final produce through the SagoServe they
get the following services and incur connected expenditures.
Tapioca marketing charges at Sagoserve
For the various services rendered to the members and the traders the society
charges the following.
(1) Godown Service charges from the member-producers: @ 0.75% on Sale
value with effect from 1-11-2006.
(2) Service charges from the buyers:
@ 0.38% on TNGST Sales turnover and eST Sales turnover.
(3) Interest:
(a) Members:
@ 12.25% on the advance (From 01-09-2008)
(b) Merchants:
@ 17% from 6th
day onwards to so" day with effect from 1-1-2005.
(4) Godown rent:
(a) Members
(per bag/week
No. of bags contained Up to one year Over one year Above two
in a lot and upto 2 years years 1 to 100 bags 1.25 1.50 2.00
101 bags and above 1.00 1.25 1.75

196
(b) Merchants 16paiselbag/day
(from 6th
day t030th day)
26 paiselbag/day
(from 31st day onwards)
(5) Insurance:
Members Re.1/bag
(5) Weighbridge charges:
Members 40 paise/bag
3.6 Marketing cost in different channels
Tables 7 to 9 provide an account of the marketing costs associated with different
channels of the selected vegetables brinjal, potato and tapioca respectively. Marketing
costs represent averages of the sample data and are expressed per quintal of the produce.
Costs have been worked out for the major channels including intermediaries undertaking
the major functions of assembling, transportation and distribution. Most of the marketing
expenses are borne by the producers, wholesalers, and retailers. Others like agents,
commission agents and institutions like NCMS, SagoServe provide services which are
directly charged to any of the above intermediaries. For instance, commission charges
for mandies, unloading and market charges at such places are borne by the producers.
Accordingly the market channels for calculation market cost purposed have been
grouped under the major channels ProducersWholesalersRetailersConsumers.
As can be seen from tables 15, 16 and 17 the market charges as a whole increased with
more intermediaries. In channels where commission agents, wholesalers and retailers are
involved producers received approximately 70 per cent of the consumer rupee in brinjal
and potato. When the produce moved from producers to consumers through retailers
without the services of wholesalers producer share in consumer improved to about 80-85
per cent. Finally when the produce moved directly to consumers from producers received
highest share of about 90-95 per cent. Such computations of producer share in consumer
rupee have not been feasible in gherkins since it is an exported vegetable.

197
Table 7. Marketing cost for Brinjal (Rs/qtl)
Particulars P-W-R-C P-R-C P-C
Producers price 1600 1600 1800
Packing 20 15 25
Transport 50 60 110
Loading &unloading 15 15 15
Weighing 15 10 15
Market fee 10 15 15
SUB TOTAL 110 115 180
Wholesaler purchase price 1710 1980
Packing 25
Transport 55
Loading &unloading 20
Weighing 20
Market fee 5
SUB TOTAL 125
Retailer purchase price 1920 1715
Packing 25 20
Transport 70 65
Loading &unloading 25 10
Weighing 25 15
Market fee 15 20
SUB TOTAL 160 130
Consumer purchase price 2200 2000 1980
Producer share in consumer rupee 72.70% 80.00% 90.90%

198
Table 8. Marketing cost for Potato (Rs/qtl)
Particulars P-W-R-C P-R-C P-C
Producers price 1810 2000 2200
Packing 20 20 25
Transport 60 65 120
Loading &unloading 15 15 20
Weighing 10 10 15
Market fee 15 15 10
SUB TOTAL 120 125 190
Producers gross price 1930 2125 2390
Wholesaler purchase price 1930
Packing 20
Transport 65
Loading &unloading 10
Weighing 10
Market fee 20
SUB TOTAL 125
Retailer purchase price 2170 2125
Packing 15 20
Transport 70 65
Loading &unloading 25 10
Weighing 25 15
Market fee 15 20
SUB TOTAL 150 130
Consumer purchase price 2480 2340 2390
Producer share in consumer rupee 72.98% 85.47% 92.05%
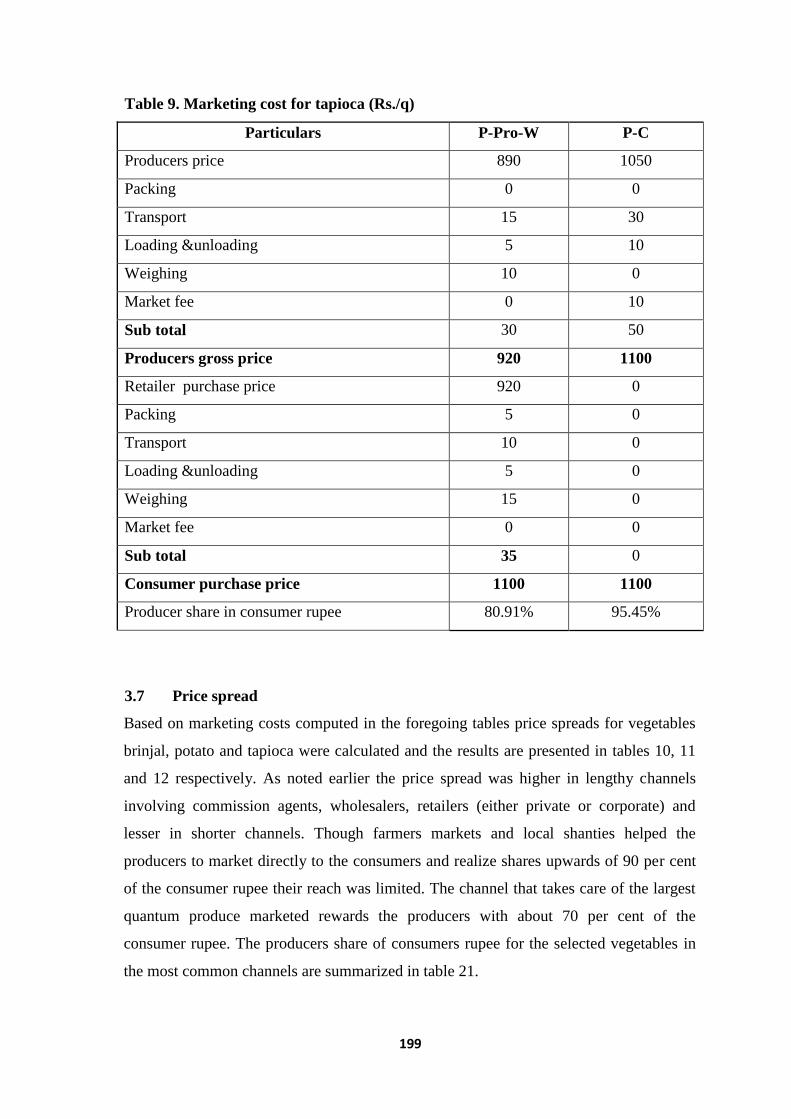
199
Table 9. Marketing cost for tapioca (Rs./q)
Particulars P-Pro-W P-C
Producers price 890 1050
Packing 0 0
Transport 15 30
Loading &unloading 5 10
Weighing 10 0
Market fee 0 10
Sub total 30 50
Producers gross price 920 1100
Retailer purchase price 920 0
Packing 5 0
Transport 10 0
Loading &unloading 5 0
Weighing 15 0
Market fee 0 0
Sub total 35 0
Consumer purchase price 1100 1100
Producer share in consumer rupee 80.91% 95.45%
3.7 Price spread
Based on marketing costs computed in the foregoing tables price spreads for vegetables
brinjal, potato and tapioca were calculated and the results are presented in tables 10, 11
and 12 respectively. As noted earlier the price spread was higher in lengthy channels
involving commission agents, wholesalers, retailers (either private or corporate) and
lesser in shorter channels. Though farmers markets and local shanties helped the
producers to market directly to the consumers and realize shares upwards of 90 per cent
of the consumer rupee their reach was limited. The channel that takes care of the largest
quantum produce marketed rewards the producers with about 70 per cent of the
consumer rupee. The producers share of consumers rupee for the selected vegetables in
the most common channels are summarized in table 21.

200
Table 10. Price spread for Brinjal (Rs./q)
Particulars P-W-R-C P-R-C P-C
Producer sale price 1600 1600 1800
Market cost 110 115 180
Producers gross price 1710 1715 1980
Wholesaler Purchase price 1710
Marketing cost 125
Market margin 85
Retailer Purchase price 1920 1715
Marketing cost 160 130
Market margin 120 155
Consumer purchase price 2200 2000 1980
Producer share in consumer rupee 72.70% 80.00% 90.90%
Table 11. Price spread for Potato (Rs./q)
Particulars P-W-R-C P-R-C P-C
Producer sale price 1810 2000 2200
Market cost 120 125 190
Producers gross price 1930 2125 2390
Wholesaler Purchase price 1930
Marketing cost 125
Market margin 115
Retailer Purchase price 2170 2125
Marketing cost 150 130
Market margin 160 85
Consumer purchase price 2480 2340 2390
Producer share in consumer rupee 72.98% 85.47% 92.05%
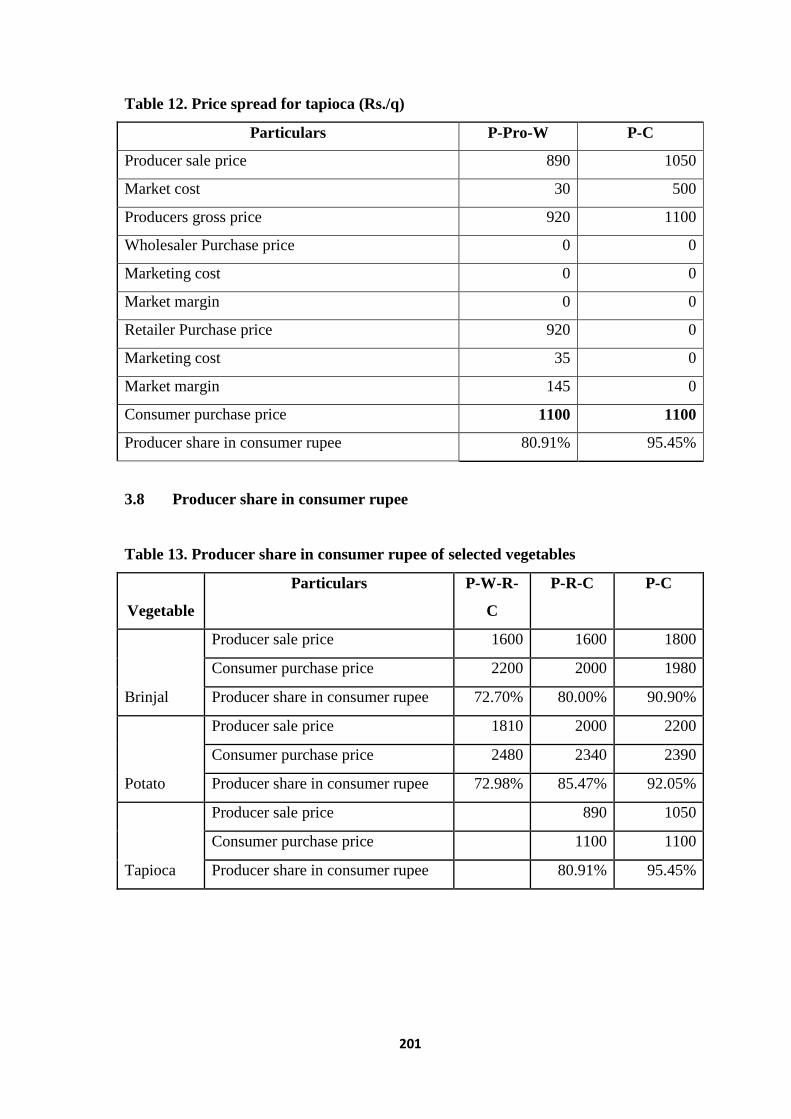
201
Table 12. Price spread for tapioca (Rs./q)
Particulars P-Pro-W P-C
Producer sale price 890 1050
Market cost 30 500
Producers gross price 920 1100
Wholesaler Purchase price 0 0
Marketing cost 0 0
Market margin 0 0
Retailer Purchase price 920 0
Marketing cost 35 0
Market margin 145 0
Consumer purchase price 1100 1100
Producer share in consumer rupee 80.91% 95.45%
3.8 Producer share in consumer rupee
Table 13. Producer share in consumer rupee of selected vegetables
Vegetable
Particulars P-W-R-
C
P-R-C P-C
Brinjal
Producer sale price 1600 1600 1800
Consumer purchase price 2200 2000 1980
Producer share in consumer rupee 72.70% 80.00% 90.90%
Potato
Producer sale price 1810 2000 2200
Consumer purchase price 2480 2340 2390
Producer share in consumer rupee 72.98% 85.47% 92.05%
Tapioca
Producer sale price 890 1050
Consumer purchase price 1100 1100
Producer share in consumer rupee 80.91% 95.45%

202
3.9 Marketing Efficiency
Marketing efficiency measures indicate how efficiently the produce is marketed in a
given channel. The results of market efficiencies calculated conventionally as a ratio
between value addition by the market system and consumers/retailers price, following
Shepered’s Method and Acharya’s modified marketing efficiency methods are presented
in subsequent tables.
Tables 14 and 15 present the marketing efficiency ratios of marketing channels of
brinjal. As per Shepered ratio market efficiency improves from about 5.5 in the most
common channel to 8.1 in case of producer, retailer and consumer channel to 11 when
the produce is directly marketed to consumers. Similar results are observed based on
Acharya’s ratio where the ratio starts with 2.67, improving to 4 and finally to 10.
Conventional method indicates the cost effectiveness of the channels and indicates
strength with declining ratios. In case of brinjal the ratio was 1.24 for P-W-R-C channel
which reduces to 1.16 in P-R-C channel and finally to one in case of direct marketing to
consumer.
Table 14. Measurement of Marketing Efficiency of Brinjal (Rs./q)
S.No. Particulars P-W-R-C P-R-C P-C
1 Retailer’s sale price (RP) 2200 2000 1980
2 Total marketing costs (MC) 395 245 180
3 Total margins of intermediaries (MM) 205 155 0
4 Price received by farmer (FP) 1600 1600 1800
5 Value added by the marketing system (1-4) 490 285 180
Table 15. Index of Marketing Efficiency of Brinjal
Conventional method (E) (5/2) Ratio 1.24 1.16 1.00
Shephered’s method (ME) (1/2) Ratio 5.57 8.16 11.00
Acharya’s method (MME)[4 / (2+3)] Ratio 2.67 4.00 10.00
Tables 16 and 17 present the marketing efficiency ratios of marketing channels of potato.
As per Shepered ratio market efficiency improves from about 6.3 in the most common
channel to 9.2 in case of producer, retailer and consumer channel to 14.5 when the
produce is directly marketed to consumers. Similar results are observed based on
Acharya’s ratio where the ratio starts with 2.7, improving to 6.3 and finally to 14.3.

203
Conventional method indicates that the ratio was 0.91 for P-W-R-C channel which
reduces to 0.84 in P-R-C channel and finally to 0.15 in case of direct marketing to
consumer.
Table 16. Measurement of Marketing Efficiency of Potato (Rs./q)
S.No. Particulars P-W-R-C P-R-C P-C
1 Retailer’s sale price (RP) 2480 2340 2390
2 Total marketing costs (MC) 395 255 165
3 Total margins of intermediaries (MM) 275 85 0
4 Price received by farmer (FP) 1810 2125 2365
5 Value added by the marketing system (1-4) 360 215 25
Table 17. Index of Marketing Efficiency of Potato
Conventional method (E) (5/2) 0.91 0.84 0.15
Shephered’s method (ME) (1/2) 6.28 9.18 14.48
Acharya’s method (MME)[4 / (2+3)] 2.70 6.25 14.33
Tables 18 and 19 present the marketing efficiency ratios of the two marketing channels
of tapioca for direct consumptions. As per Shepered ratio market efficiency improves
from about 16.92 in the P-R-C channel to 22 when the produce is directly marketed to
consumers. Similar results are observed based on Acharya’s ratio where the ratio starts
with 4.38 and improving to 22. Conventional method indicates that the ratio was 2.77 for
P-R-C channel which reduces to one in P-C channel.
Table 18. Measurement of Marketing Efficiency of tapioca (Rs./q)
S.No. Particulars P-R-C P-C
1 Retailer’s sale price (RP) 1100 1100
2 Total marketing costs (MC) 65 50
3 Total margins of intermediaries (MM) 145 0
4 Price received by farmer (FP) 920 1050
5 Value added by the marketing system (1-4) 180 50

204
Table 19. Index of Marketing Efficiency of tapioca
Conventional method (E) (5/2) 2.77 1.00
Shephered’s method (ME) (1/2) 16.92 22.00
Acharya’s method (MME)[4 / (2+3)] 4.38 21.00
Constraints perceived by various stake holders
Qualitative questions were asked to assess the perception of the producers and market
intermediaries about market constraints and analyzed using Garrett ranking method. The
results are presented in tables 20 and 21 below.
Table 20.Constraints perceived by the farmers, wholesalers and retailers in
marketing Brinjal
Constraints Farmer Wholesalers Retailers
Forced to sell to pre-harvest contractor 7 8 11
Non-availability of marketing credit 8 9 6
Faulty weighment 5 7 5
Very high commission rates 9 10 7
Commission charged more than once 10 6 8
Malpractices in auction 4 5 4
Presence of exploitative middlemen 6 3 9
High market fee 11 11 10
Inadequate competition at the market 3 1 3
Inadequate facilities at the market 2 2 2
No storage facility 1 4 1
No facilities for personal stay at the market 12 12 12

205
Table 21. Constraints perceived by the farmers, wholesalers and retailers in
marketing Potato
Constraints Farmer Wholesalers Retailers
Forced to sell to pre-harvest contractor 6 7 12
Non-availability of marketing credit 9 8 6
Faulty weighment 3 9 5
Very high commission rates 8 11 8
Commission charged more than once 10 6 7
Malpractices in auction 4 5 4
Presence of exploitative middlemen 7 3 9
High market fee 11 10 10
Inadequate competition at the market 5 1 1
Inadequate facilities at the market 1 2 2
No storage facility 2 4 3
No facilities for personal stay at the market 12 12 11
3.10 Factors influencing participation in gherkin contract farming
Factors affecting marketing cost, margin and efficiency
Results of probit model
The factors determining the participation of farmers in the contract farming were
analyzed using probit function. Independent variables specified were age, farmsize,
education, environment, debt, net income and percentage of villagers growing gherkins.
Data were analyzed using the Limdep 7.0 package and the results are presented in Table
22.The results of the Probit model indicated that age, farm size, net income and debt
were significantly influencing the farmers’ participation in contract farming. Age and
farm size had negative coefficients. As the age of the farmers increased by one per cent,
the probability of participation of farmers in contract farming decreased by 0.05 per cent.
It indicated that aged farmers were less likely to participate in contract farming.
Similarly when farm size of farmers is increased by one percent, the probability of
participation is decreased by 0.30 per cent which indicated that marginal farmers were
likely to participate in contract farming. The variables debt and net income were positive
and significantly influencing the participation. If indebtedness of the farmer increased by
one per cent, the probability of participation in contract farming increased by 0.01 per

206
cent. This indicated that as the debt of farmer increased participation in contract farming
also would increase. If net income increased by one per cent the probability of
participation in contract farming would increase by 0.01 per cent.
Table 22 Results of Probit Model
Note: *** - Significant at one percent and NS- Non-significant
S.no. Regression
Coefficients Probability
1 Constant 1.46 0.07
2 Age (in years) X1 -0.05*** 0.01
3 Farmsize (in ha) X2 -0.30*** 0.00
4. Education (in level)X3 0.089 NS
0.37
5. Environment X4 -0.03NS
0.92
6. Debt(in Rs.) X5 0.01*** 0.00
7. Net income(in Rs.) X6 0.01*** 0.04
8. % of villagers growing
X7 0.01 0.84
207
4. Conclusions and policy implications
Marketing of vegetables in the state, as in other parts of the country, is highly
unorganized. The losses in the marketing chain have been estimated in excess of 30
percent for fruits and vegetables. Moreover, because of several government restrictions,
the agro-processing industry continues to be inefficient, resulting in considerable losses
that adversely affect farmers and consumers. The institutional interventions in marketing
by the governments in the form of cooperatives and regulated markets have made little
impact except in few cases. Price interventions such as minimum support prices and
government procurement in some commodities have not solved the complex web
problems plaguing the marketing. There is a lot of scope for further revamping the
marketing system.
Minimizing marketing costs, improving overall marketing efficiency, minimizing post-
harvest losses, and ensuring remunerative price to farmers with minimal price risk are
some of the areas which should receive priority in future. In the context of liberalization
and globalization with marketing sector being increasingly freed up for foreign
investments domestic farmers and market intermediaries with little market power need to
be protected.
Vegetable marketing suffers from production uncertainties. Most of the production and
marketing problems could be traced to the small scale nature of production. Compared to
agricultural commodities vegetables require intensive applications of resources
especially plant protection chemicals and fertilizers that small farmers could not afford.
Besides vegetable crops are also labour intensive. Thus labour, water and capital all act
as limiting factors in the scale of production. With their scale of operation compromised
farmers could not ensure production in volumes and of uniform quality standards.
Production also critically depends on seasons and with limited scales of operation
farmers could not plan their produce as per market conditions. Staggering production
requires controlled production environments in the form of green and poly houses which
the small producers cannot afford. Coupled with lack of market intelligence, these
production cycles invariably lead to wider price fluctuations that further erode the
income levels realized by the vegetable producers.
Controlling the number of middlemen in the hope that part of the margins cornered by
the middlemen eliminated from the system could be shared between both the producers
and consumers has been a major theme of marketing reform debates in India with little

208
tangible outcomes. Regulated markets, producer and product market cooperatives have
been promoted over decades to achieve the objective of reducing the market channel
length and these have not met with much success especially in the case of vegetables.
Cooperation by nature requires a degree of homogeneity among those come under its
umbrella. Vegetable producers lack that homogeneity in various ways; in terms of their
resource endowments, scales of operation and more importantly in terms of consistency
in their production process. Farmers invariably do not specialize in growing specific
crops and diversify. There are several reasons other than those related to marketing and
this diversity precludes their commitment to specific product cooperatives. This has been
evidenced in case of potato marketing through NCMS and tapioca marketing through
SagoServe. In both cases commission mandies whom these institutions were supposed to
have substituted, are equally active and in the same locations.
While the scale of operation precludes farmers functioning as assemblers with facilities
to store and process their produce, private corporate investments are perceived to be a
viable option to create such facilities. Entry of corporate retails was expected to reduce
the number of middlemen since they could integrate market functions through their own
supply chain networks. It was also expected that they would promote contract farming
with financial, technical and market support. Market awareness thus was expected to
percolate to producer levels through these private operators helping the producers to
improve the quality of the produce.
Experience in the state so far indicates that these hopes are yet to materialize. Though
many corporate retails entered the market around 2005, with hopes of specializing in
fresh fruits and vegetables, sourcing the produce from farmers, they have gradually
began to diversify into general merchandise. To the extent they deal in vegetables they
source them from commission agents. This has been necessitated by the fact that
corporate sponsored contract farming to succeed needs a double coincidence of interests
that is lacking in practice. Farmers expect all their produce with their quality differences
be bought by the contractor. With their miniscule scales of operation they find it difficult
to dispose of their substandard produce not procured by the contractor. Contractor on the
other hand need bulk supply of produce as per their standards which individual producers
will not be able to supply. Thus both the farmers and corporate have now turned to
utilize the services of the commission agents and wholesalers. Corporate retails thus have
now become one more category of retailers catering to specific segments of the market
rather than replacing any of the existing players.

209
Contract farming, seems to have some success in vegetables that have concentrated
buying by few firms that use them for value addition and are export. Gherkins in Tamil
Nadu are an example where the private firms have played a major role in promoting the
crop and technology by providing inputs and buying back the produce. Here again the
system is not perfect to the extent of protecting the farmers from either production are
price risks. Real competition in fixing prices is a question mark when there are few firms
operating in a given crop.
Lessons from the study of the vegetables brinjal, potato, tapioca and gherkins indicate
that marketing issues are larger than mere reduction in the number of middlemen or
promoting adhoc measures. Number of tapioca processing industries in Salem District
are said to be declining in number due to gradual reduction in area under tapioca
cultivation in surrounding districts. Similarly, gherkins processors have been facing
major problems since the economic decline in the west which are the major importing
countries. On the contrary, brinjal and potato farmers have been reaping greater benefits
in recent year due to escalating vegetable prices. Similar increases in market prices have
been observed for commonly consumed vegetables.
Discussion with stakeholders and experts bring out the opinion that demand for
vegetables has been tremendously increasing in the recent years due to the increasing
purchasing power. On the other hand more and more people are moving out of
agriculture since they feel it as an un remunerative occupation and scarcity pressures of
labour and water are mounting leading to reduction or atleast no increase in production
of vegetable crops. These observations indicate that market issues are dynamic and one
has to be alive to emerging trends and there cannot be one solution fitting all
contingencies. Private vegetable seed producers seem to have been alive to the emerging
changes and have been trying to come out with varieties that would yield well over
extended periods for the markets. This is especially so in brinjal a vegetable covered in
the study. Similar is the case with gherkin where a single foreign company dominates the
seed industry.
Results presented in the study indicate that in the most common marketing channels for
the studied vegetables the marketing cost was a reasonable 15 per cent of the consumer
price and marketing margins of the intermediaries constituted again a reasonable 10 per
cent. Producers get about 75 per cent of the consumer rupee. However, problems arise to
the producers mostly because of the wider price fluctuations due to production cycles.
While production and marketing costs for the farmers remain fixed, abnormal down

210
trends in prices inflicts heavy damages in terms of income loss for them. Market
intermediaries only suffer loss of turnover with their margins and fees fixed. With these
observations some policy implications can be drawn as follows:
Producer empowerment through consolidation and ramping up of scale of
vegetable production is a prerequisite for market stabilization.
Spreading the supply temporally is the most effective way for stabilizing prices
and producer’s income besides protecting consumer interests. This may have to
happen through technology to extend production periods, production under
controlled environments and improving storage facilities. These however,
warrant a look at previous point.
Corporate investments and retail may eventually rise to dominant positions; but
as of now they are one more addition to the intermediary list, neither minimizing
nor enlarging price and production risks
Corporate sourcing may be encouraged to be tied up with cooperative institutions
like NCMS, SagoSere wherever possible.
Contract farming is a viable option to reduce middlemen provided efforts are
made to match both producer and buyer expectations. They need to be put into an
effective competitive market framework.
Storage and processing infrastructure is to be necessarily ramped up as part of
market stabilization efforts with local planning inputs and private partnership
wherever necessary.
5) References
Action Plan for Tamil Nadu National Horticulture Mission Prepared by Rabo India
Finance Pvt. Ltd for Ministry of Agriculture Government of India September
2005
Birari K.S., D.S. Navadkar and J.T. Dorge “Marketing Efficiency of Cole Vegetables in
Western Maharashtra” Agricultural Marketing VOL.-XLVII, No.:3 pp23-28
Chennai, Martketing of Fruits and Vegetables in and Around Chennai, Research Study
No.130, Agro Economic Research Centre, University of madras, 2002-03,
Coimbatore -3 August, 2006

211
Farmers’ Market in Tamil Nadu – An Assessment of Current Performance and Potentials
for Future Expansion, Research report of the Department of Agricultural
Economics Tamil Nadu Agricultural University
Gangwar L.S., Dinesh Singh and D.B. Singh “Estimation of Post-Harvest Losses in
Kinnow Mandarin in Punjab Using a Modified Formula” Agricultural Economics
Research Review July-December 2007 Vol. 20 pp 315-331
Kusum Jain, Umesh Kumar Sharma, R. S. Kadian, R. K. Malik and S.L. Bhella. 2008.
Direct Marketing. Technical Bulletin (27), Directorate of Extension Education,
CCS Haryana Agricultural University, Hisar, India.
Rengasamy S, J Devavaram, T Marirajan, N Ramavel, K Rajadurai, M Karunanidhi, N
Rajendra Prasad and A Erskine “Farmers’ markets in Tamil Nadu: increasing
options for rural producers, improving access for urban consumers” Environment
and Urbanization 2003; 15; 25
Season and Crop Report, Department of Economics and Statistics,Government of Tamil
Nadu, 2005-06
Shamsher Singh and S.K. Chauhan “Marketing of Vegetables in Himachal Pradesh”
Agricultural Marketing VOL.-XLVII, No.:3 pp5-10
Srinivas T., M.Anantharaman Cassava Marketing System in India, Technical Bulletin
Series: 43 CTCRI (ICAR), Kerala, India, December, 2005
Sudhandhiran C, The Sago & Starch Industry Cluster Salem (Tamil Nadu), SME
Diagnostic Study developed under the Cluster Development Agent Training
Programme, Organised By Unido Cdp, New Delhi & (Edii), Ahmedabad 2001
Viswanadham N, Food and Retail Chains in India, ISAS Working Paper No. 15 –
October 2006.

212
Estimating Marketing Efficiency of Major
Horticultural Commodities in Coastal districts of West
Bengal
submitted by
Subhbasis Mandal
S K Sarangi
Dhiman Burman
B. K. Bandyopadhyay
Central Soil Salinity Research Station (CSSRI)
Regional Research Station (RRS)
Canning Town – 743 329 (WB)

213
Acknowledgement
We are thankful to the farmers, middlemen and various market functionaries who have shared
information on marketing of agricultural commodities in West Bengal. We are thankful to
various members of market committee for sharing their experience, views, concern and
suggestions of existing marketing systems operating in West Bengal. Sincere thanks are due for
various management personnel of corporate retailer who have shared their experience and views
while during personal discussion. We are highly thankful to various state government officials
and staff members for extending their generous help and cooperation during data collection for
this project. Special thanks are due for Nilanjan, Anirban, Ranjit and Barik for sincere work
under this project while data collection, data entry and data compilation. Finally, we are
extremely thankful to NCAP, New Delhi for funding this research project under the project titled
‘Estimating Marketing Efficiency of Major Horticultural Commodities in under different Supply
Chains in India’.
214
Estimating Marketing Efficiency of Major Horticultural Commodities
under different supply chains in Coastal districts of West Bengal
1. INTRODUCTION
1.1. Background
The horticulture sector plays a significant role towards sustainable rural livelihoods in all
farming systems including the marginal areas. The credibility of horticulture has been well
established in improving productivity of land, generating employment, improving economic
conditions of the farmers and entrepreneurs, enhancing exports and above all providing
nutritional security to the people. ‘West Bengal has a total geographical area of 8.88 million
hectares. The population of the state is about 8.02 crores with a population density of 904 per sq.
km. Around 30 percent of the state's income is derived from agriculture. Cropped area covers
5.47 million hectares with a cropping intensity of 174.4 percent. Only 35 percent of the 5.47
million hectares are irrigated’. West Bengal produces highest vegetables in India among all
states. During 2007-08, the state produced more than 22 million tones of vegetables. Vegetables
are grown quite extensively across all the districts but most extensively in and around the
districts of Kolkata. In the coastal areas of Sundarbans of West Bengal, the land is mostly mono-
cropped with rice during kharif season, and around 11percent of total gross cropped area is under
vegetables cultivation. Out of which brinjal, bhindi and tomato occupy a major share in cropping
pattern in this salt-affected soils. However, growing vegetables in these problematic soils are
subjected to multifarious constraints (management as well as marketing), which pose as the
major challenge to increase the area under vegetable crop in the area. Establishing and
functioning of efficient marketing system may increase the area under vegetables and may ensure
remunerative prices to the primary producers. Prevailing marketing systems of vegetables are not
well organized. Therefore, present study was undertaken to analyse the prevailing marketing
channels and the marketing efficiency therein Present study has been undertaken in three coastal
districts of West Bengal, namely, South 24 Parganas, North 24 Parganas and East Midnapore.
West Bengal’s coastal areas are situated in these three districts where growing vegetables are
gaining popularities due to the readily available market in Kolkata. More than 2.45 million
population of West Bengal is dependent on this costal area and 80 percent of which are engaged
in agriculture and rest on fisheries. However, these livelihoods options under marginal

215
environment of coastal salinity are typically charcterised with multi-faceted problems such as
low crop productivity and low returns. Growing suitable vegetables in these areas is a good
option to improve the livelihood conditions of the farmers. These districts receive substantial
rainfall during kharif season and suitable for growing a number of high-value vegetable crops
despite being primarily rainfed. Functioning of efficient marketing system is essential to increase
the area under vegetables and to ensure remunerative prices to the primary producers. Prevailing
marketing systems of vegetables are not well organized and the producers’ share in consumer
rupee is substantially low. Therefore, systematic study is essential to analyse the prevailing
marketing channels and the marketing efficiency. Agricultural marketing are now more liberated
and private players have been allowed to participate actively and several innovations and
alternative marketing systems are in place. This ongoing liberalization process and entry of
private players to agricultural marketing have made the present study quite significant from the
purview of strong opposition from within as well as opposition party in the state. The study
endevoured to analyse the functioning of these innovations/organized retail marketing and
whether there is any impact on marketing efficiency.
1.2. Policy research question
Whether or not the ongoing liberalization process in agricultural marketing system would
improve the marketing efficiency
1. Corporatization through value addition has segmented the market and hence
improved market efficiency.
2. Entry of corporate houses increases the farmers’ share in consumer rupee and
reduces their transaction cost.
3. Large farmers are taking more advantage in corporate market models.
1.3. Objectives of the study
1. To estimate the marketing cost and marketing margin of different functionaries for
selected vegetables under various supply chains
2. To analyze the price spread, marketing efficiency and farmer’s share in consumer
rupee in various supply chains
3. To identify the constraints perceived by various stakeholders; and study the factors
influencing the marketing cost, market margin and marketing efficiency
4. To suggest suitable strategies to enhance the marketing efficiency for vegetables in
west Bengal

216
2. DATA AND METHODOLOGY
2.1. Study area
Present study was based on primary data collected from sample farmers through pre-structured
and tested farm survey schedule. In some analysis relevant secondary data has also been used. In
the study area marginal farmers are the most dominant (86 percent) category of farmers, followed
by very few small farmers (12 percent). So, for data collection and analysis, no separate
classification has been made for the farmers. Study has been conducted in three coastal districts
of West Bengal, namely, South 24 Parganas, North 24 Parganas and East Midnapore.
2.2. Selection of crops
Based on the maximum area and production pattern in the study district, three vegetables, brinjal,
bhindi (ladies finger) and tomato has been selected. Similarly, among flowers, marigold was
most important and among fruits guava was most dominating crop in the study districts and
therefore, were selected for the present study.
2.3. Sampling methods
Three districts of West Bengal, namely South 24 Parganas, North 24 Parganas and East
Midnapore has been selected purposively complying with the objective of the study as
‘Estimating Marketing Efficiency of Major Horticultural Commodities in Coastal districts of
West Bengal’ Based on the importance of crops in terms of maximum area and production
pattern, 3 vegetables (brinjal, bhindi and tomato), one fruit crop (guava) and one flower
(marigold) has been selected (Table 1). Since these vegetables are widely grown in these two
districts across the blocks, therefore farmers have been selected randomly. However,
commercially, growing of guava and marigold was concentrated in few blocks of these districts
and therefore farmers were interviewed from the selected blocks only and purposive sampling
method was followed to obtain adequate number of growers. Overall the data collection on
production and marketing of these selected crops were obtained from the farmers distributed over
15 blocks of these three districts. These were, Bangaon, Baruipur, Bhangore, Budge budge,
Canning I, II & III, Contai I, II & III, Kasipara, Magrahat II, Mathurapur II, Nonakhali,
Ramnagar and Swarupnagar. To facilitate easy access for data collection, farmers were
interviewed in various market places where they visited for selling their produce frequently.
These were mainly rural or primary haat, wholesale market at block level or at wholesale market
in Kolkata. Total sample size was 385 which includes farmers (272 no) and middlemen (113 no).

217
Out of the total farmers interviewed, 115 farmers were brinjal growers, followed by bhindi, (65
farmers) tomato (53 farmers), guava (56 farmers) and marigold (35 farmers). Beside, various
wholesale markets in Kolkata, such as Nafar Babur Bazar, Math Pukur Bazar, Bantala Market
(for vegetables), Mechua Fal Patty, Baruipur Kachari Bazaar (for guava) and Mullick Ghat Ful
Bazaar (for marigold) have been surveyed in detail.
Table: 1. Sampling size and composition
Sl
no
Commodity/Item No of sample
1. No of farmers interviewed 272
2. No of middlemen interviewed 113
3. Total Sample size 385
4. Item-wise break-up
(i) Brinjal 115
(ii) Bhindi 65
(iii) Tomato 53
(iv) Guava 56
(v) Marigold 35
2.4. Units of Calculation
For computing cost, returns on operational holdings standard units have been followed for
brinjal, bhindi and tomato cultivation such as Rs/q, Rs/ha or ha (hectare) etc. But marketing
system for guava and marigold is strikingly different from the vegetables marketing. For
example guava is most commonly sold in numbers and the fruits are traded in a group of 20
numbers by farmers and further it moves for one intermediary to the next intermediaries in term
of number only. Finally, it reaches to consumer either as number or in weight basis. Thus, the
estimation of marketing cost, marketing margins etc. has been made in terms of Rs./1000 no of
fruit for guava. For marigold also the most common way of trading is though making of garlands
(around 4 ft length) and selling in a bunch of 20 such garlands (=1 kuri) together. Therefore the

218
‘unit’ for marigold trading has been considered as per 100 no of garlands’ or no of ‘kuri’ of
garlands. Purchasing and selling of guava and marigold are commonly done based on these units
i.e. 20 nos of guava or 20 nos of garland as a bunch. In various secondary sources, the unit for
guava and marigold are reported in terms of kg or in terms of number also.
2.5. Financial feasibility analysis for Guava
Guava is a plantation crop which starts bearing fruits after certain gestation period and continues
throughout its economic life. Under present analysis the economic life has been considered to be
a 10 years. After eight year of plantation guava fruiting decline steadily and beyond 10 years the
plants become non-economic and requires replacement. For analysis financial viability,
undiscounted measures, payback period and discounted measures such as Internal Rate of Return
(IRR), Net Present Value (NPV) and Benefit Cost Ratio (BCR) has been computed following the
standard methodology. For discounting, 14 percent rate has been applied which is the maximum
interest charge by the bankers for any agricultural loan in the study area and this rate is sufficient
to take care the time value of money and to cover the inflation or risk of investment during the
economic life. The financial viability analysis has been computed with the assumption of
constant prices i.e. input and output prices are expected to change in same magnitude. Other
important assumption were,
i) First year of plantation is considered to be the planning period, only initial
investment is made and no return is realized,
ii) Full benefit realized from 3rd
year onwards and fruiting declines after eighth year of
plantation and plants are required to be replaced.

219
2.6. Analytical Framework / Statistical technique
2.6.1. Factors affecting marketing efficiency
In view of analyzing various factors influencing the marketing efficiency of producers, Multiple
Linear Regression Model has been employed. Marketing efficiency for individual farmers have
been calculated as
MEi = NMMi + MCi
Where MEi = Marketing efficiency of ith farmer
NMMi = Net Marketing Margins of ith farmer
MCi = Marketing Cost incurred by ith farmer
CP = Consumers price
This marketing efficiency is expected to be affected by various factors such as total marketing
cost (incurred by different intermediaries during entire marketing channels), total marketing
margins realized by different market intermediaries, prevailing open market prices, presence of
controlling middlemen, quantity or volume handled, presence of cold storage service, length of
marketing channel, perish ability and the season of production. The Multiple Line Regression is
specified as below.
MEi = a + b1X1 + b2X2 + b3X3 + b4X4 + b5X5 + b6X6 + b7X7 + b8X8 + b9X9 + ei
Where,
a =
Constant
b1……….b9 Various regression parameters to be estimated

220
X1 Marketing cost (Rs/q) for brinjal, bhindi or tomato Rs/1000 guava or Rs/100 unit
(or kuri where 1 kuri = 20 no) of garlands of marigold.
X2 Marketing margins (units are same as mentioned in X1)
X3 Open market price (units are same as mentioned in X1)
X4 Presence of controlling middlemen, taken as a dummy variable, if present = 1, 0
otherwise
X5 Volume handled (in q for brinjal, bhindi & tomato, in numbers for guava and in
no. of garlands for marigold)
X6 Presence of clod storage service (taken as dummy variable , if present=1,0
otherwise
X7 Length of marketing channel (taken as no of middlemen or market functionaries
present in the marketing channel)
X8 Perish ability (taken as dummy variable 1= highly perishable, 0 otherwise)
X9 Summer season (taken as dummy variable, it grown in summer season = 1, 0
otherwise)
221
The marketing channels are not permanent in nature and changes across the season. Production
as well as marketing and thus marketing efficiency is also strikingly different for the
commodities grown and marketed during different season. So, the dummy variable for summer
season has been included in the regression model particularly for the vegetables (brinjal, bhindi
and tomato).
To compute the regression estimate step-wise regression analysis has been employed with large
number of independent variables and only relevant variable were retained in the estimated
regression model. Some variables were important for marketing efficiency of vegetables
marketing but the same were superfluous for functional analysis of other commodities, and those
variables were excluded from the regression model to obtain the best-fit model.
2.7. Constraints analysis through Garrett Ranking
Constraints analysis was done through computing Garrett rank for the constraints faced by
farmers as well middlemen. List of various constraints was prepared after details discussion with
the farmers and middlemen. Then farmers or middlemen were asked to assign rank to these
constraints during personal interview. Based on the rank assigned by farmers or middlemen,
constraints have been prioritized through computing Garrett rank following standard procedure
and with the help of Garrett table.

222
3. RESULTS AND DISCUSSION
3.1. Marketing of vegetables/fruits/flowers
Majority of the farmers in the study area belongs to the marginal farmers and they are
producing the selected commodities in a small scale. However, these commodities are
primarily grown for selling to the market rather for home consumption. So, the
marketable surplus of these cash crops is usually much higher than the staple crops.
Average marketable surplus has been estimated to be 90 percent fir brinjal and the same
was 81 percent for bhindi, 92 percent for tomato, 95 percent for guava and 96 percent
marigold. Almost entire produce of guava and marigold are produced to sell to the
market. The marketable surplus has been estimated after deducting the quantity
lose/damaged during harvesting or post-harvest handling.
3.2. Market intermediaries and their function
After harvesting of crops, the produce are brought in the market by farmers or the
village level traders collect the produce and used to bring in the market. First
interaction point between farmers and traders occurred at primary market or village
level market. Various primary market or ‘haat’ operates during specific time of the day
or specific time in weekly or weekly basis. Farmers sell their produce to the traders
called ‘fariah’ who are usually the first middlemen functioning in the market (Table 2).
They collect the produce from different farmers through direct bargaining from the
farmers. However most commonly farmers used to bring their produce to the
commission agent called ‘arhatdar’ in the market and they arrange the auction for
selling of the produce. After inspecting quality of produce traders (fariah) offer bidding
price and based on the maximum bid the produce is sold. Commission agent charges
for this function either through cash payment or keeping some quantity of produce
which various from produce to produce and also market to market. It has been
estimated, in terms of value the commission agent charges around 5-7 percent of the
total value of the produce sold. Key intermediate functionaries in the marketing include
farmers, village traders (fariah)/ middlemen – wholesaler – retailer and consumer.
Primary grading and standardization is done by farmers and second time the grading,
standardization is made by the traders before the produce goes to wholesale market.
Functions of various intermediaries are summarized in table below.

223
Table 2. Major market intermediaries and their key functions
Intermediaries
Primary Function
Producer Primary grading, standardization, bring produce to the market.
Middlemen
(fariah)
Collection of produce from farmers, grading, packing. Purchase
produce either directly from producer or through commission agent
(arahtdar). Also takes produce to wholesale market.
Commission
agent
Arrange interaction between farmers and traders for auction/selling
of produce.
Wholesaler Purchase produce from middlemen and sell the produce to retailer
through some person employed by him
Retailer Sells produce to consumer.
Contractor Sometime wholesaler tie up with the contractor to bring the produce
from far away/different market or sending the produce to faraway
market depending on the demand for the produce in the market
3.3. Supply chain/ marketing channel
Marketing channels are the flow of produce from producer to final consumer. No
marketing channels are permanent in nature. The agricultural commodities reach to final
consumer in various channels depending on the season and price movement in the
market. One marketing channel may be dominating in summer season and the same may

224
not be so important during winter season. For example, during summer tomato in
Kolkata market used to come from Bangalore market whereas during winter season that
supply chain become insignificant because during winter tomato is supplied by the local
farmers in West Bengal. However, based on the detail discussion with the farmers,
traders, wholesalers and contractor few important marketing channels for each selected
crops have been identified and also approximate volume of transaction has been
reported.
Brinjal and bhindi are marketed through same marketing channels, in the study area.
Marketing channels for tomato are frequently changing depending on season and local
supply. Tomato is marketed through more number of marketing channels and also
passes through more long channels as compared to other vegetables under study (brinjal
& bhindi).
Producer – Fariah (Assembler) – Wholesaler – Retailer - Consumer….55
%
Producer –Fariah (Assembler) –Retailer – Consumer ……20 %p
Producer –Retailer – Consumer
Producer – commission agents – supermarket - consumer
Producer – Fariah (Assembler) – Wholesaler – Middleman – Retailer
- Consumer
Major marketing Channel for tomato
Producer - Fariah - Wholesale market - Commision agent- Retailer –
Consumer ….10percent (during winter increases > 80 %)
Bangalore market-Wholesale market - Commission agent – Fariah - Retailer
– Consumer … 70 % (during summer only)
Bangalore market -Wholesale market – Commission agent – Retailer –
Consumer (around 5 percent)
Producer – Consumer (less than 1 percent)
Dominating marketing channels for guava is shorter in length because it has to reach to
final consumer as quick as possible after harvesting to fetch better prices. Guava looses
its flavour, vigor glossiness, freshness and taste very quickly.
225
Producer – Fariah –Wholesale fruit market (Kolkata) – Retailer– Consumer…
60%
Producer – Fariah – Wholesale fruit market (Kolkata) – Commission agent -
Retailer – Consumer …..25 %
Producer – Fariah (Assembler) – Middleman - Distant market wholesaler
(Orissa, Digha) – Retailer – Consumer
Producer – Retailer – Consumer
Producer – Commission agent – Distant market wholesaler - - Retailer –
Consumer
Like guava, marigold is also highly perishable and requires quick disposal after
harvesting. It has to reach to final consumer in quickest possible time, preferably within
a day to realize better prices. However, some good quality of marigold flowers was
being exported to distant markets like in Nepal, Bangladesh or in other states of India.
Majority of marigold and guava are marketed through wholesale marketing, Mullick
Ghat Ful Bazar, and Machna Ful Patty of Kolkata, respectively.
Producer – Fariah – Wholesaler – Retailer - Consumer (30 %)
Producer – Fariah – Wholesaler – Commission agent – Retailer – Consumer (30
%)
Producer – Fariah – Wholsaler – Retailer – Consumer (20 %)
Producer – Retailer – Consumer (less than 1 percent)
Producer – Fariah – Wholeseller – Commission agent – Distant market
wholesaler (Bihar, Orissa, Bangalore, Mumbai, Nepal, Bangladesh etc) – Retailer
– Consumer
3.4. Marketing Cost
Marketing costs are incurred by the various functionaries in the market starting from
farmers, middlemen, wholesalers and retailer. Marketing cost for farmers includes
sorting, packing (mostly packed in gunny bags or in basket) transportation and others
(eg. loading, unloading, bribing or paying fees for undisclosed reason). Marketing cost
for brinjal incurred by farmers has been calculated to be Rs. 80/q, and the same was Rs.
70/q for bhindi, Rs. 90/q for tomato, Rs. 105/ 1000 no. of guava and Rs. 110/100 no. of
garlands (Table 3).

226
Table 3. Estimation of marketing costs and marketing margin for selected
commodities
Item Brinjal Bhindi Tomato Guava Marigold
Price/Cost
(Rs/Q)
Price/Cost
(Rs/Q)
Price/Cost
(Rs/Q)
Price/Cost
(Rs/1000 no)
Price/Cost
(Rs/100 unit (kuri*)
of garlands)
Marketing cost
Producer 80 (24) 70 (21) 90 (26) 105 (25) 110 (31)
Assembler/Trader 140 (42) 145 (44) 145 (42) 205 (49) 150 (42)
Wholesaler 80 (24) 80 (24) 80 (23) 70 (17) 70 (19)
Retailers 35 (10) 35 (11) 30 (9) 35 (8) 30 (8)
Total marketing
cost
335 (100) 330 (100) 345 (100) 415 (100) 360 (100)
Marketing margin
Producer 290 (29) 188 (24) 94 (11) 463 (41) 1908 (43)
Assembler/Trader 250 (25) 200 (26) 250 (28) 275 (24) 1000 (22)
Wholesaler 200 (20) 1510 (19) 250 (28) 150 (13) 750 (17)
Retailer 250 (25) 240 (31) 300 (34) 250 (22) 800 (18)
Total marketing
margin
990 (100) 778 (100) 894 (100) 1138 (100) 4458 (100)
Note: Figures in parentheses indicates percent to respective total, 1 kuri = 20 no
Similarly, average marketing cost incurred by assembly traders or fariah has been
calculated to be Rs. 140/q for brinjal, Rs. 145/q for bhindi, Rs. 145/ for tomato Rs.
205/1000 no. of guava and Rs. 150/100 no. of garland of marigold. Wholesale
marketing cost includes cost of transportation mainly loading and unloading and the
marketing cost is Rs. 80/q for brinjal, bhindi and tomato, and Rs. 70/100 no. of guava

227
and Rs. 70/100 nos. of garlands usually the middleman brings the produce in the market
packed in large size basket or gunny bag and retailer used to purchase the commodities
directly from them in multiple of 5 kg quality (called ‘palla’). In case of transportation
distant market the produce is sent in the large size package or in boxes. But these
selected commodities all mostly traded within the local market state or nearby states only
Orisa, Jharkhand, or Bihar). Retailer’s cost of marketing cost has been calculated as Rs.
30-35/q for vegetables and Rs. 35/1000 no. of guava and Rs. 30/100 unit (kuri) of
garlands. Usually retailer purchases these commodities from their nearest wholesale
market or directly from the farmers or middlemen, thus the transportation cost is the only
cost incurred by them. Total marketing cost included by all market intermediaries/
functionaries has been calculated to be Rs. 335/q for brinjal, Rs. 330/q for bhindi, Rs.
345/1000 no. of guava and Rs. 360/100 unit (kuri) of garlands. In terms of percent share
to total marketing cost for brinjal has been estimated to be 18 percent of final consumers’
price. Similarly, for bhindi the marketing cost was calculated to be 23 percent for guava
21 percent and for marigold 5 percent to the final consumer’s price.
3.5. Marketing Margins
Marketing margins are the net profit by the market functionaries/ intermediaries and has
been calculated by deducting the marketing cost incurred by particular intermediaries
from actual price paid by him. For farmers the margin has been calculated by deducting
the production cost plus marketing cost from the price received by him.
Total marketing margin has been calculated to be Rs. 990/q for brinjal marketing, and
the same was Rs. 778/q for bhindi, Rs. 894/q for tomato, Rs. 1138/1000 no. of guava and
Rs. 4458/100 unit (kuri) of garlands (Table 4). In regards to brinjal marketing 29
percent of the total marketing margin was received by the producer followed by
Assembler (25 percent), retailer(25 percent) and wholesalers (20 percent). Under bhindi
marketing 31 percent of the total marketing margin was received by the retailer followed
by assembler (26 percent), producer (24 percent) and wholesaler (19 percent). Under
tomato marketing major marketing margin was shared by retailer (34 percent), followed
by wholesaler & assembler (28 percent) and least by the producer (11 percent), It was
the general observation for vegetables marketing that as the open market prices rises
intermediaries like wholesaler, retailer or assembler enjoyed larger marketing margins
than as compared to the producer. In other words high open market prices increases the

228
margin for all intermediaries in a greater magnitude as compared to farmers’ margins.
This situation prevails under highly price volatile market situation; such was the case of
tomato marketing during 2009. In case of guava marketing margins of producers was
accounted for 41 percent of the total market margins, followed by assembler (24
percent), retailer (22 percent) and wholesaler (13 percent).
Table 4. Details of marketing cost and marketing margins across different market
intermediaries/functionaries
Item/commodities Brinjal Bhindi Tomato Guava Marigold
Price/Cost
(Rs/Q)
Price/Cost
(Rs/Q)
Price/Cost
(Rs/Q)
Price/Cost
(Rs/1000
no)
Price/Cost
(Rs/100 unit
(kuri) of
garlands)
Production cost 530 342 316 432 2482
Farmers
+sorting 10 10 20 30 20
+packing 15 15 15 10 20
+transport 45 45 45 50 50
+others 10 10 10 15 20
Total marketing cost
(incurred by farmers)
80 70 90 105 110
Producers’ price 900 (49) 600 (41) 500 (32) 1000 (50) 4500 (62)
Producers’ Net Price 820 530 410 895 4390
Farmers’ margin 290 188 94 463 1908
Assembly traders
(Fariah or middleman)

229
+sorting 30 35 30 40 0
+packing 30 30 30 45 20
+storage 0 0 0 0 0
+transport 40 40 45 80 100
Market fee 40 40 40 40 30
Total marketing cost
(incurred by assembly
traders or fariah)
140 145 145 205 150
Marketing margin 250 200 250 275 1000
Assembly traders
selling price to
wholeseller
1290 (70) 945 (65) 895 (58) 1480 (75) 5650 (77)
Wholesalers
+transport 80 80 80 100 70
+packing 0 0 0 0 0
Total marketing cost
(incurred by wholesaler)
80 80 80 70 70
Marketing margin 200 150 250 150 750
Wholesaler price to
retailer
1570 (85) 1175 (81) 1225 (79) 1700 (86) 6470 (89)
Retailer
+transport 35 35 30 35 30
+marketing margin 250 240 300 250 800
Retailers price to 1855 (100) 1450 (100) 1555 (100) 1985 (100) 7300 (100)

230
consumer
Total marketing cost
(farmers - consumers)
335 (18) 330 (23) 345 (22) 415 (21) 360 (5)
Note: Figures in parentheses indicates percent to consumer's price (retail price), 1 kuri =
20 no.
Similarly for marigold marketing farmers’ share in total marketing margin was 43
percent and the same was 22 percent for assembler, 18 percent for retailer and 17 percent
for wholesaler. Farmers relatively receive higher marketing margins for guava and
marigold and thus the area under these crops are gradually increasing over the period of
time in the study area. However, it is to mention here that commodities with higher
market margins are also embodied with higher marketing risk particularly during the
market glut situation or when the supply increases from other places around the states or
country.
3.6. Price spread
Price spread has been calculated as the difference between the absolute prices received
by farmers and the price paid by the consumers for a particular commodity. Magnitude
of price spread among various marketing channels of same commodities indicates the
market efficiency. Higher the price spread less is the marketing efficiency. In the
present study the price spread of the selected commodities has been estimated for the
most dominating marketing channels only, thus the comparison among the price spread
under different marketing channel was not possible. For brinjal the price spread
(Consumers’ price – producers’ price) has been calculated to be Rs. 955/q, and the same
is Rs. 850/q for bhindi, Rs. 1055/q for tomato, Rs. 985/1000 no for guava, and Rs.
2800/100 unit (kuri) for marigold marketing (Table 5).

231
Table 5. Estimation of price spread of selected commodities
Item Brinjal Bhindi Tomato Guava Marigold
Producers’ price (Rs) 900 600 500 1000 4500
Consumers’ price (Rs) 1855 1450 1555 1985 7300
Price spread 955 850 26 985 2800
3.7. Producers’ share in consumer rupee
Producers share in consumers’ rupee is an important criterion to judge how efficiently
the producers are being marketed in the marketing channel. Higher is the producer’s
share in the consumers’ price implied higher is the market efficiency. Under the present
study, in case of brinjal the producers’ share in the consumers’ price was estimated to be
44 percent and the same was 37 percent under bhindi, 26 percent under tomato, 45
percent under guava and 60 percent under marigold (Table 6). This indicates that
producers are receiving better price while marketing marigold and receiving lowest price
in case of tomato marketing. The reason being the length marketing channel under
tomato is much larger than the other selected commodities. Also the open market prices
become more volatile the better prices are shared by the intermediaries but not
transferred to the producers in same magnitude.
Table 6. Estimation of producers’ share in consumer rupee
Item Brinjal Bhindi Tomato Guava Marigold
Producers’ price (Rs) 900 600 500 1000 4500
Net producers’ price (Rs) 820 530 410 895 4390
Consumers’ price (Rs) 1855 1450 1555 1985 7300
Producers’ price in consumers’
rupee (percent)
44 37 1555 45 60

232
3.8. Marketing efficiency
Marketing efficiency of the selected commodities has been estimated by following
Acharyas modified method as well as shepherd formula. Under Acharyas modified
formula net price received by the farmers has been calculated by deducting
transportation cost plus value of loss incurred by farmers (while transportation of
commodities to the market) from the absolute price received by the farmers. Estimated
marketing efficiency is an index and as the index value is high, more is the market
efficiency. The marketing efficiency has been estimated as 0.79 under brinjal, 0.58 for
guava and 1.51 for marigold marketing (Table 7). In terms of marketing efficiency the
marigold marketing has been observed to be most efficient while the tomato marketing
efficiency can be termed as poor. However this marketing efficiency is also various
widely even within a day and the index value is an indicative, not an absolute way to
judge the marketing efficiency. Similar result was obtained while calculating the
marketing efficiency by employing shepherd’s formula. The marketing efficiency index
was calculated as 1.79 for brinjal, 158 for bhindi, 1.36 for tomato, 1.82 for guava and
2.51 for marigold (Table 8).
Table 7. Estimation of marketing efficiency* of major marketing channel
Particular/Commodities Brinjal Bhindi Tomato Guava Marigold
Price received by farmers (FP) 900 600 500 1000 4500
Net Price received by farmers (NP) 820 530 410 895 4390
Marketing cost (MC) 335 330 345 415 360
Marketing Margin (MM) 700 590 800 675 2550
Marketing Efficiency
(FP/(MC+MM) 0.79 0.58 0.36 0.82 1.51
*Acharya's modified method
Marketing efficiency has been estimated for most common marketing channel, P-M-W-
R-C

233
Table 8. Estimation of marketing efficiency* of most important marketing channel
Particular/Commodities Brinjal Bhindi Tomato Guava Marigold
Value of goods or
consumer price (V)
1855 1450 1555 1985 7300
Total marketing cost (MC) 335 330 345 415 360
Marketing Margin (MM) 700 590 800 675 2550
Marketing Efficiency
(V/(MC+MM) 1.79 1.58 1.36 1.82 2.51
*Shepherd formula
3.9. Factors affecting marketing efficiency of vegetables marketing
Factors affecting the marketing efficiency have been estimated by employing linear
multiple regression model where marketing as dependent variables (response function)
and several relevant variable have been included in the model as independent variable.
Since various factor affecting the marketing efficiency of brinjal, bhindi and tomato were
quite similar, the functional analysis for these vegetable have been done after pooling all
the data pertains to vegetables.
The R-square value of the regression model indicated that around 73 percent variation in
marketing efficiency has been explained by the independent variables included in the
model. Thus the model can be considered as a good fit (Table 9). Independent variables
included in the model were marketing cost (Rs./q), marketing margins (Rs/q), open
market price (Rs/q), presence of controlling middleman (as dummy variable), volume of
produce handled (q), presence of cold storage service (as dummy variable), length of
marketing channel (no of market functionaries involves) perish ability (as dummy
variable), and as summer season (as dummy variable). Estimated regression co-efficient
variable for independent variables, open market price and volume of produce handled
were observed to be significant and positive. This implied that as the open market prices
and volume of produce handled increases the marketing efficiency was also likely in

234
increase. While the variables such as marketing margins presence of controlling
middlemen and length of marketing channels were observed to have significant negative
contribution towards marketing efficiency. This implied that as the length of marketing
channel increases marketing efficiency declines. Similarly presence of controlling
middlemen reduces the marketing efficiency significantly. It was notable that presence
of cold storage and perish ability nature of vegetables were observed to be non-
significant variables indicating that presence of clod storage nor perish ability were
effecting the marketing efficiency significantly. The reason might be that these
vegetables are produced in a small scale and due to their high perish ability nature, these
are quickly marketed and therefore farmers or traders were not dependent on presence of
cold storage in the area. Since summer is relatively off-season for vegetable cultivation
in West Bengal, and thus marketing and marketing efficiencies are assumed to be
strikingly different from winter season, which is the main season for vegetable
production. The beta co-efficient of the dummy variable for summer season was
estimated to be negative and significant. The reason being during summer season the
vegetables prices are usually very high and most of the marketing margins are enjoyed
by the market intermediaries, therefore, the marketing efficiencies of farmers remains to
be low even though the profitability of growing vegetables during summer season are
more. Usually, during short supply of vegetables benefits of realisation of higher market
prices are not equally percolated to the farmers, rather other market functionaries enjoy
major margins. In contrast during winter season the farmers are affected by lower prices
and the price-risk is passed on to the farmers rather than sharing the burden.

235
Table 9. Determinants of factors affecting marketing efficiency in marketing of
vegetables in West Bengal
S
no
Particulars Co-efficient Standard
Error
‘t’ value
1 Constant 0.767*** 0.0240 3.1958
2 Marketing Cost -0.0020 0.0015 -1.3407
3 Marketing Margins 0.0077** 0.0032 2.4059
4 Open market price 0.0069** 0.0035 1.9846
5 Presence of controlling
middlemen
-0.0077* 0.0041 -1.8827
6 Volume handled 0.0038*** 0.008 4.7150
7 Presence of cold storage service -0.0142 0.0090 -1.5822
8 Length of marketing channel -0.0066* 0.0039 -1.6987
9 Pershability -0.0014 0.0090 -0.1537
10 Summer season -0.0078** 0.0032 -2.4503
11 R square 0.729
12 Adjusted R square 0.613
13 No of observation (N) 138
3.10. Factors affecting marketing efficiency of guava marketing
To analyse factors affecting marketing efficiency, multiple linear regression model was
employed. The R square value was estimated to be 0.83 implying that 83 percent
variation in marketing efficiency of guava marketing was explained by the independent
variables included in the model and rest of the variation and the model can be considered
as a good fit (Table 10). Regression co-efficient for the variables, open market price was
estimated to be positive and significant, implying that as the open market price increases

236
the marketing efficiency was also likely to enhance. Marketing cost and length of
marketing channels were observed to be affecting marketing efficiency significantly with
negative co-efficient indicating that as the marketing cost or length of marketing channel
increases, the marketing efficiency is likely to decline. It was notable that total marketing
efficiency of guava marketing was not significantly affected by the variables, marketing margins,
and presence of controlling middlemen or volume handled by the producers. Price of guava
depends on quality, colour and flavour and the volume of produce was not affecting the level of
price receipt by the farmers.
Table 10. Determinants of factors affecting marketing efficiency in marketing of
Guava in West Bengal
S no Particulars Co-efficient Standard
Error
‘t’ value
1 Constant 0.295*** 0.110 2.677
2 Marketing Cost -0.002*** 0.001 -2.010
3 Marketing Margins -0.003 0.004 -0.751
4 Open market price 0.0055*** 0.001 5.500
5 Presence of controlling middlemen 0.0012 0.053 -0.227
6 Volume handled -0.0013 .001 -1.310
7 Length of marketing channel -0.047*** 0.016 -2.93
8 R square 0.827
9 Adjusted R square 0.786
10 No of observation (N) 56
Note: All cost and returns are in Rs/1000 no of Guava
3.11. Factors affecting marketing efficiency of marigold marketing
As like the vegetables and guava marketing, functional analysis also has been employed to
identify various factors affecting the marketing efficiency of marigold marketing in the study
area. The estimated R square value indicated that around 80 percent of the variation in marketing
efficiency has been explained by the explanatory variables included in the model and rest of the

237
variation is due to error factor (Table 11). Considering the R square value the model can be
termed as a good fit. The estimated regression parameters for variables, marketing margin and
presence of controlling middlemen were estimated to be significant with negative sign, implying
that these variables would affect the marketing efficiency adversely. As the marketing margins
increased or more number of controlling middlemen exists, the marketing efficiency is likely to
decline. The volume of handling of marigold was estimated to have positive and significant
implication on marketing efficiency. This indicated that as the producer would handle more
volume of marigold, their marketing efficiency also likely to improve. However, most of the
producer in the study area are producing in a smaller quantity individually, thus the advantage of
handling large volume is restricted. It was notable in the regression results that the variables
marketing cost length of marketing channel were influencing the marketing efficiency positively
but the estimated parameter was not statistically significant. Similarly, open market price of the
marigold was having efficiency but the estimate was not statistically significant.
Table 11. Determinants of factors affecting marketing efficiency in marketing of
Marigold in West Bengal
S no Particulars Co-efficient Standard
Error
‘t’ value
1 Constant 1.022*** 0.212 4.816
2 Marketing Cost -0.0018 0.100 -0.216
3 Marketing Margins -0.0018*** 0.004 -4.174
4 Open market price 0.0014 0.251 0.553
5 Presence of controlling middlemen -0.0055** 0.0014 3.92
6 Volume handled 0.0019* 0.113 2.316
7 Length of marketing channel -0.112 0.044 -2.551
8 R square 0.801
9 Adjusted R square 0.712
10 No of observation (N) 35
Note: All cost and returns are in Rs/100 units (kuri) of garlands, 1 kuri = 20 no of garlands.

238
4. CONSTRAINT ANALYSIS
Constraint analysis in marketing of produce by farmers as well as middlemen was
analyzed through computing Garrett ranking of various constraints. Detail discussion
was held with the farmers and list of important constraints was prepared. Individually,
farmers were asked to rank these constraints. Based on this rank, finally, Garrett rank
has been computed to priorities the constraints faced by the farmers. Same procedure
has been followed for identification and prioritization of constraints in marketing of
agricultural produce, faced by middleman also. In the result tables both rank i.e. rank
based on percentage as well as computed following Garrett’s formula, have been
reported.
4.1. Constraints faced by the producer
The constraints analysis indicated that high cost of production (due to escalation of input
cost) is the most important constraints faced by the farmers to enhance their production
and in turn the marketable surplus of the produce (Table 12). Poor transportation
facilities, occasional market glut situation during peak season, lack of remunerative price
(very often) and intra-day price variation (price uncertainty) were the other most
important constraints faced by the farmers in marketing of their produce. Due to the
small scale of production, farmers lack any bargaining power of their produce and poor
transportation facilities increases their marketing cost and reduces receipt of
remunerative prices. Establishing better market linkages between farmers to market
would likely to promote marketing farmers marketing margins substantially. In fact due
to these constraints most of the production area are skewed to 5-6 km radius of the
market yard only, even though the favourable conditions for growing these commodities
prevails in other areas also. Marketing of guava and marigold is required very quick
disposal due to their high perishable nature and therefore, productions of these crops are
skewed only in few pockets where farmers and markets are better linked. Other
important constraints encountered by the farmers are lack of knowledge of grading and
sorting, presence of exploitative middlemen, delay in payment, scarcity of labour,
difficulty in selling produce with relatively lower reality, lack of adequate cold storage
facilities, lack of technical know-how and lack of crop insurance coverage and awareness
about the crop insurance.

239
Table 12. Constraints perceived by the farmers in marketing of Fruits and
Vegetables in West Bengal
Sl
no
Constraints Rank (based on maximum
percent of respondents)
Garette
Ranking
1 High cost of production due to high
input cost
1 1
2 Scarcity of labourers 9 9
3 Poor transportation facilities 2 2
4 Delay in payment 10 8
5 Lack of remunerative price 3 4
6 Presence of exploitative middlemen 5 7
7 Market glut during peak season 4 3
8 Practice of bribing while
transportation via train
14 14
9 Difficulty in selling of produce with
relatively lower quality
8 10
10 Intra-day market price variation 6 5
11 Lack of knowledge of grading and
sorting
7 6
12 Lack of technical know how 11 12
13 Lack of insurance 14 13
14 Lack of adequate cold storage facility 13 11
It was notable while discussion with the farmers that even with the existing high
production risk (particularly under poor quality of soil & water environment), farmers
were not realizing insurance as an important instrument for risk mitigation. The reason
being either these crops are not covered under the insurance scheme or farmers feel that
the paying of insurance premium is an added cost. There is a need to popularize crop

240
insurance scheme and also to bring more number of crops under this scheme to reduce
the risk. Recently contract farming is gaining popularity among the farmers in some
pockets for some particular crop (e.g. Potato). However, formal contract farming for the
selected crops in the study area was almost nil.
4.2. Constraints faced by the middleman
Like farmers, also middlemen face primary constraints as poor transportation facilities.
Village trader or first middlemen in marketing of these selected commodities plays very
important role through collection of tiny marketable surplus from the small-scale
producer and selling it to the wholesale market. Middlemen perceived risk of timely
disposal was another important constraint in marketing of these produce (Table 13).
Various important constraints faced by these middlemen are post harvest losses during
transportation, market glut during peak season, lack of basic facilities in the market yard,
intra-day price variation, scarcity of labourers, delay in payment, high market fees and
practice in bribing while transportation via train or road transport. Village trader or first
middlemen are playing very important role particularly in view of the small-scale of
production and tiny marketable surplus of the producer, because marketing of these small
quantity by individual farmers may not be so remunerative. But very often farmers were
not aware of open market price or middlemen offers low prices and the farmers are
forced to sell their produce once the produce are harvested or brought in the market.
Middlemen offers prices based on the volume of produce arrived in that local
market/village market in a particular day but not on the basis of open market prices
available in wholesale market, which results in often exploitation of farmers.
Middlemen are also not sure about the selling price of the purchased commodities at
wholesale market (because similar commodities are brought by other middlemen from
other local markets also) and rely on speculative marketing and sometime bear the risk of
low prices also.

241
Table 13. Constraints perceived by the middlemen in marketing of Fruits and
Vegetables in West Bengal
Sl
no Constraints
Rank (based
on maximum
percent of
respondents)
Garrett
Ranking
1 Post harvest losses during transportation 4 3
2 Scarcity of labourers 6 7
3 Poor transportation facilities 1 1
4 Delay in payment 9 8
5 Risk of timely disposal of commodities 2 2
6 High market fees 10 9
7 Lack of basic facilities in the market yard 7 5
8 Market glut during peak season 3 4
9 Practice of bribing while transportation via
train
8 10
10 Intra-day market price variation 5 6
5. SUGGESTION TO IMPROVE MARKETING EFFICIENCY
Marketing efficiency of marketing of selected commodities can be increased significantly with
certain intervention such as 1) up-scaling of the volume of produce handled, either through
increase in production or through formation of self-help groups or formation of grower’s
association so that farmers’ marketing cost reduces. 2) Improving the market functioning system
particularly transparency on commission charged, 3) Integration among various markets through
better transportation facilities and approach road to reduce the transportation cost. 4) Regular
timely inflow of information to farmers about the prevailing wholesale market prices of
commodities. 5) Providing market intelligence support to the farmers particularly on the time to
grow certain crops and making availability of suitable seed/variety for crops. 6) Basic

242
infrastructure in the market yard should be improved in a greater way so that interaction between
large number of farmers and traders can be made freely. 7) Government regulation should be
enforced for free and fair marketing practices and free entry of a number of organized retailers in
the market. Implementation of Agricultural Produce and Marketing Act (APMC Act) would be
one of the option for better, free and fair marketing practices provided organized retailers are
allowed to purchase produce directly from farmers across the districts. 8) Appropriate price
discovery of the produce in the market was the most important issue to facilitate improved
marketing efficiency and providing farmers a better deal. Suitable institutional change may be
made such as commissioning an arbitrator or personnel to ensure better prices to the farmers.
6. PRICE MOVEMENT AT WHOLESALE MARKET
Agricultural commodity prices vary widely across the season, months, weeks, days and even
within a day across the hours. Quantity of arrival of selected produce is the most important
factor for price determination in the wholesale market. The primary season of sowing and
harvesting of the selected crops are presented in Table 14. To analyze the price movement of
selected commodities details of arrivals (kg) and modal prices (Rs/q) were analyzed at fortnight
interval at Baruipur market (Canning). This is the most important wholesale market in the study
area and also the information on price and arrivals were available on daily basis. As expected the
relationship between model prices and arrival quantity of selected commodities, were negative
indicating larger the arrival less was the modal prices. Market arrival quantity of brinjal was
hovering around 15-20 q/day during May to July, and after that market arrivals jumped to over
35-40 q/day (Fig. 1). In contrast the price movement was opposite to market arrival and
comparatively low prices prevail during August to first fortnight of October.

243
Table 14. Sowing and harvesting period of selected crops in the study area
Crops Jan Feb Mar Apr May Jun Jul Aug Sep Oct Nov Dec
Brinjal
Bhindi
Tomato
Guava
Marigold
Sowing Harvesting
Brinjal and Bhindi can be grown throughout the year
Similar trend was observed for bhindi, market arrival was hovering around 20-25 q/day
during second fortnight of May to second fortnight of July. Quantity of market arrival
jumped during August to October and was hovering around 30-40 q/day. The price
movement was just reverse of market arrival but the prices were more or less varying
between Rs. 10-15/ kg (Fig 2).

244
Figure 1: Arrival and modal price of brinjal at Baruipur (Canning) market during 2009-10
Figure 2: Arrival and modal price of bhindi at Baruipur (Canning) market during 2009-10
Arrival and Modal Price of Brinjal at Baruipur (Canning) market
(2009-10)
0
500
1000
1500
2000
2500
3000
3500
4000
4500
May
, 1
May
, 15
June
, 1
June
, 15
July, 1
July, 1
5
Augus
t, 1
Augus
t, 15
Septe
mbe
r, 1
Septe
mbe
r, 15
Octob
er, 1
Octob
er, 15
Months
Qu
an
tity
(kg
) / P
rice (
Rs/q
)Arrivals (kg)
M odal Price (Rs/q)
Arrival and Modal price of Bhindi at Baruipur (Canning) market
0
500
1000
1500
2000
2500
3000
3500
4000
May
, 1
May
, 15
June
, 1
June
, 15
July, 1
July, 1
5
Augus
t, 1
Augus
t, 15
Septe
mbe
r, 1
Septe
mbe
r, 15
Octob
er, 1
Octob
er, 15
Months
Qu
an
tity
(kg
) / P
rice (
Rs/q
)
Arrivals (kg)
M odal Price (Rs/q)

245
The reverse relationship between prices and arrival was more pronounce in case of
tomato (Fig. 3). Higher prices were prevailing during June to November and after that
prices goes down and become very low during second fortnight of December to the
month of April. During the higher market price the tomato used to come form distant
market such as Bangalore and during winter local production starts and price falls and
sometime becomes absolutely non-profitable.
One common phenomenon was notable in case of arrival and model price movement of
vegetables that price movement was not so erratic as compared to the movement in
quantity of arrival. Possibly, the reason being, vegetable prices operate under some kind
of cap at higher prices. Once production has started farmers are bound to bring their
produce at market for sell and in case of glut situation price falls drastically and below
the normal profit (it total cost equals to total return) farmers failed to sell his produce.
During price rise, also vegetable cannot be sold beyond a maximum price (cap) or
demand for that vegetable falls sharply because consumers switch over to
other/alternative vegetables. Therefore, the price cannot go beyond certain level for
marketing of large volume of commodities due to the natural supply-demand interaction.
So, the price movement of vegetables across the year was less bouncing as compared to
quantity of market arrival of vegetables.

246
Figure 3: Arrival and modal price of tomato at Baruipur (Canning) market during
2009-10
In case of guava marketing price and arrival movement was just opposite. In contrast to
vegetable marketing, the price movement was more erratic rather and movement in
quantity of arrival. The average prices were very high (Rs. 40-45/kg) during May to first
fortnight of July and then price falls sharply (Rs. 5-10/kg) during August to January (Fig. 4).
Price begins rising again after February around. Prices of guava are more of supply driven and
thus price movement was more bouncy as compared to the quantity of arrival in the market.
When supply shrinks the price moved upward in a greater magnitude and vice versa. The supply
of guava depends on the few pockets of pockets of production and due to the high perishes
ability nature; arrival from distant market during short supply and export to distant market even
in peak season is highly restricted. As a result the price movement becomes erratic and very
often cause market glut situation. Provision of suitable post-harvest intervention would likely to
streamline the prices in a better way.
Figure 4: Arrival and modal price of guava at Baruipur (Canning) market during 2009-10
247
7. Alternative marketing channel/Organised retailer
Organised retail marketing by several corporate houses such as Reliance, Food Bazar
(Future Group), ‘Spencers’ retail marketing (RPG Group) and Metro cash and Carry
(wholesale business) are likely to change the agricultural marketing in India in general
and in West Bengal in particular. These are the alternative marketing channels, some of
which are acting as wholesale market (Metro cash and carry) and some are involved in
retail marketing (spencers, food Bazaer, Reliance etc.). The functioning of these
alternative marketing systems, such as how they procure the produce, from whom they
procure, what is the mechanism of their price fixing, how the produce are sorted, graded
and finally reaches to the consumer are important to know the future of agricultural
marketing in the state, and also the probable implication of entry of such market players
to the farmers and to the large no of traders/ middlemen/ retailers. In an attempt to
understand the functioning of these retail-marketing systems detail discussion was held
with the management officials involved with this retail chain management. However,
the information available on this organized retail functioning was not adequate to
perform detail and systematic analysis as has been done for traditional marketing system.
Following are the collection of pieces of information generated from the discussion with
the management personnel of the relevant retail marketers.
7.1. Functioning of Metro cash and carry (wholesale)
Based on the information available and personal visit following were the observation on
functioning of Metro Cash & Carry, Kolkata (source: www.metro.co.in).
The Metro Group was created in 1996 through the merger of leading trading
companies. The corporate group is composed of high-performance, operationally
independent companies and businesses.
Just as the group profits from the strengths of the individual companies, each
sales division receives support and reinforcement from the entire corporation’s
business potential. Furthermore, all members of the Metro Group profit from the
important synergy effects that only a nationally and internationally successful
major corporation can offer.
Metro Group today, is the third largest trading and retailing group in the world.
The company employs over 2,50,000 staff in 30 countries. In the year 2005

248
Metro Group had generated sales of over US$ 55.7 billion; 53 percent of total
sales came from outside Germany.
Metro Cash & Carry business model is based on a Business to Business (B2B)
concept and focuses on meeting all the needs and requirements of business
customers. It is a modern format of wholesale trading, catering only to business
customers.
"Cash & Carry" means that the customers pick the goods themselves, pay in cash
and transport their goods with their own vehicles. The advantage as compared
with conventional wholesale lies in the more competitive price, the scope of the
food and nonfood assortment, the immediate availability of the merchandise and
the customer-oriented working hours.
Metro Cash & Carry started operations in India in 2003 with two Distribution
Centres in Bangalore. With this Metro introduced the concept of Cash & Carry to
India. These Centres offer the benefit of quality products at the best wholesale
price to over 150,000 businesses in Bangalore.
Metro offers assortment of over 18000 articles across food and non food at the
best wholesale prices to business customers such as Hotels, Restaurants, Caterers,
Food and Non-food Traders, Institutional buyers and professionals.
Metro today is poised to extend its concept of Business to Business (B2B)
Wholesale to other cities in the country
7.2. Key observation on functioning organized retailer
Information has been compiled based on discussion with management officials of Metro
Cash & Carry, Food Bazaar (Future Group), Reliance retail and Spencer’s retail market.
Following are the major observations on status and functioning of the organized retail
marketing in West Bengal-
Fruits & vegetables marketed through the organized retail chain accounts for less
than 0.5 percent or even less (roughly). Thus, less likely to have any impact on
the traditional agricultural marketing so far, particularly for fresh fruits and
vegetables.
In case of retail marketing for staple commodities such as pulses and branded
rice, edible oil etc are growing rapidly and roughly accounted for nearly 10
percent of the total volume of transaction. The retail-marketing share of the

249
processed and value added foods and staple foods are rapidly increasing. Increase
in quantity of value added product through establishing more number of food
processing unit are extremely essential to increase the marketing efficiency in the
state. The organized retail marketing systems are ready for large scale
investment in food processing and value addition in the state once the socio-
political bottlenecks are sorted out.
Currently fruits & vegetables are procured through various collection centers
where farmers (or middlemen in disguise of farmers) used to bring their produce
in every morning
Primary grading and standardization are done by the farmers (or middlemen in
disguise of farmers), who are already informed about the preferred quality, size
and shape of the commodities.
The ‘price discovery’ depends on the present day market price. Framers were
assured of ‘best’ price (actually prevailing wholesale market prices) of their
commodities on satisfaction of the quality of produce.
Price determination may also be done based on the cost-price model or minimum
base price model subject to availability of adequate information of cost of
cultivation of crops. Organised retailers are ready to pay minimum remunerative
price to the farmers based on the actual cost of cultivation as Government may
fix. The minimum price of the commodities (through Market Intervention
Scheme) may be prescribed and organized retail marketers are ready to accept the
price to make the marketing a win-win-win situation for all i.e farmers-retailer-
consumer.
Profit margins retained for fruits & vegetables commodities depend on degree of
perish ability. More is the perish ability more is the profit margin kept. For
example, higher margins are kept for leafy vegetables rather than potato as the
leafy vegetables is more perishable than potato.
o Average margin kept for fruits & vegetables was around 20-25 percent
implying that if the retailers are allowed to procure vegetables freely from
farmers (or if they can procure) more margins can be transferred to the
farmers.
o For leafy vegetables margins are > 30percent
o For staple food margins are around 10 percent

250
Successful marketing model should offer
o Best price
o Insurance cover
o Making availability of technical know how
Major problem/bottleneck of the organized retail business is non-implementation
of APMC Act uniformly across the states. Presently separate license was required
for every district for procurement of fruits & vegetables. And also very often
they find it difficult to procure commodities from open market freely. Free and
fair access to these commodities would likely to make retailing business more
competitive and efficient.
The biggest problem is the price discovery or price determination of the fresh
fruits and vegetables in the market. Usually they rely on the previous days prices
are offered for procuring these commodities.
Organised retail marketers accept only the certain quality produce. Once farmers
or middlemen are aware of the quality they do not bring the inferior quality of
produce. But rest of the production must be sold in other markets therefore;
farmers have to visit multiple markets in same day – which is a constraint for
them.
Farmers himself cannot come to the collection centres everyday as they are
producing very small quantity – therefore they need to depend on the
middleman/fariah again.
7.3. Possible implications of organized retail agricultural marketing and few issue
Organized retail marketing channels are more efficient and also their post harvest
handling is better than the traditional marketing system. The organized retailers are
offering better quality of commodities almost at same price as other retailers are offering.
Under the traditional marketing system, the traders often add (on dipped produce into)
artificial colour or additives to the commodities to increase keeping quality and make it
attractive, glossy to fetch higher retail price. But these additives are very often not safe
for health. This calls for enforcement of stringent regulation in food safety and food
quality, which is presently almost non-functional. Organised retailers are handling these
produce in a better way through the cool-chain system and the quality of the produce are
expected to be more safe and healthy. The expectation from corporate retailers is to

251
provide quality produce at competitive price and also to provide better prices to farmers.
But these marketing channels are likely to have some implications on all levels of market
functionaries, which need to be looked into carefully. These are-
Organised retail marketers are sourcing the produce from various collection
centers. Mostly traders/ middleman bring the produce at this collection centers.
Farmers who are producing commodities at a small-scale hardly can take
advantage to sell directly to these retailers. Therefore, middlemen on disguise of
farmers sell the produce to the retailer and enjoy the margin as like in traditional
marketing system. Unless the retailer marketers will be allowed to purchase
directly form the farmers (presently not happening due to various interference) or
farmers are made capable (more volume) of selling their produce to these
organized retailer, the producers price on consumer rupee would not be improved
significantly.
In West Bengal almost all the producers are small-scale producer and
fragmented. In one had the retail markets are becoming consolidated and the
producers are becoming further fragmented, making the non-level playing
situation. Thus as the investment in these organized retail chain would be
increasing, they would have more control on agricultural trading and in other
hand the small-scale producers would further loose their bargaining power or in
other word the marginal producers would be excluded from the advantage of the
organized retail marketing system.
Entry of organized retailer in large scale would likely to displace large number of
traders and retailers. Under West Bengal condition, large amount of unemployed
persons are involved in this unorganized employment sector. Alternative
employment opportunities must be created for this large number of displaced
people to avoid social tension. In presence of these active middlemen and
burgeoning retail investment in the agricultural commodity there would not be
any real benefit to the producers’ particularly.
The biggest advantage of organized retail marketing (as argued) is likely to be
elimination of large number of middlemen and reducing the marketing margins
so to provide lower price to consumer and better price to farmers. However, the
most important question is whether the benefit of elimination of middlemen
would be passed on to the retailer would enjoy the producers or the benefit only.

252
To ensure the distribution of benefits, besides providing free and fair business
environment to organized retailer also strong regulation needs to be enforced.
Most importantly more number of agri-retailer has to be operative in the market
so that market control should not be in the hands of only few organized retailers.
Organised retailers procure the commodities of specific qualities after suitable
sorting and grading but farmers produce same commodity in varying quality,
therefore, they need to depend on other marketing channels to dispose their rest
amount of produce. Also retailers would have special interest on purchasing in
bulk quantity, favouring the large producers or from some other collectors (or
middlemen).
Corporate retail of agricultural marketing might be highly successful for large
farmers, farmers with large investment capacity and endowed with adequate
capital adequacy. But the marginal farmers are constrained with all types of
resources including financial capital, thus unless their production capacity
increases, they might be again by-passed.
Organised retailer may offer predatory pricing to attract the consumer to
eliminate the competitions or other small-scale retailers from the market. Once
the market control is established the cost of predatory pricing may be passed on
to the producers and they may offer below-cost pricing to the producer. For this
there is again need of strong regulation from the government eliminate any
exploitation.
Organised retail marketing would be successful model with win-win-win
situation for all (producer-retailer-consumer) of free and fair marketing system if
promoted through implementation of APMC Act and with stringent regulation by
the government. Investment capacity of the marginal farmers must be increased.
Marginal farmers’ access to financial resources and other inputs such as irrigation
water, seed, fertilizer etc needs to be enhanced. Finally farmers or growers
association must be formed to take advantage from the organized retail marketing
and to reduce the functioning of middlemen.

253
8. CONCLUSION AND POLICY IMPLICATIONS
Following were the key observation and suggestion to improve the agricultural
marketing system in West Bengal:
In general it was observed that the farmers were absolutely unorganized but
traders were ‘relatively’ organized. Farmers lack bargaining power,
Lack any system for timely information flow on market prices to the farmers.
Prices were determined by the traders/assembler at village market based on the
volume of produce arrived in that particular market in that day. Traders are better
informed with market prices rather than farmers,
Large number of traders are operating without any formal license,
Market places lack minimum basic facilities. Need large investment for
construction of market infrastructure, like pucca building/structure for displaying
commodities, sitting place etc. Every market places lack adequate space –
becomes overcrowded and clumsy,
Individually, the scale of production is small but at aggregate level volume of
production is high because of large number of producer. Also a large no of
traders (license or non-licensed) are in trading business i.e., large volume of
produce were being handled by even larger no of traders making the scale of
business a very small one,
Whole system is operating under a vicious cycle like – large number of small
producer - producing low marketable surplus – resulting low bargaining power
and – low profit. Then these commodities passes to large number of small traders
who are handling these produce in a small scale subjected to high degree of post
harvest losses – ultimately resulting the whole marketing system a non-
commercial venture,
Due to small scale of production by farmers as well as small scale of operation by
traders, both (farmers and traders) lack competitiveness (in terms of offering low
prices to consumer),
Because of this low volume of operation both farmers or traders tries to dispose
off his entire produce in quickest possible time as either they cannot afford to
store the produce (if storage facility is available) or mostly the storage facility is
not available,

254
In spite of large volume of production at aggregate level, the small scale of
operation, vegetables (and other perishable commodities) trading a risky and
uncertain business forcing the traders to keep high profit margin, which
ultimately affects consumer badly. Therefore, inter-day and intra-day price
variation is exorbitantly high,
The volume of handling must be increased to make the business more
commercialized, which is also likely to offer more stabilized price at the market
and benefiting both consumers and producers, State government is required to
provide better facilities, services and amenities in the market places. It seems all
functions in the process of agricultural marketing is going on in a very traditional
way without any change, improvement or any kind of initiatives since ages,
To increase the marketing efficiency of the vegetables, it has been suggested to
increase the volume of handling through organized retail chain to make the
business more commercialized. This increased volume of trading also likely to
offer more stabilized price at the market, benefiting both consumers and
producers and attracting other farmer to diversify their cropping system, thereby
increasing the area under vegetables.
In production side, the small-scale producers were observed to be reasonably efficient in
production and the production systems were labor and input intensive, but their
marketing efficiencies were poor. In West Bengal the agricultural marketing system is
functioning in a very traditional way and most of the market places including the
wholesale markets are devoid of adequate basic infrastructure. In general there was no
certain system for price fixation. The prices are determined by the interaction between
farmers and traders at the village market based on the volume or produce arrived at the
market on a particular day on specific time. Therefore, appropriate price discovery is
always a problem and due to this wide price instability persists, and the farmers are the
worst sufferers for this uncertainty. Price discovery can be made efficiently if some
kind of base price is fixed by the government regulatory authority based on the
estimated cost of cultivation of crops as well as analyzing the trend in price and market
arrivals for a particular commodity. In fact price fixing can be made based on available

255
database on average of production and movement of produce across several important
markets.
Alternative marketing systems or organized retail marketers are ready for entry into the
agriculture retail marketing in a big way but non-implementation of APMC Act in a free
and fair manner was the main hurdle for their functioning in large scale. Marketing
efficiencies of organized marketing channels are high but they prefer to procure in bulk
quantity, which marginal farmers cannot offer individually. Organised retailer would
depend on bulk suppliers; therefore presence of middlemen would be active even in the
case of organized retail marketing. So far the entry of these retail chains were not
affecting the traditional agr-retailing in a significant way because their trading volume
was meager in terms of total volume of fruits and vegetables traded through other
wholesale markets in the state. Therefore, relationship between corporate retailing and
improvement in the farmers’ share in consumer rupee was not well established. Large
investment from corporate houses on value addition to the agricultural produces is still
awaited in the state, which would probably be beneficial for both producers and
consumers. It is inevitable under the ongoing economic liberalization process, that
corporate houses would increase their market share and market control over the trading
agricultural commodities in future, it is also certain that marketing efficiencies through
these alternative marketing channels are likely to be improved in terms of creation of
value addition and reduction in transaction cost, but the most important issue is, how to
include the marginal farmers category (who are dominating class and producing tiny
marketable surplus from fragmented land in west Bengal) into this corporate marketing
channels suitably or directly. Market economy has one unique attribute to pull the
growth for those who are in advantages position or who have better access to natural and
financial capitals, but utterly excludes those who are in disadvantageous situation (like
marginal farmers) or those who are not having adequate access to the resources/ inputs to
produce larger quantity. The fact is that the marginal farmers operate under a host of
difficult socio-economic condition in which they produce small quantity with high
production efficiency but they are poor in marketing efficiency. On one hand corporate
retailers are consolidating rapidly asking for bulk purchase of agri-commodities, and on
other hand producers are becoming more and more fragmented and producing small
quantity of marketable surplus, so farmers must be organised to increase their volume of
trading to increase their bargaining power to take advantage of these marketing systems.

256
ANNEXURE
Table 14. Arrival and Modal price of Bhindi and Brinjal at Baruipur market
(Canning) during 2009-10
Months Bhindi Brinjal
Arrivals
(kg)
Modal Price
(Rs/q)
Arrivals (kg) Modal Price
(Rs/q)
May, 1 1900 1500 2800 1300
May, 15 1500 2000 2200 1300
June, 1 1500 2200 2500 1700
June, 15 1600 1300 2100 1500
July, 1 1800 1400 2300 1600
July, 15 2000 2200 2400 2200
August, 1 3800 1300 3500 1400
August, 15 3600 1100 2800 1400
September, 1 3700 1300 3000 1500
September, 15 3200 1300 4100 1400
October, 1 3700 1300 3000 1500
October, 15 3200 1300 4100 1400
Source: http://agmarknet.nic.in/

257
Table 15. Arrival and Modal price of Tomato at Baruipur market (Canning) during
2009-10
Months Arrival (q) Modal Price (Rs/q)
May, 1 3300 1100
May, 15 2200 2300
June, 1 2200 2300
June, 15 700 3800
July, 1 2100 3100
July, 15 2200 2900
August, 1 2500 3000
August, 15 2000 2800
September, 1 2800 2500
September, 15 2900 2400
October, 1 2800 2500
October, 15 2900 2400
November, 1 1800 1900
November, 15 1700 2400
December, 1 1700 3800
January, 1 7700 600
January, 15 7500 700
February, 1 6600 700
February, 15 7500 600
March, 1 7500 400

258
March, 15 2200 1300
April, 1 5000 350
April, 15 5000 500
Source: http://agmarknet.nic.in/
Table 16. Arrival and Modal price of Guava at Baruipur market (Canning) during
2009-10
Months Arrival (q) Modal Price (Rs/q)
May, 1 22 3900
May, 15 25 4100
June, 1 20 4200
June, 15 15 4300
July, 1 60 2600
July, 15 125 1600
August, 1 500 700
August, 15 1300 450
Sept, 1 1150 550
Sept, 15 725 700
October, 1 1150 550
October, 15 725 700
Nov, 1 200 900
Dec, 15 135 800
January, 15 16 1000
February, 15 8 1300
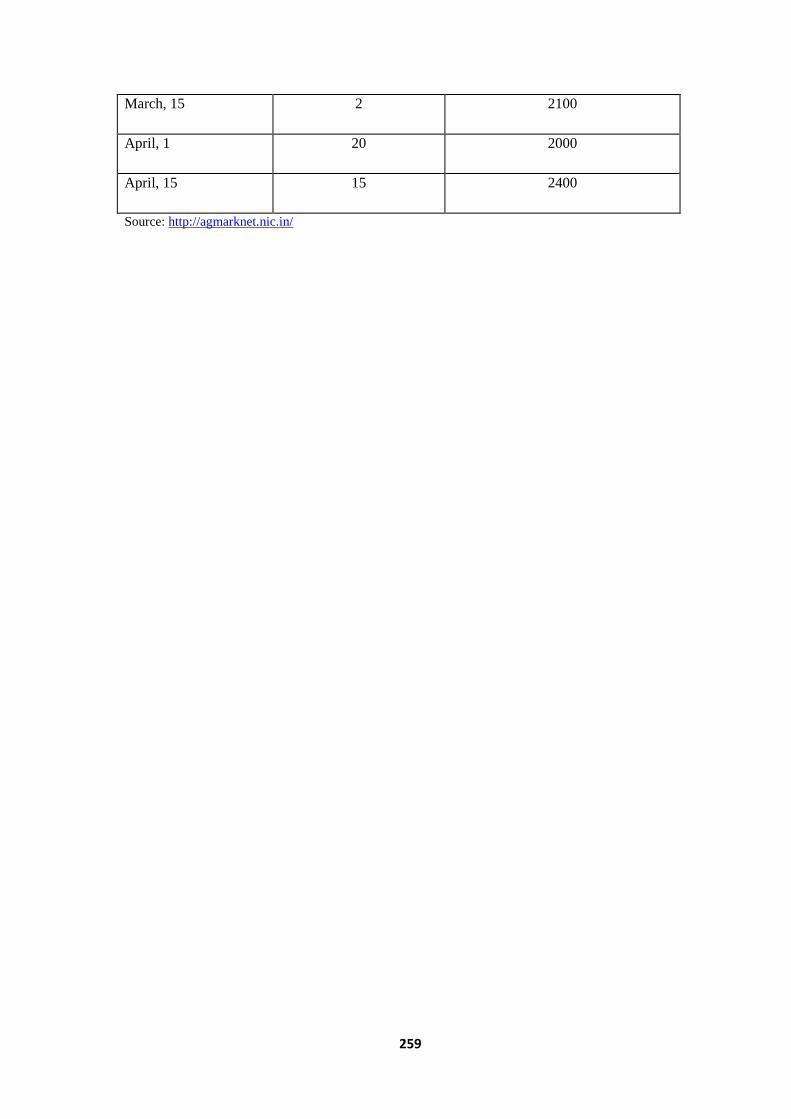
259
March, 15 2 2100
April, 1 20 2000
April, 15 15 2400
Source: http://agmarknet.nic.in/

260
10) References
Acharya, S. S. and Agrawal, N. L. (2001). Agricultural Marketing in India, Oxford &
IBH Publishing Company, New Delhi.
Agmarknet (2010 a), Directorate of Marketing & Inspection, Ministry of Agriculture,
Govt. of India, http://agmarknet.nic.in/
Agmarknet (2010 b), Salient Features of the Model Act on Agricultural Marketing,
Directorate of Marketing & Inspection, Ministry of Agriculture, Govt. of India,
http://agmarknet.nic.in/
L.S. Gangwar, L. S, Singh, Dinesh and Singh, D.B. (2007) Estimation of Post-Harvest
Losses in Kinnow Mandarin in Punjab Using a Modified Formula, Agricultural
Economics Resaerch Review, Vol 20, July-December, pp. 315-331
Dhillon, Ashok, Khatkar, R.K. and Kumar, Arun (2005) Marketing Costs and Price
Spread for Marigold Flower in Haryana, Agricultural Marketing, Vol.XLVIII,
No:1, pp.9-12.
Govt. of West Bengal (2010), Department of Sundarban Affairs, Block profile, www.
http://www.sadepartmentwb.org/Profile.htm
Govt. of West Bengal, (2010b), State Agricultural Marketing Board
Indian Horticulture Database 2008, Ministry of Agriculture, Govt. of India,
www.nhb.gov.in
Metro Cash & Carry India, www.metro.co.in

261
Estimating Marketing Efficiency of Horticultural Commodities under
Different Supply Chains in Manipur and Mizoram States, North-
eastern Hill Region of India
1. Introduction
1.1 Background
With the technological development in the agricultural field, India has made rapid
stride in horticulture too along with increased foodgrain production. The changing
life style and food habit, the importance of vegetables and fruits in the human diet is
being increasingly realized. They supply a myriad range of essential nutrients to the
population of the country that is largely vegetarian. The use of flower is considered
inevitable in many of the Indian cultural and religious practices. Today our country
has emerged as the second largest producer of fruit and vegetables in the world.
Owing to the varied agro-climatic zones, abundance of natural resources like sunlight
and water, existence of large number of small and marginal farmers and technology
available for their production, India has considerable potential to increase its
production of horticultural crops. But the impact of new production technology
cannot be sustained unless simultaneous efforts are made in the direction of effecting
improvements in the marketing system as a whole. Unless the marketing efficiency
improves, no incentives to increase production will attract the cultivator.
It has been noticed that the marketing facilities for horticultural crops are not that
adequate as compared with other agricultural commodities. Being perishable in
nature, they cannot be stored for a long period and it is also not possible to transport
them to long distances under ordinary conditions. Hence, exploitation by the buyers
and middlemen in these commodities still persist in spite of regulation of markets.
Agriculture is the mainstay of most of the people of Manipur and Mizoram states,
north-eastern hill region of India. Agriculture and allied activities accounts for about
23.35 percent and 16.44 percent of the total Net State Domestic Product of the states
respectively (Basic Statistics of NEH Region 2007). The existence of subtropical to
temperate climatic conditions and also, fertile soils in this region offer good scope for
the cultivation of various types of vegetables, fruits and flowers throughout the year.
Over the past one decade, the production and marketing of horticultural crops in this

262
region has become increasingly important as physical infrastructure and experience
in the production of these crops has improved continuously. The reason being the
implementation of Technology Mission for the Development of Horticulture in NEH
Region as a centrally sponsored scheme. In addition the consumers began to demand
higher value horticultural crops in response to demand generated out of income
increase and food habit change. Accordingly, the area and production of horticultural
crops in this region increases many fold.
An increase of marketed surplus of horticultural crops calls for larger and improved
market facilities. If market function efficiently farmers allocate their resources
according to their comparative advantage and intensify their production. The
prevailing marketing systems of horticultural crops are not well organized and the
producers’ share in consumer rupee is substantially low.
The recent development of horticultural sector in Manipur and Mizoram after the
introduction of Technology Mission calls for a sound marketing system. Since high
value crops such as vegetables, fruits and flower require a chain of marketing
functions before reaching the ultimate consumer, the role of various marketing
agencies assumes great importance. The farmers will get the remunerative prices for
their surplus produce only when the effective and efficient marketing system is in
place. However, in recent years many new supply chains involving large sized agri-
retail companies, contract farming systems, producer groups, etc. are emerging,
which are considered to be better marketing models giving higher prices to the
producers and better market efficiency through the vertical integration of the market.
Therefore, an in-depth study on the existing systems of marketing of horticultural
crops particularly vegetables, fruits and flower in the region is required for
diagnosing the supply chain models and finally, development of an efficient
marketing model. The experience of the initiatives taken for the promotion of these
crops through contract/ co-operative/ corporate farming and other marketing models
will be helpful to identify the factors responsible for the success/ failure of the
promotion of these crops in the region and to explore the possibilities of their
strengthening or improving their viability and commercialization as well as
replication in other areas.

263
1.2 Objectives of the study:
To estimate the marketing cost and marketing margin of different functionaries
for selected horticultural commodities under various supply chains.
To analyze the price spread, marketing efficiency and farmer’s share in
consumer rupee in various supply chains.
To identify the constraints perceived by various stakeholders; and study the
factors influencing the marketing cost / margin / efficiency.
To suggest suitable strategies to enhance the marketing efficiency for
horticultural commodities.

264
2. Data and Methodology
2.1 Crops studied:
Sl.No. Crop State
1 Tomato Manipur
2 Cabbage Manipur
3 Passion fruit Manipur
4 Anthurium Mizoram
2.2 Sample size for each crop:
Crops Farmers Retailers Wholesalers Traders Total
Tomato 120 30 10 0 160
Cabbage 120 30 11 30 191
Passion fruit 120 30 6 1 157
Anthurium 120 6 0 1 127
Tomato:
Village District Farmers
Kabowakching Bishnupur 29
Kamong Imphal-West 22
Keinou Bishnupur 22
Hinabok Bishnupur 26
Khoijuman Bishnupur 21

265
Cabbage:
Village District Farmers
Boharam Ukhrul 13
Lunghar Ukhrul 48
Khoijuman Bishnupur 23
Kwakshiphi Bishnupur 16
Wabagai Thoubal 20
Passion fruit:
Village District Farmers
Thenmual Churachandpur 46
Khopuibung Churachandpur 20
Valpakaot Churachandpur 10
Saikot Churachandpur 24
Purul Akutpa Senapati 15
New Kameng Senapati 5
Anthurium:
Village District Farmers
Durtlang Aizawl 43
Chawlhhmun Aizawl 23
Luangmual Aizawl 12
Ramhlun Aizawl 12
Zolhong Aizawl 19
Kolasib Aizawl 11

266
2.3 Methodology and Analytical techniques:
The following analytical tools were used to achieve the desired objectives
Marketing Efficiency:
Shepherd Formula
E = (O/I)*100
Where, E is index of Marketing efficiency
O is value added by the marketing system
I is ‘cost + margin’ of market intermediaries
Acharya’s Modified Marketing Efficiency
MME = FP/(MC+MM)
Where, MME is modified measure of marketing efficiency
FP is price received by farmers
MC is marketing cost
MM is marketing margin
2.4 Price Spread
It is the difference between the two prices, i.e., the price paid by the consumer and the
price received by the producer.
For e.g. P1-P2,
Where, P1 is price at one level or stage in the market
P2 is price at another level
2.5 Producer Share in Consumer Rupee
PS = (PF/PR)*100
Where, PF is price received by the farmer
PR is retail price (consumer price)
Cmi is the cost incurred on marketing per unit

267
2.6 Factors affecting Marketing Efficiency
y = f (x1,……………….……xn)
Where,
y = Marketing efficiency (%)
x1 = Marketing cost (Rs.)
x2 = Marketing margin (Rs.)
x3 = Transport cost (Rs.)
x4 = Open market price (Rs.)
x5 = Labour wages (Rs.)
x6 = Controlling middlemen (put ‘1’, if middlemen are controlled and ‘0’ if
not)
x7 = Volume of produce handled (kg)
x8 = Presence of cold storage facilities (put ‘1’, if present and ‘0’ if not
present)
x9 = Length of the market channel (No. of market intermediaries)
x10 = Existence of competition in selling
x11 = Nature of produce (put ‘1’, if semi-perishable and ‘0’ if perishable)
Constraints perceived by the farmers / wholesalers / retailers
Garrett’s Ranking Technique
100 (Rij - 0.50)
Percent position = ---------------------
Nij
Where, Rij is the rank given by ith item by jth individual
Nj is the number of items ranked by the jth individual
(Note: The percent position of each rank is converted into scores by referring tables
given by Garrett and Woodworth (1969). Then for each factor, the scores of individual
respondents are added together and divided by the number of respondents for whom
scores are added. The mean scores for all the factors are ranked by arranging in
descending order).

268
3. Results and Discussion
3.1 TOMATO
The tomato farmers were classified into three categories, viz., (i) Small having up to 0.99
hectares of land holding; (ii) Medium having 1 – 1.49 hectares and (iii) Large having 1.5
hectares and above land holding. The information on size group-wise distribution of
sample farmers is presented in Table 1. Of the total number of 120 sample farmers, 52.50
percent were in small group operating about 31.44 percent of the total area, while large
group accounting for about only 16.67 percent of the total sample farmers shared about
33.67 percent area. Farmers in Medium group formed about 30.83 percent operating
34.89 percent of the total area. The average farm size was 0.56 hectares, 1.06 hectares
and 1.89 hectares respectively in small, medium and large groups with an overall average
of 0.93 hectares.
Table 1: Distribution of sample Tomato cultivators
Sl. Category Holding
Size (ha.)
No. of
cultivators
Total land
holding (ha.)
Average land
holding (ha.)
1 Small 0 - 0.99 63
(52.50)
35.25
(31.44)
0.56
2 Medium 1 - 1.49 37
(30.83)
39.13
(34.89)
1.06
3 Large 1.5 &
above
20
(16.67)
37.75
(33.67)
1.89
4 Total 120
(100)
112.13
(100)
0.93
Figures in the parentheses indicate percentages to the total
The per hectare disposal pattern of tomato is shown in Table 2. The farmers marketed
almost all the produce (94.81 percent) from the farm after using 0.22 percent for home
consumption and 0.42 percent for payment in kind and as gift to relatives. It was
observed that losses due to breakage and spoilage accounted for 4.54 percent of the total
production.
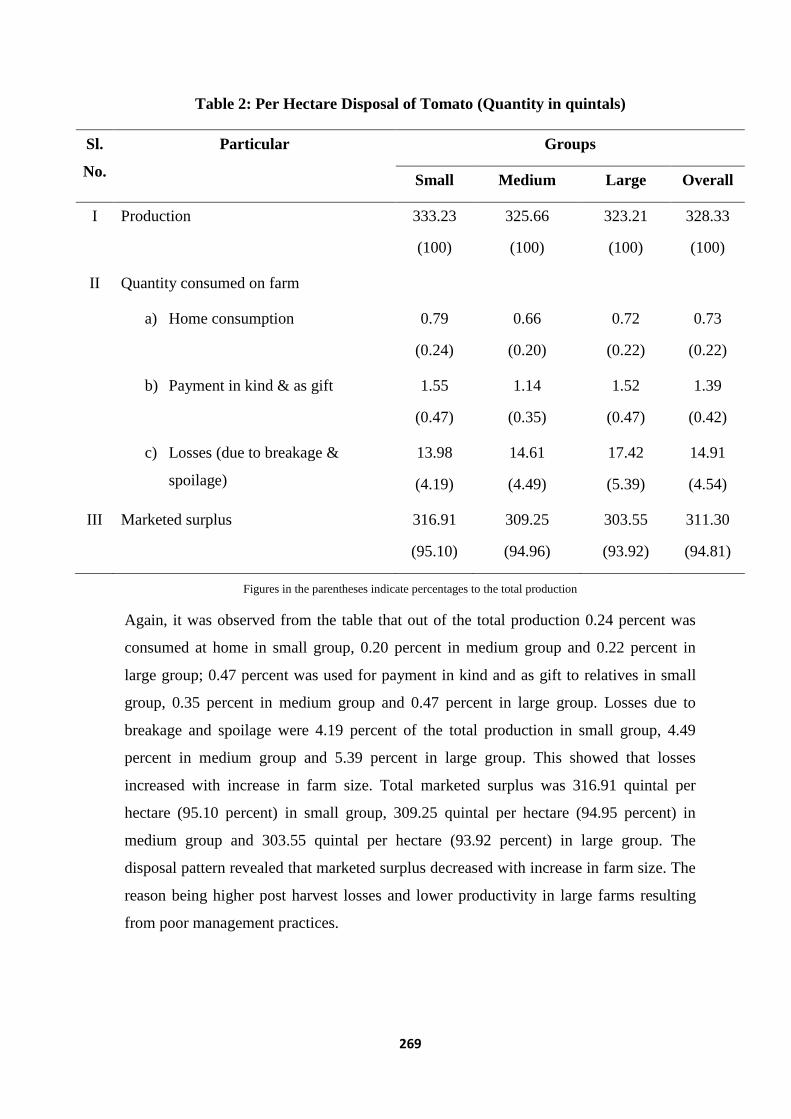
269
Table 2: Per Hectare Disposal of Tomato (Quantity in quintals)
Sl.
No.
Particular Groups
Small Medium Large Overall
I Production 333.23
(100)
325.66
(100)
323.21
(100)
328.33
(100)
II Quantity consumed on farm
a) Home consumption 0.79
(0.24)
0.66
(0.20)
0.72
(0.22)
0.73
(0.22)
b) Payment in kind & as gift 1.55
(0.47)
1.14
(0.35)
1.52
(0.47)
1.39
(0.42)
c) Losses (due to breakage &
spoilage)
13.98
(4.19)
14.61
(4.49)
17.42
(5.39)
14.91
(4.54)
III Marketed surplus 316.91
(95.10)
309.25
(94.96)
303.55
(93.92)
311.30
(94.81)
Figures in the parentheses indicate percentages to the total production
Again, it was observed from the table that out of the total production 0.24 percent was
consumed at home in small group, 0.20 percent in medium group and 0.22 percent in
large group; 0.47 percent was used for payment in kind and as gift to relatives in small
group, 0.35 percent in medium group and 0.47 percent in large group. Losses due to
breakage and spoilage were 4.19 percent of the total production in small group, 4.49
percent in medium group and 5.39 percent in large group. This showed that losses
increased with increase in farm size. Total marketed surplus was 316.91 quintal per
hectare (95.10 percent) in small group, 309.25 quintal per hectare (94.95 percent) in
medium group and 303.55 quintal per hectare (93.92 percent) in large group. The
disposal pattern revealed that marketed surplus decreased with increase in farm size. The
reason being higher post harvest losses and lower productivity in large farms resulting
from poor management practices.
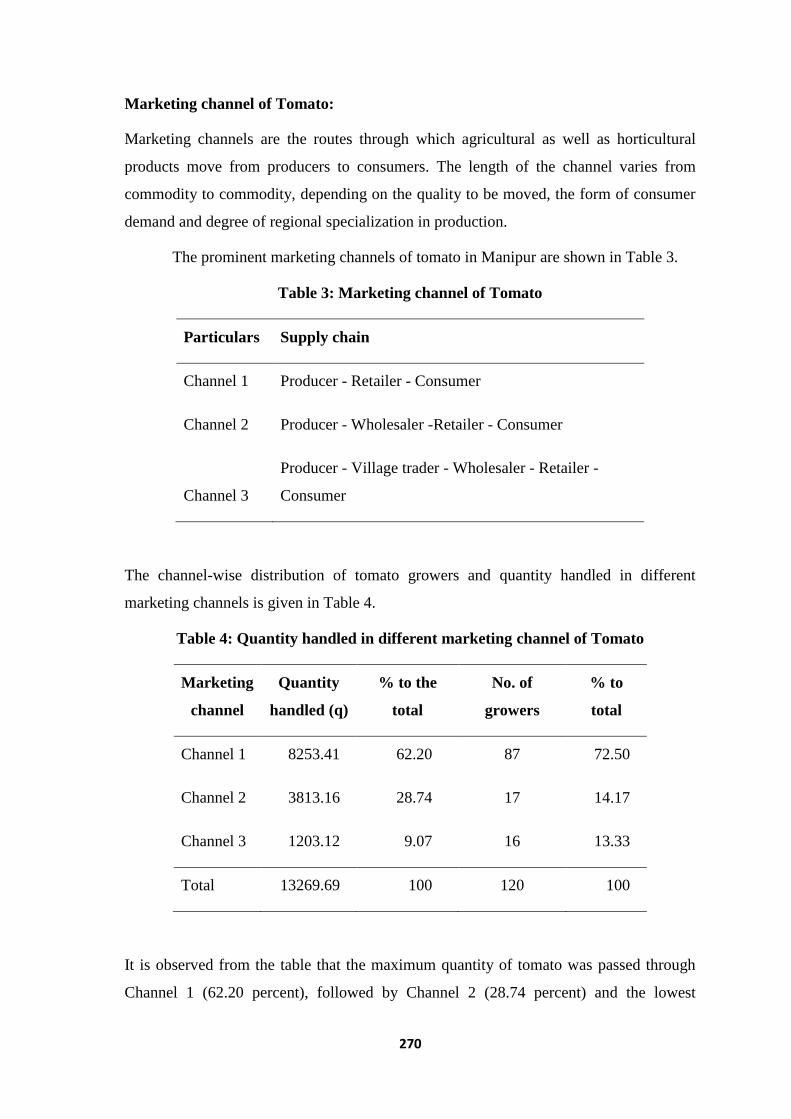
270
Marketing channel of Tomato:
Marketing channels are the routes through which agricultural as well as horticultural
products move from producers to consumers. The length of the channel varies from
commodity to commodity, depending on the quality to be moved, the form of consumer
demand and degree of regional specialization in production.
The prominent marketing channels of tomato in Manipur are shown in Table 3.
Table 3: Marketing channel of Tomato
Particulars Supply chain
Channel 1 Producer - Retailer - Consumer
Channel 2 Producer - Wholesaler -Retailer - Consumer
Channel 3
Producer - Village trader - Wholesaler - Retailer -
Consumer
The channel-wise distribution of tomato growers and quantity handled in different
marketing channels is given in Table 4.
Table 4: Quantity handled in different marketing channel of Tomato
Marketing
channel
Quantity
handled (q)
% to the
total
No. of
growers
% to
total
Channel 1 8253.41 62.20 87 72.50
Channel 2 3813.16 28.74 17 14.17
Channel 3 1203.12 9.07 16 13.33
Total 13269.69 100 120 100
It is observed from the table that the maximum quantity of tomato was passed through
Channel 1 (62.20 percent), followed by Channel 2 (28.74 percent) and the lowest

271
quantity of tomato was sold through Channel 3 (9.07 percent). Again, it was observed
from the table that majority of the farmers market their produce through Channel 1
(72.50 percent), followed by Channel 2 (14.17 percent) and Channel 3 (13.33 percent).
Marketing costs and marketing margins per quintal of tomato for Channel 1 in Manipur
have been presented in Table 5. The farmer’s share in the consumer’s rupee has been
found to be 82.75 percent. Total marketing expenses incurred by farmer is worked out to
be Rs.122.41 per quintal of which losses consumed highest share, i.e., about 67.72
percent of the cost incurred by producer. Cost of transportation ranks second (Rs.24.14
per quintal), followed by weighing (Rs.12.43 per quintal) and then cost of packing
material (Rs.2.94 per quintal). For packing the tomato, the farmers used basket made of
bamboo which cost about Rs. 40 -50 per basket. These baskets can be used for a year.
Transportation is done by bus, auto or Tata DI depending upon the distance. Table shows
that the producer, on an average receives Rs.1945.24 per quintal. It is observed from the
table that tomato producer fetches Rs.1822.83 per quintal as his net margin.
Table 5: Marketing cost and Marketing margin of tomato (Channel 1)
Item Unit Cost
% Consumer
Price
Farm gate price at village Rs/q 1822.83 82.75
sorting Rs/q 0 0
packing material Rs/q 2.94 0.13
Weighing Rs/q 12.43 0.56
transport Rs/q 24.14 1.10
losses Rs/q 82.89 3.76
Total marketing cost Rs/q 122.41 5.56
Farmers' selling price to
Retailer Rs/q 1945.24 88.31
sorting Rs/q 0 0
packing material Rs/q 10.00 0.45

272
loading/ unloading Rs/q 10.00 0.45
spoilage Rs/q 34.22 1.55
transport Rs/q 0.00 0.00
Market fee Rs/q 1.12 0.05
storage Rs/q 13.71 0.62
Total marketing cost Rs/q 69.04 3.13
Marketing margin Rs/q 188.47 8.56
Retailers price to consumer Rs/q 2202.75 100
The retailer has to incur a cost amounting Rs.69.04, i.e., 3.13 percent of retail price to
market one quintal of tomato. Of this cost about 50 percent are losses due to spoilage of
the produce, 20 percent storage and 14 percent each for packing material and
loading/unloading. The cost of packing material used by retailer is Rs.40 per unit of 25
kg capacity. This can be used for 4-5 times. However, he fetches Rs.188.47 which
accounts for 8.56 percent of the price received by him as profit or margin. In Channel 1,
the producers incur more marketing cost than the retailers.
Table 6: Marketing cost and Marketing cost of tomato (Channel 2)
Item Unit Cost
% Consumer
Price
Farm gate price at village Rs/q 1436.04 51.90
sorting Rs/q 0 0
packing material Rs/q 2.11 0.08
Weighing Rs/q 12.50 0.45
transport Rs/q 25.78 0.93
losses Rs/q 90.69 3.28
Total marketing cost Rs/q 131.09 4.74
Farmers' selling price to
wholesaler Rs/q 1567.12 56.63

273
sorting Rs/q 0 0
packing material Rs/q 0 0
loading/ unloading Rs/q 10.21 0.37
spoilage Rs/q 164.91 5.96
transport Rs/q 0.00 0.00
market fee Rs/q 20.91 0.76
storage Rs/q 0 0
Total marketing cost Rs/q 196.03 7.08
Marketing margin Rs/q 386.47 13.97
Wholesaler price to retailer Rs/q 2149.62 77.68
sorting Rs/q 0 0
packing material Rs/q 10.00 0.36
loading/ unloading Rs/q 10.00 0.36
spoilage Rs/q 33.76 1.22
transport Rs/q 28.49 1.03
Market fee Rs/q 2.18 0.08
storage Rs/q 11.02 0.40
Total marketing cost Rs/q 95.44 3.45
Marketing margin Rs/q 522.09 18.87
Retailers price to consumer Rs/q 2767.16 100
Marketing costs and marketing margins per quintal of tomato for Channel 2 in Manipur
have been presented in Table 6. The farmer’s share in the consumer’s rupee has been
found to be 51.90 percent. Total marketing expenses incurred by farmer is worked out to
be Rs.131.09 of which losses consumed highest share, i.e., about 69.19 percent of the
cost incurred by producer. Cost of transportation ranks second (Rs.25.78 per quintal),
followed by weighing (Rs.12.50 per quintal) and then cost of packing material (Rs.2.11
per quintal). Transportation is done by bus, auto or Tata DI depending upon the distance.

274
Table shows that the producer, on an average receives Rs.1567.12 per quintal. It is
observed from the table that tomato producer fetches Rs.1436.04 per quintal as his net
margin.
The wholesaler has to incur a cost amounting Rs. 196.03, i.e., 7.08 percent of the retail
price to market one quintal of tomato. Of this cost about 84 percent is because of losses
due to spoilage of the crop. Loading/unloading (5 percent) and market fee (11 percent)
form the remaining marketing cost. The wholesaler sells the crop to retailers at Rs.
2149.62 per quintal. He, however, fetches Rs.386.47 which accounts for 13.97 percent of
the retail price as his profit.
At retailer’s level, an amount of Rs.95.44 (3.45 percent of the retail price) is required as
marketing cost. It is noted that out of the total marketing cost about 35 percent is
retailer’s loss in the form of spoilage of the fruit. Cost of transportation (30 percent of
the total marketing cost), storage (12 percent), packing material (10 percent),
loading/unloading (10 percent) and market fee (2 percent) constitute the remaining
marketing cost incurred by the retailer. The retail price of one quintal of tomato in
Channel 2 is Rs.2767.16. The retailer, however, fetches Rs.522.09, about 18.87 percent
of the retail price as his profit.
It is observed from the table that maximum marketing cost in this channel is incurred by
wholesaler which is associated with high spoilage losses during storing and handling. It
is further observed that maximum profit is reaped by retailer.

275
Table 7: Marketing cost and Marketing cost of tomato (Channel 3)
Item Unit Cost
% Consumer
Price
Farm gate price at village Rs/q 1321.76 42.81
sorting Rs/q 0 0
packing material Rs/q 3.26 0.11
Weighing Rs/q 0 0
transport Rs/q 0 0
Losses Rs/q 67.72 2.19
Total marketing cost Rs/q 70.98 2.30
Farmers' selling price to local assembly trader
at rural market Rs/q 1392.75 45.10
sorting Rs/q 0 0
packing material Rs/q 0 0
Weighing Rs/q 13.50 0.44
loading/ unloading Rs/q 15.00 0.49
transport Rs/q 64.56 2.09
Total marketing cost Rs/q 93.06 3.01
Marketing margin Rs/q 414.19 13.41
Assembly traders price to wholesaler Rs/q 1900 61.53
sorting Rs/q 0 0
packing material Rs/q 0 0
loading/ unloading Rs/q 10 0.32
spoilage Rs/q 150 5
transport Rs/q 0 0
market fee Rs/q 30.70 0.99
storage Rs/q 0 0
Total marketing cost Rs/q 190.70 6.18
Marketing margin Rs/q 370.15 11.99

276
Wholesaler price to retailer Rs/q 2460.85 79.70
sorting Rs/q 0 0
packing material Rs/q 10 0.32
loading/ unloading Rs/q 10 0.32
spoilage Rs/q 34.88 1.13
transport Rs/q 19.94 0.65
Market fee Rs/q 1.04 0.03
storage Rs/q 6.50 0.21
Total marketing cost Rs/q 82.36 2.67
Marketing margin Rs/q 544.62 17.64
Retailers price to consumer Rs/q 3087.83 100
Marketing costs and marketing margins per quintal of tomato for Channel 3 in Manipur
have been presented in Table 7. The farmer’s share in the consumer’s rupee has been
found to be 42.81 percent. Total marketing expenses incurred by farmer is worked out to
be Rs.70.98 of which losses consumed highest share, i.e., about 95 percent of the cost
incurred by producer. Packing material constitute the remaining 5 percent. Farmers do
not incur any cost towards transportation and weighing. These costs are bore by village
traders. Table shows that the producer, on an average receives Rs.1392.75 per quintal. It
is observed from the table that tomato producer fetches Rs.1321.76 per quintal as his net
margin.
The village traders have to meet Rs.93.06 per quintal, i.e., 3.01 percent of the retail price
as marketing cost. It is noted that about 69 percent of this cost is taken away as
transportation charge. Next importation item of cost is loading/unloading which amounts
to Rs.15 per quintal and weighing (Rs.13.50 per quintal). It is further observed from the
table that the village traders sell their load to the wholesaler at Rs. 1900 per quintal and
earn a profit of Rs.414.19, i.e., 13.41 percent of the retail price.
In this channel, the wholesaler has to incur a cost amounting Rs. 190.70, i.e., 6.18
percent of the retail price to market one quintal of tomato. Of this cost about 78 percent
is because of losses due to spoilage of the crop. Market fee (16 percent) and

277
loading/unloading (6 percent) form the remaining marketing cost. The wholesaler sells
the crop to retailers at Rs. 2460.85 per quintal. He, however, fetches Rs.370.15 which
accounts for 11.99 percent of the retail price as his profit.
At retailer’s level, an amount of Rs.82.36 (2.67 percent of the retail price) is required as
marketing cost. It is noted that out of this marketing cost about 42 percent is retailer’s
loss in the form of spoilage of the fruit. Cost of transportation (24 percent), packing
material (12 percent), loading/unloading (12 percent), storage (7 percent) and market fee
(1 percent) constitute the remaining marketing cost incurred by the retailer. The retail
price of one quintal of tomato in Channel 3 is Rs.3087.83. The retailer, however, fetches
Rs.544.62, about 17.64 percent of the retail price as his profit.
It is observed from the table that maximum marketing cost in this channel is incurred by
wholesaler which is associated with high spoilage losses during storing and handling. It
is further observed that maximum profit is reaped by retailer.
Channel-wise marketing cost and marketing margin of tomato is shown in Table 10.
Marketing cost and marketing margin vary considerably from channel to channel and
were related directly to the length of the channel, i.e., longer the channel, more were the
marketing cost and marketing margin. Channel 3 (Producer - Village trader - Wholesaler
- Retailer - Consumer) being the longer channel and in this channel the highest
marketing cost and marketing margin per quintal, i.e., Rs.437.10 and Rs.1328.97
respectively were observed. Channel 1 (Producer - Retailer - Consumer) is the shortest
channel accounting for lowest marketing cost and marketing margin, i.e., Rs.191.45 and
Rs.188.47 per quintal respectively. Thus it can be concluded that as the length of channel
increases the marketing cost and marketing margin also increases and vice-versa. In
other words, the more the numbers of intermediaries involved between the producer and
the ultimate consumers, the more is the marketing cost and marketing margin of the
intermediaries.
It can also be seen from the table that as the consumer paid the lowest price (Rs.2202.75
per quintal) when they purchased from retailer who purchased directly from the producer
(Channel1) and paid the highest price (Rs.3087.83 per quintal) when three intermediaries
were involved between the producer and consumer i.e. village trader, wholesaler and
retailer in Channel 3. The price paid by the consumer increased with the increase in the

278
length of the marketing channel or with the increased in the numbers of intermediaries
involved between the producer and the ultimate consumers.
Table 8: Marketing cost and Marketing margin of tomato (Rs./q)
Channel 1 Channel 2 Channel 3
Item Cost
%
Consumer
Price Cost
%
Consumer
Price Cost
%
Consumer
Price
Farm gate price 1822.83 82.75 1436.04 51.90 1321.76 42.81
Marketing cost
Producer 122.41 5.56 131.09 4.74 70.98 2.30
Assembler/Trader - - - - 93.06 3.01
Wholesaler - - 196.03 7.08 190.70 6.18
Retailer 69.04 3.13 95.44 3.45 82.36 2.67
Total Marketing Cost 191.45 8.69 422.56 15.27 437.10 14.16
Marketing margin
Assembler/Trader - - - - 414.19 13.41
Wholesaler - - 386.47 13.97 370.15 11.99
Retailer 188.47 8.56 522.09 18.87 544.62 17.64
Total Marketing
Margin 188.47 8.56 908.56 32.83 1328.97 43.04
Consumer Price 2202.75 100 2767.16 100 3087.83 100
Tomato was marketed through various intermediaries starting from producer to the
ultimate consumers. Intermediaries rendered variety of services in the marketing of
tomato with a view to earn some profit. The price spread in the various channels
involved in the marketing of tomato is given in Table 9. Price spread refers to the
difference between the price paid by the consumer and the price received by the producer
for equivalent quantity of farm produce. This price spread consists of the marketing costs

279
and marketing margins of the intermediaries, which ultimately determine the overall
effectiveness of the marketing system. The price spread in Channel 1 was found to be
lowest (Rs.379.92 per quintal) and highest in Channel 3 (Rs.1766.07 per quintal). Thus it
can be concluded that as the length of channel increases the price spread also increases
and vice-versa.
Table 9: Price spread of Tomato (Rs./q)
Particulars Channel 1 Channel 2 Channel 3
Price received by the farmer 1945.24 1567.12 1392.75
Cost incurred 122.41 131.09 70.98
Margin 1822.83 1436.04 1321.76
Village trader's purchase price - - 1392.75
Cost incurred - - 93.06
Margin - - 414.19
Wholesaler's purchase price - 1567.12 1900.00
Cost incurred - 196.03 190.70
Margin - 386.47 370.15
Retailer's purchase price 1945.24 2149.62 2460.85
Cost incurred 69.04 95.44 82.36
Margin 188.47 522.09 544.62
Price paid by consumer 2202.75 2767.16 3087.83
Price spread 379.92 1331.12 1766.07
A comparative view of producer’s share and the shares of the various intermediaries
involved in the different marketing channels is presented in Table 10. It is evident from
the table that the producer’s share in consumer’s rupee decreased with the increase in the
length of the marketing channels. The producer’s net share was the highest (82.75
percent) in Channel 1 while lowest (42.81 percent) in Channel 3. Thus, Channel 3 was
the least favorable to the producers as their share was the lowest in consumer’s rupee. It
was due to the presence of large number of intermediaries in between the producer and

280
the consumer. So, the farmers were not getting good remunerative price for their
produce in Channel 3.
The retail margin was more compared to wholesaler in Channel 2 and both wholesaler
and village trader in Channel 3. The profit margin of the wholesaler was 13.97 percent
and that of retailer was 18.87 percent in Channel 2. While in Channel 3, the profit margin
of the wholesaler was 11.99 percent; that of village trader was 13.41 percent and that of
retailer was 17.64 percent.
Table 10: Share of different agencies during marketing of tomato
Sl.No. Agency Function
Share in final price
Channel
1
Channel
2
Channel
3
1 Retailers Retailing 8.56 18.87 17.64
2 Wholesalers Breaking bulk - 13.97 11.99
3
Village
traders Assembling/transportation - - 13.41
4 Farmers Production 82.75 51.90 42.81
Total
91.31 84.73 85.84
Marketing efficiency was also calculated for the identified three channels by
Conventional method, Shephered’s method and Acharya’s method and presented in
Table 13. The marketing efficiency was found to be highest in Channel 3 (4.04),
followed by Channel 2 (3.15) and least in Channel 1 (1.98) when calculated by
Conventional method (i.e. value added by marketing system divided by total marketing
cost). On the other hand when marketing efficiency was calculated by Shephered’s
method (i.e. retailer’s sale price divided by total marketing cost), it was found to be
highest in Channel 1 (11.51); followed by Channel 3 (7.06) and lowest in Channel 2
(6.55). Again, when calculated by Acharya’s method (i.e. price received by farmers
divided by total marketing cost and margin), it was found to be highest in Channel 1
(4.80); followed by Channel 2 (1.08 ) and lowest in Channel 3 (0.75).

281
Table 11: Measurement of Marketing efficiency of Tomato
Sl.No. Particulars Unit
Channel
1
Channel
2
Channel
3
1 Retailer's sale price (RP) Rs./q 2202.75 2767.16 3087.83
2 Total marketing cost (MC) Rs./q 191.45 422.56 437.10
3 Total margins of intermediaries (MM) Rs./q 188.47 908.56 1328.97
4 Price received by farmers (FP) Rs./q 1822.83 1436.04 1321.76
5
Value added by the marketing system
(1-4) Rs./q 379.92 1331.12 1766.07
Index of Marketing Efficiency
Convention method (E) (5/2) Ratio 1.98 3.15 4.04
Shephered's method (ME) (1/2) Ratio 11.51 6.55 7.06
Acharya's method (MME) [4/(2+3)] Ratio 4.80 1.08 0.75
Based on the information furnished by the sample respondents, the constraints being
faced by them in the marketing of tomato were ranked and prioritized by using Garrett’s
ranking method, and have been recorded in Tables below.

282
Table 12: Constraints perceived by the farmers in marketing of Tomato
Constraints
Mean
score Rank
Perishability 76.54 1
Transportation 73.04 2
Presence of exploitative middlemen 72.42 3
Low price 58.50 4
Bands, blockade, strikes, curfew 56.49 5
Lack of market information 55.08 6
Lack of knowledge of proper grading &
packaging 47.50 7
Inadequate facilities in market 44.50 8
Lack of storage facilities 34.55 9
Non-availability of market credit 30.43 10
Faulty weighment 29.49 11
No facilities for personal stay at market 21.53 12
Perishable nature of the product was ranked as the first major constraints (with a mean
score of 76.54) faced by the tomato farmers in the marketing of the product (Table 12).
Tomato is highly perishable; the quality of produce deteriorates after sometime of their
harvest, so the farmers have to market their produce as soon as possible at the prevailing
market price even if the price is very low. Next second rank with the score value of 73.04
was given to the problem of transportation. The farmers have to bring their produce to
the local as well as wholesaler market and transportation posed a major problem as the
transportation charge is very high and there are not enough facilities, such as trucks for
bringing their produce to the market. Third rank with the score value of 72.42 was given
to presence of exploitative middlemen. At the market place the farmers are exploited by
the middlemen by offering low prices. The farmers are compelled to accept the price
offered by the middlemen as their bargaining power is weak. The farmers cannot
negotiate since they may be denied even a low price and their products could be liable to

283
rotting, since it is perishable. Moreover, farmers could not keep their product for long
because they did not have storage facilities. Low price, bands, blockade, strikes, curfew,
lack of market information, lack of knowledge of proper grading & packaging,
inadequate facilities in market, lack of storage facilities, non-availability of market
credit, faulty weighment and no facilities for personal stay at market were allotted fourth,
fifth, sixth, seventh, eighth, ninth, tenth, eleventh and twelfth ranks with mean score
values of 58.50, 56.49, 55.08, 47.50, 44.50, 34.55, 30.43, 29.49 and 21.53 respectively.
Table 13: Constraints perceived by the retailer in marketing of Tomato
Constraints
Mean
score Rank
Inadequate facilities in market 77.40 1
Band, blockage, strikes, curfew 68.80 2
Perishability 58.80 3
Lack of storage facilities 55.20 4
Payment of unauthorized fee
(bribing) 52.40 5
Non-availability of market credit 49.47 6
Lack of market information 37.53 7
Transportation 26.60 8
High market fee 24.80 9
Inadequate facilities in market were ranked as the first major constraints (with a mean
score of 77.40) faced by the tomato retailers in the marketing of the product (Table 13).
There is lack of facilities in the market, such as limited seats, no place for parking, dirty
market place, difficulty during rain, etc. These posed a major problem to the tomato
retailers. Next second rank with the score value of 68.80 was given to the problem of
bands, blockade, strikes, curfew, etc. which hinder business. Third rank with the score
value of 58.80 was given to the problem of perishability of the product. Due to highly
perishable nature of tomato, a delay of one or two days in its marketing can cause
considerable losses. Lack of storage facilities, payment of unauthorized fee (bribing),
non-availability of market credit, lack of market information, transportation and high

284
market fee were allotted fourth, fifth, sixth, seventh, eighth, ninth ranks with mean score
values of 55.20, 49.47, 37.53, 26.60 and 24.80 respectively. There are no adequate
storage facilities in the market, so the retailers have to sell their produce on that day
itself, otherwise the quality will deteriorate and they will incur loss. The retailers have to
pay many unauthorized fees to many persons so that they can sell their produce. Those
who do not pay these fees are either beaten up or their produce thrown away and not
allow to seat and sell their produce.
Table 14: Constraints perceived by the wholesaler in marketing of Tomato
Constraints
Mean
score Rank
Bands, blockade, strike, curfew 76.20 1
Perishability 66.30 2
Lack of storage facilities 59.10 3
Inadequate facilities in market 58.00 4
Payment of unauthorized fee
(bribing) 57.30 5
Non-availability of market credit 42.20 6
Small size of market 39.40 7
High market fee 26.20 8
Lack of market information 23.80 9
Bands, blockade, strikes, curfew, was ranked as the first major constraints (with a mean
score of 76.20) faced by the tomato wholesaler in the marketing of the product (Table
14). Next second rank with the score value of 66.30 was given to the problem of
perishability of the product. Third rank with the score value of 59.10 was given to the
problem of lack of storage facilities. Due to highly perishable nature of tomato, the
produce cannot be kept for long. If bands, blockade, strikes, curfew, etc. occurred, the
market will be close for the day and this will hinder the business and the produce may be
loss. Again, lack of adequate storage facilities compelled the wholesaler to get rid of
their produce as soon as possible. Inadequate facilities in market, payment of

285
unauthorized fee (bribing), non-availability of market credit, small size of market, high
market fee and lack of market information were allotted fourth, fifth, sixth, seventh,
eighth, ninth ranks with mean score values of 58.00, 57.30, 42.20, 39.40, 26.20 and
23.80 respectively.
Suggestions of farmers, retailers and wholesaler for increasing the marketing efficiency
of tomato are presented in Table 15, Table 16 and Table 17 respectively.
Table 15: Suggestions of farmers for increasing marketing efficiency of
tomato
Sl.No. Suggestions
1 Quick and efficient means of transport with good packing.
2 Introduction of an efficient market regulation.
3 Intervention by State Government agencies by fixing reasonable
price.
4 Organization of intensive training related to post harvest handling
of the produce at government level.
5 Establishment of adequate cold storage facilities.
6 Provision of adequate facilities in market.
7 Improvement of market information delivery system.
8 Numbers of bands, blockade, strikes, curfew, etc. should be
reduced.
The transportation facilities need to be strengthened especially for transporting vegetable
to consuming market so as to take benefit of higher prices in these markets. The defects
and malpractices in existence in most of the markets can be improved by exercising
proper control over the markets by the government officials. Regulated markets should
be developed. The State Government agencies should fix reasonable and remunerative
prices for the produce. The Government should organize intensive training related to post
harvest handling of the produce. The storage facilities need to be created which suits all
vegetables for storage during the glut season which will help to decrease intra-seasonal
price variation. Improvement in market infrastructure such as cold storage, godowns,

286
loading and unloading facilities mechanically, weighing facilities and improving
transparency through supervision and making availability of up-to-date market
information to the farmers is the need of the hour. Bands, blockade, strikes, curfew, etc.
hinders business so the Government as well as the private organization should try to
avoid such kind of unwanted situations as far as possible.
Table 16: Suggestions of retailer for increasing marketing efficiency of
tomato
Sl.No. Suggestions
1 Provision of adequate facilities in market.
2 Numbers of bands, blockade, strikes, curfew, etc. should be
reduced.
3 Establishment of adequate cold storage facilities.
4 Punishment of those taking and demanding unauthorized fees.
5 Market credit should be made easily available.
Table 17: Suggestions of wholesaler for increasing marketing efficiency of
tomato
Sl.No. Suggestions
1 Numbers of bands, blockade, strikes, curfew, etc. should be
reduced.
2 Establishment of adequate cold storage facilities.
3 Provision of adequate facilities in market.
4 Punishment of those taking and demanding unauthorized fees.
5 Market credit should be made easily available.
Provision of adequate marketing facilities such as proper seating place, packing space for
vehicles, clean market place, etc. so that the retailers and the wholesalers do not face any
difficulty in marketing their produce. Bands, blockade, strikes, curfew, etc. hinders
business so the Government as well as the private organization should try to avoid such
kind of unwanted situations as far as possible. The retailers and the wholesalers have to

287
pay many unwanted or illegal fees to many persons so that they can market their
produce. They should unite together and stand against these persons and make efforts to
get these illegal charges removed. The government should punish those persons
demanding and taking illegal fees from the retailers. Adequate cold storage facilities
should be established in the market. Market credit should be made available easily and
quickly.
3.2 CABBAGE
The cabbage sample farmers were classified into three categories, viz., (i) Small having
upto 0.99 hectares of area under cabbage; (ii) Medium having 1 – 1.49 hectares of area
under cabbage and (iii) Large having 1.5 hectares and above area under cabbage. The
information on size group-wise distribution of sample farmers is presented in Table 18.
Of the total number of 120 sample farmers, 67.50 percent were in small group operating
about 35.48 percent of the total area, while large group accounting for about only 10
percent of the total sample farmers shared about 27.06 percent area. Farmers in Medium
group formed about 22.5 percent operating 37.46 percent of the total area. The average
farm size was 0.32 hectares, 1 hectare and 1.63 hectares respectively in small, medium
and large groups with an overall average of 0.60 hectares.
Table 18: Distribution of sample Cabbage cultivators
Sl. Category Holding
Size (ha.)
No. of
cultivators
Total area
under
cabbage (ha.)
Average area
under
cabbage (ha.)
1 Small 0 - 0.99 81
(67.50)
25.575
(35.48)
0.32
2 Medium 1 - 1.49 27
(22.50)
27.00
(37.46)
1.00
3 Large 1.5 &
above
12
(10.00)
19.50
(27.06)
1.63
4 Total 120
(100)
72.075
(100)
0.60
Figures in the parentheses indicate percentages to the total

288
The per hectare disposal pattern of cabbage is shown in Table 19. The farmers marketed
almost all the produce (96.13 percent) from the farm after using 0.47 percent for home
consumption and 0.46 percent for payment in kind and as gift to relatives. It was
observed that losses due to breakage and spoilage accounted for 2.94 percent of the total
production.
Table 19: Per Hectare Disposal of Cabbage (Quantity in quintals)
Sl.
No.
Particular Groups
Small Medium Large Overall
I Production 419.08
(100)
215.20
(100)
176.56
(100)
277.09
(100)
II Quantity consumed on farm
a) Home consumption 2.32
(0.55)
0.83
(0.38)
0.60
(0.34)
1.30
(0.47)
b) Payment in kind & as gift 2.46
(0.59)
0.73
(0.34)
0.46
(0.26)
1.27
(0.46)
c) Losses (due to breakage &
spoilage)
7.61
(1.82)
8.39
(3.90)
8.54
(4.84)
8.15
(2.94)
III Marketed surplus 406.69
(97.04)
205.25
(95.38)
166.96
(94.56)
266.37
(96.13)
Figures in the parentheses indicate percentages to the total production
Again, it was observed from the table that out of the total production 0.55 percent was
consumed at home in small group, 0.38 percent in medium group and 0.34 percent in
large group; 0.59 percent was used for payment in kind and as gift to relatives in small
group, 0.34 percent in medium group and 0.26 percent in large group. Losses due to
breakage and spoilage were 1.82 percent of the total production in small group, 3.90
percent in medium group and 4.84 percent in large group. This showed that losses
increased with increase in farm size. Total marketed surplus was 406.69 quintal per
hectare (97.04 percent) in small group, 205.25 quintal per hectare (95.38 percent) in
medium group and 166.96 quintal per hectare (94.56 percent) in large group. The
disposal pattern revealed that marketed surplus decreased with increase in farm size.

289
Marketing channel of Cabbage:
Marketing channels are the routes through which agricultural as well as horticultural
products move from producers to consumers. The length of the channel varies from
commodity to commodity, depending on the quality to be moved, the form of consumer
demand and degree of regional specialization in production.
The prominent marketing channels of cabbage in Manipur are shown in Table 20. Most
of the farmers in hilly region of Manipur market their produce through Channel 1 and
Channel 4 while those in the plain regions market their produce through Channel 2 and
Channel 3.
Table 20: Marketing channel of Cabbage
Particulars Supply chain
Channel 1 Producer - Consumer
Channel 2 Producer - Retailer - Consumer
Channel 3 Producer - Wholesaler -Retailer - Consumer
Channel 4
Producer - Village trader - Wholesaler - Retailer -
Consumer
The channel-wise distribution of cabbage growers and quantity handled in different
marketing channels is given in Table 21.
Table 21: Quantity handled in different marketing channel of Cabbage
Marketing
channel
Quantity handled
(q)
% to the
total
No. of
growers
% to
total
Channel 1 1618.96 8.48 11 9.17
Channel 2 2541.90 13.31 13 10.83
Channel 3 8942.60 46.82 46 38.33
Channel 4 5997.30 31.40 50 41.67

290
Total 19100.76 100 120 100
It is observed from the table that the maximum quantity of cabbage was passed through
Channel 3 (46.82 percent), followed by Channel 4 (31.40 percent), Channel 2 (13.31
percent) and the lowest quantity of cabbage was sold through Channel 1 (8.48 percent).
Again, it was observed from the table that majority of the farmers market their produce
through Channel 4 (41.67 percent), followed by Channel 3 (38.33 percent), Channel 2
(10.83 percent) and the least through Channel 1 (9.17 percent).
Table 22: Marketing cost and Marketing margin of cabbage (Channel 1)
Item
Unit Cost % Consumer Price
Farm gate price at village Rs/q 662.02 94.57
Sorting and Cleaning Rs/q 12.41 1.77
Packing material Rs/q 2.23 0.32
Weighing Rs/q 0.00 0.00
Transport Rs/q 18.68 2.67
Losses due to spoilage Rs/q 4.66 0.67
Total marketing cost Rs/q 37.98 5.43
Farmers' selling price to Consumer Rs/q 700.00 100.00
Marketing costs and marketing margins per quintal of cabbage for Channel 1 in Manipur
have been presented in Table 22. The farmer’s share in the consumer’s rupee has been
found to be 94.57 percent. Total marketing expenses incurred by farmer is worked out to
be Rs.37.98 of which transportation consumed highest share, i.e., about 49 percent of the
cost incurred by producer. Sorting and cleaning (33 percent) ranks second, followed by
losses (12 percent) and then cost of packing material (6 percent). For packing the
cabbage, the farmers used gunny bags which cost about Rs. 10 per bag and the mouth of
the bags are tied with plastic ropes. These bags can be used for a year. Transportation is
done by bus, auto or Tata DI depending upon the distance. In this channel, the producers
bring the produce to the local market and sell directly to the consumer. Table shows that
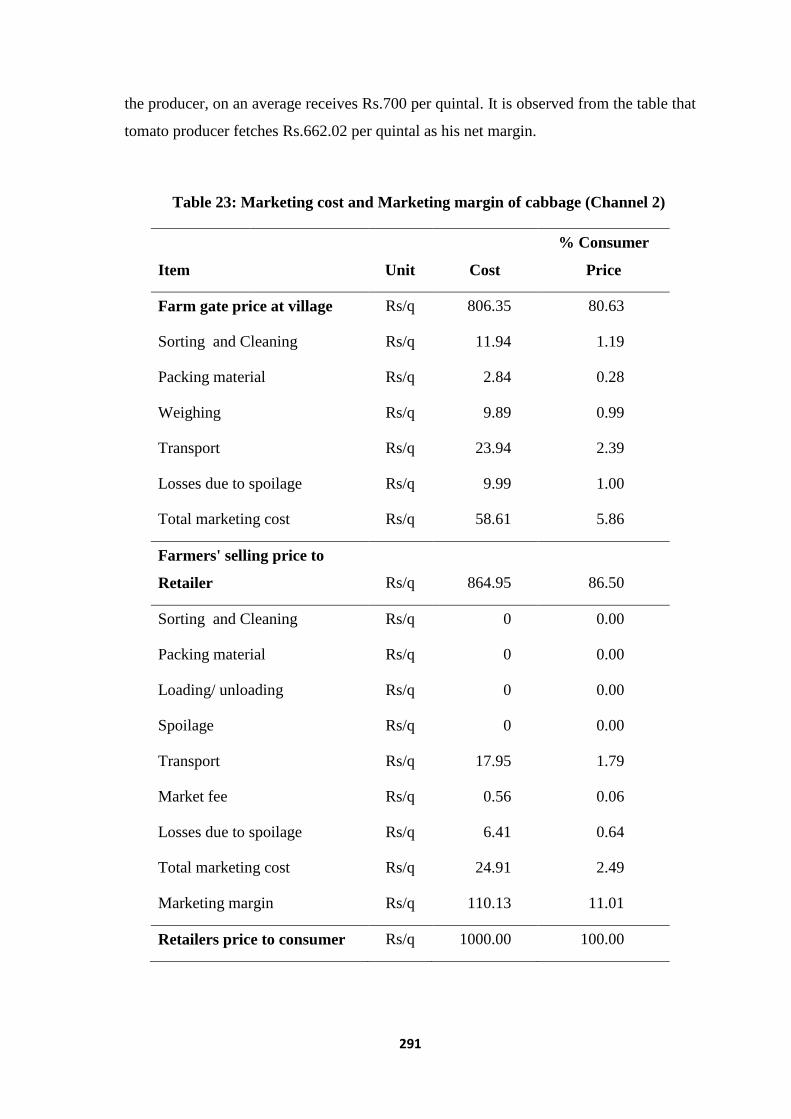
291
the producer, on an average receives Rs.700 per quintal. It is observed from the table that
tomato producer fetches Rs.662.02 per quintal as his net margin.
Table 23: Marketing cost and Marketing margin of cabbage (Channel 2)
Item
Unit Cost
% Consumer
Price
Farm gate price at village Rs/q 806.35 80.63
Sorting and Cleaning Rs/q 11.94 1.19
Packing material Rs/q 2.84 0.28
Weighing Rs/q 9.89 0.99
Transport Rs/q 23.94 2.39
Losses due to spoilage Rs/q 9.99 1.00
Total marketing cost Rs/q 58.61 5.86
Farmers' selling price to
Retailer Rs/q 864.95 86.50
Sorting and Cleaning Rs/q 0 0.00
Packing material Rs/q 0 0.00
Loading/ unloading Rs/q 0 0.00
Spoilage Rs/q 0 0.00
Transport Rs/q 17.95 1.79
Market fee Rs/q 0.56 0.06
Losses due to spoilage Rs/q 6.41 0.64
Total marketing cost Rs/q 24.91 2.49
Marketing margin Rs/q 110.13 11.01
Retailers price to consumer Rs/q 1000.00 100.00

292
Marketing costs and marketing margins per quintal of cabbage for Channel 2 in Manipur
have been presented in Table 23. The farmer’s share in the consumer’s rupee has been
found to be 80.63 percent. Total marketing expenses incurred by farmer is worked out to
be Rs. 58.61 of which transportation consumed highest share, i.e., about 41 percent of
the cost incurred by producer. Cost of sorting and cleaning (20 percent) ranks second,
followed by losses (17 percent), cost of weighing (16 percent) and then cost of packing
material (5 percent). Table shows that the producer, on an average receives Rs. 864.95
per quintal. It is observed from the table that tomato producer fetches Rs.806.35 per
quintal as his net margin.
The retailer has to incur a cost amounting Rs. 24.91, i.e., 2.49 percent of retail price to
market one quintal of tomato. Of this cost about 72 percent is incurred as transportation
cost, 26 percent storage and 2 percent market fee. However, he fetches Rs. 110.13 which
accounts for 11.01 percent of the price received by him as profit or margin. In Channel 2,
the producers incur more marketing cost than the retailers.

293
Table 24: Marketing cost and Marketing margin of cabbage (Channel 3)
Item
Unit Cost
% Consumer
Price
Farm gate price at village Rs/q 753.11 68.43
sorting & cleaning Rs/q 11.56 1.05
packing material Rs/q 2.13 0.19
Weighing Rs/q 10.00 0.91
transport Rs/q 22.39 2.03
losses Rs/q 9.31 0.85
Total marketing cost Rs/q 55.39 5.03
Farmers' selling price to
wholesaler Rs/q 808.50 73.46
sorting Rs/q 0 0.00
packing Rs/q 0 0.00
loading/ unloading Rs/q 9.89 0.90
spoilage Rs/q 7.61 0.69
transport Rs/q 11.12 1.01
market fee Rs/q 1.78 0.16
storage Rs/q 6.00 0.55
Total marketing cost Rs/q 36.40 3.31
Marketing margin Rs/q 105.10 9.55
Wholesaler price to retailer Rs/q 950.00 86.32
sorting Rs/q 0 0.00
packing Rs/q 0 0.00
loading/ unloading Rs/q 0 0.00
spoilage Rs/q 0 0.00

294
transport Rs/q 18.00 1.64
Market fee Rs/q 0.42 0.04
storage Rs/q 4.50 0.41
Total marketing cost Rs/q 22.92 2.08
Marketing margin Rs/q 127.64 11.60
Retailers price to consumer Rs/q 1100.56 100.00
Marketing costs and marketing margins per quintal of cabbage for Channel 3 in Manipur
have been presented in Table 24. The farmer’s share in the consumer’s rupee has been
found to be 68.43 percent. Total marketing expenses incurred by farmer is worked out to
be Rs. 55.39 of which transportation consumed highest share, i.e., about 40 percent of
the cost incurred by producer. Cost of sorting and cleaning (21 percent) ranks second,
followed by weighing (18 percent), losses due to spoilage and breakage (17 percent) and
then cost of packing material (4 percent). Transportation is done by bus, auto or Tata DI
depending upon the distance. Table shows that the producer, on an average receives Rs.
808.50 per quintal. It is observed from the table that cabbage producer fetches Rs. 753.11
per quintal as his net margin.
The wholesaler has to incur a cost amounting Rs. 36.40, i.e., 3.31 percent of the retail
price to market one quintal of cabbage. Of this cost about 31 percent is incurred as
transportation cost. Loading/unloading (27 percent), losses due to spoilage and breakage
(21 percent), storage (16 percent) and market fee (5 percent) form the remaining
marketing cost. The wholesaler sells the crop to retailers at Rs. 950 per quintal. He,
however, fetches Rs.105.10 which accounts for 9.55 percent of the retail price as his
profit.
At retailer’s level, an amount of Rs.22.92 (2.08 percent of the retail price) is required as
marketing cost. It is noted that out of the total marketing cost about 78 percent is
incurred as transportation cost. Storage (20 percent) and market fee (2 percent)
constitute the remaining marketing cost incurred by the retailer. The retail price of one
quintal of cabbage in Channel 3 is Rs.1100.56. The retailer, however, fetches Rs.127.64,
about 11.60 percent of the retail price as his profit.

295
It is observed from the table that maximum marketing cost in this channel is incurred by
producer. It is further observed that maximum profit is reaped by retailer.
Table 25: Marketing cost and Marketing margin of cabbage (Channel 4)
Item
Unit Cost % Consumer Price
Farm gate price at village Rs/q 644.12 53.73
Sorting
Rs/q 13.92 1.16
packing material Rs/q 1.95 0.16
Weighing
Rs/q 0.00 0.00
transport
Rs/q 9.49 0.79
Losses
Rs/q 9.12 0.76
Total marketing cost Rs/q 34.48 2.88
Farmers' selling price to local
assembly trader at rural market Rs/q 678.61 56.61
Sorting
Rs/q 0 0.00
packing material Rs/q 4.56 0.38
Weighing
Rs/q 10.00 0.83
loading/ unloading Rs/q 7.13 0.59
transport
Rs/q 35.67 2.98
Total marketing cost Rs/q 57.36 4.78
Marketing margin Rs/q 114.03 9.51
Assembly traders price to wholesaler Rs/q 850.00 70.91
Sorting
Rs/q 0 0.00
packing material Rs/q 0 0.00
loading/ unloading Rs/q 8.76 0.73
Spoilage
Rs/q 6.11 0.51
transport
Rs/q 0 0.00
market fee Rs/q 1.56 0.13

296
Storage
Rs/q 6.00 0.50
Total marketing cost Rs/q 22.43 1.87
Marketing margin Rs/q 127.57 10.64
Wholesaler price to retailer Rs/q 1000.00 83.42
Sorting
Rs/q 0 0.00
packing material Rs/q 0 0.00
loading/ unloading Rs/q 0 0.00
Spoilage
Rs/q 0 0.00
transport
Rs/q 14.14 1.18
Market fee Rs/q 0.57 0.05
Storage
Rs/q 4.00 0.33
Total marketing cost Rs/q 18.71 1.56
Marketing margin Rs/q 180.03 15.02
Retailers price to consumer Rs/q 1198.74 100.00
Marketing costs and marketing margins per quintal of cabbage for Channel 4 in Manipur
have been presented in Table 25. The farmer’s share in the consumer’s rupee has been
found to be 53.73 percent. Total marketing expenses incurred by farmer is worked out to
be Rs.34.48 of which sorting and cleaning consumed highest share, i.e., about 40 percent
of the cost incurred by producer. Transportation cost (28 percent), losses due to spoilage
and breakage (26 percent) and packing material (6 percent) constitute the remaining
marketing cost incurred by the farmers. Farmers do not incur any cost towards
weighing. This cost is bore by village traders. Table shows that the producer, on an
average receives Rs.678.61 per quintal. It is observed from the table that cabbage
producer fetches Rs.644.12 per quintal as his net margin.
The village traders have to meet Rs.57.36 per quintal, i.e., 4.78 percent of the retail price
as marketing cost. It is noted that about 62 percent of this cost is taken away as
transportation charge. Next importation item of cost is weighing which amounts to Rs.10
per quintal; loading/unloading (Rs.7.13 per quintal) and packing material (Rs.4.56 per
quintal). It is further observed from the table that the village traders sell their load to the
297
wholesaler at Rs. 850 per quintal and earn a profit of Rs.114.03, i.e., 9.51 percent of the
retail price.
In this channel, the wholesaler has to incur a cost amounting Rs. 22.43, i.e., 1.87 percent
of the retail price to market one quintal of cabbage. Of this cost about 39 percent is
loading/ unloading charges. Storage (27 percent), losses due to spoilage (26 percent) and
market fee (7 percent) form the remaining marketing cost. The wholesaler sells the crop
to retailers at Rs. 1000 per quintal. He, however, fetches Rs.127.57 which accounts for
10.64 percent of the retail price as his profit.
At retailer’s level, an amount of Rs.18.71 (1.56 percent of the retail price) is required as
marketing cost. It is noted that out of this marketing cost about 76 percent is incurred as
transportation cost. Cost of storage (21 percent) and market fee (3 percent) constitute the
remaining marketing cost incurred by the retailer. The retail price of one quintal of
cabbage in Channel 4 is Rs.1198.74. The retailer, however, fetches Rs.180.03, about
15.02 percent of the retail price as his profit. It is observed from the table that maximum
marketing cost in this channel is incurred by village trader which is associated with high
transportation cost. It is further observed that maximum profit is reaped by retailer.
Channel-wise marketing cost and marketing margin of cabbage is shown in Table 26.
Marketing cost and marketing margin vary considerably from channel to channel and
were related directly to the length of the channel, i.e., longer the channel, more were the
marketing cost and marketing margin. Channel 4 (Producer - Village trader - Wholesaler
- Retailer - Consumer) being the longest channel and in this channel the highest
marketing cost and marketing margin per quintal, i.e., Rs. 132.98 and Rs. 421.63
respectively were observed. Channel 1 (Producer - Consumer) is the shortest channel
accounting for lowest marketing cost, i.e., Rs.37.98 per quintal. Channel 2 (Producer -
Retailer - Consumer) is the next shortest channel accounting for lower marketing cost
and marketing margin, i.e., Rs. 83.52 and Rs. 110.13 per quintal respectively. Thus it can
be concluded that as the length of channel increases the marketing cost and marketing
margin also increases and vice-versa.

298
Table 26: Marketing cost and Marketing margin of cabbage (Rs./q)
Channel 1 Channel 2 Channel 3 Channel 4
Item
Cost
% Consumer
Price Cost
% Consumer
Price Cost
% Consumer
Price Cost
% Consumer
Price
Farm gate price 662.02 94.57 806.35 80.63 753.11 68.43 644.12 53.73
Marketing cost
Producer
37.98 5.43 58.61 5.86 55.39 5.03 34.48 2.88
Assembler/Trader - - - - - - 57.36 4.78
Wholesaler - - - - 36.40 3.31 22.43 1.87
Retailer
- - 24.91 2.49 22.92 2.08 18.71 1.56
Total Marketing Cost 37.98 5.43 83.52 8.35 114.71 10.42 132.98 11.09
Marketing margin
Assembler/Trader - - - - - - 114.03 9.51
Wholesaler - - - - 105.10 9.55 127.57 10.64
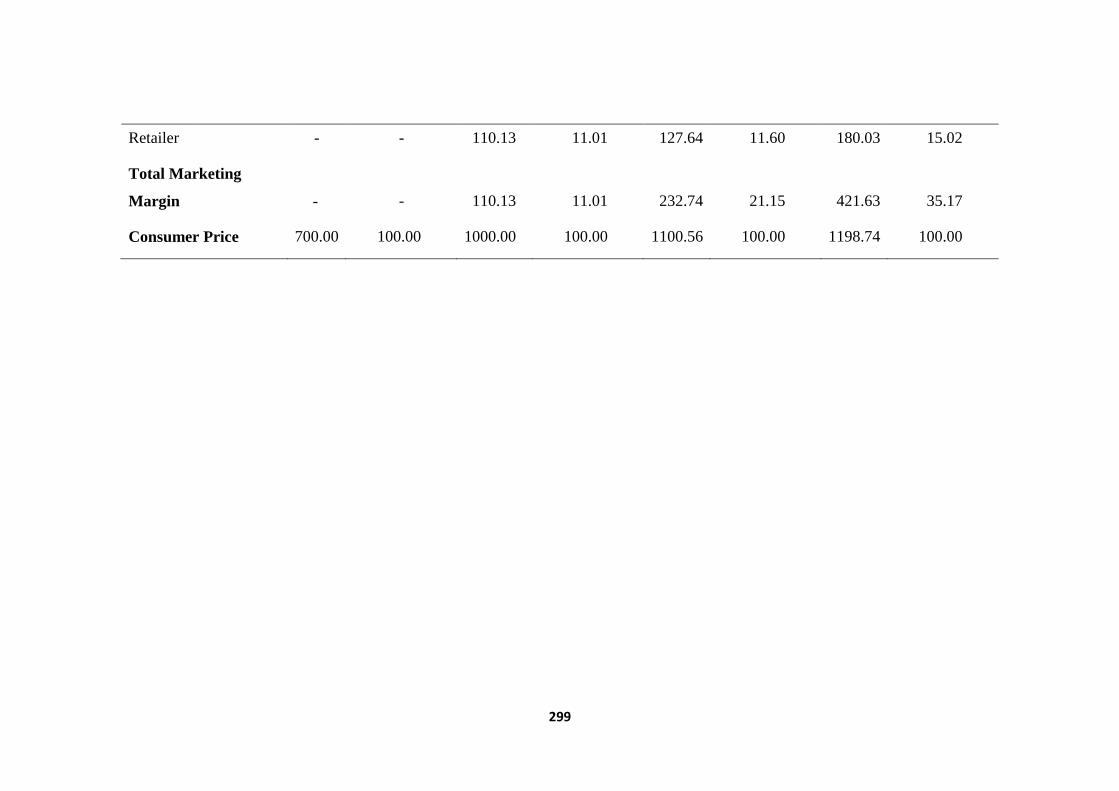
299
Retailer
- - 110.13 11.01 127.64 11.60 180.03 15.02
Total Marketing
Margin - - 110.13 11.01 232.74 21.15 421.63 35.17
Consumer Price 700.00 100.00 1000.00 100.00 1100.56 100.00 1198.74 100.00

300
In other words, the more the numbers of intermediaries involved between the producer and
the ultimate consumers, the more is the marketing cost and marketing margin of the
intermediaries.
It can also be seen from the table that as the consumer paid the lowest price (Rs.700 per
quintal) when they purchased directly from the producer (Channel 1) and paid the highest
price (Rs.1198.74 per quintal) when three intermediaries were involved between the producer
and consumer i.e. village trader, wholesaler and retailer in Channel 4. The price paid by the
consumer increased with the increase in the length of the marketing channel or with the
increased in the numbers of intermediaries involved between the producer and the ultimate
consumers.
Cabbage was marketed through various intermediaries starting from producer to the ultimate
consumers. Intermediaries rendered variety of services in the marketing of cabbage with a
view to earn some profit. The price spread in the various channels involved in the marketing
of cabbage is given in Table 27.
Table 27: Price spread of cabbage (Rs./q)
Particulars
Channel
1
Channel
2
Channel
3
Channel
4
Price received by the
farmer 700.00 864.95 808.50 678.61
Cost incurred 37.98 58.61 55.39 34.48
Margin
662.02 806.35 753.11 644.12
Village trader's purchase
price - - - 678.61
Cost incurred - - - 57.36
Margin
- - - 114.03
Wholesaler's purchase
price - - 808.50 850
Cost incurred - - 36.40 22.43
Margin
- - 105.10 127.57

301
Retailer's purchase price - 864.95 950.00 1000.00
Cost incurred - 24.91 22.92 18.71
Margin
- 110.13 127.64 180.03
Price paid by consumer 700.00 1000.00 1100.56 1198.74
Price spread 37.98 193.65 347.45 554.62
Price spread refers to the difference between the price paid by the consumer and the price
received by the producer for equivalent quantity of farm produce. This price spread consists
of the marketing costs and marketing margins of the intermediaries, which ultimately
determine the overall effectiveness of the marketing system. The price spread in Channel 1
was found to be lowest (Rs. 37.98 per quintal); followed by Channel 2 (Rs. 193.65 per
quintal) and Channel 3 (Rs. 347.45 per quintal); and highest in Channel 4 (Rs. 554.62 per
quintal). Thus it can be concluded that as the length of channel increases the price spread also
increases and vice-versa.
Table 28: Share of different agencies during marketing of cabbage
Sl.
No. Agency Function
Share in final price
Channel 1
Channel
2
Channel
3
Channel
4
1 Retailers Retailing - 11.01 11.60 15.02
2 Wholesalers Breaking bulk - - 9.55 10.64
3
Village
traders Assembling/transportation - - -
9.51
4 Farmers Production 94.57 80.63 68.43 53.73
Total
94.57 91.65 89.58 88.91
A comparative view of producer’s share and the shares of the various intermediaries involved
in the different marketing channels is presented in Table 28. It is evident from the table that
the producer’s share in consumer’s rupee decreased with the increase in the length of the
marketing channels. The producer’s net share was the highest (94.57 percent) in Channel 1

302
while lowest (53.73 percent) in Channel 4. Thus, Channel 4 was the least favourable to the
producers as their share was the lowest in consumer’s rupee. It was due to the presence of
large number of intermediaries in between the producer and the consumer. So, the farmers
were not getting good remunerative price for their produce in Channel 4.
The retail margin was more compared to wholesaler in Channel 3 and both wholesaler and
village trader in Channel 4. The profit margin of the wholesaler was 9.55 percent and that of
retailer was 11.60 percent in Channel 3. While in Channel 4, the profit margin of the village
trader was 9.51 percent; and that of wholesaler was 10.64 percent and that of retailer was
15.02 percent.
Marketing efficiency was also calculated for the identified three channels by Conventional
method, Shephered’s method and Acharya’s method and presented in Table 29. The
marketing efficiency was found to be highest in Channel 4 (4.17), followed by Channel 3
(3.03) and Channel 2 (2.32)and least in Channel 1 (1.00) when calculated by Conventional
method (i.e. value added by marketing system divided by total marketing cost). On the other
hand when marketing efficiency was calculated by Shephered’s method (i.e. retailer’s sale
price divided by total marketing cost), it was found to be highest in Channel 1 (18.43);
followed by Channel 2 (11.97) and Channel 3 (9.59) and lowest in Channel 4 (9.01). Again,
when calculated by Acharya’s method (i.e. price received by farmers divided by total
marketing cost and margin), it was found to be highest in Channel 1 (17.43); followed by
Channel 2 (4.16) and Channel 3 (2.17 ) and lowest in Channel 4 (1.16).
Table 29: Measurement of Marketing efficiency of Cabbage
Sl.No. Particulars Unit
Channel
1
Channel
2
Channel
3
Channel
4
1 Retailer's sale price (RP) Rs./q 700.00 1000.00 1100.56 1198.74
2 Total marketing cost (MC) Rs./q 37.98 83.52 114.71 132.98
3
Total margins of intermediaries
(MM) Rs./q - 110.13 232.74
421.63
4 Price received by farmers (FP) Rs./q 662.02 806.35 753.11 644.12
5
Value added by the marketing
system (1-4)
Rs./q
37.98
193.65
347.45
554.62
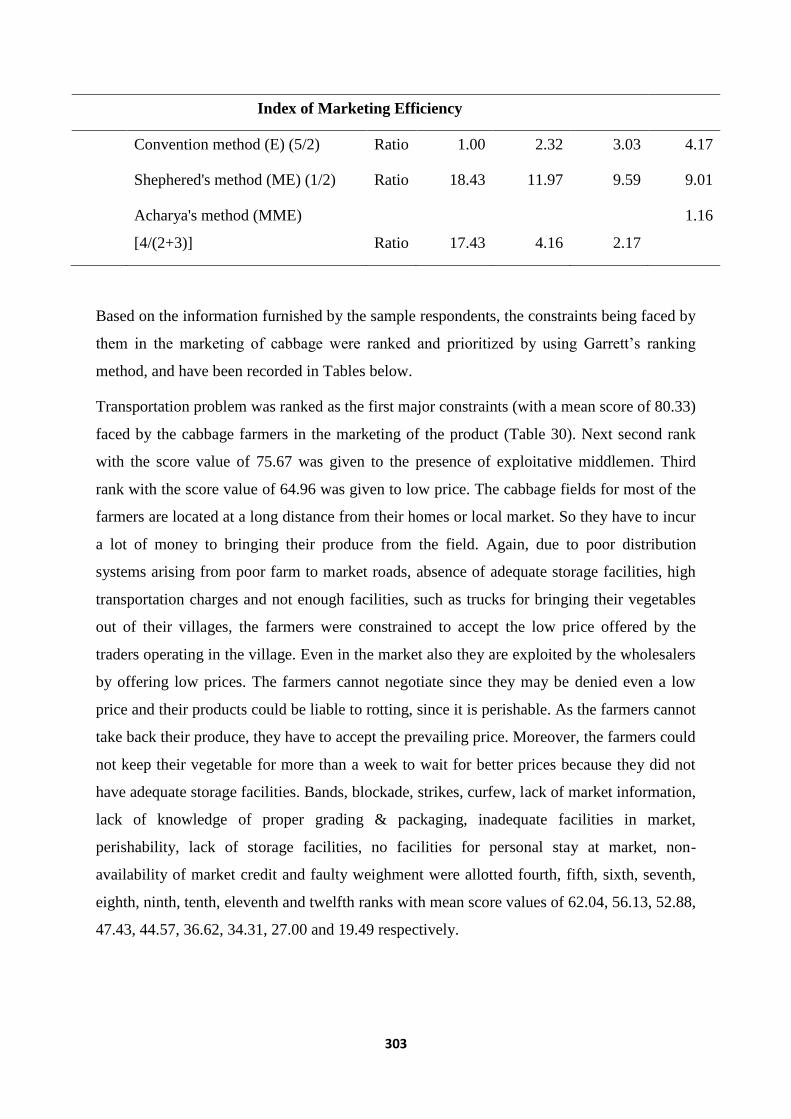
303
Index of Marketing Efficiency
Convention method (E) (5/2) Ratio 1.00 2.32 3.03 4.17
Shephered's method (ME) (1/2) Ratio 18.43 11.97 9.59 9.01
Acharya's method (MME)
[4/(2+3)] Ratio 17.43 4.16 2.17
1.16
Based on the information furnished by the sample respondents, the constraints being faced by
them in the marketing of cabbage were ranked and prioritized by using Garrett’s ranking
method, and have been recorded in Tables below.
Transportation problem was ranked as the first major constraints (with a mean score of 80.33)
faced by the cabbage farmers in the marketing of the product (Table 30). Next second rank
with the score value of 75.67 was given to the presence of exploitative middlemen. Third
rank with the score value of 64.96 was given to low price. The cabbage fields for most of the
farmers are located at a long distance from their homes or local market. So they have to incur
a lot of money to bringing their produce from the field. Again, due to poor distribution
systems arising from poor farm to market roads, absence of adequate storage facilities, high
transportation charges and not enough facilities, such as trucks for bringing their vegetables
out of their villages, the farmers were constrained to accept the low price offered by the
traders operating in the village. Even in the market also they are exploited by the wholesalers
by offering low prices. The farmers cannot negotiate since they may be denied even a low
price and their products could be liable to rotting, since it is perishable. As the farmers cannot
take back their produce, they have to accept the prevailing price. Moreover, the farmers could
not keep their vegetable for more than a week to wait for better prices because they did not
have adequate storage facilities. Bands, blockade, strikes, curfew, lack of market information,
lack of knowledge of proper grading & packaging, inadequate facilities in market,
perishability, lack of storage facilities, no facilities for personal stay at market, non-
availability of market credit and faulty weighment were allotted fourth, fifth, sixth, seventh,
eighth, ninth, tenth, eleventh and twelfth ranks with mean score values of 62.04, 56.13, 52.88,
47.43, 44.57, 36.62, 34.31, 27.00 and 19.49 respectively.

304
Table 30: Constraints perceived by the farmers in marketing of Cabbage
Constraints
Mean
score Rank
Transportation 80.33 1
Presence of exploitative middlemen 75.67 2
Low price 64.96 3
Band, blockage, strikes, curfew 62.04 4
Lack of market information 56.13 5
Lack of knowledge of proper grading &
packaging 52.88 6
Inadequate facilities in market 47.43 7
Perishability 44.57 8
Lack of storage facilities 36.62 9
No facilities for personal stay at market 34.31 10
Non-availability of market credit 27.00 11
Faulty weighment 19.49 12
Bands, blockades, strikes, curfews was ranked as the first major constraints (with a mean
score of 79.00) faced by the cabbage traders in the marketing of the product (Table 31). Next
second rank with the score value of 65.83 was given to the transportation problem. Third rank
with the score value of 64.80 was given to payment of unauthorized fee & taxes to unwanted
elements. If bands, blockade, strikes, curfew, etc. occurred, the market will be close for the
day and this will hinder their business. They cannot collect the produce from the farmers and
also they cannot sell the produce to the wholesaler. Delay of one or two days in the marketing
of the produce will reduce the market value of the produce. Due to poor farm to market roads
and bad condition of the existing roads, the traders have to bear high transportation charges.
The traders have to pay many illegal taxes so that they can do business in that area.
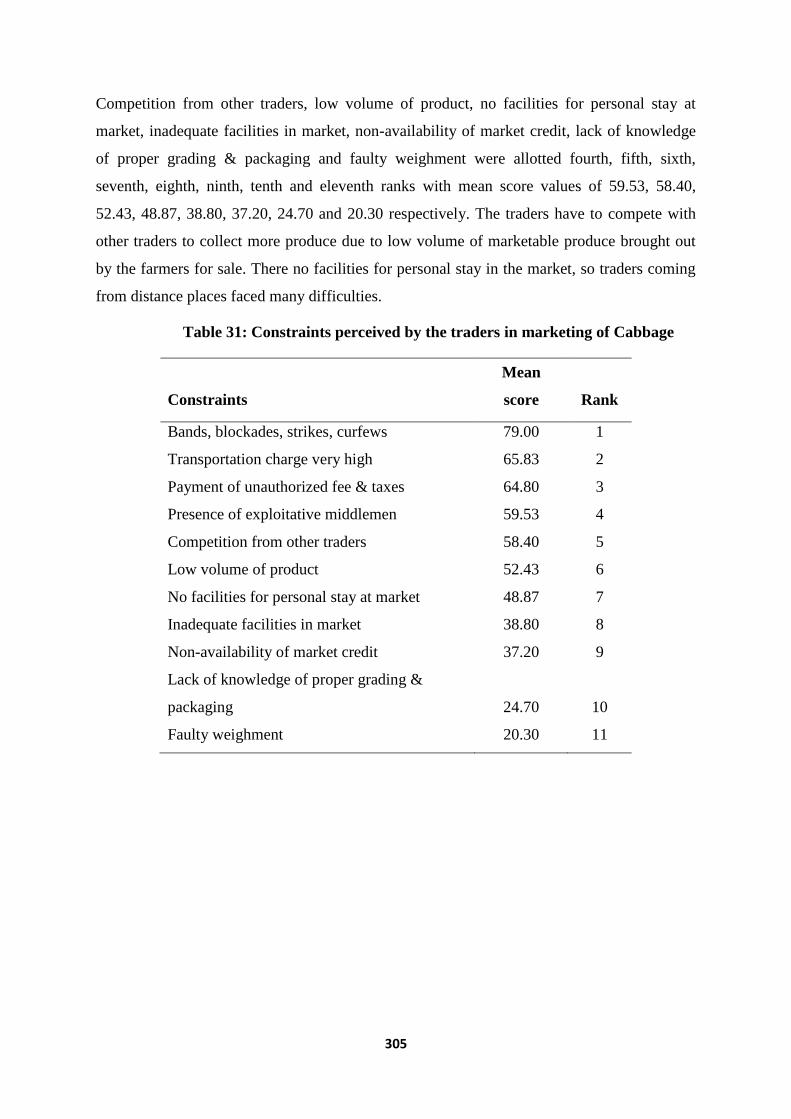
305
Competition from other traders, low volume of product, no facilities for personal stay at
market, inadequate facilities in market, non-availability of market credit, lack of knowledge
of proper grading & packaging and faulty weighment were allotted fourth, fifth, sixth,
seventh, eighth, ninth, tenth and eleventh ranks with mean score values of 59.53, 58.40,
52.43, 48.87, 38.80, 37.20, 24.70 and 20.30 respectively. The traders have to compete with
other traders to collect more produce due to low volume of marketable produce brought out
by the farmers for sale. There no facilities for personal stay in the market, so traders coming
from distance places faced many difficulties.
Table 31: Constraints perceived by the traders in marketing of Cabbage
Constraints
Mean
score Rank
Bands, blockades, strikes, curfews 79.00 1
Transportation charge very high 65.83 2
Payment of unauthorized fee & taxes 64.80 3
Presence of exploitative middlemen 59.53 4
Competition from other traders 58.40 5
Low volume of product 52.43 6
No facilities for personal stay at market 48.87 7
Inadequate facilities in market 38.80 8
Non-availability of market credit 37.20 9
Lack of knowledge of proper grading &
packaging 24.70 10
Faulty weighment 20.30 11

306
Table 32: Constraints perceived by the retailers in marketing of Cabbage
Constraints
Mean
score Rank
Inadequate facilities in market 79.97 1
Band, blockage, strikes, curfew 66.07 2
Payment of unauthorized fee
(bribing) 63.53 3
Lack of storage facilities 55.40 4
Non-availibility of market credit 50.37 5
Perishability 47.20 6
Lack of market information 36.60 7
Transportation 28.07 8
High market fee 23.80 9
Inadequate facilities in market was ranked as the first major constraints (with a mean score of
79.97) faced by the cabbage retailers in the marketing of the product (Table 32). There is lack
of adequate facilities in the market, such as lack of seating space, no packing place, difficulty
during rainy season, dirty market place, etc. These posed a major problem for the cabbage
retailers. Next second rank with the score value of 66.07 was given to the problem of bands,
blockade, strikes, curfew, etc. which hinder business. Third rank with the score value of
63.53 was given to the payment of unauthorized fee (bribing). The retailers have to pay many
unauthorized fees to many persons so that they can sell their produce. Those who do not pay
these fees are either beaten up or their produce thrown away and not allow to seat and sell
their produce. Lack of storage facilities, non-availability of market credit, problem of
perishability of the product, lack of market information, transportation and high market fee
were allotted fourth, fifth, sixth, seventh, eighth, ninth ranks with mean score values of 55.40,
50.37, 47.20, 36.60, 28.07 and 23.80 respectively. There are no adequate storage facilities in
the market, so the retailers have to sell their produce on the day they bought the produce from
the wholesaler or farmers itself, otherwise they will incur loss.

307
Bands, blockade, strikes, curfew, was ranked as the first major constraints (with a mean score
of 79.27) faced by the cabbage wholesaler in the marketing of the product (Table 12.4). If
bands, blockade, strikes, curfew, etc. occurred, the market will be close for the day and this
will hinder the business and the market value of the produce will be reduced. Next second
rank with the score value of 66.18 was given to inadequate facilities in market.
Table 33: Constraints perceived by the wholesaler in marketing of Cabbage
Constraints
Mean
score Rank
Bands, blockade, strike, curfew 79.27 1
Inadequate facilities in market 66.18 2
Lack of storage facilities 60.45 3
Perishability 56.09 4
Payment of unauthorized fee
(bribing) 48.00 5
Non-availabilty of market credit 46.09 6
Small size of market 40.27 7
High market fee 32.36 8
Lack of market information 22.27 9
There is lack of adequate facilities in the market, such as lack of seating space, no packing
place, difficulty during rainy season, dirty market place, etc. Third rank with the score value
of 60.45 was given to the problem of lack of storage facilities. Again, lack of adequate
storage facilities compelled the wholesaler to get rid of their produce as soon as possible.
Perishability, payment of unauthorized fee (bribing), non-availability of market credit, small
size of market, high market fee and lack of market information were allotted fourth, fifth,
sixth, seventh, eighth, ninth ranks with mean score values of 56.09, 48.00, 46.09, 40.27,
32.36 and 22.27 respectively.

308
Suggestions of farmers, traders, retailers and wholesaler for increasing the marketing
efficiency of cabbage are presented in Table 34, Table 35, Table 36 and Table 37
respectively.
The transportation facilities need to be strengthened especially for transporting vegetable to
consuming market so as to take benefit of higher prices in these markets. The defects and
malpractices in existence in most of the markets can be improved by exercising proper
control over the markets by the government officials. Regulated markets should be
developed. The State Government agencies should fix reasonable and remunerative prices for
the produce. The Government should organize intensive training related to post harvest
handling of the produce.
Table 34: Suggestions of farmers for increasing marketing efficiency of Cabbage
Sl.No. Suggestions
1 Quick and efficient means of transport with good packing.
2 Introduction of an efficient market regulation.
3 Establishment of adequate cold storage facilities.
4 Intervention by State Government agencies by fixing reasonable
price.
5 Provision of adequate facilities in market.
6 Improvement of the market information delivery system.
7 Numbers of bands, blockade, strikes, curfew, etc. should be
reduced.
The storage facilities need to be created which suits all vegetables for storage during the glut
season which will help to decrease intra-seasonal price variation. Improvement in market
infrastructure such as cold storage, godowns, loading and unloading facilities mechanically,
weighing facilities and improving transparency through supervision and making availability
of up-to-date market information to the farmers is the need of the hour. Bands, blockade,
strikes, curfew, etc. hinders business so the Government as well as the private organization
should try to avoid such kind of unwanted situations as far as possible.

309
Table 35: Suggestions of trader for increasing marketing efficiency of cabbage
Sl.No. Suggestions
1 Transportation charges should be reduced.
2 Numbers of bands, blockade, strikes, curfew, etc. should be
reduced.
3 Punishment of those taking and demanding unauthorized fees.
4 Production should be increased.
5 Provision of adequate facilities in market.
6 Establishment of adequate cold storage facilities.
7 Market credit should be made easily available.
The transportation facilities need to be strengthened by constructing new roads and
improving the condition of the existing ones and increasing the number of transport vehicle
with cold storage facility. Bands, blockade, strikes, curfew, etc. hinders business so the
Government as well as the private organization should try to avoid such kind of unwanted
situations as far as possible. The traders have to pay many illegal taxes so that they can do
business in that area. The government should take action against those persons demanding
and taking illegal fees. The farmers should increase their production by adopting new and
improved production techniques. Improvement in market infrastructure such as cold storage,
godowns, loading and unloading facilities mechanically, weighing facilities and improving
transparency through supervision and making availability of up-to-date market information is
the need of the hour. Low cost timely institutional finance should be provided to the traders.
Table 36: Suggestions of retailer for increasing marketing efficiency of cabbage
Sl.No. Suggestions
1 Provision of adequate facilities in market.
2 Numbers of bands, blockade, strikes, curfew, etc. should be reduced.
3 Punishment of those taking and demanding unauthorized fees.
4 Establishment of adequate cold storage facilities.

310
5 Introduction of an efficient market regulation.
6 Market credit should be made easily available.
Table 37: Suggestions of wholesaler for increasing marketing efficiency of cabbage
Sl.No. Suggestions
1 Numbers of bands, blockade, strikes, curfew, etc. should be
reduced.
2 Provision of adequate facilities in market.
3 Establishment of adequate cold storage facilities.
4 Punishment of those taking and demanding unauthorized fees.
5 Market credit should be made easily available.
Provision of adequate marketing facilities such as proper seating place, packing space for
vehicles, clean market place, etc. so that the retailers and the wholesalers do not face any
difficulty in marketing their produce. Bands, blockade, strikes, curfew, etc. hinders business
so the Government as well as the private organization should try to avoid such kind of
unwanted situations as far as possible. The retailers and the wholesalers have to pay many
unwanted or illegal fees to many persons so that they can market their produce. They should
unite together and stand against these persons and make efforts to get these illegal charges
removed. The government should punish those persons demanding and taking illegal fees
from the retailers. Adequate cold storage facilities should be established in the market.
Regulated markets should be developed. Market credit should be made available easily and
quickly.

311
Table38: Factors affecting Marketing Efficiency of Vegetable (Tomato and Cabbage) in
Manipur
Sl.No. Factors Coefficient Standard
error
‘t’
value
1 Constant 14.138*** 3.616 3.910
2 Marketing cost -1.143*** 0.001 -4.447
3 Marketing margin 0.765*** 0.002 3.572
4 Transport cost -0.487* 0.002 -1.774
5 Open Market price -0.868*** 0.063 -6.453
6 Labour wages -0.046 0.024 -0.444
7 Controlling middlemen - - -
8 Volume of produce handled 0.935*** 0.001 6.841
9 Presence of cold storage
facilities
- - -
10 Length of market channel - - -
11 Existence of competition in
selling
- - -
12 Nature of produce -0.057 0.153 -1.158
13 R-square 0.760
14 Adjusted R-square 0.745
15 No. of observation 120
(***) Significant at 1%
( ** ) Significant at 5%
( * ) Significant at 10%
The marketing efficiency of vegetable (tomato and cabbage) in Manipur is significantly
affected by marketing cost, marketing margin, open market price and volume of produce
handled at 1% significant level and by transport cost at 10% significant level. The marketing

312
efficiency will increase with the decrease in the marketing cost, transport cost and open
market price and with the increase in the marketing margin and volume of the produce
handled. The labour wage and the nature of the produce had no significant effect on the
marketing efficiency of vegetables (tomato and cabbage).
3.3 PASSION FRUIT
Passion fruit is a native of the South American rain forests covering the Amazon region in
Brazil, Paraguay and North Argentina. In India, it is found in the forests of Manipur,
Nagaland, Arunachal Pradesh and Karnataka states. There are two types of passion fruits: the
purple species (Passiflora edulis), thrives from cool subtropics to high altitudes in the tropics
and the golden species (P. edulis f. flavicarpa) which is found mostly in tropical lowlands.
Both the types of passion fruits are grown in Manipur. The purple species are mostly grown
in Senapati district and the golden species in Churachandpur district of Manipur.
Table 39: Distribution of sample Passion fruit cultivators
Sl. Category Holding
Size (ha.)
No. of
cultivators
Total Area
under
Passion Fruit
(ha.)
Average
Area under
Passion Fruit
(ha.)
1 Small 0 - 0.99 91
(75.83)
46.45
(55.17)
0.51
2 Medium 1 - 1.49 18
(15.00)
18.50
(21.97)
1.03
3 Large 1.5 &
above
11
(9.17)
19.25
(22.86)
1.75
4 Total 120
(100)
84.20
(100)
0.70
Figures in the parentheses indicate percentages to the total
The passion fruit farmers were classified into three categories, viz., (i) Small having upto
0.99 hectares of land under passion fruit; (ii) Medium having 1 – 1.49 hectares and (iii) Large
having 1.5 hectares and above land under passion fruit. The information on size group-wise
distribution of sample farmers is presented in Table 1. Of the total number of 120 sample

313
farmers, 75.83 percent were in small group operating about 55.17 percent of the total area,
while large group accounting for about only 9.17 percent of the total sample farmers shared
about 22.86 percent area. Farmers in medium group formed about 15 percent operating only
21.97 percent of the total area. The average farm size was 0.51 hectares, 1.03 hectares and
1.75 hectares respectively in small, medium and large groups with an overall average of 0.70
hectares.
The per hectare disposal pattern of tomato is shown in Table 40. The farmers marketed
almost all the produce (90.93 percent) from the farm after using 1.25 percent for home
consumption and 2.14 percent for payment in kind and as gift to relatives. It was observed
that losses due to breakage and spoilage accounted for 5.69 percent of the total production.
Table 40: Per Hectare Disposal of Passion fruit (Quantity in quintals)
Sl.
No.
Particular Groups
Small Medium Large Overall
I Production 159.78
(100)
159.73
(100)
133.30
(100)
153.71
(100)
II Quantity consumed on farm
a) Home consumption 1.64
(1.03)
2.51
(1.57)
2.01
(1.51)
1.92
(1.25)
b) Payment in kind & as gift 3.16
(1.98)
3.96
(2.48)
2.96
(2.22)
3.29
(2.14)
c) Losses (due to breakage &
spoilage)
8.83
(5.52)
8.98
(5.62)
8.31
(6.24)
8.74
(5.69)
III Marketed surplus 146.15
(91.47)
144.28
(90.33)
120.02
(90.04)
139.76
(90.93)
Figures in the parentheses indicate percentages to the total production
Again, it was observed from the table that out of the total production 1.03 percent was
consumed at home in small group, 1.57 percent in medium group and 1.51 percent in large
group; 1.98 percent was used for payment in kind and as gift to relatives in small group, 2.48
percent in medium group and 2.22 percent in large group. Losses due to breakage and

314
spoilage were 5.52 percent of the total production in small group, 5.62 percent in medium
group and 6.24 percent in large group. In terms of quantity, losses due to breakage and
spoilage were highest in medium group (8.89 quintal per hectare) and least in large group
(8.31 quintal per hectare). Total marketed surplus was 146.15 quintal per hectare (91.47
percent) in small group, 144.28 quintal per hectare (90.33 percent) in medium group and
120.02 quintal per hectare (90.04 percent) in large group. The disposal pattern revealed that
marketed surplus decreased with increase in farm size.
Marketing channel of Passion fruit:
Marketing channels are the routes through which agricultural as well as horticultural products
move from producers to consumers. The length of the channel varies from commodity to
commodity, depending on the quality to be moved, the form of consumer demand and degree
of regional specialization in production. The prominent marketing channels of passion fruit in
Manipur are shown in Table 5. Here the society is the Passion Beekeeping Dev. Association
(A subsidiary of Passion Fruit Growers Association) of Churachandpur district, Manipur.
Table 41: Marketing channel of Passion fruit
Particulars Supply chain
Channel 1 Producer - Society - Juice factory
Channel 2 Producer - Wholesaler -Retailer - Consumer
Channel 3 Producer - Retailer - Consumer
The channel-wise distribution of passion fruit growers and quantity handled in different
marketing channels is given in Table 42. It was observed from the table that the maximum
quantity of passion fruit was passed through Channel 1 (86.02 percent), followed by Channel
2 (11.53 percent) and the lowest quantity of passion fruit was sold through Channel 3 (2.45
percent). Again, it was observed from the table that majority of the farmers market their
produce through Channel 1 (80.83 percent), followed by Channel 2 (15.83 percent) and
Channel 3 (3.33 percent).

315
Table 42: Quantity handled in different marketing channel of Passion fruit
Marketing
channel
Quantity
handled (q)
% to the
total
No. of
growers
% to
total
Channel 1 10099.12 86.02 97 80.83
Channel 2 1353.09 11.53 19 15.83
Channel 3 288.00 2.45 4 3.33
Total 11740.21 100 120 100
Marketing costs and marketing margins per quintal of passion fruit for Channel 1 in Manipur
have been presented in Table 43. The farmer’s share has been found to be 61.11 percent.
Total marketing expenses incurred by farmer is worked out to be Rs.80.57 of which losses
consumed highest share, i.e., about 53.67 percent of the marketing cost incurred by producer.
Sorting and packing (42.20 percent) rank second, followed by cost of transportation (4.14
percent). For weighing, the farmers do not incurred any cost. The Society brings its own
balance while collecting the fruits from different collection point. For packing the fruit, the
farmers used bag of 35 kg capacity, which cost about Rs. 5-8 per bag. These bags can be used
many times. Transportation to the collection point is done by hand-drawn-card as the distance
is not very far. Table shows that the producer, on an average receives Rs.600 per quintal. It is
observed from the table that passion fruit producer fetches Rs.519.43 per quintal as his net
margin. The Society has to incur a cost amounting Rs.110, i.e., 12.94 percent of retail price to
market one quintal of passion fruit. Of this cost about 60 percent transportation cost, 27
percent are losses due to spoilage and shrinkage of the produce, 9 percent sorting and packing
and 3 percent for loading/unloading. The Society sells the produce to the juice factory at Mao
@ Rs. 850 per quintal. However, the Society fetches Rs.140 which accounts for 16.47 percent
of the price received by it as profit or margin. In this channel, the producers incur less
marketing cost than the Society.

316
Table 43: Marketing cost and Marketing margin of passion fruit (Channel 1)
Item Unit Cost
% Consumer
Price
Farm gate price at village Rs/q 519.43 61.11
sorting and packing Rs/q 34.00 4.00
Weighing Rs/q 0 0
transport Rs/q 3.33 0.39
losses Rs/q 43.24 5.09
Total marketing cost Rs/q 80.57 9.48
Farmers' selling price to
Society Rs/q 600.00 70.59
sorting and packing Rs/q 10.00 1.18
loading/unloading Rs/q 3.33 0.39
spoilage Rs/q 30.00 3.53
transport Rs/q 66.67 7.84
Market fee Rs/q 0 0
storage Rs/q 0 0
Total marketing cost Rs/q 110.00 12.94
Marketing margin Rs/q 140.00 16.47
Society selling price to
factory Rs/q 850.00 100.00
Marketing costs and marketing margins per quintal of passion fruit for Channel 2 in Manipur
have been presented in Table 44. The farmer’s share in the consumer’s rupee has been found
to be 57.05 percent. Total marketing expenses incurred by farmer is worked out to be
Rs.90.82 of which losses consumed highest share (31 percent of the marketing cost). Cost of
transportation (28 percent) ranks second, followed by sorting and packing (27 percent) and
then weighing (14 percent). Transportation is done by bus, auto or Tata DI depending upon
the distance. Table shows that the producer, on an average receives Rs.1100 per quintal. It is

317
observed from the table that passion fruit producer fetches Rs.1009.18 per quintal as his net
margin.
The wholesaler has to incur a cost amounting Rs. 69.55, i.e., 3.93 percent of the retail price to
market one quintal of passion fruit. Of this cost about 86 percent is because of losses due to
spoilage and shrinkage (weight loss) of the crop. Loading/unloading (2 percent),
transportation (4 percent) and market fee (7 percent) form the remaining marketing cost. The
wholesaler sells the crop to retailers at Rs. 1364.29 per quintal. He, however, fetches
Rs.194.73 which accounts for 11.01 percent of the retail price as his profit.
Table 44: Marketing cost and Marketing margin of passion fruit (Channel 2)
Item Unit Cost
% Consumer
Price
Farm gate price at village Rs/q 1009.18 57.05
sorting & packing Rs/q 25.03 1.14
Weighing Rs/q 12.50 0.71
transport Rs/q 25.00 1.41
losses Rs/q 28.29 1.60
Total marketing cost Rs/q 90.82 5.13
Farmers' selling price to
wholesaler Rs/q 1100.00 62.18
sorting & packing Rs/q 0 0
loading/unloading Rs/q 1.42 0.08
spoilage Rs/q 60.00 3.39
transport Rs/q 3.10 0.18
market fee Rs/q 5.03 0.28
storage Rs/q 0 0
Total marketing cost Rs/q 69.55 3.93

318
Marketing margin Rs/q 194.73 11.01
Wholesaler price to retailer Rs/q 1364.29 77.12
sorting & packing Rs/q 0 0
Loading/unloading Rs/q 13.23 0.75
spoilage Rs/q 52.48 2.97
transport Rs/q 3.33 0.19
Market fee Rs/q 3.98 0.23
storage Rs/q 6.69 0.38
Total marketing cost Rs/q 79.73 4.51
Marketing margin Rs/q 325.04 18.37
Retailers price to consumer Rs/q 1769.05 100.00
At retailer’s level, an amount of Rs.79.73 (4.51 percent of the retail price) is required as
marketing cost. It is noted that out of the total marketing cost about 66 percent is retailer’s
loss in the form of spoilage and shrinkage of the fruit. Cost of loading/unloading (17
percent), storage (8 percent), market fee (5 percent) and transportation (4 percent) constitute
the remaining marketing cost incurred by the retailer. The retail price of one quintal of
passion fruit in Channel 2 is Rs. 1769.05. The retailer, however, fetches Rs. 325.04, about
18.37 percent of the retail price as his profit.
It is observed from the table that maximum marketing cost in this channel is incurred by
producer which is associated with high spoilage losses during storing and handling. It is
further observed that maximum profit is reaped by retailer.

319
Table 45: Marketing cost and Marketing margin of passion fruit (Channel 3)
Item Unit Cost
% Consumer
Price
Farm gate price at village Rs/q 1242.62 72.56
sorting & packing Rs/q 31.30 1.83
Weighing Rs/q 12.50 0.73
transport Rs/q 15.85 0.93
losses Rs/q 22.74 1.33
Total marketing cost Rs/q 82.38 4.81
Farmers' selling price to
retailer Rs/q 1325.00 77.37
sorting & packing Rs/q 0 0
unloading Rs/q 8.51 0.50
spoilage Rs/q 59.71 3.49
transport Rs/q 0.00 0.00
Market fee Rs/q 4.71 0.28
storage Rs/q 2.90 0.17
Total marketing cost Rs/q 75.83 4.43
Marketing margin Rs/q 311.67 18.20
Retailers price to consumer Rs/q 1712.50 100
Marketing costs and marketing margins per quintal of passion fruit for Channel 3 in Manipur
have been presented in Table 45. The farmer’s share in the consumer’s rupee has been found
to be 72.56 percent. Total marketing expenses incurred by farmer is worked out to be Rs.
82.38 of which cost on sorting and packing consumed the highest share, i.e., about 38 percent
of the marketing cost incurred by producer. Losses (28 percent) ranks second, followed by
transportation (19 percent) and then weighing (15 percent). Transportation is done by bus,
auto or Tata DI depending upon the distance. Table shows that the producer, on an average
320
receives Rs. 1325 per quintal. It is observed from the table that passion fruit producer fetches
Rs. 1242.62 per quintal as his net margin.
The retailer has to incur a cost amounting Rs. 75.83, i.e., 4.43 percent of retail price to market
one quintal of passion fruit. Of this cost about 79 percent are losses due to spoilage and
shrinkage (weight loss) of the produce, 11 percent loading/unloading, 6 percent market fee
and 4 percent storage. However, he fetches Rs. 311.67 which accounts for 18.20 percent of
the price received by him as profit or margin. In Channel 3, the producers incur more
marketing cost than the retailers.
Channel-wise marketing cost and marketing margin of passion fruit is shown in Table 46.
Marketing cost and marketing margin vary considerably from channel to channel and were
related directly to the length of the channel, i.e., longer the channel, more were the marketing
cost and marketing margin. Channel 2 (Producer - Wholesaler - Retailer - Consumer) being
the longer channel and in this channel the highest marketing cost and marketing margin per
quintal, i.e., Rs. 240.10 and Rs. 519.77 respectively were observed. Channel 3 (Producer -
Retailer - Consumer) accounted for lowest marketing cost, i.e., Rs.158.22 per quintal.
Channel 1 (Producer - Society - Juice factory) accounted for the lowest marketing margin, i.e.
Rs.140 per quintal.
It can also be seen from the table that Channel 1 had the lowest retail price (Rs.850 per
quintal) and Channel 2 the highest retail price (Rs.1769.05 per quintal) when two
intermediaries were involved between the producer and consumer i.e. wholesaler and retailer.
The retail price in Channel 3 was found to be Rs.1712.50 per quintal.

321
Table46: Marketing cost and Marketing margin of passion fruit (Rs./q)
Channel 1 Channel 2 Channel 3
Item Cost
%
Consumer
Price Cost
%
Consumer
Price Cost
%
Consumer
Price
Farm gate price 519.43 61.11 1009.18 57.05 1242.62 72.56
Marketing cost
Producer 80.57 9.48 90.82 5.13 82.38 4.81
Society 110.00 12.94
Wholesaler - - 69.55 3.93 - -
Retailer - - 79.73 4.51 75.83 4.43
Total Marketing Cost 190.57 22.42 240.10 13.57 158.22 9.24
Marketing margin
Society 140.00 16.47 - - - -
Wholesaler - - 194.73 11.01 - -
Retailer - - 325.04 18.37 311.67 18.20
Total Marketing
Margin 140.00 16.47 519.77 29.38 311.67 18.20
Consumer Price 850.00 100 1769.05 100 1712.50 100
The price paid by the consumer increased with the increase in the length of the marketing
channel or with the increased in the numbers of intermediaries involved between the producer
and the ultimate consumers. Passion fruit was marketed through various intermediaries
starting from producer to the ultimate consumers. Intermediaries rendered variety of services
in the marketing of tomato with a view to earn some profit. The price spread in the various
channels involved in the marketing of passion fruit is given in Table 47. Price spread refers to
the difference between the price paid by the consumer and the price received by the producer
for equivalent quantity of farm produce. This price spread consists of the marketing costs and
marketing margins of the intermediaries, which ultimately determine the overall effectiveness
of the marketing system. The price spread in Channel 1 was found to be lowest (Rs.330.57
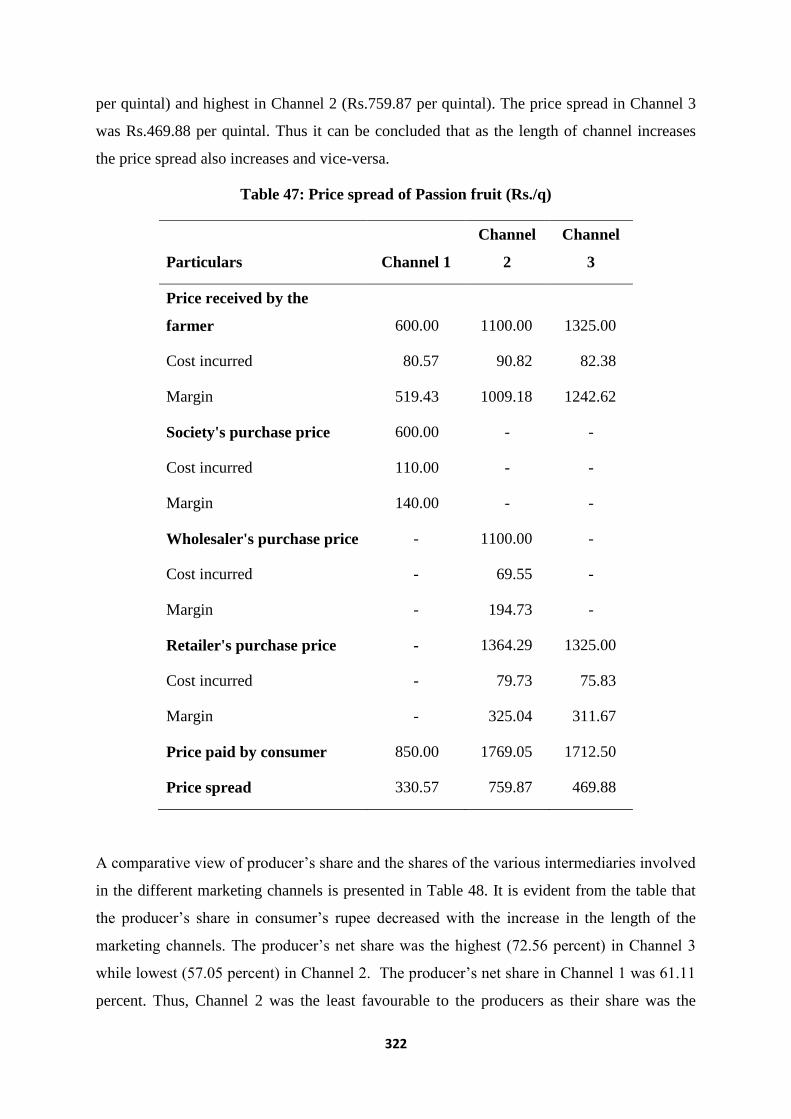
322
per quintal) and highest in Channel 2 (Rs.759.87 per quintal). The price spread in Channel 3
was Rs.469.88 per quintal. Thus it can be concluded that as the length of channel increases
the price spread also increases and vice-versa.
Table 47: Price spread of Passion fruit (Rs./q)
Particulars Channel 1
Channel
2
Channel
3
Price received by the
farmer 600.00 1100.00 1325.00
Cost incurred 80.57 90.82 82.38
Margin 519.43 1009.18 1242.62
Society's purchase price 600.00 - -
Cost incurred 110.00 - -
Margin 140.00 - -
Wholesaler's purchase price - 1100.00 -
Cost incurred - 69.55 -
Margin - 194.73 -
Retailer's purchase price - 1364.29 1325.00
Cost incurred - 79.73 75.83
Margin - 325.04 311.67
Price paid by consumer 850.00 1769.05 1712.50
Price spread 330.57 759.87 469.88
A comparative view of producer’s share and the shares of the various intermediaries involved
in the different marketing channels is presented in Table 48. It is evident from the table that
the producer’s share in consumer’s rupee decreased with the increase in the length of the
marketing channels. The producer’s net share was the highest (72.56 percent) in Channel 3
while lowest (57.05 percent) in Channel 2. The producer’s net share in Channel 1 was 61.11
percent. Thus, Channel 2 was the least favourable to the producers as their share was the

323
lowest in consumer’s rupee. It was due to the presence of large number of intermediaries in
between the producer and the consumer. So, the farmers were not getting good remunerative
price for their produce in Channel 3.
The retail margin was more compared to wholesaler in Channel 2. The profit margin of the
wholesaler was 11.01 percent while that of retailer was 18.37 percent in Channel 2. While in
Channel 3, the profit margin of the retailer was 18.20 percent; and that of Society was 16.47
percent in Channel 1.
Table 48: Share of different agencies during marketing of passion fruit
Sl.No. Agency Function
Share in final price
Channel
1
Channel
2
Channel
3
1 Retailers Retailing - 18.37 18.20
2 Wholesalers Breaking bulk - 11.01
3 Society Assembling/transportation 16.47
4 Farmers Production 61.11 57.05 72.56
Total
77.58 86.43 90.76
Marketing efficiency was also calculated for the identified three channels by Conventional
method, Shephered’s method and Acharya’s method and presented in Table 49. The
marketing efficiency was found to be highest in Channel 2 (3.16), followed by Channel 3
(2.97) and least in Channel 1 (1.73) when calculated by Conventional method (i.e. value
added by marketing system divided by total marketing cost).

324
Table 49: Measurement of Marketing Efficiency of Passion fruit
Sl.No. Particulars Unit
Channel
1
Channel
2
Channel
3
1 Retailer's sale price (RP) Rs./q 850.00 1769.05 1712.50
2 Total marketing cost (MC) Rs./q 190.57 240.10 158.22
3 Total margins of intermediaries (MM) Rs./q 140.00 519.77 311.67
4 Price received by farmers (FP) Rs./q 519.43 1009.18 1242.62
5
Value added by the marketing system
(1-4) Rs./q 330.57 759.87 469.88
Index of Marketing Efficiency
Convention method (E) (5/2) Ratio 1.73 3.16 2.97
Shephered's method (ME) (1/2) Ratio 4.46 7.37 10.82
Acharya's method (MME) [4/(2+3)] Ratio 1.57 1.33 2.64
On the other hand when marketing efficiency was calculated by Shephered’s method (i.e.
retailer’s sale price divided by total marketing cost), it was found to be highest in Channel 3
(10.82); followed by Channel 2 (7.37) and lowest in Channel 1 (4.46). Again, when
calculated by Acharya’s method (i.e. price received by farmers divided by total marketing
cost and margin), it was found to be highest in Channel 3 (2.64); followed by Channel 1
(1.57) and lowest in Channel 2 (1.33).
Based on the information furnished by the sample respondents, the constraints being faced by
them in the marketing of passion fruit were ranked and prioritized by using Garrett’s ranking
method, and have been recorded in Tables below.
Low price of the product was ranked as the first major constraints (with a mean score of
79.78) faced by the passion fruit farmers in the marketing of the product (Table 50). Next
second rank with the score value of 71.57 was given to the presence of exploitative
middlemen. Third rank with the score value of 69.85 was given to inadequate facilities in
market. Most of the farmers in the sample area market their produce through the Society.

325
The Society pay them only Rs.6/kg for their produce. They want to sell their produce for a
higher price. But they are compelled to accept the price paid by the Society as there is lack of
adequate storage facilities, high transportation charges, poor market linkages and not enough
facilities, such as trucks for bringing their produce out of their villages to the market. Lack of
market information, perishability, lack of storage facilities, lack of knowledge of proper
grading & packaging, bands, blockade, strikes, curfew, transportation, faulty weighment,
non-availability of market credit and no facilities for personal stay at market were allotted
fourth, fifth, sixth, seventh, eighth, ninth, tenth, eleventh and twelfth ranks with mean score
values of 61.23, 57.23, 51.67, 48.40, 43.00, 40.27, 30.82, 25.84 and 21.34 respectively. The
farmers lack market information about the prevailing prices in the market and other markets,
so they are easily exploited by the middlemen. If the produce is stored for more than 3 days,
there is loss of weight, so they farmers have to sell their produce as soon as possible;
otherwise they will incur some loss.
Lack of demand of raw fruits was ranked as the first major constraints (with a mean score of
75.87) faced by the passion fruit retailers in the marketing of the product (Table 51). There is
lack of demand of raw fruits as there is lack of awareness about the fruits by many people. So
the retailers feel difficulty in finding consumer.
Table 50: Constraints perceived by the farmers in marketing of Passion fruit
Constraints
Mean
score Rank
Low price 79.78 1
Presence of exploitative middlemen 71.57 2
Inadequate facilities in market 69.85 3
Lack of market information 61.23 4
Perishability 57.23 5
Lack of storage facilities 51.67 6
Lack of knowledge of proper grading &
packaging 48.40 7
Band, blockage, strikes, curfew 43.00 8

326
Transportation 40.27 9
Faulty weighment 30.82 10
Non-availability of market credit 25.84 11
No facilities for personal stay at market 21.34 12
Next second rank with the score value of 72.67 was given to the problem of inadequate
facilities in market. There is lack of adequate facilities in the market, such as lack of seating
space, no packing place, difficulty during rainy season, dirty market place, etc. These posed a
major problem for the passion fruit retailers in marketing their produce.
Table 51: Constraints perceived by the retailers in marketing of Passion fruit
Constraints
Mean
score Rank
Lack of demand 75.87 1
Inadequate facilities in market 72.67 2
Band, blockage, strikes, curfew 65.33 3
Payment of unauthorized fee
(bribing) 54.30 4
Lack of storage facilities 52.10 5
Perishability 47.67 6
Non-availability of market credit 46.67 7
Transportation 35.83 8
Lack of market information 26.40 9
High market fee 22.77 10
Third rank with the score value of 65.33 was given to the problem of bands, blockade, strikes,
curfew, etc. which hinder business. If bands, blockade, strikes, curfew, etc. occurred, the
market will be close for the day and this will hinder the business and the market value of the
produce will be reduced. Payment of unauthorized fee (bribing), lack of storage facilities,
perishability of the product, non-availability of market credit, transportation, lack of market

327
information and high market fee were allotted fourth, fifth, sixth, seventh, eighth, ninth and
tenth ranks with mean score values of 54.30, 52.10, 47.67, 46.67, 35.83, 26.40 and 22.77
respectively.
Table 52: Constraints perceived by the wholesaler in marketing of Passion fruit
Constraints
Mean
score Rank
Bands, blockade, strike, curfew 77.00 1
Inadequate facilities in market 73.00 2
Payment of unauthorized fee
(bribing) 60.00 3
Competition from others 58.00 4
Lack of storage facilities 48.33 5
Perishability 46.67 6
Non-availability of market credit 32.50 7
High market fee 31.33 8
Lack of market information 24.17 9
Bands, blockade, strikes, curfew, was ranked as the first major constraints (with a mean score
of 77.00) faced by the passion fruit wholesaler in the marketing of the product (Table 52). If
bands, blockade, strikes, curfew, etc. occurred, the market will be close and this will hinder
the business and the market value of the produce will be reduced if they are stored for long
and they may incur some loss. Next second rank with the score value of 73.00 was given to
the problem of inadequate facilities in market. There is lack of adequate facilities in the
market, such as lack of seating space, no packing place, difficulty during rainy season, dirty
market place, etc. Third rank with the score value of 60.00 was given to the problem of
payment of unauthorized fee (bribing). The wholesalers of passion fruit have to bribe many
personals so that they can do business. Competition from others, lack of storage facilities,
perishability, non-availability of market credit, high market fee and lack of market
information were allotted fourth, fifth, sixth, seventh, eighth and ninth ranks with mean score

328
values of 58.00, 48.33, 46.67, 32.50, 31.33 and 24.17 respectively. There is competition from
other wholesaler to take possession of more produce.
Table 53: Constraints perceived by the society in marketing of Passion fruit
Constraints Rank
High transportation charge 1
Exploitation by factory 2
Illegal taxes and fees 3
Adulteration with low quality fruits by
farmers 4
Lack of storage facilities 5
Perishability 6
Band, blockage, strikes, curfew 7
Non-availability of market credit 8
Competition from others 9
High transportation charge was ranked as the first major constraints faced by the society in
the marketing of the product (Table 53). Due to the nature of terrain and the status of
connectivity of the area, the Society has to incur high transportation charges. Next second
rank was given to the problem of exploitation by the juice factory. After bringing the produce
to the juice factory, factory sometimes exploit the Society by offering low price or refusing to
take the produce. The Society is compelled to accept the price offered by the factory as they
cannot return the produce to the farmers as well as there is no other market where they can
sell the produce. Third rank was given to the problem of payment of illegal taxes and fees.
The Society has to pay many illegal taxes so that they can do business in that area.
Adulteration with low quality and unripe fruits by the farmers, lack of storage facilities,
perishability of the product, bands, blockades, strikes, curfew, etc. non-availability of market
credit and competition from others were allotted fourth, fifth, sixth, seventh, eighth and ninth
ranks. The farmers sometimes mixed unripe and diseased fruits with the good ones, thus
lowering the value of the produce.

329
Suggestions of farmers, retailers, wholesaler and society for increasing the marketing
efficiency of passion fruits are presented in Table 54, Table 55, Table 56 and Table 57
respectively.
Table 54: Suggestions of farmers for increasing marketing efficiency of passion
fruits
Sl.No. Suggestions
1 Intervention by State Government agencies by fixing reasonable
price.
2 Introduction of an efficient market regulation.
3 Provision of adequate facilities in market.
4 Establishment of adequate cold storage facilities.
5 Improvement of the market information delivery system.
6 Numbers of bands, blockade, strikes, curfew, etc. should be
reduced.
7 Quick and efficient means of transport with good packing.
The State Government agencies should fix reasonable and remunerative prices for the
produce. Formation of more Grower’s Association/ Societies or Organization in the region to
facilitate market channel as well as proper technology transfer and effective capacity
building. Introduction of an efficient market regulation would make the marketing system
more transparent and perfect. Improving transparency of the marketing activities of the
various middlemen involved through supervision and making availability of up-to-date
market information to the farmers is the need of the hour. Cold storage facilities should be
established near the production area. Bands, blockade, strikes, curfew, etc. hinders business
so the Government as well as the private organization should try to avoid such kind of
unwanted situations as far as possible. The transportation facilities need to be strengthened
especially for transporting produce to consuming market so as to take benefit of higher prices
in these markets.

330
The people should be made aware about the fruit by advertising in newspapers and radio, etc.
so that there is demand of the fruit. There is a need to widen the market for passion fruit/
juice by extension and popularization methods.
Table 55: Suggestions of retailer for increasing marketing efficiency of passion fruit
Sl.No. Suggestions
1 Creating awareness about the fruit.
2 Provision of adequate facilities in market.
3 Numbers of bands, blockade, strikes, curfew, etc. should be
reduced.
4 Punishment of those taking and demanding unauthorized fees.
5 Establishment of adequate cold storage facilities.
6 Introduction of an efficient market regulation.
7 Market credit should be made easily available.
Table 56: Suggestions of wholesaler for increasing marketing efficiency of passion fruit
Sl.No. Suggestions
1 Numbers of bands, blockade, strikes, curfew, etc. should be
reduced.
2 Provision of adequate facilities in market.
3 Punishment of those taking and demanding unauthorized fees.
4 Production should be increased
5 Establishment of adequate cold storage facilities.
6 Market credit should be made easily available.
Provision of adequate marketing facilities such as proper seating place, packing space for
vehicles, clean market place, etc. so that the retailers and the wholesalers do not face any
difficulty in marketing their produce. Bands, blockade, strikes, curfew, etc. hinders business
so the Government as well as the private organization should try to avoid such kind of
unwanted situations as far as possible. The retailers and the wholesalers have to pay many

331
unwanted or illegal fees to many persons so that they can market their produce. They should
unite together and stand against these persons and make efforts to get these illegal charges
removed. The government should punish those persons demanding and taking illegal fees
from the retailers. Adequate cold storage facilities should be established in the market.
Regulated markets should be developed. Market credit should be made available easily and
quickly.
Table 57: Suggestions of society for increasing marketing efficiency of passion fruit
Sl.No. Suggestions
1 Transportation charges should be reduced.
2 Establishment of proper road connectivity.
3 Setting up/ strengthening of new/ existing processing and semi-
processing units.
4 Numbers of bands, blockade, strikes, curfew, etc. should be
reduced.
5 Punishment of those taking and demanding unauthorized fees.
6 Introduction of an efficient market regulation.
7 Production should be increased.
8 Market credit should be made easily available.
9 Provision of adequate facilities in market.
The transportation facilities need to be strengthened by constructing new roads and
improving the condition of the existing ones and increasing the number of transport vehicle
with cold storage facility. Setting up/ strengthening of new/ existing processing and semi-
processing units. Bands, blockade, strikes, curfew, etc. hinders business so the Government
as well as the private organization should try to avoid such kind of unwanted situations as far
as possible. Efficient market regulation should be introduced. Production of the fruit should
be increased. Market credit should be made available easily and quickly.
The marketing efficiency of passion fruit in Manipur is significantly affected by marketing
cost, marketing margin, transport cost and length of the market channel at 1% significant
level and by volume produce handled at 10% significant level. The marketing efficiency will

332
increase with the decrease in the marketing cost and length of the marketing channel; and
with the increase in the marketing margin, transport cost and volume of the produce handled.
Table 58: Factors affecting Marketing Efficiency of Passion Fruit in Manipur
Sl.No. Factors Coefficient Standard
error
‘t’
value
1 Constant 1.834*** 0.025 73.190
2 Marketing cost -4.191*** 0.001 -19.368
3 Marketing margin 1.458*** 0.002 14.328
4 Transport cost 3.071*** 0.001 14.808
5 Open Market price - - -
6 Labour wages - - -
7 Controlling middlemen - - -
8 Volume of produce handled 0.176* 0.002 1.810
9 Presence of cold storage
facilities
- - -
10 Length of market channel -0.709*** 0.017 -11.590
11 Existence of competition in
selling
- - -
12 Nature of produce - - -
13 R-square 0.866
14 Adjusted R-square 0.859
15 No. of observation 120
(***) Significant at 1%
( ** ) Significant at 5%
( * ) Significant at 10%
Due to the lack of demand and awareness, passion fruit do not fetch good price in the local
market, but if the fruit is transported to the juice factory at Mao or to the Imphal market by

333
incurring some extra transportation cost, the farmers get good return for their produce. Thus
marketing efficiency increase with the increase in transport cost.
3.4 ANTHURIUM FLOWER
Anthurium is one of the most popular of the tropical cut flowers which are being grown
commercially for export as well as for the local market. Anthuriums are perennials with
creeping habitat. They prefer to grow under shade. Anthuriums are cultivated for its attractive
long lasting ‘flower’ which is not really a flower but an inflorescence rising from the base of
a bract.
Anthurium (Anthurium andreanum Lind.) belongs to the family Araceae. There are two types
of anthurium under cultivation: the foliage and the flowering types. The foliage is grown for
their velvety leaves while the flowering type is for their showy flowers, which consists of
spadix and spathe. The true flowers are borne on a spike called spadix protruding from the
base of the spathe. The spathe is a modified leaf typically heart shape. It comes in different
colors – pink, white, green and red.
Flowers are sold according to sizes of the spathe (length across the broadest part)
1. jumbo (10.0 cm and above)
2. extra large (8.0 – 8.5 cm)
3. large (7.0 – 7.5 cm)
4. medium (6.0 – 6.5 cm)
5. small (5.5 cm and below)
Anthurium in Mizoram
Taking into account the ideal climatic condition of Mizoram, the Department of Horticulture
started encouraging farmers for commercial cultivation of Anthurium in the month of
November, 2002 under Technology Mission for Integrated Development of Horticulture in
North East States. At first 24 potential grower’s were identified for taking up anthurium
cultivation by providing quality planting materials along with shade nets and other required
inputs like coco peat, sprinkler irrigation etc. and the first batch of export to neighbouring
states was achieved in the month of October, 2003 i.e. within a short span of time 11 months
from planting to production of cut flowers.
Selected farmers are provided basic training in cultivation and maintenance of their gardens
by field officers of the department. It is worth mentioning that most of the selected growers
are women, which is the fulfillment of the aim to uplift women in the state. The income of the

334
24 initial growers varies from Rs. 6000 to Rs. 10,000 per month. About one third of the total
cut flowers produced in the state have been sold outside the state through Bangalore based
exporter, ZOPAR Export Ltd. and the remaining consumed in the state. At present, different
International varieties of Anthurium are cultivated by the growers. The flowers of anthurium
are in great demand and at present there are more than 300 farmers who are earning their
livelihood from anthurium cultivation. The area possessed by these individual farmers’
ranges from 300 sq.m. to 500 sq.m. accommodating about 3000–5000 plants, with a
production of 5,000-10,000 cut flowers in a year depending on the area of their cultivation.
The area possessed by these individual farmers may be small, but the farmers bring their
products at one collection centre and create large volume as little drops of water makes a
mighty ocean.
Some anthurium varieties planted in Mizoram are Tropical, Fire, Calisto, Choco, Sirian,
Cheers, Rosa, Simba, Emeralda, Grace, Alcapana, Terussal, etc.
ZO-Anthurium Growers’ Society Limited (ZAGS)
The anthurium growers of Mizoram formed a society called ‘ZO- Anthurium Grower’s
Society’, which helps in communicating the hardship/drawback faced by the farmers in
prices, markets, inputs, expansion etc. The society participated in various state level and
national level exhibition show etc.
The aims and objectives of ZAGS are
1. Promotion of Anthurium cultivation for bulk production to generate income from
other Indian States and abroad.
2. To enhance family income and to also promote and generate self employment with
special target on weaker section of the community.
3. To create awareness and incalculate among the general public that floriculture is a
sustainable source of livelihood/ income.
4. To bring together all Anthurium growers under one umbrella for mutual interest from
cultivation, care and sale of products.
5. To extend possible co-operation and support to the State Government in steps taken in
the cultivation and sale of Anthurium.
The membership of ZAGS is open to all the growers having not less than 1000 Anthurium
plants. The members should pay membership fee of Rs.500 and annual fee of Rs.50 every
year. The power of recruitment of new members is vested to the Executive Committee. Any

335
member failing to pay annual fee till April end following the preceeding year disqualify
himself/ herself from membership of the Society.
The Office Bearers of ZAGS comprises of President, Vice President, General Secretary, Asst.
Secretary, Treasurer and Financial Secretary. Election of Office bearer is conducted at a
General Assembly by secret ballot either post by post or by simultaneous election of six
Office Bearer members who amongst themselves designate posts.
The Executive Committee comprises not more than 20 members. Office Bearers appoint the
members within one week from the date of election. Handing over and taking of charge is
concluded within 14 days from the date of election. The Executive Committee has the power
to appoint not more than two Senior Advisers. The Headquarter of ZAGS is at Aizawl.
The success of the initial growers has inspired other so much in the capital and also in other
towns of the state. The gardeners and florists wish to take up the same venture too. Most of
the growers are still expanding their farm with their own resources and more than 30 growers
have even availed Bank Loans for the expansion of the same. This venture has not only
brought about a change in the Horticulture scenarios of the state, but also uplifts the living
condition of the growers to a great extent. It provides employment and regular income to the
growers and other unskilled labour. It is expected that it will bring about increase in the
export income substantially.
It is worth mentioning that the first consignment of Anthurium cut flowers from Mizoram
was sent of on 23rd
August, 2006 to UAE through ZOPAR Exports Pvt. Ltd.
As per the latest record, there are 472 families in Mizoram engaged in anthurium cultivation
who get financial assistance from the horticulture department, government of Mizoram.
Aizawl district tops the list in family wise with as many as 313 families while Lunglei
seconded with 67 families followed by Serchhip district with 43 families.
Marketing Channel
All the sample anthurium growers in Mizoram are members of ZO- Anthurium Grower’s
Society and they market their produce through Bangalore based exporter, ZOPAR Export
Ltd. A large volume of the cut flower is sold to wholesalers in other states like Kolkata,
Delhi, Mumbai and Bangalore and a very small quantity of flowers are sold in state itself.
The prominent marketing channel followed by anthurium grower in Mizoram is given in
Table 59

336
Table 59: Marketing channel of Anthurium in Mizoram
Particulars Supply chain
Channel 1
Producer – ZOPAR (Wholesaler) – Wholesaler/Retailer in other
states
Channel 2 Producer – Retailer – Consumer
Quantity handled
The number of stem purchased by ZOPAR Export Ltd. from ZO- Anthurium Grower’s
Society (ZAGS) and sold to other states in 2008-09 is 717480 stems (98.91 percent) worth
Rs.5089475.50. The number of stems sold is the Mizoram is only 7890 (1.09 percent), worth
Rs.31560.
Table 60: Quantity handled in different marketing channel of Anthurium
Marketing
channel No. of Spike
% to the total
Value (Rs.)
Channel 1 717480 98.91 5089475.50
Channel 2 7890 1.09 31560.00
Total 725370 100 5121035.50

337
Marketing cost
The marketing cost incurred by the anthurium growers in Mizoram is given in Table
61.
Table 61: Marketing Cost of Anthurium incurred by the Farmers
(Rs. per stem)
Items Cost
% to total marketing
cost
Farm gate Price 9.41 -
Cleaning & sorting 0.56 70.34
Packing material 0.08 9.59
Losses 0.14 17.73
Transportation 0.02 2.34
Total marketing cost 0.79 100
ZAGS average selling price to
ZOPAR 10.20 -
It can be seen from the table that the marketing cost incurred by the anthurium growers is
Rs.0.79 per stem, of which cleaning and sorting consumed the highest share (70.34 percent),
followed by losses (17.73 percent), packing material (9.59 percent) and transportation (2.34
percent).
Anthurium is sold outside Mizoram to states like Kolkata, Bangalore, Mumbai and Delhi.
The flower is transported through air after proper packing. The packing cost and air freight
calculation are given in the tables below. After proper packing, the flowers are flown to
Kolkata and then to Bangalore, Mumbai or Delhi.

338
Table 62: Packing cost calculation for Anthurium
Size Maste
r Box
Inne
r
Box
Flowers/
inner box
Total
no. of
flower
Inner Box
(Rs.35*5=Rs.1
75)
Master
box
(Rs.95)
Cost/stem
(Rs.)
Small 1 5 50 250 0.70 0.38 1.08
Medium 1 5 40 200 0.88 0.48 1.35
Large 1 5 30 150 1.17 0.63 1.80
Extra
Large
1 5 25 125 1.40 0.76 2.16
Jumbo 1 5 15 75 2.33 1.27 3.60
From the above table it can be seen that anthurium flower is packed first in the inner box and
then in the master box. Five inner boxes can be placed inside a master box. The number of
flowers that can be placed inside the inner box is 50 small, 40 medium, 30 large, 25 extra
large or 15 jumbo size flowers. Thus the total number of flowers per master box is 250 small,
200 medium, 150 large, 125 extra large or 75 jumbo. The packing cost of master box is Rs.95
and that of the inner box is Rs.35. The packing cost per stem is calculated as Rs.1.08,
Rs.1.35, Rs.1.80, Rs.2.16 and Rs.3.60 for small, medium, large, extra large and jumbo size
flowers respectively.

339
Table 63: Air Freight calculation for Anthurium
(Rs. per stem)
Size Total
no. of
flower
in
master
box
Volume
weight
Aizawl-
Kolkata
(Rs.23)
Kolkata-
Bangalore
(Rs.24)
Kolkata-
Mumbai
(Rs.22.85)
Kolkata-
Delhi
(Rs.19.4)
Small 250 23 2.12 2.21 2.10 1.78
Medium 200 23 2.65 2.76 2.63 2.23
Large 150 23 3.53 3.68 3.50 2.97
Extra
Large
125 23 4.23 4.42 4.20 3.57
Jumbo 75 23 7.05 7.36 7.01 5.95
From the above table it can be seen that the air freight per unit volume weight is Rs.23 for
Aizawl – Kolkata, Rs.24 for Kolkata – Bangalore, Rs.22.85 for Kolkata – Mumbai and
Rs.19.40 for Kolkata – Delhi. The air freight per stem for Aizawl – Kolkata is calculated to
be Rs.2.12, Rs.2.65, Rs.3.53, Rs.4.23 and Rs.7.05 for small, medium, large, extra large and
jumbo size flowers respectively. The air freight per stem for Kolkata – Bangalore is
calculated to be Rs.2.21, Rs.2.76, Rs.3.68, Rs.4.42 and Rs.7.36 for small, medium, large,
extra large and jumbo size flowers respectively. The air freight per stem for Kolkata –
Mumbai is calculated to be Rs.2.10, Rs.2.63, Rs.3.50, Rs.4.20 and Rs.7.01 for small,
medium, large, extra large and jumbo size flowers respectively. The air freight per stem for
Kolkata – Delhi is calculated to be Rs.1.78, Rs.2.23, Rs.2.97, Rs.3.57 and Rs.5.95 for small,
medium, large, extra large and jumbo size flowers respectively.

340
Table 64: Cost incurred by ZOPAR (Wholesaler) upto the destination
(Rs. per stem)
Size ZAGS
Price
Packing
cost
Air freight from Aizawl ZOPAR landed cost
Kolkata Bangalore Mumbai Delhi Kolkata Bangalore Mumbai Delhi
Small 5 1.08 2.12 4.32 4.22 3.9 8.20 10.41 10.30 9.98
Medium 7 1.35 2.65 5.41 5.27 4.88 11.00 13.76 13.63 13.23
Large 12 1.80 3.53 7.21 7.03 6.5 17.33 21.01 20.83 20.30
Extra
Large
13 2.16 4.23 8.65 8.44 7.8 19.39 23.81 23.59 22.96
Jumbo 14 3.60 7.05 14.41 14.06 13.00 24.65 32.01 31.66 30.60
Average 10.20 2.00 3.92 8.00 7.80 7.22 16.11 20.20 20.00 19.41
Table 64 shows the cost incurred by ZOPAR (Wholesaler) up to the destination, which
include ZAGS selling price to ZOPAR, packing cost and air freight from Aizawl.
At the destination ZOPAR has to incur some more cost for marketing the flower and is shown
in Table 65. The marketing cost incurred by ZOPAR at the destination is found to be Rs.1.90
per stem, of which spoilage occupy the highest share (74.56 percent), followed by
transportation (18.78 percent), sorting (4.03 percent), carrying charge (1.88 percent) and
loading/unloading (0.75 percent). About 20 percent of the flower is damage when they reach
the destination. The cost of transportation is Rs.1500 per 30 boxes (1 box contains 140
flowers), loading/unloading is Rs.2 per box and carrying charge is Rs.5 per box.

341
Table 65: ZOPAR (Wholesaler) marketing cost at destination
(Rs. per stem)
Items Cost
% to total marketing
cost
Sorting 0.08 4.03
Spoilage 1.42 74.56
Transportation 0.36 18.78
Loading/unloading 0.01 0.75
Carrying charge 0.04 1.88
Total 1.90 100.00
Marketing costs and marketing margins per stem of anthurium flower for Channel 1 in
Mizoram have been presented in Table 10. The farmer’s share has been found to be 45.42
percent, 37.31 percent, 37.38 percent and 38.33 percent in Kolkata, Bangalore, Mumbai and
Delhi respectively. Total marketing expenses incurred by farmer is worked out to be Rs.0.79
per stem, of which cleaning and sorting consumed highest share of the marketing cost
incurred by producer. Post harvest losses rank second, followed by cost of packing material
and then transportation. Table shows that the producer, on an average receives Rs.10.20 per
stem. It is observed from the table that passion fruit producer fetches Rs.9.41 per stem as his
net margin.
The ZOPAR has to incur a total marketing cost of Rs.7.82 (37.72 percent), Rs.11.90 (47.19
percent), Rs.11.70 (47.08 percent) and Rs.11.12 (45.28 percent) to market one stem of
anthurium flower in Kolkata, Bangalore, Mumbai and Delhi respectively. This cost included
packing cost, air-freight from Aizawl and marketing cost at destination. The ZOPAR’s selling
price of one stem of anthurium flower is found to be Rs.20.72, Rs.25.22, Rs.24.86 and
Rs.24.55 in Kolkata, Bangalore, Mumbai and Delhi respectively. However, ZOPAR fetches
Rs.2.70 (13.05 percent), Rs.3.12 (12.36 percent), Rs.2.96 (11.89 percent) and Rs.3.32 (13.17
percent) as profit or margin. In this channel, the producers incur less marketing cost than
ZOPAR.

342
Table 66: Marketing Cost and marketing Margin of Anthurium (Channel 1)
(Rs. per stem)
Items Cost % Consumer Price in
Kolkata Bangalore Mumbai Delhi
Farm gate Price 9.41 45.42 37.31 37.85 38.33
Cleaning & sorting 0.56 2.68 2.20 2.23 2.26
Packing material 0.08 0.37 0.30 0.30 0.31
Losses 0.14 0.68 0.56 0.56 0.57
Transportation 0.02 0.09 0.07 0.07 0.08
Total marketing cost 0.79 3.81 3.13 3.18 3.22
ZAGS selling price to ZOPAR 10.20 49.23 40.44 41.03 41.55
Packing cost 2.00 9.64 7.92 8.04 8.14
Air freight
Aizawl-Kolkata 3.92 18.90
Aizawl-Bangalore 8.00
31.73
Aizawl-Mumbai 7.80
31.39
Aizawl-Delhi 7.22
29.39
ZOPAR marketing cost at destination
Sorting 0.08 0.37 0.30 0.31 0.31
Spoilage 1.42 6.84 5.62 5.70 5.78
Transportation 0.36 1.72 1.42 1.44 1.45
Loading/unloading 0.01 0.07 0.06 0.06 0.06
Carrying charge 0.04 0.17 0.14 0.14 0.15
Total 1.90 9.18 7.54 7.65 7.75
ZOPAR total marketing cost
Kolkata 7.82 37.72
Bangalore 11.90
47.19
Mumbai 11.70
47.08

343
Delhi 11.12
45.28
ZOPAR marketing margin
Kolkata 2.70 13.05
Bangalore 3.12
12.36
Mumbai 2.96
11.89
Delhi 3.23
13.17
ZOPAR selling price
Kolkata 20.72 100
Bangalore 25.22
100
Mumbai 24.86
100
Delhi 24.55
100
Table 67: Marketing Cost and marketing Margin of Anthurium (Channel 2)
(Rs. per stem)
Items Cost % Consumer Price
Farm gate Price 3.21 38.51
Cleaning & sorting 0.56 6.66
Packing material 0.08 0.91
Losses 0.14 1.68
Transportation 0.02 0.24
Total marketing cost 0.79 9.49
Farmers' selling price to retailer 4.00 48.00
Sorting 0.00 0.00
Spoilage 0.18 2.16
Transport 0.05 0.60
Total marketing cost 0.23 2.76

344
Marketing margin 4.10 49.24
Retailers price to consumer 8.33 100.00
Marketing costs and marketing margins per stem of anthurium flower for Channel 2 in
Mizoram have been presented in Table 67. The farmer’s share in the consumer’s rupee has
been found to be 38.51 percent. Total marketing expenses incurred by farmer for marketing
one stem of the flower is worked out to be Rs. 0.79 of which cost on cleaning and sorting
consumed the highest share, i.e., about 70.20 percent of the marketing cost incurred by
producer. Losses (17.70 percent) ranks second, followed by packing material (9.57 percent)
and then transportation (2.53 percent). Table shows that the producer, on an average receives
Rs. 4 per stem of anthurium. It is observed from the table that anthurium producer fetches Rs.
3.21 per stem of anthurium as his net margin.
The retailer has to incur a cost amounting Rs. 0.23, i.e., 2.76 percent of retail price to market
one stem of anthurium flower. Of this cost about 78 percent are losses and the remaining 22
percent transportation cost. However, he fetches Rs. 4.10 which accounts for 49.24 percent of
the price received by him as profit or margin. In Channel 2, the producers incur more
marketing cost than the retailers.

345
Table68: Marketing cost and Marketing margin of anthurium (Rs./stem)
ITEMS
CHANNEL 1 CHANNEL 2
Kolkata Bangalore Mumbai Delhi Average
Cost
%
Consume
r Price
Cost
%
Consume
r Price
Cost
%
Consume
r Price
Cost
%
Consume
r Price
Cost
%
Consume
r Price
Cost
%
Consume
r Price
Farm gate price 9.41 45.42 9.41 37.31 9.41 37.85 9.41 38.33 9.41 39.48 3.21 38.51
Marketing cost
Producer 0.79 3.81 0.79 3.13 0.79 3.18 0.79 3.22 0.79 3.31 0.79 9.49
ZOPAR 7.82 37.72
11.9
0 47.19
11.7
0 47.08 11.12 45.28
10.6
3
44.61
- -
Retailer - - - - - - - - - - 0.23 2.76
Total Marketing
Cost 8.61 41.53
12.6
9 50.32
12.4
9 50.25 11.91 48.49
11.4
2
47.92
1.02 12.25
Marketing margin

346
ZOPAR 2.70 13.05 3.12 12.36 2.96 11.89 3.23 13.17 3.00 12.60 - -
Retailer - - - - - - - - - - 4.10 49.24
Total Marketing
Margin 2.70 13.05 3.12 12.36 2.96 11.89 3.23 13.17
3.00 12.60
4.10 49.24
Consumer Price
20.7
2 100.00
25.2
2 100.00
24.8
6 100.00 24.55 100.00
23.8
4
100.00
8.33 100.00

347
Channel-wise marketing cost and marketing margin of anthurium is shown in Table 68.
Marketing cost and marketing margin vary considerably from channel to channel. Marketing
cost and marketing margin are found to be higher in Channel 1 then in Channel 2. The
average marketing cost for Channel 1 is estimated to be Rs.11.42 (Rs.8.61, Rs.12.69,
Rs.12.49 and 11.91 per stem of the flower in Kolkata, Bangalore, Mumbai and Delhi
respectively). And the average marketing margin for Channel 1 is estimated to be Rs.3
(Rs.2.70, Rs.3.12, Rs.2.96 and 3.23 per stem of the flower in Kolkata, Bangalore, Mumbai
and Delhi respectively). While the marketing cost and marketing margin for Channel 2 is
found to be Rs.1.02 and Rs.4.10 per stem of anthurium flower respectively.
Table 69: Price spread of Anthurium (Rs./stem)
Particulars
Channel 1 Channel
2
Kolkata Bangalore Mumbai Delhi
Average
Price received by the
farmer 10.20 10.20 10.20 10.20
10.20
4.00
Cost incurred 0.79 0.79 0.79 0.79 0.79 0.79
Margin 9.41 9.41 9.41 9.41 9.41 3.21
ZOPAR's purchase price 10.20 10.20 10.20 10.20 10.20 -
Cost incurred 7.82 11.90 11.70 11.12 10.63 -
Margin 2.70 3.12 2.96 3.23 3.00 -
Retailer's purchase price - - - - - 4.00
Cost incurred - - - - - 0.23
Margin - - - - - 4.10
ZOPAR selling price/
Price paid by consumer
20.72
25.22
24.86
24.55
23.84
8.33
Price spread 11.31 15.81 15.45 15.14 14.43 5.12

348
The price spread in the various channels involved in the marketing of anthurium is given in
Table 69. This price spread consists of the marketing costs and marketing margins of the
intermediaries, which ultimately determine the overall effectiveness of the marketing system.
The price spread in Channel 1 was found to be higher (Rs.14.43 per stem) than in Channel 2
(Rs.5.12 per stem).
Table 70: Share of different agencies during marketing of anthurium
Sl.No.
Agency
Function
Share in final price
Channel 1 Channel
2
Kolkata Bangalore Mumbai Delhi Average
1 Retailers Retailing - - - - - 49.24
2 ZOPAR
Assembling/
transportation 13.05 12.36 11.89 13.17 12.62 -
3 Farmers Production 45.42 37.31 37.85 38.33 39.73 38.51
Total
58.47 49.68 49.75 51.51 52.35 87.75
A comparative view of producer’s share and the shares of the various intermediaries involved
in the different marketing channels is presented in Table 70. The producer’s net share was the
higher (average 39.73 percent) in Channel 1 than in Channel 2 (38.51 percent). ZOPAR’s
share was found to be 13.05 percent, 12.36 percent, 11.89 percent and 13.17 percent in
Kolkata, Bangalore, Mumbai and Delhi respectively. The retailers’ share in final price in
Channel 2 was found to be 49.24 percent.
Marketing efficiency was also calculated for the identified two channels by Conventional
method, Shephered’s method and Acharya’s method and presented in Table 71. The
marketing efficiency was found to be higher in Channel 2 (5.02 and 8.16) than in Channel 1
(1.26 and 2.09) when calculated by Conventional method (i.e. value added by marketing
system divided by total marketing cost) and Shephered’s method (i.e. retailer’s sale price
divided by total marketing cost). But, when calculated by Acharya’s method (i.e. price

349
received by farmers divided by total marketing cost and margin), it was found to be higher in
Channel 1 (0.65) than in Channel 2 (0.63).

350
Table 71: Measurement of Marketing Efficiency of anthurium
Sl.No.
Particulars
Unit
Channel 1 Channel
2
Kolkata Bangalore Mumbai Delhi Average
1 Retailer's sale price (RP) Rs./stem 20.72 25.22 24.86 24.55 23.84 8.33
2 Total marketing cost (MC) Rs./stem 8.61 12.69 12.49 11.91 11.42 1.02
3 Total margins of intermediaries (MM) Rs./stem 2.70 3.12 2.96 3.23 3.00 4.10
4 Price received by farmers (FP) Rs./stem 9.41 9.41 9.41 9.41 9.41 3.21
5 Value added by the marketing system (1-4) Rs./stem 11.31 15.81 15.45 15.14 14.43 5.12
Index of Marketing Efficiency
Convention method (E) (5/2) Ratio 1.31 1.25 1.24 1.27 1.26 5.02
Shephered's method (ME) (1/2) Ratio 2.41 1.99 1.99 2.06 2.09 8.16
Acharya's method (MME) [4/(2+3)] Ratio 0.83 0.60 0.61 0.62 0.65 0.63

351
Marketing Constraints
Based on the information furnished by the sample respondents, the constraints being faced by
them in the marketing of anthurium were ranked and prioritized by using Garrett’s ranking
method, and have been recorded in Tables below.
Table 72: Constraints perceived by the farmers in marketing of Anthurium
Constraints
Mean
score Rank
Forced to sell to ZOPAR due to absence of other
market 79.67 1
Low price 71.98 2
High cost of packing 62.64 3
Inadequate market information 58.51 4
Lack of technology to keep freshness of flower 51.63 5
Frequent emergence of new hybrid 48.57 6
Lack of storage facilities 41.21 7
High rate of damage in transit 37.79 8
Transportation 27.60 9
Non-availability of market credit 20.40 10
Forced to sell to ZOPAR due to absence of other market was ranked as the first major constraints
(with a mean score of 79.67) faced by the anthurium growers in the marketing of the product
(Table 73). Next, second rank with the score value of 71.98 was given to low price. Almost all of
the anthurium growers in the sample area market their produce through ZOPAR as there is no
other market. ZOPAR pay them only Rs.5, Rs.7, Rs.12, Rs.13 and Rs.14 for small, medium,
large, extra large and jumbo size flowers. These prices have been constant for many years and
the farmers want ZOPAR to increase the price. But they are compelled to accept the price paid
by the ZOPAR as there is no other market for their produce. High cost of packing ranked third

352
with a mean score of 62.64. Inadequate market information ranked fourth with a mean score of
58.51. The farmers lack market information about the prevailing prices in the market and other
markets, so they are easily exploited by the middlemen. Lack of technology to keep freshness of
flower, frequent emergence of new hybrid, lack of storage facilities, high rate of damage during
transit, transportation and non-availability of market credit were ranked fifth, sixth, seventh,
eighth, ninth and tenth with mean score values of 51.63, 48.57, 41.21, 37.79, 27.60 and 20.40
respectively.
Table 73: Constraints perceived by ZOPAR (Wholesaler) in marketing of
Anthurium
Constraints Rank
High transportation cost 1
High cost of packing 2
Less number of flight from Aizwal 3
Frequent cancellation of flight 4
Lack of storage facilities in airport 5
Less supply in winter 6
Post harvest loss due to bad practice by farmers 7
High rate of damage in transit 8
Lack of technology to keep freshness of flower 9
High transportation charge was ranked as the first major constraints faced by ZOPAR in the
marketing of the product (Table 74). Due to the nature of terrain and the status of connectivity of
the area, ZOPAR has to incur high transportation charges, which include transporting the
produce from farm to airport and air freight from Aizawl to Kolkata and then from Kolkata to
Bangalore, Mumbai or Delhi. Next second rank was given to the high cost of packing and
packing material. The flowers have to be packed properly, otherwise they will get spoilt. There
are two main methods of packing followed by ZOPAR – (i) Mauritius and Hawaii (the flowers
are packed with slightly moist shredded newspaper in the box) and (ii) Taiwan (the flowers are
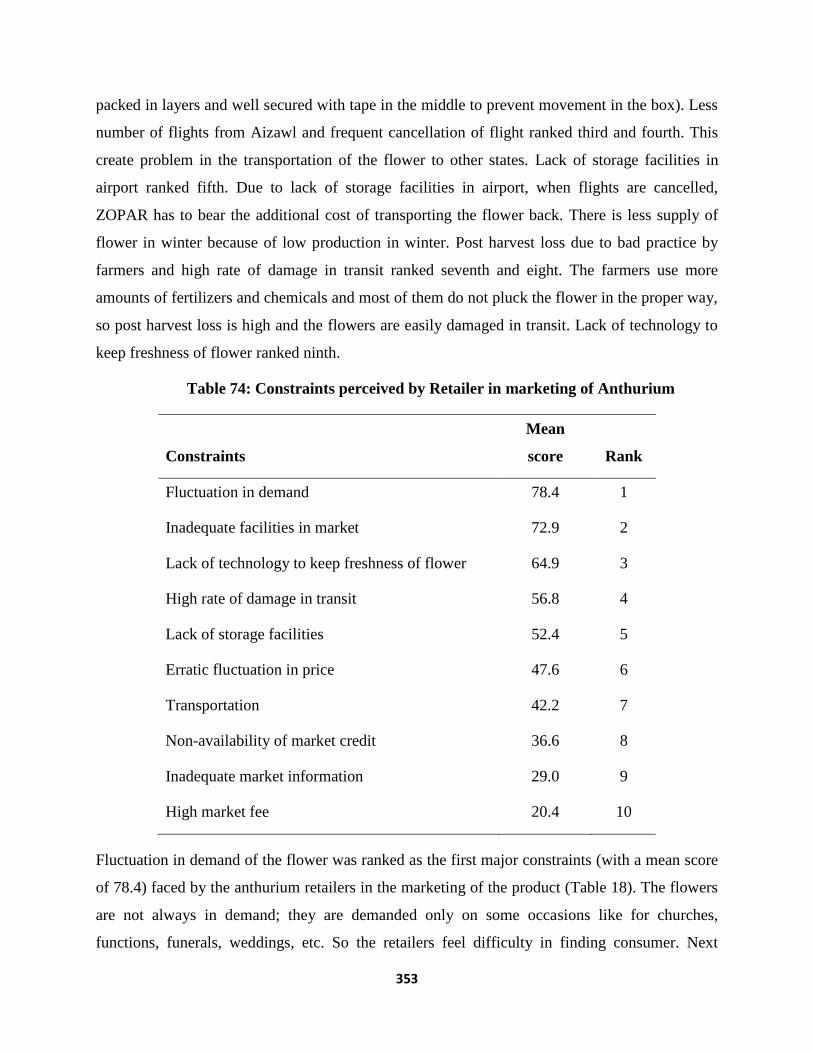
353
packed in layers and well secured with tape in the middle to prevent movement in the box). Less
number of flights from Aizawl and frequent cancellation of flight ranked third and fourth. This
create problem in the transportation of the flower to other states. Lack of storage facilities in
airport ranked fifth. Due to lack of storage facilities in airport, when flights are cancelled,
ZOPAR has to bear the additional cost of transporting the flower back. There is less supply of
flower in winter because of low production in winter. Post harvest loss due to bad practice by
farmers and high rate of damage in transit ranked seventh and eight. The farmers use more
amounts of fertilizers and chemicals and most of them do not pluck the flower in the proper way,
so post harvest loss is high and the flowers are easily damaged in transit. Lack of technology to
keep freshness of flower ranked ninth.
Table 74: Constraints perceived by Retailer in marketing of Anthurium
Constraints
Mean
score Rank
Fluctuation in demand 78.4 1
Inadequate facilities in market 72.9 2
Lack of technology to keep freshness of flower 64.9 3
High rate of damage in transit 56.8 4
Lack of storage facilities 52.4 5
Erratic fluctuation in price 47.6 6
Transportation 42.2 7
Non-availability of market credit 36.6 8
Inadequate market information 29.0 9
High market fee 20.4 10
Fluctuation in demand of the flower was ranked as the first major constraints (with a mean score
of 78.4) faced by the anthurium retailers in the marketing of the product (Table 18). The flowers
are not always in demand; they are demanded only on some occasions like for churches,
functions, funerals, weddings, etc. So the retailers feel difficulty in finding consumer. Next

354
second rank with the score value of 72.9 was given to the problem of inadequate facilities in
market. There is lack of adequate facilities in the market, such as lack of selling space, etc. Third
rank with the score value of 64.9 was given to the problem of lack of technology to keep
freshness of flower. The retailers do not have proper knowledge of how to keep the flower fresh
for a longer time. High rate of damage in transit, lack of storage facilities, erratic fluctuation in
price, transportation, non-availability of market credit, inadequate market information and high
market fee were allotted fourth, fifth, sixth, seventh, eighth, ninth and tenth ranks with mean
score values of 56.8, 52.4, 47.6, 42.2, 36.6, 29.0 and 20.4 respectively.
Suggestions
Table 75: Suggestions of anthurium growers for increasing marketing efficiency
Sl.No. Suggestions
1 Development of new markets for anthurium
2 Remunerative prices
3 Research in packing and post harvest practices
4 Improvement in the market information delivery system
5 Establishment of cold storage facilities
6 Quick and efficient means of transport
7 Market credit should be made easily available
Almost all of the anthurium growers sell their produce to ZOPAR as there is no other
market. They are compelled to accept the price offered by ZOPAR. New market and
other marketing co-operatives should be developed so that farmers have the choice to sell
to other market and have more bargaining power. Cultivation of antrhurium is capital
intensive and required large amount of investment. The farmers should be offered
remunerative prices and incentives. There is high rate of post harvest losses. This can be
somewhat reduced by properly packing the flower. Research in proper packing and post
harvest practices should encouraged. It was observed that most of the farmers were

355
unaware about the market charges, rules and regulations of the market and prevailing
prices in market. The Government should establish market information office, distribute
pamphlets, leaflets, drawing charts to the farmers and market information should be
broadcast in radio and local T.V. channels. Cold storage facilities should be established
so that the farmers can store their produce for a longer time. The transportation facilities
need to be strengthened by constructing new roads and improving the condition of the
existing ones and increasing the number of refrigerated vans. Government credit agencies
should provide loans on easy installment and simple procedure should be adopted so that
the farmers can take advantage of the Government loans. It can save the farmers from the
clutches of commission agents and hence marketing output can be improved.
Table 76: Suggestions of ZOPAR for increasing marketing efficiency of anthurium
flower
Sl.No. Suggestions
1 Transportation charges and air freight rate should be reduced.
2 Research in packing and post harvest practices
3 Frequency of flight from Aizawl should be increased
4 Establishment of cold storage facilities in airport
5 Farmers should plant more flower under Hi-tech condition so as to give
steady supply of flower
6 Farmers should follow good cultivation practices like using lesser
amounts of fertilizers and chemicals and plucking/ harvesting the flowers
in the proper way.
ZOPAR incurred high amount of cost on transporting the flower. Inorder to increase marketing
efficiency, transportation charges and air freight rate should be reduced. The Government should
subsidize the air freight rate. There is high rate of post harvest losses. This can be somewhat
reduced by properly packing the flower. Research in proper packing and post harvest practices
should encouraged. The number of flight from Aizawl should be increased and cancellation of
flights should be avoided as far as possible. Cold storage facilities should be established in the

356
airport so that the flowers can be stored in the airport itself in case of cancellation of flights
instead of transporting back to the office. The farmers should be encouraged to plant more
flowers under Hi-tech conditions by giving financial assistance and technical knowhow. The
Government should organize training and workshops for framers regarding good cultivation
practices, proper harvesting, handling and post harvest management practices.
Table 77: Suggestions of retailer for increasing marketing efficiency of anthurium
flower
Sl.No. Suggestions
1 Provision of adequate facilities in market
3 Quick and efficient means of transport
4 Establishment of cold storage facilities
5 Improvement in the market information delivery
system
6 Market credit should be made easily available
Adequate marketing facilities should be provided. The transportation facilities need to be
strengthened by constructing new roads and improving the condition of the existing ones and
increasing the number of transport vehicle with cold storage facility. Cold storage facilities
should be established so that the retailer can store their produce for a longer time in the market.
The Government should take initiative to improve the market information delivery system by
establishing market information office, distributing pamphlets, leaflets, drawing charts to the
farmers and market information should be broadcast in radio and local T.V. channels. Market
credit should be made easily and quickly made available.

357
Table78: Factors affecting Marketing Efficiency of Anthurium in Mizoram
Sl.No. Factors Coefficient Standard
error
‘t’
value
1 Constant 0.445*** 0.020 22.286
2 Marketing cost - - -
3 Marketing margin -0.363** 0.002 -2.379
4 Transport cost 0.030 0.001 0.295
5 Open Market price -3.706*** 0.003 -20.542
6 Labour wages - - -
7 Controlling middlemen - - -
8 Volume of produce handled 0.343* 0.001 1.978
9 Presence of cold storage
facilities
- - -
10 Length of market channel 3.328*** 0.043 18.749
11 Existence of competition in
selling
- - -
12 Nature of produce - - -
13 R-square 0.997
14 Adjusted R-square 0.996
15 No. of observation 30
(***) Significant at 1%
( ** ) Significant at 5%
( * ) Significant at 10%
The marketing efficiency of anthurium in Mizoram is significantly affected by open market price
and length of market channel at 1% significant level, by marketing margin at 5% level of
significant and by volume produce handled at 10% significant level. The marketing efficiency
will increase with the decrease in marketing margin and open market price; and with the increase
in volume of the produce handled and length of market channel. Transport cost had no
significant effect on the marketing efficiency of anthurium. About one third of the total cut
flowers produced in the state have been sold outside the state through Bangalore based exporter,

358
ZOPAR Export Ltd. and the remaining consumed in the state. The anthurium growers get good
return if they sell their produce through ZOPAR (wholesaler) instead of selling to the retailer in
the state as there is fluctuation of demand in the state. In Mizoram, the flowers are demanded
only on some occasions like for churches, functions, funerals, weddings, etc. Thus, marketing
efficiency of anthurium in Mizoram increases with the increase in the length of the marketing
channel.

359
4. CONCLUSION AND POLICY IMPLICATIONS
4.1 Conclusion
It was observed that the maximum quantity of tomato in the sample area was marketed through
retailer. As tomato is highly perishable, losses consumed highest share in the total marketing
cost. Most of the farmers in hilly region of Manipur market their cabbage through village traders
while those in the plain regions market their produce through wholesaler. The passion fruit
growers of Churachandpur district market their produce through the Passion Beekeeping
Development Association (A subsidiary of Passion Fruit Growers Association) of
Churachandpur district, Manipur. About one third of the total cut flowers of anthurium produced
in the Mizoram have been sold outside the state through Bangalore based exporter, ZOPAR
Export Ltd. and the remaining consumed in the state. Transportation cost consumed the highest
share in the marketing cost of these produces. The cost of transporting the produce from
inaccessible production belts to the nearest market outlets is high due to the nature of terrain and
the status of connectivity. Transportation of perishable products is perhaps the most serious
constraints in the horticultural development of NE region. Marketing cost and marketing margin
vary considerably from channel to channel and were related directly to the length of the channel,
i.e., longer the channel, more were the marketing cost and marketing margin. The price paid by
the consumer increased with the increase in the length of the marketing channel or with the
increased in the numbers of intermediaries involved between the producer and the ultimate
consumers. As the length of channel increases the price spread also increases and vice-versa. The
retail margin was more compared to the margin of the other middlemen. The marketing
efficiency was found to vary inversely with the length of the channel. The major constraints of
marketing horticultural crops include lack of market to absorb the production, low price for the
products, large number of middlemen in marketing system, lack of marketing institutions
safeguarding farmers’ interest and rights over their marketing (e.g. cooperatives), lack of
coordination among producers to increase their bargaining power, poor product handling and
packaging, imperfect pricing system, lack of transparency in market information system.

360
4.2 Policy Implications
1. Vegetable growers should be given intensive training related to post harvest handling of
the produce at government level. Such training should cover improved technologies
including grading, packaging, pre-cooling, storage and transportation.
2. Provisions for incentives and credit facilities for farmers should be made to encourage
them to undertake cultivation of horticultural crops in the region.
3. Subsidies on poly/ green house, planting materials and specialized equipments should be
provided.
4. Economically viable and technically feasible greenhouse technology suitable for the
agro-climatic and geographical conditions of the NE region is needed at the earliest.
Works should be channelized in finding suitable and locally available construction
material for low and medium cost greenhouse.
5. Formation of new cooperatives societies and strengthening of existing ones in the states
that will take care of both production and marketing through institutional approach to
backward and forward linkages is needed and recommended.
6. Formation of more Grower’s Association/ Societies or Organization for specific crops in
the region to facilitate market channel as well as proper technology transfer and effective
capacity building.
7. Promotion of market channel and export coupled with price stability and reducing the
risk through insurance.
8. Establishment of processing unit near the producing area to ensure higher return to the
producers.
9. The storage facilities need to be created near the production area for storage of the
produce during the glut season which will help to decrease intra-seasonal price variation
and to assure regular supply of the produce and reduction of wastage.
10. The government can give subsidy for building simple storage facilities so that they can
keep their vegetables for some time when price are still low in the market.
11. Cheap and adequate supply of packing material should be ensured.
12. The transportation facilities need to be strengthened for transporting the produce to the
consuming market so as to take benefit of higher prices in these markets.

361
13. The strengthening of market infrastructure, strict implementation of regulatory measures
and immediate pro-active measures of government during adverse conditions, are very
much essential in the present scenario to avoid distress sales by the actual growers during
good harvesting years and sustain the production levels of the horticultural commodities.
14. Improvement in the dissemination of market information through all possible mass
media communication aids for the benefit of the farming community.
15. Provision of needed training to the farmers as well as to the traders or product dealers on
grading and standardization of produce to fetch higher price in the rural market.
16. The encouragement of rural agri-business by establishment of commodity specific
markets in rural areas with proper grading, storage and finance facilities.
17. Regulation of commission agents or traders who are actually grabbing the market in
times of large arrivals.
18. Rapid dissemination of market prices prevailing in different markets and bringing
awareness on quality standards of the products to be maintained among the farming
community.
19. Research on post harvest management of the horticultural crops should be encouraged.
20. As indicated by the preceding results, the Farmers – retailers – consumers channel in
vegetables marketing gave the highest efficiency. A farmer’s market model may be
developed particularly for vegetables with basic infrastructure such as store house,
weighting, drinking water, electricity and night halt facilities. The system successfully
integrates many producers with consumers/retailers, eliminates middlemen, cuts
maximum marketing cost, provides good market infrastructure and environment. One
such leading example is Uzahavar Sandai in Tamilnadu, Apni Mandi in Punjab and
Rajasthan, Rythu Bazar in Andhra Pradesh and Raithara Santhegalu in Karnataka.
21. In case of fruits and flowers, public – private partnership resulted into higher marketing
efficiency as in anthurium in Mizoram and passion fruit in Manipur. Development of
such marketing system may strengthen the supply chain management. Therefore, public –
private partnership in the marketing of fruits and flowers as Zopar in Mizoram and
Passion Beekeeping Development Association in Manipur may a model for the NEH
region.

362
5) References
Acharya, S.S. and Agarwal, N.L. (1999) Agriculture Marketing in India, Oxford & IBH
publishing Co. Pvt. Ltd., New Delhi
Ashturker, B.M. and Deole, C.D. (1985) Producers’ Share in Consumers Rupee: A Case Study of
Fruit marketing in Marathwada, Indian Journal of Agricultural Economics, 40: 3
Chole, V.M., Talathi, J.M. and Naik, V.G. (2003) Price Spread in Marketing of Brinjal in
Maharashtra State, Agricultural Marketing, 45 (3):5-7
G. Sunil Kumar Babu, Sri Hari Naidu and Y. Eswara Prasad (2003) Price Spread and Marketing
of Green Chillies – A case Study in Andhra Pradesh, Agricultural Marketing, 45 (3):21-
23
Gadre, A.V., Talathi, J.M. and Wadkar, S.S. (2002) Price Spread in Marketing of White Onion in
Raigad District of Maharashtra State, Agricultural Marketing, 44 (4):22-25
Gangwari, L.S. and Singh, S. (1999) Marketing of Nagpur Mandarins: A case study of Nagpur
District of Maharashtra, Agricultural Marketing, 41 (1):18-20
Garg, J.S. and Misra, J.P. (1996). Costs and Margins in the Marketing of Vegetables in Kanpur,
Agricultural Marketing, 8:2
Gogoi, M. (1978) Marketing of Orange in Dibrugarh District – A Case Study (Unpublished
M.Sc. Thesis), Department of Agricultural Economics, AAU, Jorhat.
Goswami, S.M. (1991) Price Spread of Tomato in a Vegetable Market of Kamrup District
Assam, Agricultural Marketing, 33(4):13-16
Goswami, S.N. and Singh, S.B. (2000) Problems and Prospects of Marketing of Horticultural
Crops in North-East India, Agricultural Marketing, 42 (2):23-26
Goyal, S.K. (1999) Economics of Rose Cultivation and its marketing in Sonepat District of
Haryana State, Indian Journal of Agricultural Marketing, 13(3):44-51
Saikia, T.N. (1985) Price Structure of Pineapple: A Study in Meghalaya, Indian Journal of
Agricultural Economics, 40:3
363
Shapoo, J.A. and Banerjee, B.N. (2003) Economics of Apple Trade in Anantnag District of
Jammu and Kashmir, Agricultural Marketing, 45 (3):36-39
Singh, M. (1985) Price Spread of Vegetables Marketing, Indian Journal of Agricultural
Economics, 40:3
Singh, R. (1988) A Study of Marketing of Pineapple in Central District of Manipur (Unpublished
M.Sc. Thesis), Department of Agricultural Economics, AAU, Jorhat.
Subbanarasaiah, N. (1991) Marketing of Horticultural Crops in India, Anmol Publishing Co.,
Delhi.
ZOPAR Export Pvt. Ltd. (www.zopar.in)

364
Estimating Marketing Efficiency of Horticultural Commodities under
Different Supply Chains in Rajasthan
Khem Chand
CAZRI, RRS, Pali-Marwar (Rajasthan)
1. Introduction
1.1 Background
Rajasthan state has vast potential for horticultural development as the diverse agro-climatic
conditions are very much favoring growing of large number of horticultural crops like fruits,
vegetables, spices, flowers and medicinal & aromatic plants throughout the year. During 1989
separate department of horticulture came into existence with ultimate objective of harnessing the
potential of horticulture in the State in a systematic and planned manner so as to increase area,
production and productivity of different horticultural crops and thereby to improve nutritional as
well as economic status of people of State. As a result during 2007-08, about 7.51 lakhs ha area
is reported to be under horticultural crops against gross cropped area of 221 lakhs ha. This
includes 0.29 lakh ha under fruit crops, 1.43 lakhs ha under vegetable crops, 5.7 lakhs ha under
spices crops, 0.033 lakh ha under flowers and 1.98 lakhs ha area under medicinal & aromatic
crops which comes to about 4.28% of gross cropped area. As far as production of these crops is
concerned, it is 5.6 lakhs MT fruits, 8.5, 5.29, 0.6 & 0.94 lakhs MT vegetables, spices, flowers
and medicinal & aromatic crops respectively.
Marketing of fruits and vegetables in Rajasthan has different features than food grains marketing.
While fruits crops are mostly sold through contract system where farmer gives advance contract
before actual harvesting of crop, vegetables are sold either in regulated market or special
procurement stalls established by traders during peak production season. The main reason behind
giving advance contract for fruits is that farmers want to minimize risk in production as well as
price. Another major factor is that local market is not able to consume large quantity of
production, hence it needs disposal at the earliest to other major cities in the country that needs
advance planning and investment. In case of vegetables produce is received at different intervals

365
and traders procure produce from regulated markets where there is fluctuation in prices on daily
basis. Present study investigated in detail different marketing channels and highlighted the
marketing efficiency of different supply chain systems for four fruit and vegetable crops viz.
Kinnow, Aonla, Carrot and Tomato.
1.2 Policy research questions
1. What is the marketing cost and marketing margins under various supply chains?
2. What is the price spread and marketing efficiency under various supply chains?
3. Which are the constraints perceived by various stakeholders?
4. What are the strategies to enhance the marketing efficiency?
1.3 Objectives of the study
1. To estimate the marketing cost and marketing margin of different functionaries for
selected horticultural commodities under various supply chains
2. To analyze the price spread, marketing efficiency and farmer’s share in consumer rupee
in various supply chains
3. To identify the constraints perceived by various stakeholders; and study the factors
influencing the marketing cost, market margin and marketing efficiency
4. To suggest suitable strategies to enhance the marketing efficiency for horticultural
commodities

366
2. Data and Methodology
2.1 Study area:
Present study was conducted in Jaipur and Sriganganagar districts of Rajasthan. Sriganganagar
district was selected for study of kinnow and carrot crop while aonla and tomato crop, Jaipur
district was selected. These districts were selected based on significant area under selected fruits
and vegetables crop.
2.2 Data on items:
Data related to production, consumption and marketed surplus of various crops was collected.
Beside this marketing channels through which different produces were sold were also identified.
The share of different channels in sale of farmers’ produce was identified. Information was also
collected on price on which produce was sold, expenses incurred by different agencies on
marketing of produce till it reaches to consumer for final consumption. The price paid by
consumer and share of market intermediaries in marketing cost and marketing margin under
different marketing channels was also noted.
2.3 Sample size:
Sample size was kept uniform for all fruits and vegetable crops. For each crop 120 farmers were
selected. Beside this information was also collected from 30 wholesalers/ traders/ contractors and
30 retailers for each fruit and vegetables crop studied.
2.4 Sampling method:
Multistage stratified random sampling technique was adopted for selection of tehsils, villages
and farmers. Sriganganagar and Jaipur districts were selected for present study. Two tehsils
Sriganganagar and Karanpur were selected for collecting detailed data from kinnow growers in
Sriganganagar district. For carrot crop Sriganganagar tehsil in that district was selected. For
collecting detailed information on aonla and tomato crop, Chomu tehsil in Jaipur district was
selected as it has largest area as well as well established market for aonla and tomato sale.

367
2.5 Statistical techniques:
The techniques adopted for analyzing data to meet the objectives of the study are as follows
Tabular : Market margin, market cost, price spread, marketing efficiency
Graphical : Pie charts for market costs, price spread
Flow chart for market channels
Functional
Liner Regression Analysis: Factors affecting marketing efficiency
Garrett’s Ranking Technique : Constraints of the farmers and other market
intermediaries
Delphi technique: Experts opinion on performance of markets

368
3. Results and Discussion
3.1 Status of the fruits and vegetables production
Both aonla and kinnow are important fruit crops grown in Rajasthan. Sriganganagar district with
86 percent and Jaipur with 15 percent area under kinnow and aonla, respectively are the leading
districts of the state for production of these crops (table 1). In carrot Sriganganagar with 17
percent area and Jaipur with 38 percent of state’s area under tomato crop were the leading
districts producing these crops. Regarding production of vegetables, Sriganganagar district
contributes 49 percent and Jaipur 38 percent in states carrot and tomato production, respectively
(table 2)
Table 1: Status of fruit and vegetable area (2007-08)
Name of
district
Name of fruit/
vegetable
Area under
district (ha)
Area under
state (ha)
% of
state’s
area
Sriganganagar Kinnow 3648.0 4264.0 85.55
Carrot 177.0 1053.0 16.81
Jaipur Aonla 258.4 1730.0 14.94
Tomato 6306.0 16588.0 38.02
Source: Department of Horticulture, Government of Rajasthan

369
Table 2: Status of vegetable production (2007-08)
Name of
district
Name of
vegetable
District’s
Production
(M.T.)
State’s
Production
(M.T.)
% of State’s
Production
Sriganganagar Carrot 5310.0 10763.0 49.34
Jaipur Tomato 21208.0 55508.0 38.21
Source: Department of Horticulture, Government of Rajasthan
3.1 Kinnow
Marketing channels in Kinnow
There were three important marketing channels (table 3) through which kinnow produce were
sold by farmers in Sriganganagar district. The marketing channel- I was most famous as about
71 percent produce was sold through it (table 7). In channel-II farmers directly brought
produce in the mandi and sold it through commission agents either in local or distant markets
in same or other states. In channel III producers sell the produce after grading and processing.
The produce is either processed by farmers himself at his processing plant or on payment
basis at grading plants situated around Ganganagar city. About 50 percent kinnow produce is
processed (graded and waxed) and then sent to distant markets with distance more than 1000
kms from production belt in the cities like Mumbai, Pune, Hyderabad, Banglore, Chennai,
Coimbatore etc. Few farmers have their own grading/ waxing plant at Ganganagar district
while out of total produce procured by contractors; about 50% share is of processors cum
contractors.

370
Table 3: Marketing Channels in sale of Kinnow (2008-9)
Particulars Supply Chain
Channel 1 Producer – Contractor- Commission Agent/ Wholesaler – Retailer –
Consumer
Producer – Contractor cum Processor- Commission Agent/ Wholesaler –
Retailer – Consumer
Channel 2 Producer – Commission Agent/ Wholesaler -Retailer – Consumer
Channel 3 Producer cum Processor- Commission Agent- Wholesaler – Retailer –
Consumer
Table 4: Quantity handled in different marketing channels of kinnow (2008-9)
S.N. Marketing channel Quantity handled
(Q)
Percent
share
1 Channel 1 (Contractor) 22054 71.10
2 Channel 2 (CA/ Wholesaler) 4164 13.43
3 Channel 3 (Producer cum processor) 4798 15.47
Total 31016 100.00
Marketing cost in kinnow
It depends on variety of factors like number of intermediaries in the marketing chain, extent of
processing, quality of packaging material used, and distance of market place from production
region etc. The detail marketing cost for both channels has been shown in tables 5a, 5b, 6a
and 6b. The produce to distant markets (More than 1000 kms away) are transported after
grading and waxing only while in short and medium distance it is transported without waxing.
It affects marketing cost as for short distance generally waxing is not done and it saves the
marketing cost. Kinnow is packed in 10 kg cardboard boxes for transportation. Sometime
depending upon requirement of buyers it is packed in wooden boxes also as kinnow meant for
export in Bangladesh is transported in wooden boxes. The low grade kinnow is loaded loose

371
in truck or packed in jute bags weighing about 25 kg each. Again every market has its demand
for specific size of kinnow, buyers want specific numbers of fruits in 10 kg box as in many
cities of South India this fruit is sold on number basis without taking actual weight. Total
marketing cost of about Rs 807 was observed in channel-I when sold to distant markets in
south e.g. Bangalore city. The cost was shared by contractors (65.30%), commission agents
(3.72 %) and retailers (30.98%). The maximum cost of marketing was shared by contractors
as he arranges labour for fruits harvesting, packing and pays the cost of packing material and
transportation cost. Total marketing cost had 29.49 and 15.67 percent share (table 9 a, 9b) in
consumer price in channel I and II, respectively.

372
Table 5 a: Marketing cost and Marketing Margin in Kinnow (Rs/q)
(Channel 1)
Item Cost % Consumer
Price
Farm gate price at village 605.77 22.14
+sorting
+packing
+transport
+others
Total marketing cost 0.00 0.00
Net price realized by farmer 881.93 32.23
Farmer’s Selling Price to Local Assembly Trader/
Contractor
881.93 32.23
+sorting
+packing
+storage
+transport
+commission
Total marketing cost 526.96 19.26
Marketing margin 232.11 8.48

373
Assembly traders/ Contractor price to wholesaler 1641.00 59.98
+sorting
+packing
+storage
+transport
Market fee
Total marketing cost 30.00 1.10
Marketing margin 145.00 5.30
CA/ Wholesalers price to retailers 1816.00 66.37
+transport
+packing
Total marketing cost 250.00 9.14
Marketing margin 670.00 24.49
Retailers price to consumer 2736.00 100.00

374
Table 5 b: Marketing cost and Marketing Margin in Kinnow (Rs/q)
(Channel-II)
Item Cost % Consumer Price
Farm gate price at village (Cost of production) 605.77 34.07
+sorting 0.00
+packing 0.00
+transport 0.00
+others 0.00
Total marketing cost 150.00 8.44
Net price realised by farmer 916.00 51.53
Farmer’s Selling Price to Wholesaler 1066.00 59.96
+sorting 0.00
+packing 0.00
+storage 0.00
+transport 0.00
+commission 63.96 3.60
Market fee 17.06 0.96
Total marketing cost 81.02 4.56
Marketing margin 125.00 7.03

375
Wholesalers price to retailers 1272.02 71.55
+transport 17.00 0.96
+packing 30.50 1.72
Total marketing cost 47.50 2.67
Marketing margin 458.24 25.78
Retailers price to consumer 1777.76 100.00

376
Table 6 a: Marketing cost and Marketing Margin of Kinnow (Rs/q)
(Channel 1)
Item Amount in Rs % Consumer Price
Farm gate price 881.93 32.23
Marketing cost
Producer 0 0.00
Contractor 526.96 19.26
Commission Agent/Wholesaler 30 1.10
Retailers 250 9.14
Total marketing cost 806.96 29.49
Marketing margin
Contractor 232.11 8.48
Commission Agent/Wholesaler 145 5.30
Retailer 670 24.49
Total marketing margin 1047.11 38.27
Consumer price 2736 100.00
Note: Ave commission 9.67 percent of sale price at CA shop

377
Table 6b: Marketing cost and Marketing Margin of Kinnow (Rs/q)
(Channel II)
Item Cost % Consumer Price
Farm gate price 916.00 51.53
Marketing cost
Producer 150.00 8.44
Contractor 0.00 0.00
Commission Agent/Wholesaler 81.02 4.56
Retailers 47.50 2.67
Total marketing cost 278.52 15.67
Marketing margin
Contractor 0.00 0.00
Commission Agent/Wholesaler 125.00 7.03
Retailer 458.24 25.78
Total marketing margin 583.24 32.81
Consumer price 1777.76 100.00

378
Price spread in kinnow
Price spread for both channels is shown in table 7 a, and 7 b. The price received for a quintal
of kinnow by farmer was about eight hundred and eighty two rupees (Channel I). The
consumer paid rupees 2,736/- only for equivalent quantity of produce. Farmers share in
consumer rupee was found 32.23 percent. The margins earned by contractors, wholesalers and
retailers were 8.48 percent, 5.30 percent and 24.49 percent, respectively (table 10a, 10b). The
margins of retailers were highest as he sells the produce in small quantities. Contractors had
advance contracts with farmers and price was predetermined before actual harvesting of crop.
At the time of harvesting of crop usually total amount of produce value is given to farmers but
in some cases a fraction of payment is made and rest amount is paid after receiving money
from wholesalers by contractors in distant markets. In recent years farmers do not believe
much to contractors and in majority of the cases they try to get whole money at the time of
loading of produce in the trucks. Though, farmers’ share in consumer rupee was more in
channel II (table 11a, 11b) as produce is directly brought by farmers in regulated market for
sale, but this channel had smaller market share compared to channel I. The channel II was
mostly preferred by small orchard owners who could not arrange advance contract for their
orchard or for sale of second grade fruit which left after grading and cannot be sent to distant
markets.

379
Table 7 a: Price spread in Kinnow
(Channel I)
Particulars Amount (Rs) Percent
Price received by the farmer 881.93 32.23
Contractor’s purchase price 881.93 32.23
Cost incurred 526.96 19.26
Margin 232.11 8.48
CA/ Wholesaler’s purchase price 1641 59.98
Cost incurred 30 1.10
Margin 145 5.30
Retailer’s purchase price 1816 66.37
Cost incurred 250 9.14
Margin 670 24.49
Price paid by the consumer 2736 100.00

380
Table 7 b: Price spread in Kinnow
(Channel II)
Particulars Amount (Rs) Percent
Price received by the farmer 916.00 51.53
Contractor’s purchase price 0 0.00
Cost incurred 0 0.00
Margin 0 0.00
CA/ Wholesaler’s purchase price 1066.00 59.96
Cost incurred 81.02 4.56
Margin 125.00 7.03
Retailer’s purchase price 1272.02 71.55
Cost incurred 47.50 2.67
Margin 458.24 25.78
Price paid by the consumer 1777.76 100.00

381
Table 8 a: Share of different agencies during marketing of kinnow
Channel I
S. No. Agency Function Share in final
price (%)
I Farmer Production 32.23
II Contractor Assembling,
Processing,
Transporting
8.48
III Commission
agent/
Wholesalers
Market/making
/Breaking bulk
5.30
IV Retailers Retailing 24.49
V Marketing cost 29.49
Consumer price 2736.00
(100.00)

382
Table 8 b: Share of different agencies during marketing of kinnow
Channel II
S. No. Agency Function Share in final
price (%)
I Farmer Production 51.53
II Contractor Assembling,
Processing,
Transporting
0.00
III Commission
agent/
Wholesalers
Market/making
/Breaking bulk
7.03
IV Retailers Retailing 25.78
V Marketing cost 15.67
Consumer price 1777.76

383
Marketing efficiency
The marketing efficiency of kinnow was calculated using different formulas. Acharya’s
modified measure of marketing efficiency was 0.48 and 1.06 in channel I and II, respectively
(table 9). It was higher in channel II as price received by farmers was higher and both
marketing cost and marketing margin were lower than channel I. Though marketing efficiency
in channel II was higher but its market share in total quantum of kinnow sold was lower as
Sriganganagar regulated fruit and vegetable market was not well developed for marketing of
large quantity of this fruit. Hence, contractors played major role and procured the produce
directly from farmers’ orchard and transported to bigger markets in different parts of the
country.
Table 9: Measurement of Marketing Efficiency of Kinnow
S.
No.
Particulars Unit Channel I Channel II
1 Retailer’s sale price (RP) Rs/q 2736.00 1777.76
2 Total marketing costs (MC) Rs/q 806.96 278.52
3 Total margins of intermediaries (MM) Rs/q 1047.11 583.24
4 Price received by farmer (FP) Rs/q 881.93 916.00
5 Value added by the marketing system (1-4) Rs/q 1854.07 861.76
Conventional method (E) (5 / 2) Ratio 2.30 3.09
Shepherd’s method (ME) (1 / 2) Ratio 3.39 6.38
Acharya’s method (MME) [4 / (2+3)] Ratio 0.48 1.06

384
Constraints in kinnow production and marketing
Kinnow is a semi perishable fruit crop and it can maximum remain unspoiled in the field for
seven days after harvesting. Farmers are generally not sure about its prices, hence to check price
risk, they prefer advance contract to traders/ contractor where price of fruit crop is
predetermined. All the constraints perceived by the farmers were analyzed and ranked following
Garret ranking technique and shown in table 10. The most common and important constraint is
about its price; here contractors generally make a cartel and offer lower prices to farmers. As
farmer wants to be assured about price of his product, he is forced to give advance contract at
lower prices even if he is not satisfied with it. Though Ganganagar district produces large
quantity of this produce but there is not a single large fruit processing industry where its juice
can be prepared. The absence of fruit juice industry causes damage to crop if it is not disposed
timely and causes losses to farmers or other intermediaries. The low grade fruit can easily be
consumed for preparation of fruit juice which can be kept for more time compared to fruit in its
original form. Further local mandi yard is also not well developed for sale of large quantity of
produce during main season.

385
Table 10: Constraints perceived by farmers in Kinnow production and marketing
Sr.
No.
Constraint Score Garret
Ranking
1. Contractor make a pool and offer lower price 96.96 1
2. Farmer is not sure about price he will get 91.96 2
3. Fruit is perishable and farmer can’t wait for long time for sale 88.97 3
4. No processing industry in production area 87.06 4
5. Local mandi yard is not developed for sale of kinoo 84.98 5
6. Contractor sometime do not respect pre-harvest contract 83.14 6
7. Delay in payment by traders 82.04 7
8. Contractor do not clear the field by 15 Jan and delay up to Feb
end
80.06 8
9. Contractors take less interest in small orchards 78.98 9
10. No electric connection for drip irrigation 77.93 10
11. Quality planting material is not available 76.91 11
12. Heavy commission charged in other states 75.98 12
13. High cost of labour due to NAREGA 75.02 13
14. Problem of duplicate pesticides 74.04 14
15. Damage by blue bull 73.18 15

386
Factors affecting Marketing Efficiency of Kinnow
The findings of multiple linear regression model is presented in table 11 that shows negative and
significant relationship between marketing efficiency and marketing cost and marketing margin.
The volume of produce had positive and significant relationship which shows that larger orchard
owner with higher quantum of produce could better bargain for prices while small orchard owner
face difficulty in giving advance contract and they are comparatively offered lower prices. The
increasing numbers of market intermediaries raises the marketing margin, hence it affected
negatively to marketing efficiency. Though open market prices had positive relationship with
efficiency but it was not found significant, it may be due to the fact that maximum farmers give
advance contract and fluctuations in price at the time of actual sale do not affect much to the
farmers.
Table 11: Factors affecting Marketing Efficiency of Kinnow
S. No. Factors Coefficient ‘t’ value
1 Constant 0.52723*** 3.8478
2 Marketing cost (x1) -0.00030*** -6.4906
3 Marketing margin (x2) -0.00008*** -3.6848
4 Open market prices (x3) 0.00005NS
0.8186
5 Volume of the produce handled (x4) 0.00062*** 3.07746
6 Length of the market channel (No.
of market intermediaries) (x5) -0.00762** -2.2960
7 R2 0.7765
8 Adjusted R 2 0.7666
9 No. of observation (N) 120
Note : ***, **, * indicate significance at 1 %, 5 % and 10% level, respectively.

387
3.3 Aonla
Marketing channels in Aonla
There were three important marketing channels (table 12) through which aonla produce were
sold by farmers in Jaipur district. The marketing channel-I was most famous as about 87
percent produce was sold through it (table 13). In channel-II farmers directly brought produce
in the mandi and sold it through commission agents. Produce procured in channel I is sold
mainly in Delhi market from where it is distributed all over India. In channel II commission
agents buy produce on behalf of traders in Rajasthan, Haryana and Punjab and this produce is
sold through commission agents to retailers in respective mandis. Retailers from Jaipur city
also procure aonla in Chomu mandi through channel II. In channel I, traders take advance
contract and harvest crop employing their own labour. Produce collected from different
orchards is loaded in the truck and sent to Delhi market for further sale. There are two grades
of aonla. Ist grade is sold for preparation of murabba while II nd garde is purchased for
preparing chawanpras etc by Dabur India and Baba Ramdev at Hariwar. Small scale producer
bring their produce for sale in chomu mandi as contractor do not take contract of small
orchards. Contractors also bring II nd grade produce at Chomu mandi as there are few traders
at mandi who buy this produce for further sale to processing industry. The produce sold in
channel I and II is about 87 and 2 percent of produce while 11 percent is sold through channel
III (table 16).
Table 12: Marketing Channels in sale of Aonla (2008-9)
Particulars Supply Chain
Channel I Producer – Contractor/ Trader – Commission agent -Retailer – Consumer
Channel II Producer –Commission agent- Retailer- Consumer
Channel III Producer – Contractor -Commission agent- Trader- Consumer
(Processing Industry) (II grade Aonla)

388
Table 13: Quantity handled in different marketing channels of Aonla (2008-9)
S.N. Marketing channel Quantity handled (Q) Percent share
1 Channel I 107136 87.00
2 Channel II 2498 2.00
3 Channel III 13392 11.00
Total 123026 100.00
Marketing cost in Aonla
It depends on place of final disposal of produce and kind of packaging material used during
transportation of produce. During survey it was found that grade I aonla was sent to distant
markets in card board boxes while grade II aonla was filled in 50 kg capacity jute bags and
transported to mainly processing industries situated around Delhi and U. P. state. The
produce to Delhi market was mainly sent in card board boxes which cost higher than jute
bags. The marketing cost in channel II was lower than channel I (table 15a, 15b), as produce
was directly brought by farmers in the mandi and sold through retailers to consumers after
paying taxes of market and fee of commission agents.

389
Table 14 a: Marketing cost and Marketing Margin in Aonla (Rs/q)
(Channel I)
Item Cost % Consumer
Price
Farm gate price at village 149.99 9.37
sorting
packing
transport
others
Total marketing cost
Net price realized by farmer 442.47 27.65
Farmer’s Selling Price to Local Assembly Trader/
Contractor
442.47 27.65
sorting 24.44 1.53
packing 56.11 3.51
transport 46.19 2.89
commission & tax 60.00 3.75
Miscellaneous 5.42 0.34
Total marketing cost 192.16 12.01
Marketing margin 365.37 22.84

390
Traders’ price to retailers 1000.00 62.50
transport 25.00 1.56
packing 30.00 1.88
Total marketing cost 55.00 3.44
Marketing margin 545.00 34.06
Retailers price to consumer 1600.00 100.00

391
Table 14 b: Marketing cost and Marketing Margin in Aonla (Rs/q)
(Channel-II)
Item Cost % Consumer Price
Farm gate price at village (Cost of production) 149.99 9.78
sorting 25.00 1.63
packing 7.00 0.46
transport 17.60 1.15
others 2.8 0.18
Total marketing cost 52.40 3.42
Net price realised by farmer 913.98 59.58
Farmer’s Selling Price to Retailers 966.38 63.00
transport 20.00 1.30
packing 25.00 1.63
Commission & tax 73.44 4.79
Total marketing cost 118.44 7.72
Marketing margin 449.18 29.28
Retailers price to consumer 1534.00 100.00

392
Table 15 a: Marketing cost and Marketing Margin of Aonla (Rs/q)
(Channel I)
Item Amount in Rs % Consumer Price
Farm gate price 442.47 27.65
Marketing cost
Producer 0.00 0.00
Contractor 192.16 12.01
Commission Agent/Wholesaler 0 0.00
Retailers 55 3.44
Total marketing cost 247.16 15.45
Marketing margin
Contractor 365.37 22.84
Commission Agent/Wholesaler 0.00 0.00
Retailer 545.00 34.06
Total marketing margin 910.37 56.90
Consumer price 1600.00 100.00
Note: Ave commission 9.67 percent of sale price at CA shop

393
Table 15 b: Marketing cost and Marketing Margin of Aonla (Rs/q)
(Channel II)
Item Cost % Consumer Price
Farm gate price 913.98 59.58
Marketing cost
Producer 52.40 3.42
Trader 0.00 0.00
Commission Agent/Wholesaler 0.00 0.00
Retailers 118.44 7.72
Total marketing cost 170.84 11.14
Marketing margin
Trader 0.00 0.00
Commission Agent/Wholesaler 0.00 0.00
Retailer 449.18 29.28
Total marketing margin 449.18 29.28
Consumer price 1534.00 100.00

394
Price spread in aonla
Price spread for both channels is shown in tables 16 a, 16 b and 17. The price received for a
quintal of aonla was more than double in channel II compared to channel I. It was due to the
fact farmers in channel I gave advance contract for their produce, but prices increased at the
time of actual sale. As the farmers in channel II directly brought their produce for sale they
took advantage of hike in prices and fetched better prices than channel I. The consumer paid
almost same amount to retailers in both the channels. Farmers share in consumer rupee was
found higher in channel II. The margins of retailers were highest in both channels as he sells
the produce in small quantities. Contractors had advance contracts with farmers and price was
predetermined before actual harvesting of aonla crop. At the time of harvesting of crop
usually total amount of produce value is given to farmers but in some cases a fraction of
payment is made and rest amount is paid after receiving money from wholesalers by
contractors in distant markets. It is a kind of unwritten agreement and mutual faith between
farmers and contractors. In recent years about 50 percent farmers do not believe much to
contractors and try to get whole money at the time of loading of produce in the trucks. The
channel II despite of having higher share of farmers in consumer rupee had smaller market
share compared to channel I, as to check price uncertainty farmers preferred advance contract.
The channel II was mostly preferred by small orchard owners who could not arrange advance
contract for their orchard or for sale of second grade aonla fruit which left after grading and
cannot be sold to distant markets.

395
Table 16 a: Price spread in Aonla
(Channel I)
Particulars Amount (Rs) Percent
Price received by the farmer 442.47 27.65
Contractor’s purchase price 442.47 27.65
Cost incurred 192.16 12.01
Margin 365.37 22.84
CA/ Wholesaler’s purchase price 0 0.00
Cost incurred 0 0.00
Margin 0.00 0.00
Retailer’s purchase price 1000.00 62.50
Cost incurred 55.00 3.44
Margin 545 34.06
Price paid by the consumer 1600.00 100.00
Table 16 b: Price spread in Aonla
(Channel II)
Particulars Amount (Rs) Percent
Price received by the farmer 913.98 59.58
Cost incurred 52.40 3.42
Contractor’s purchase price 0 0
Margin 0 0.00
CA/ Wholesaler’s purchase price 0 0.00
Cost incurred 0 0.00
Margin 0 0.00
Retailer’s purchase price 966.38 63.00
Cost incurred 118.44 7.72

396
Margin 449.18 29.28
Price paid by the consumer 1534.00 100.00
Table 17: Share of different agencies in marketing of Aonla
S. No. Agency Function Share in final
price (%)
Channel I Channel II
I Farmer Production 27.65 59.58
II Contractor Assembling,
Processing,
Transporting
22.84 0.00
III Commission
agent/
Wholesalers
Market/making
/Breaking bulk
0.00
IV Retailers Retailing 34.06 29.28
V Marketing cost 15.45 11.14
Consumer price 1600.00
(100.00)
1534.00
(100.00)

397
Marketing efficiency
The marketing efficiency of aonla was calculated using different methods. Acharya’s
modified measure of marketing efficiency was 0.38 and 1.47 in channel I and II, respectively
(table 18). It was higher in channel II as price received by farmers was higher and both
marketing cost and marketing margin were lower than channel I. Though marketing efficiency
in channel II was higher but its market share in total quantum of aonla sold was lower as
Chomu regulated fruit and vegetable market was not well developed for marketing of large
quantity of this fruit. Hence, contractors played major role and procured the produce directly
from farmers orchard and transported to mainly Delhi market from where produce was
distributed to different locations in India.
Table 18: Measurement of Marketing Efficiency of Aonla
S.
No.
Particulars Unit Channel
I
Channel
II
1 Retailer’s sale price (RP) Rs/q 1600.00 1534.00
2 Total marketing costs (MC) Rs/q 247.16 170.84
3 Total margins of intermediaries (MM) Rs/q 910.37 449.18
4 Price received by farmer (FP) Rs/q 442.47 913.98
5 Value added by the marketing system (1-4) Rs/q 1157.53 620.02
Conventional method (E) (5 / 2) Ratio 4.68 3.63
Shephered’s method (ME) (1 / 2) Ratio 6.47 8.98
Acharya’s method (MME) [4 / (2+3)] Ratio 0.38 1.47

398
Constraints in aonla production and marketing
Aonla like kinnow is a semi perishable fruit crop and it can maximum remain unspoiled in the
field for seven days after harvesting. Farmers are generally not sure about its prices, hence to
check price risk, they prefer advance contract to traders/ contractor where price of fruit crop is
predetermined. All the constraints perceived by the farmers were analyzed and ranked following
Garret ranking technique and shown in table 19. The most common and important constraint is
about its price; here contractors generally make a cartel and offer lower prices to farmers. As
farmer wants to be assured about price of his product, he is forced to give advance contract at
lower prices even if he is not satisfied with it. Though Jaipur district produces large quantity of
this produce but there is not a single large fruit processing industry which can take care
processing of aonla produced in this region. Hence traders are mostly depending on aonla
processing industries in Delhi and U P state and prices are determined based on demand from
these big industries. Further local mandi yard is also not well developed for handling of large
quantity of produce during main season and farmers are not sure about timely disposal of their
produce. The procedure of open auction in Chomu fruit and vegetable market was occasionally
followed and there is virtually no competition among buyers, prices are fixed by few traders on
daily basis and whole produce on that particular day is bought at that price.
Table 19: Constraints perceived by farmers in Aonla production and marketing
Sr. No. Constraint Score Garret Ranking
1. Contractor make a cartel and offer
lower price
37.65 1
2. Farmer is not sure about price he will
get
34.95 2
3. No major processing industry in
production area
36.30 3
4. Contractors take less interest in small
orchards
29.50 4

399
5. Contractor sometime do not respect
pre-harvest contract
28.65 5
6. Avoidance of open auction method for
purchase by traders
28.20 6
7. Encroachment on farmers platform by
traders & renting out
28.05 7
Factors affecting marketing efficiency of aonla
The findings of multiple linear regression model is presented in table 23 that shows negative and
significant relationship between marketing efficiency and marketing cost and marketing margin.
The volume of produce had positive and significant relationship which shows that large orchard
owner with higher quantum of produce could better bargain for prices while small orchard owner
face difficulty in giving advance contract and they are comparatively offered lower prices. The
increasing numbers of market intermediaries raises the marketing margin, hence it affected
negatively to marketing efficiency. Open market prices had positive relationship with efficiency
showing benefit to farmers during rising prices in the market. It may be due to better deal to the
farmers who give orchard on contract basis and rise in daily prices in Chomu mandi.

400
Table 20: Factors affecting Marketing Efficiency of Aonla
S. No. Factors Coefficient ‘t’ value
1 Constant 0.76058*** 23.92882
2 Marketing cost (x1) -0.00038* -1.565
3 Marketing margin (x2) -0.00048*** -8.65358
4 Open market prices (x3) 0.00008*** 5.802124
5 Volume of the produce handled (x4) 0.00003*** 2.633177
6 Length of the market channel (No.
of market intermediaries) (x5) -0.00293NS
-0.99767
7 R2 0.7598
8 Adjusted R 2 0.7493
9 No. of observation (N) 120
Note: ***, **, * indicate significance at 1 %, 5 % and 10% level, respectively

401
3.4 Carrot
Marketing channels in Carrot
There were two important marketing channels (table 21) through which carrot produce were
sold by farmers in Ganganagar district. The marketing channel-I was most famous as about 85
percent produce was sold through it (table 22). Traders from adjoining states like Punjab,
Haryana and other parts of Rajasthan were participating in the auction which takes place on
the bank of Gang canal. Farmers had the facility of canal water for washing and cleaning of
produce by machines at this place. Though there was not a single government official present
during auction but it was very fair system as observed during survey. One member of farmers’
community acts as secretary and facilitates the auction work for all the farmers. The auction
usually takes place during evening time as produce is prepared for sale and filled in jute bags
weighing 50 kg each during day time. After completion of auction work, produce is loaded in
trucks and taken to different markets in Punjab, Haryana and Rajasthan. This produce is sold
in respective markets to retailers. The quality of carrot produced in Ganganagar district is very
good and liked by buyers in other states. Farmers were happy with this system as they were
able to dispose their produce same day during evening time and were receiving payments
within a week from the traders. The only problem they faced was from irrigation department,
which wants to vacate that place of sale and does not allow washing/cleaning of carrot with
canal water. In channel II retailers from Ganganagar or adjoining towns buy produce through
commission agents at regulated market. This produce is sold in the district itself to consumers.
The channel II gets only 15 percent share in the total carrot produce sold by farmers.
Table 21: Marketing Channels in sale of Carrot (2008-9)
Particulars Supply Chain
Channel I Producer –Trader/ Wholesaler- Commission agent – Retailer – Consumer
Channel II Producer – Commission Agent- Retailer – Consumer

402
Table 22: Quantity handled in different marketing channels of Carrot (2008-9)
S.N. Marketing channel Quantity
handled (Q)
Percent share
1 Channel I 36484.25 85.17
2 Channel II 6354.50 14.83
Total 42838.75 100.00
Marketing cost in Carrot
It depends on kind of produce, distance of market from farmer’s field and kind of packaging
material used during transportation of produce. The share of marketing cost in consumer price
for farmer, local trader, wholesaler and retailer was 10.23%, 4.17%, 4.67% and 4.77% in
channel I (table 23). The absolute value of marketing cost for farmers was almost same in
both channels (table 23 & 24). Farmers spent money for sorting of carrot i.e. segregating
small size carrot from bigger one for getting higher price during auction. He also spent money
on transportation of produce to market place, purchase of packing material i.e. jute bags,
washing and cleaning of produce through machines etc. Other market functionaries spent
money on transportation of produce to different markets, paying of taxes and commission in
the markets etc. The total marketing cost was lower in channel II compared to I because
produce was not taken to distant places and number of intermediaries were also fewer (table
24 a, 24b).

403
Table 23 a: Marketing cost and Marketing Margin in Carrot (Rs/q)
(Channel I)
Item Cost % Consumer
Price
Farm gate price at village (Cost of production) 123.04 15.23
sorting 18.19 2.25
packing 21.86 2.71
transport 23.12 2.86
others 19.51 2.41
Total marketing cost 82.68 10.23
Net price realized by farmer 202.63 25.08
Farmer’s Selling Price to Local Assembly Trader/
Contractor
285.31 35.31
Total marketing cost 33.70 4.17
Marketing margin 100.00 12.38
Assembly traders’ price to wholesalers 419.01 51.86
Market fee 16.76 2.07
Commission 20.95 2.59
Total marketing cost 37.71 4.67

404
Marketing margin 60.00 7.43
Wholesalers price to retailers 516.72 63.95
Total marketing cost 38.57 4.77
Marketing margin 252.71 31.28
Retailers price to consumer 808.00 100.00
Table 23 b: Marketing cost and Marketing Margin in Carrot (Rs/q)
(Channel II)
Item Cost % Consumer Price
Farm gate price at village (Cost of production) 123.04 18.93
sorting 18.19 2.80
packing 21.86 3.36
transport 23.12 3.56
others 20.26 3.12
Total marketing cost 83.43 12.84
Net price realized by farmer 214.77 33.04
Farmer’s Selling Price to Wholesaler at GNR
regulated market
298.20 45.88
Market fee 4.77 0.73
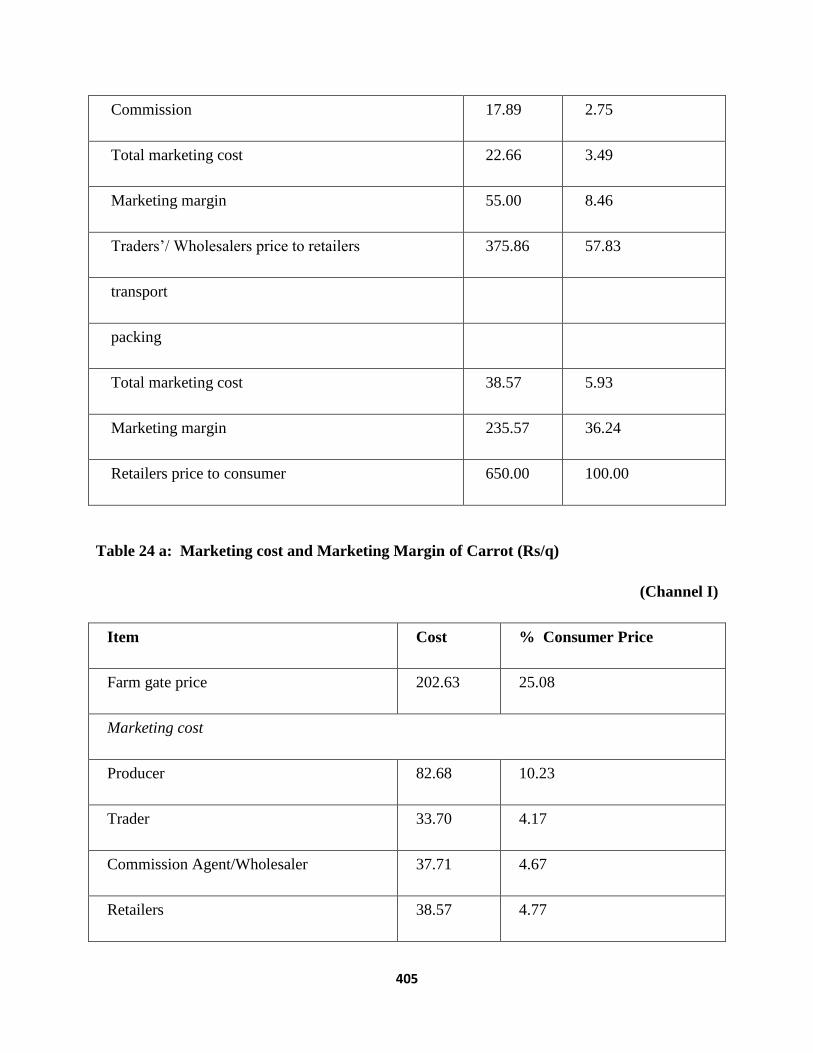
405
Commission 17.89 2.75
Total marketing cost 22.66 3.49
Marketing margin 55.00 8.46
Traders’/ Wholesalers price to retailers 375.86 57.83
transport
packing
Total marketing cost 38.57 5.93
Marketing margin 235.57 36.24
Retailers price to consumer 650.00 100.00
Table 24 a: Marketing cost and Marketing Margin of Carrot (Rs/q)
(Channel I)
Item Cost % Consumer Price
Farm gate price 202.63 25.08
Marketing cost
Producer 82.68 10.23
Trader 33.70 4.17
Commission Agent/Wholesaler 37.71 4.67
Retailers 38.57 4.77

406
Total marketing cost 192.66 23.84
Marketing margin
Trader 100.00 12.38
Commission Agent/Wholesaler 60.00 7.43
Retailer 252.71 31.28
Total marketing margin 412.71 51.08
Consumer price 808.00 100.00
Table 24 b: Marketing cost and Marketing Margin of Carrot (Rs/q)
(Channel II)
Item Amount in Rs % Consumer Price
Farm gate price (Net price received by
farmer)
214.77 33.04
Marketing cost
Producer 83.43 12.84
Contractor 0.00 0.00
Commission Agent/Wholesaler 22.66 3.49
Retailers 38.57 5.93
Total marketing cost 144.66 22.26
Marketing margin

407
Contractor 0.00 0.00
Commission Agent/Wholesaler 55.00 8.46
Retailer 235.57 36.24
Total marketing margin 290.57 44.70
Consumer price 650.00 100.00
Price spread in carrot
Price spread for both channels is shown in tables 25 a, 25 b and 26. The price received for a
quintal of carrot and farmers share in consumer rupee was more in channel II. Despite of this
majority of farmers preferred channel I as they could dispose the produce during evening time
as daily auction takes place during this time. The higher price paid by consumer in channel I
was due to the fact that produce was taken to different states while in channel II it was sold in
the district itself. The retailers share in consumers’ rupee was more than 30 percent in both
channels as he sells the produce in small quantities and some quantity of produce gets spoiled
also. Overall farmers’ preference was for channel I as they were more assured about sale of
their produce within shortest possible time. Traders from other states also had the advantage
of buying produce in channel I as they could get fresh produce which could be sold next day
in the any market of Punjab and Haryana. Further traders were saving on account of market
tax and commission charged by commission agents in regulated market as market in channel
I, was managed by farmers and no record was kept regarding quantity sold and prices
determined on a particular day.

408
Table 25 a: Price spread in Carrot
(Channel I)
Particulars Amount (Rs) Percent
Price received by the farmer 202.63 25.08
Cost incurred 82.68 10.23
Contractor’s purchase price 285.31 35.31
Cost incurred 33.70 4.17
Margin 100 12.38
CA/ Wholesaler’s purchase price 419.01 51.86
Cost incurred 37.71 4.67
Margin 60.00 7.43
Retailer’s purchase price 516.72 63.95
Cost incurred 38.57 4.77
Margin 252.71 31.28
Price paid by the consumer 808.00 100.00

409
Table 25 b: Price spread in Carrot
(Channel II)
Particulars Amount (Rs) Percent
Price received by the farmer 214.77 33.04
Cost incurred 83.43 12.84
CA/ Wholesaler’s purchase price 298.20 45.88
Cost incurred 22.66 3.49
Margin 55.00 8.46
Retailer’s purchase price 375.86 57.82
Cost incurred 38.57 5.93
Margin 235.57 36.24
Price paid by the consumer 650.00 100.00
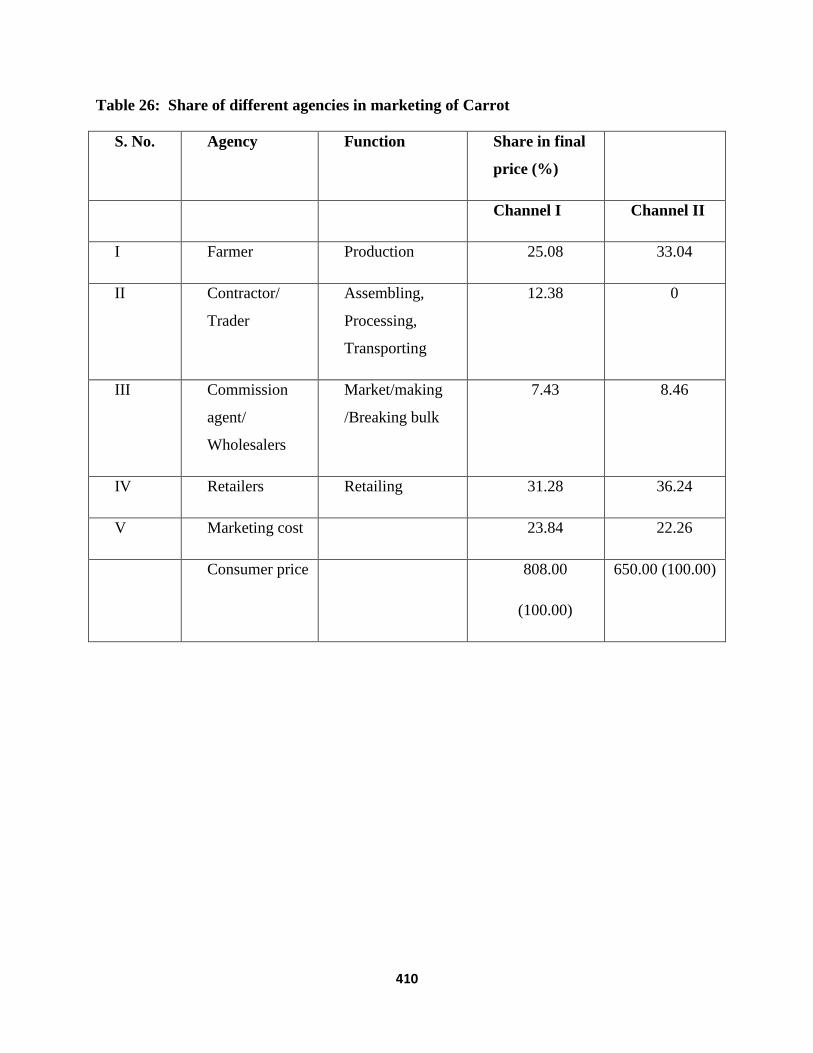
410
Table 26: Share of different agencies in marketing of Carrot
S. No. Agency Function Share in final
price (%)
Channel I Channel II
I Farmer Production 25.08 33.04
II Contractor/
Trader
Assembling,
Processing,
Transporting
12.38 0
III Commission
agent/
Wholesalers
Market/making
/Breaking bulk
7.43 8.46
IV Retailers Retailing 31.28 36.24
V Marketing cost 23.84 22.26
Consumer price 808.00
(100.00)
650.00 (100.00)

411
Marketing efficiency
The marketing efficiency of carrot was calculated using different methods. Acharya’s
modified measure of marketing efficiency was 0.33 and 0.49 in channel I and II, respectively
(table 27). It was higher in channel II as price received by farmers was higher and both
marketing cost and marketing margin were lower than channel I. Though marketing efficiency
in channel II was higher but its market share in total quantum of carrot sold was lower as
farmers could sell their produce during evening time in channel I while in channel II produce
was usually sold during early morning to 11 a.m. Hence, after harvesting of crop, farmers
were not much interested in keeping the produce at home or field during night time and
preferred to dispose it off through channel II during evening time.
Table 27: Measurement of Marketing Efficiency of Carrot
S. No. Particulars Unit Channel I Channel II
1 Retailer’s sale price (RP) Rs/q 808.00 650.00
2 Total marketing costs (MC) Rs/q 192.66 144.66
3 Total margins of intermediaries (MM) Rs/q 412.71 290.57
4 Price received by farmer (FP) Rs/q 202.63 214.77
5 Value added by the marketing system (1-4) Rs/q 605.37 435.23
Conventional method (E) (5 / 2) Ratio 3.14 3.01
Shephered’s method (ME) (1 / 2) Ratio 4.19 4.49
Acharya’s method (MME) [4 / (2+3)] Ratio 0.33 0.49

412
Constraints in carrot production and marketing
Carrot crop after harvesting cannot be kept more than 2-3 days and it has to be disposed at the
earliest to maintain its quality and fetch better price in the market. All the constraints perceived
by the farmers were analyzed and ranked following Garret ranking technique and shown in table
28. The most important constraint was about price of the produce as farmer was not sure that at
what price his produce will be sold on a particular day. The demand of carrot in different cities
and competition with produce of other regions also played major role in deciding the price.
Sometime small size carrot has no buyers in the market and they have to feed it to their animals.
Though, auction of produce takes place daily in both channels but farmers felt that traders make
a cartel and offer lower prices to producers that some time is too low to meet even cost of
production. Farmers faced lot of problems in procuring quality seed material at affordable rates.
The problem of poor quality seed is common and farmers felt cheated after sowing of seed.
Further, facility of cold storage for this crop is also lacking which causes sale of produce at lower
prices during peak season.
Table 28: Constraints perceived by farmers in Carrot production and marketing
Sr. No. Constraint Score Garret Ranking
1. Farmer is not sure about price he will
get
96.70 1
2. Vegetable is perishable and farmer
can't wait for long time
93.03 2
3. Vegetable purchasers make a cartel in
mandi and offer less price
89.16 3
4. Problem in getting quality seed
material
86.85 4
5. Delay in payment by traders 85.12 5
6. No facility of cold storage in the area 83.06 6

413
7. High cost of labour due to NAREGA 82.01 7
8. No facility of refrigerated containers 80.14 8
Factors affecting marketing efficiency of carrot
The findings of multiple linear regression model is presented in table 29 that shows negative and
significant relationship between marketing efficiency and marketing cost and marketing margin.
The volume of produce had positive and significant relationship which shows that large carrot
growers could bargain and fetched better prices in the market. Though increasing numbers of
market intermediaries had negative relationship with marketing efficiency but this factor was not
significant. Open market prices had positive relationship with efficiency showing benefit to
farmers during rising prices in the market but this factor was also not significant that shows that
it was always not a case that with rise in open market price, procurement price may also increase.
Table 29: Factors affecting Marketing Efficiency of Carrot
S.
No.
Factors Coefficient ‘t’ value
1 Constant 1.044271*** 2.415557
2 Marketing cost (x1) -0.00228** -1.70483
3 Marketing margin (x2) -0.00188*** -4.48311
4 Open market prices (x3) 0.000005NS
0.038808
5 Volume of the produce handled (x4) 0.001428*** 3.560875
6 Length of the market channel (No. of market intermediaries)
(x5) -0.00081NS
-0.11708
7 R2 0.80256

414
8 Adjusted R 2 0.7939
9 No. of observation (N) 120
Note : ***, **, * indicate significance at 1 %, 5 % and 10% level, respectively
3.5 Tomato
Marketing channels in tomato
There were two important marketing channels (table 30) through which tomato produce were
sold by farmers in Jaipur district. Produce procured in channel I, was sold in different markets
of Rajasthan viz. Jaipur, Sikar, Ganganagar, Hanumangarh, Sardarshahar, Churu and various
cities in Punjab and Haryana etc. While in Channel II produce is directly procured by retailers
and sold in Chomu or Jaipur city. About 40 percent of tomato produced in Jaipur district was
consumed in this district itself while 60 percent was sold in other markets of Rajasthan and
different cities in Punjab and Haryana state. For procurement of tomato either traders of other
cities directly comes in Chomu mandi or local commission agents buy the produce for outside
traders and transport the produce by trucks to distant places as per order. The quantity of
produce handled in Ist and IInd Channel was about 80 percent and 20 percent, respectively
(table 34). The marketing channel-I was most famous and traders from adjoining states like
Punjab, Haryana and other parts of Rajasthan were procuring tomato either from Chomu
mandi or from major production regions in Jaipur district. During peak season sometime there
was no space left in the market to keep large quantity of produce, hence traders were
procuring from production region directly. Retailers from Jaipur city or Chomu were buying
produce directly (Channel II) in mandi through commission agents. Tomato produced in
Jaipur district especially in Chomu and Bassi is very famous outside the state and has great
demand.

415
Table 30: Marketing channels in sale of Tomato (2008-9)
Particulars Supply Chain
Channel I Producer – Commission agent-Wholesaler/ Trader – Retailer – Consumer
Channel II Producer – Commission agent- Retailer – Consumer
Table 31: Quantity handled in different marketing channels of Tomato (2008-9)
S.N. Marketing channel Quantity handled (Q) Percent share
1 Channel I 38999.68 80.00
2 Channel II 9749.92 20.00
Total 48749.60 100.00
Marketing cost in tomato
It depends on distance of market from farmer’s field and kind of packaging material used
during transportation of produce. The detail information on marketing cost is presented in
tables 32a, 32b, 33a and 33b. Traders had highest share in marketing cost in channel I while
both farmers and retailers had similar expenses on marketing of tomato produce in channel II.
Farmers spent money for sorting of tomato i.e. segregating small size and spoiled tomato from
bigger one for getting higher price during sale. They also spent money on transportation of
produce to market place, purchase of packing material i.e. wooden baskets and plastic boxes
etc. Other market functionaries spent money on transportation of produce to different markets,
paying of taxes and commission in the markets etc. The total marketing cost was lower in
channel II compared to I because produce was not taken to distant places and number of
intermediaries were also fewer (table 33a, 33b). The channel I was more famous with farmers
as there was great demand of tomato from other regions and neighboring states and traders
were procuring it directly from production region during peak production. In the absence of
outside traders it was very difficult for local traders to procure the whole produce and due to

416
low competition prices fetched by farmers may also come down. In channel I, produce was
not auctioned and prices were determined by selected commission agents on daily basis based
on demand supply position at Jaipur market. In channel II also auction was rarely done. The
commission agents were facilitating sale of produce in channel II by issuing rate slips to
farmers, if he agreed than produce was weighed and amount paid to farmers. In channel I,
money is not paid immediately after sale and farmers sometime had to wait for seven days till
commission agents receive money from outside traders.

417
Table 32 a: Marketing cost and Marketing Margin in Tomato (Rs/q)
(Channel I)
Item Cost % Consumer Price
Farm gate price at village (Cost of production) 263.44 20.91
sorting 34.37 2.73
packing 4.60 0.37
transport 37.86 3.00
others 12.46 0.99
Total marketing cost 89.29 7.09
Net price realized by farmer 522.32 41.45
Farmer’s Selling Price to Wholesaler/ Trader 611.61 48.54
Total marketing cost 192.19 15.25
Marketing margin 86.20 6.84
Wholesalers price to retailers 890.00 70.63
transport 8.50 0.67
packing 25.00 1.98
Commission & tax 67.64 5.37
Total marketing cost 101.14 8.03
Marketing margin 268.86 21.34
Retailers price to consumer 1260.00 100.00

418
Table 32 b: Marketing cost and Marketing Margin in Tomato (Rs/q)
(Channel II)
Item Cost % Consumer
Price
Farm gate price at village (Cost of production) 263.44 25.93
sorting 34.37 3.38
packing 4.60 0.45
transport 37.86 3.73
others 12.46 1.23
Total marketing cost 89.29 8.79
Net price realized by farmer 530.71 52.24
Farmer’s Selling Price to Retailers 620 61.02
transport 12.00 1.18
packing 30.00 2.95
Commission & tax 47.12 4.64
Total marketing cost 89.12 8.77
Marketing margin 306.88 30.20
Retailers price to consumer 1016.00 100.00

419
Table 33 a: Marketing cost and Marketing Margin of Tomato (Rs/q)
(Channel I)
Item Cost % Consumer Price
Farm gate price 522.32 41.45
Marketing cost
Producer 89.29 7.09
Trader 192.19 15.25
Commission Agent/Wholesaler 0 0.00
Retailers 101.14 8.03
Total marketing cost 382.62 30.37
Marketing margin
Trader 86.20 6.84
Commission Agent/Wholesaler 0.00 0.00
Retailer 268.86 21.34
Total marketing margin 355.06 28.18
Consumer price 1260.00 100.00

420
Table 33 b: Marketing cost and Marketing Margin of Tomato (Rs/q)
(Channel II)
Item Amount in Rs % Consumer Price
Farm gate price (Net price received by
farmer)
530.71 52.24
Marketing cost
Producer 89.29 8.79
Contractor 0.00 0.00
Commission Agent/Wholesaler 0 0.00
Retailers 89.12 8.77
Total marketing cost 178.41 17.56
Marketing margin
Contractor 0.00 0.00
Commission Agent/Wholesaler 0.00 0.00
Retailer 306.88 30.20
Total marketing margin 306.88 30.20
Consumer price 1016.00 100.00

421
Price spread in tomato
Price spread for both channels is shown in tables 34 a, 34 b and 35. The price received for a
quintal of tomato and farmers share in consumer rupee was more in channel II. Despite of this
majority of farmers preferred channel I as they could dispose large quantity of the produce
through channel I. Another advantage farmers had in channel I is that traders were receiving
farmers’ produce during evening time and transporting tomatoes during night itself to distant
markets so that next day that produce could be sold in respective markets. The importance of
outside trade was more as Jaipur district alone had no capacity to consume whole tomato
produce produced in that region. The share of marketing cost was higher in channel I because
produce was taken to distant markets. The retailers share in consumers’ rupee was more in
channel II, it may be due to heavy demand in Jaipur city and taking more margins by retailers
which has the largest population in Rajasthan state. Overall farmers’ preference was for
channel I as they were more assured about sale of their produce within shortest possible time.
Traders from other states also had the advantage of buying produce in channel I as they could
get fresh produce which could be sold next day in the any market of Punjab and Haryana.

422
Table 34 a: Price spread in Tomato
(Channel I)
Particulars Amount (Rs) Percent
Price received by the farmer 522.32 41.45
Cost incurred 89.29 7.09
Traders’s purchase price 611.61 48.54
Cost incurred 192.19 15.25
Margin 86.20 6.84
CA/ Wholesaler’s purchase price 0 0
Cost incurred 0 0
Margin 0 0
Retailer’s purchase price 890.00 70.63
Cost incurred 101.14 8.03
Margin 268.86 21.34
Price paid by the consumer 1260.00 100.00

423
Table 34 b: Price spread in Tomato
(Channel II)
Particulars Amount (Rs) Percent
Price received by the farmer 530.71 52.24
Cost incurred 89.29 8.79
CA/ Wholesaler’s purchase price 0 0
Cost incurred 0 0
Margin 0 0
Retailer’s purchase price 620.00 61.02
Cost incurred 89.12 8.77
Margin 306.88 30.20
Price paid by the consumer 1016.00 100.00

424
Table 35: Share of different agencies in marketing of Tomato
S.
No.
Agency Function Share in final price (%)
Channel I Channel II
I Farmer Production 41.45 52.24
II Contractor/ Trader Assembling,
Processing,
Transporting
6.84
0.00
III Commission agent/
Wholesalers
Market/making
/Breaking bulk
0 0.00
IV Retailers Retailing 21.34 30.20
V Marketing cost 30.37 17.56
Consumer price 1260.00
(100.00)
1016.00
(100.00)
Marketing efficiency
The marketing efficiency of tomato was calculated using different methods. Acharya’s
modified measure of marketing efficiency was 0.71 and 1.09 in channel I and II, respectively
(table 36). It was higher in channel II as price received by farmers was higher and both
marketing cost and marketing margin were lower than channel I. Though marketing efficiency
in channel II was higher but its market share in total quantum of tomato sold was lower as
farmers could sell their produce during evening time in channel I while in channel II produce
was usually sold during early morning to 11 a.m. Hence, after harvesting of crop farmers were
not much interested in keeping the produce at home or field during night time and preferred to
dispose it off through channel I during evening time. Thus, despite having higher marketing

425
efficiency in channel II, channel I had more share in quantity of tomato brought for sale in the
market.
Table 36: Measurement of Marketing Efficiency of Tomato
S.
No.
Particulars Unit Channel
I
Channel
II
1 Retailer’s sale price (RP) Rs/q 1260.00 1016.00
2 Total marketing costs (MC) Rs/q 382.62 178.41
3 Total margins of intermediaries (MM) Rs/q 355.06 306.88
4 Price received by farmer (FP) Rs/q 522.32 530.71
5 Value added by the marketing system (1-4) Rs/q 737.68 485.29
Conventional method (E) (5 / 2) Ratio 1.93 2.72
Shephered’s method (ME) (1 / 2) Ratio 3.29 5.69
Acharya’s method (MME) [4 / (2+3)] Ratio 0.71 1.09
Constraints in tomato production and marketing
Tomato crop after harvesting cannot be kept for more days and it has to be disposed at the
earliest to maintain its quality and fetch better price in the market. All the constraints perceived
by the farmers were analyzed and ranked following Garret ranking technique and shown in table
37. The most important constraint was about price of the produce as farmer was not sure that at
what price his produce will be sold on a particular day. The demand of tomato in different cities
and competition with produce of other regions also played major role in deciding the price.
Another major constraint was that auctioning system was not followed at the regulated market

426
yard and traders had a cartel and offered lower prices to farmers. Farmers after taking produce to
market yard can’t take it back and he has to dispose it off even at lower prices. During peak
season market yard at Chomu had no sufficient space for keeping farmers produce and they had
to keep it outside the market yard which caused inconvenience to farmers. Farmers face lot of
problems in procuring quality seed material at affordable rates. The problem of poor quality seed
is common and farmers felt cheated after sowing of seed.
Table 37: Constraints perceived by farmers in tomato production and marketing
Sr. No. Constraint Score Garret Ranking
1. Farmer is not sure about price he will
get
96.27 1
2. Traders make a cartel in mandi and
offer less price
92.33 2
3. Avoidance of auction system by
traders
89.43 3
4. Estimating whole produce weight
based on one box weight
86.57 4
5. Lack of market space to keep produce
specially during main season
85.20 5
6. Encroachment on farmers platform by
traders
83.23 6
7. Problem in getting quality seed
material
81.78 7
8. High cost of labour due to NAREGA 80.22 8

427
Factors affecting marketing efficiency of tomato
The findings of multiple linear regression model is presented in table 38 that shows negative and
significant relationship between marketing efficiency and marketing cost and marketing margin.
The relationship of all other factors with marketing efficiency was not significant. The volume of
produce handled and open market prices had positive relationship with efficiency showing
benefit to farmers during rising prices in the market but these factors relationship with efficiency
was not significant that shows that it was always not a case that with rise in open market price,
procurement price may also increase. Though increasing numbers of market intermediaries had
negative relationship with marketing efficiency but this factor was also not found significant.
Table 38: Factors affecting Marketing Efficiency of Tomato
S. No. Factors Coefficient ‘t’ value
1 Constant 1.914389*** 11.52208
2 Marketing cost (x1) -0.00159*** -3.0663
3 Marketing margin (x2) -0.0017*** -2.92864
4 Open market prices (x3) 0.000003NS
0.063176
5 Volume of the produce handled (x4) 0.000002NS
0.044185
6 Length of the market channel (No.
of market intermediaries) (x5) -0.00193NS
-0.49432
7 R2 0.6844
8 Adjusted R 2 0.6705
9 No. of observation (N) 120
Note : ***, **, * indicate significance at 1 %, 5 % and 10% level, respectively

428
4. Strategies for increasing marketing efficiency of fruits & vegetables
Strategies to enhance marketing efficiency of fruits and vegetables vary according to nature of
produce and kind of marketing facilities in a particular region. Discussions were held with
farmers, contractors, wholesalers, processors and retailers to get the idea about improvement in
marketing system so that efficiency of the whole marketing system is improved and farmers get
adequate returns from this enterprise to remain in horticulture crops farming. Regarding fruits
both kinnow and aonla are important fruit crops of Rajasthan. More than 50 percent produce of
both fruits are transported outside state for further processing or for direct consumption. There is
not a single fruit processing industry for kinnow in the production region. So to enhance
marketing efficiency following suggestions & strategies came out after discussion with different
stakeholders’ and these can be followed by concerned agencies to enhance efficiency of both
fruits & vegetables in Rajasthan.
Establishment of Multi-fruit processing units in production area
Development of kinnow and aonla mandi with all the required facilities for outside
traders at Ganganagar and Chomu, respectively
Export promotion of kinnow by government so that farmers get better price
Increase in number of grading/ waxing plants for timely disposal of kinnow fruits
Modern agricultural implements used in kinnow/ aonla cultivation may be provided on
subsidized rates
Market fee should not be charged from farmers in states like Maharashtra, Karnataka,
Tamilnadu etc. and it should be from buyers like in Rajasthan
Sriganganagar should be declared as kinnow growing hub with better technical and
marketing facilities from concerned departments
Subsidy on fencing material is to be provided to farmers to protect crop from attack of
blue bull and other wild animals
Farmers friendly insurance schemes for fruit orchards must be implemented
Better varieties of kinnow is to be developed to fetch more market price from sale of fruit
Availability of quality planting and seed material must be ensured
Assurance of minimum floor price for major fruits and vegetable like cereals

429
Encouragement to form cooperatives by small fruit and vegetable growers for easy
disposal of produce and better bargain for prices
Registration of contractors agreements with farmers at regulated market office so that
farmers do not suffer with non compliance of it by traders
Market official must strictly ensure auction of both fruit and vegetables at mandi yard so
that farmers get maximum price for their produce
Use of farmers platform at Chomu market yard must be ensured for producers
Crop specific cold storage facilities with facility to take loan on that basis are to be
developed to avoid distress sale by farmers
Proper measurement of produce weight must be ensured at mandi yard
Illegal deductions from farmers produce must be checked
More space is to be created in Chomu market yard to keep farmers produce properly and
to avoid inconvenience to farmers
Linking of NAREGA work with farmers irrespective of farm size, it will make labour
available to farmers at critical time, enhance farm productivity and reduce the financial
burden on government

430
5) References
Acharya, S. S. and N.L. Agarwal (2005). Agricultural marketing in India. Oxford & IBH
Publishing Co. (P) Ltd., New Delhi.
Baba S.H., M.H. Wani, S.A. Wani and Yousuf Shahid (2010). Marketed surplus and price spread
of vegetables in Kashmir valley. Agril. Econ. Res. Rev., 23 (10): 115-128.
Dhaka and Poonia (2010). Identification of constraints encountered by the farmers in production
and marketing of vegetables in Bundi district of Rajasthan. Ind. Jour. Agril. Mktg., 24
(1): 20-25.
Government of Rajasthan (2009) Rajasthan Horticulture Statistics, Directorate of Horticulture,
Pant Krishi Bhawan, Jaipur (Various issues)
Kaur, H. and I.P. Singh (2010). Marketing of kinnow in Sri Ganganagar district of Rajasthan
state. Ind. Jour. Agril. Mktg., 24 (1): 141-149.
Saraswat S.P., Prem Singh Dahia, and Pratap Singh (2006). Production and marketing of peach
fruit: A case study of Rajgarh area of district Sirmour in Himachal Ptradesh. Ind. Jour.
Agril. Mktg., 20 (2): 81-91.
Tripathi, A.K., Subhasis Mandal, K.K. Datta and M. R. Verma (2006). A study on marketing of
ginger in RI – BHOI district of Meghalaya. Ind. Jour. Agril. Mktg., 20 (2): 106-116.
Singh, Ram, D.K. Bishnoi and Abhey Singh (2010). Cost benefit analysis and marketing of
mushroom in Haryana. Agril. Econ. Res. Rev., 23 (10): 115-128.

431
Data sites for NCAP study
Fruit/ Vegetable District Tehsils Hamlets/ Villages
Kinnow Sriganganagar Sriganganagar CHAK 9 Q,
CHAK 10 Q,
CHAK 11 Q,
CHAK 10 F,
CHAK 8 H (BARA),
CHAK 1 H (BARA)
MADERAN,Bakhtana,
Sangatpura,
Mirjawala, Santpur,
FATUI, 12 EE, 1 G
(BARI), 6 ZA, 1Z1, 4
Z, Chak 3 H (BARA),
8 HH, 5 ML, Netawala
Karanpur CHAK 16H, CHAK
17 H, CHAK 18 H,
CHAK 19 H, CHAK
24 H, CHAK 26 H,
CHAK 31 H, CHAK 2
U, CHAK 23 F,
CHAK 2 W, CHAK 3
“O”, CHAK 5 “U”,
CHAK 5 “O”,CHAK 2
T JODHAWALA,
CHAK 3 W, CHAK 2

432
M, CHAK 35 F,
CHAK 5 Z,
DALPATSINGHPUR,
CHAK 2 M
FUSAWALA, CHAK
5 Z
Carrot Sriganganagar Sriganganagar Sadhuwali,
Chak 2 D CHHOTI,
Chak 3 D CHHOTI,
Chak 4 D CHHoTI,
Kaluwala 1 ML,
6 LNP,
Kundalawala
Aonla Jaipur Chomu Hathnoda, Morija
Aamer Achrol, Tala, Tola
Tomato Jaipur Chomu Cheetwari, Hathnoda,
Harota, Morija
Aamer Isarwala,
Pokhiriyawala

433
Estimating Efficiency of Horticultural Commodities under
Different Supply Chains in Punjab
R.S. Sidhu
M.S. Sidhu
J.M. Singh
Department of Economics & Sociology
Punjab Agricultural University
Ludhiana
2010

434
1. Introduction
1.1 Background
The declining farm incomes, almost stagnant foodgrains productivity and growing demand for
fruits and vegetables due to increase in per capita income and changes in consumption pattern
calls for increase in the production of high value crops such as fruits, vegetables, etc in the
Punjab state. These crops not only enhance income of the cultivators but also generate more
employment through diversified farming. These are more beneficial for the marginal and small
farmers whose family labour availability per unit of land is high. Due to their small size of
operational holdings, it will not be possible to improve income of these households merely by
raising the yield of food and non-food crops. Therefore, the poverty as well as the nutritional
insecurity of large number of farm holdings can be reduced with the introduction of high value
crops on these holdings. The vegetable production is one of the potential alternatives due to short
cultivation period, small investments (unlike fruits) and their growing demand. Besides, in
several cases, the diversification of crops is need of the hour to restore the degraded natural
resource base of the state caused by monoculture of cereal crops.
The most important factor determining the pattern, if not the pace, of diversification is the
market. There are a number of studies in India and other developing countries, which suggest
high elasticity of demand of the high value crops (HVCs) in response to income and prices. The
price response however, is one aspect of the impact of the market on the cropping pattern.
Equally important is the marketing efficiency. The profitability of the crop/enterprise is the
guiding force for resource allocation decisions of the farmers, which apart from production
efficiency, depends upon the prices received by the producers in terms of consumer rupee.
Empirical studies have shown that a large number of the intermediaries are involved in the
movement of the horticultural produce from producer to consumer, who appropriate a large
proportion of the consumer price and the share of producer becomes very low. In case of
perishables, the storage of which is very difficult, the share of the producer is in the range of 30
to 60 per cent and the market efficiency is low. However, in recent years, many new supply
chains involving large sized agri retail/ companies, contract farming system, producer groups,
etc. are emerging, which are considered to be better marketing models giving higher prices to the
producers and better marketing efficiency through vertical integration/coordination of the

435
market. Therefore, it becomes imperative that such marketing/supply chain models are studied
and then contrasted with the prevailing traditional market models in order to measure the
efficiency of different supply chains in term of better prices to the producers as well as
consumers. Therefore, the present study focuses on these issues and tries to highlight the
marketing efficiency of different supply chain systems in case of vegetables in the Punjab state.
1.2 The specific objectives of the study were:
i) to estimate the marketing cost and marketing margin of different functionaries
for the selected horticultural commodities under various supply chains;
ii) to analyze the price spread, marketing efficiency and farmer’s share in
consumer’s rupee in various supply chains;
iii) to identify the constraints perceived by the various stakeholders and study the
factors influencing the marketing cost, margins and efficiency; and
iv) to suggest suitable strategies to enhance the marketing efficiency for the
horticultural commodities.

436
2) Data and Methodology
The study has been conducted in Punjab. Five important vegetables are studied in the study.
These are potato, tomato, green peas, brinjal and okra. Only those districts were purposively
selected for the study where there was considerable area under particular vegetable crop.
Keeping this in view, Jalandhar district was selected for potato, Kapurthala for tomato,
Hoshiarpur for green peas, and Jalandhar for brinjal and okra. The convenience sampling
technique was used for selection of different types of respondents in the study. For each
vegetable, the sample consisted of 120 farmers except 93 farmers for brinjal (Table 2). Further,
for each vegetable, 30 wholesalers, 30 retailers and 30 farmers from Apni Mandi were selected.
Table 1 : Sample size of different types of respondents
Sr. No. Name of the crop Particulars No. of respondents
A. Potato
i. Farmers 120
ii. Wholesalers 30
iii. Retailers 30
iv. Farmers from Apni Mandi 30
B. Tomato
i. Farmers 120
ii. Wholesalers 30
iii. Retailers 30
iv. Farmers from Apni Mandi 30
C. Green peas

437
i. Farmers 120
ii. Wholesalers 30
iii. Retailers 30
iv. Farmers from Apni Mandi 30
D. Brinjal
i. Farmers 93
ii. Wholesalers 30
iii. Retailers 30
iv. Farmers from Apni Mandi 30
E. Okra
i. Farmers 120
ii. Wholesalers 30
iii. Retailers 30
iv. Farmers from Apni Mandi 30
F. Total sample size
i. Farmers 573
ii. Wholesalers 150
iii. Retailers 150
iv. Farmers from Apni Mandi 150
Grand total 1023

438
Thus, the total sample consisted of 573 farmers, 150 wholesalers, 150 retailers and 150 farmers
from Apni Mandi. For the present study, the total number of all types of respondents was 1023.
The information was collected from the selected farmers about their socio-economic profile,
area and production of each vegetable crop, consumption of each vegetable crop at home and
quantity kept for seed purpose, payment in kind to labour, miscellaneous use and marketed
surplus of each vegetable. The data were also collected from the farmers about their expenses on
human and machine labour, seed and seed treatment, fertilizer and farm yard manure,
insecticides, pesticides and herbicides, irrigation, miscellaneous expenses, etc. The data were
also collected about yield, price, volume of main product and by-product, gross returns and
returns over variable cost. For rabi season, the return over variable cost of potato and green peas
have been compared with wheat (the principal rabi crop). Similarly, for the Kharif season, the
returns over variable costs of tomato, brinjal and okra have been compared with paddy (the
principal kharif crop).
The data were collected from the selected farmers, wholesalers, and retailers about their costs of
marketing of different vegetables. The net price received by farmers for each vegetable has been
worked out. The margin of market intermediaries have also been worked out. The price spread
was worked out by using the ‘Mode Method’. The marketing efficiency was worked out by using
the Acharya’s Modified Method. Cobb-Douglas type production function was applied to study
the factors affecting marketing efficiency of vegetables. Both linear and log-linear production
functions were fitted. Best fit function was determined on the basis of the level of significance
of the explanatory variables, the value of coefficient of multiple determination (R2) and the
logical signs of the explanatory variables included in the model. Cobb-Douglas function of the
following form was considered the most appropriate for the present investigation:
Y = A
ui
i
n
1i
eb
X
Where, Y represents the marketing efficiency of the channels under different vegetable crops
under study. Xi the selected explanatory variables; A, the technical efficiency parameter and bi
the coefficient of production elasticity of the respective variable Xi at the mean level of input
used and output obtained. the 'e' is an error term. The estimated form of the equation becomes:

439
Log Y = Log A +
n
i 1 bi log xi + u
Log Y = Log A + b1 log x1 + b2 log x2 +..............+ b6 log x6 + u
Where,
Y = Marketing Efficiency (%)
X1 = Marketing Cost (Rs.)
X2 = Transport Charges (Rs.)
X3 = Labour Charges (Rs.)
X4 = Marketing Margin (Rs.)
X5 = Volume of the produce handled (Kg.)
X6 = Net price received by producer (Rs.)
The ranking of various types of production and marketing constraints as perceived by the
selected farmers and wholesalers was done according to the Garrett’s technique given as under:
Percent position = NijRij /)50.0(100
Where, Rij is the rank given to ith item by jth individual
Nij is the number of items ranked by jth individual
The percent position of each rank is converted into scores by referring tables given by Garrett
and Woodworth (1969). Then for each factor, the scores of individual respondents are added
together and divided by the number of respondents for whom scores are added. The mean scores
for all the factors are ranked by arranging in descending order.

440
2.1 Scenario of area under vegetables
The information regarding the district wise area under vegetable and total cropped area in Punjab
for the year 2007-08 is shown in Table 3. The total area under vegetables was 2.20 per cent of
the total cropped area. Among different vegetable crops, potato was the dominant one having one
per cent share in the cropped area. The share of tomato, green peas, brinjal and okra was 0.11 per
cent, 0.23 per cent, 0.04 per cent and 0.03 per cent respectively. The major reason for more area
under potato was its semi-perishable nature as compared to other vegetables which are
perishable. Besides, the cold storage facilities are available for potatoes in the state. It may be
Table 2: District-wise area under vegetables vis-à-vis total cropped area in
Punjab, 2007-08.
(000 hect)
Sr.
No.
District Potato Tomato Green
peas Brinjal Okra
Total area
under
vegetables
Total
cropped
area
1 Gurdaspur
0.91
(0.18)
0.33
(0.07)
0.29
(0.06)
0.11
(0.02)
0.06
(0.01)
3.92
(0.78)
504
2 Amritsar
4.64
(1.09)
0.80
(0.19)
4.91
(1.16)
0.36
(0.08)
0.18
(0.04)
14.97
(3.53)
424
3 Tarn Taran
0.72
(0.18)
0.88
(0.22)
0.95
(0.24)
0.11
(0.03)
0.08
(0.02)
8.52
(2.16)
395
4 Kapurthala
5.73
(2.09)
1.90
(0.69)
0.43
(0.16)
0.32
(0.12)
0.13
(0.05)
12.98
(4.74)
274
5 Jalandhar 19.74 0.86 1.32 0.39 0.44 32.95 422
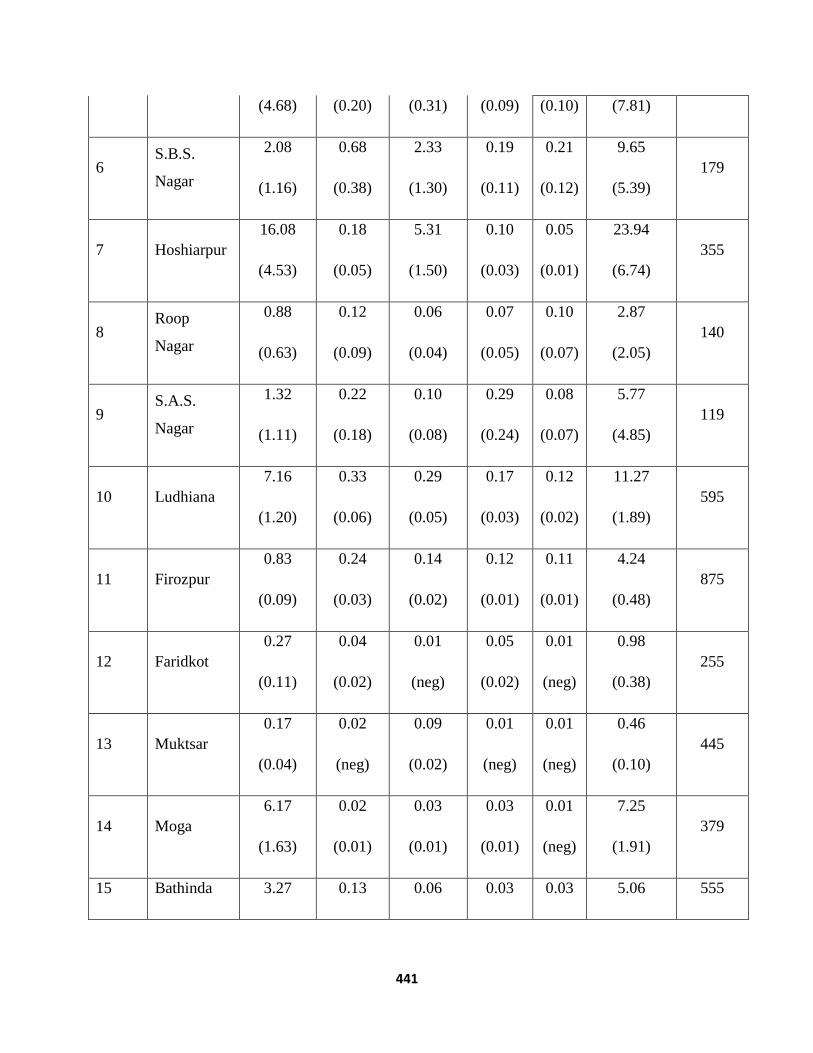
441
(4.68) (0.20) (0.31) (0.09) (0.10) (7.81)
6 S.B.S.
Nagar
2.08
(1.16)
0.68
(0.38)
2.33
(1.30)
0.19
(0.11)
0.21
(0.12)
9.65
(5.39)
179
7 Hoshiarpur
16.08
(4.53)
0.18
(0.05)
5.31
(1.50)
0.10
(0.03)
0.05
(0.01)
23.94
(6.74)
355
8 Roop
Nagar
0.88
(0.63)
0.12
(0.09)
0.06
(0.04)
0.07
(0.05)
0.10
(0.07)
2.87
(2.05)
140
9 S.A.S.
Nagar
1.32
(1.11)
0.22
(0.18)
0.10
(0.08)
0.29
(0.24)
0.08
(0.07)
5.77
(4.85)
119
10 Ludhiana
7.16
(1.20)
0.33
(0.06)
0.29
(0.05)
0.17
(0.03)
0.12
(0.02)
11.27
(1.89)
595
11 Firozpur
0.83
(0.09)
0.24
(0.03)
0.14
(0.02)
0.12
(0.01)
0.11
(0.01)
4.24
(0.48)
875
12 Faridkot
0.27
(0.11)
0.04
(0.02)
0.01
(neg)
0.05
(0.02)
0.01
(neg)
0.98
(0.38)
255
13 Muktsar
0.17
(0.04)
0.02
(neg)
0.09
(0.02)
0.01
(neg)
0.01
(neg)
0.46
(0.10)
445
14 Moga
6.17
(1.63)
0.02
(0.01)
0.03
(0.01)
0.03
(0.01)
0.01
(neg)
7.25
(1.91)
379
15 Bathinda 3.27 0.13 0.06 0.03 0.03 5.06 555

442
(0.59) (0.02) (0.01) (0.01) (0.01) (0.91)
16 Mansa
0.17
(0.05)
0.03
(0.01)
0.05
(0.01)
0.02
(0.01)
0.01
(neg)
1.58
(0.43)
366
17 Sangrur
0.60
(0.10)
0.19
(0.03)
0.30
(0.05)
0.21
(0.03)
0.33
(0.05)
5.81
(0.94)
617
18 Barnala
1.59
(0.65)
0.06
(0.02)
0.07
(0.03)
0.03
(0.01)
0.05
(0.02)
2.22
(0.91)
243
19 Patiala
4.88
(0.91)
0.96
(0.18)
1.50
(0.28)
0.34
(0.06)
0.23
(0.04)
14.03
(2.62)
535
20 Fatehgarh
Sahib
1.80
(0.94)
0.46
(0.24)
0.21
(0.11)
0.08
(0.04)
0.05
(0.03)
4.87
(2.54)
192
Total
79.01
(1.00)
8.45
(0.11)
18.45
(0.23)
3.03
(0.04)
2.29
(0.03)
173.34
(2.20)
7869
Note : i) neg means neglibible
ii) Figures in parentheses indicate percentages to total cropped area
stated that there are 491 cold stores with storage capacity of 16.20 lakh tonnes in the state. Most
of this cold storage capacity is utilized for potato only.
The district wise data about area under vegetables indicated that Jalandhar, Hoshiarpur, S.B.S.
Nagar, Kapurthala and SAS Nagar were the major vegetable producing districts during the year
2007-08. About eight per cent of the total cropped area of Jalandhar district was under
vegetables. The figure was 6.74 per cent for Hoshiarpur, 5.39 per cent for S.B.S. Nagar, 4.85 per
cent for S.A.S. Nagar and 4.74 per cent for the Kapurthala. In all the districts, potato was the
main vegetable crop. The area under other vegetables was less on account of perishable nature,
443
price fluctuations, no market intervention by the State and Union Governments and lack of
minimum support price (MSP). On the other hand, the effective public procurement of wheat and
paddy is there at the MSP. Therefore, these two crops taken together occupy about 79 per cent of
the total cropped area of the state.
2.2 Marketed surplus of vegetables
The information regarding per holding production, consumption and marketed surplus of
vegetable is given in Table 12 and graphic presentation is shown in Figure 1. The per holding
production of potato, tomato, green peas, brinjal and okra was about 2328, 953, 106, 349 and 134
quintals respectively. The total consumption of these vegetables was about 15 per cent, 0.55 per
cent, three per cent, three per cent and one per cent respectively. The consumption of potato was
high due to its more quantity kept for seed purpose. This was not so in case of other vegetables.
The marketed surplus was the maximum (99.45 per cent) for the tomato followed by okra (98.96
per cent), green peas (97.46 per cent), brinjal (97.32 per cent) and potato (84.67 per cent). As
already discussed, due to high seed rate of potato, its marketed surplus was low on the selected
farmers.

444
Table 3: Per holding marketed surplus of different vegetables of the selected
farmers
(Qtls)
Sr. No.
Particulars
Name of the vegetable
Potato Tomato Green peas Brinjal Okra
i. Area (acres) 23.11 9.98 4.42 5.41 4.15
ii. Production 2327.96 952.91 105.96 349.41 134.05
iii. Family consumption
3.97
(0.17)
0.63
(0.07)
0.28
(0.26)
0.51
(0.15)
0.46
(0.34)
iv. Quantity kept for seed
339.44
(14.58)
-
0.22
(0.21)
- -
v. Payment in kind to labour
7.21
(0.31)
3.15
(0.33)
1.80
(1.70)
6.61
(1.89)
0.83
(0.62)
vi. Miscellaneous uses
6.36
(0.27)
1.46
(0.15)
0.39
(0.37)
2.25
(0.64)
0.10
(0.07)
vii. Total consumption (iii to vi)
356.98
(15.33)
5.24
(0.55)
2.69
(2.54)
9.37
(2.68)
1.39
(1.04)
viii. Marketed surplus (ii- vii)
1970.98
(84.67)
947.67
(99.45)
103.27
(97.46)
340.04
(97.32)
132.66
(98.96)
Note: Figures in parentheses are percentages of production

445
2.3 Sale pattern
The information regarding the sale pattern of the selected vegetable growers is shown in Table
4.The maximum quantity of different vegetables was sold by the growers in the wholesale
market. The sale in this market varied from about 83 per cent for potato to about 92 per cent in
case of tomato. The sale at the
Table 4: Sale pattern of vegetables of the selected growers
(qtls)
Sr.No. Particulars/crop Potato Tomato Green
peas Brinjal Okra
i) Sale at the farm
149.72
(7.60)
36.25
(3.83)
6.50
(6.29)
16.75
(4.92)
8.85
(6.67)
ii) Sale in the village
28.50
(1.45)
26.75
(2.82)
2.45
(2.37)
8.80
(2.59)
5.15
(3.88)
iii) Sale in the
wholesale market
1643.81
(83.40)
872.17
(92.03)
92.06
(89.15)
301.60
(88.69)
113.57
(85.61)
iv) Sale in the distant
market (Delhi)
101.70
(5.15)
- - - -
v) Sale in the Apni
Mandi
47.25
(2.40)
12.50
(1.32)
2.26
(2.19)
12.89
(3.80)
5.09
(3.84)
Per holding
marketed surplus
1970.98
(100.00)
947.67
(100.00)
103.27
100.00
340.04
(100.00)
132.66
(100.00)
Note: Figures in the parentheses indicate percentages to the marketed surplus.

446
farm was maximum (about 8 per cent) for potato followed by okra (about 7 per cent), green peas
(about 6 per cent), brinjal (about 5 per cent) and tomato (about 4 per cent). The vegetable
retailers operating in the rural areas were the main buyers of the vegetables from the farm. About
one per cent to four per cent vegetables were sold by the growers in the village to the petty
shopkeepers and non-vegetable growing rural households (farm and non-farm). Except potato,
no sale was done in the distant market by the growers. Even in case of potato, this figure was
meagre (about 5per cent). Since vegetables are perishable in nature, its transportation to the
distant markets is a major constraint. Potato comes under separate category being semi-
perishable in nature. The selected growers sold very limited quantity of vegetables in the Apni
Mandi. The sale there varied from about one per cent for potato to about four per cent each in
case of brinjal and okra. The growers had to stay for long hours for sale of vegetables in the Apni
Mandi. There were other constraints too. Therefore, majority of the growers preferred to sell
vegetables in the wholesale market.
Price spread of potato
Price spread is defined as the difference between the price paid by the consumer and price
received by the producer of the farm product. It includes market cost and margins of the market
intermediaries also. As already discussed, potato is the most important vegetable in Punjab. The
price spread though three main supply chains of potato have been worked out in the study. The
supply chain I (Producer-wholesaler (through commission agent)-retailer-consumer) has been
discussed in Table 14 and graphic presentation is shown in Figure 2. A perusal of the table
reveals that producer’s sale price of potato was Rs 500 per qtl in Jalandhar market which was
about 67 per cent of the consumer’s purchase price. The expenses borne by the producer were Rs
66 per qtl which were about 9 per cent of the consumer’s purchase price. The net price received
by the producer was Rs 434 per qtl which was about 58 per cent of the consumer’s price. The
expenses borne by the wholesaler and retailer were about Rs 58 and Rs 52 per qtl respectively
which were about 8 and 7 per cent of the consumer’s price (Rs 750 per qtl). The margin of the
wholesaler was about 6 per cent whereas this figure was about 13 per cent in case of retailer. The
margin of the wholesaler was less on account of high volume of business as compared to the
retailer who handles low volume of business.

447
The price spread of potato in supply chain II (Producer-retailer (through commission agent)-
consumer) has been presented in Table 15 and graphic presentation is shown in Figure 3. The
producer’s sale price of potato was Rs 520 per qtl in Jalandhar market which about 69 per cent of
the consumer’s purchase price
Table 5: Price spread of potato in Jalandhar market, January 2009
(Supply chain I: Producer-wholesaler (through commission agent)-
Retailer-consumer)
Sr.
No. Particulars Rs per qtl
%age share in
consumer’s price
1. Producer’s sale price/
wholesaler’s purchase price 500.00 66.67
2. Expenses borne by the producer 65.78 8.77
i. Grading, filling, stitching etc. 13.92 1.86
ii. Cost of packing 29.93 3.99
iii. Transportation cost 12.31 1.64
iv. Loading, unloading and wastage 9.62 1.28
3. Net price received by the farmer 434.22 57.90
4. Expenses borne by the
wholesaler 58.09 7.74
i. Market fee @ 2 % 10.00 1.33
ii. RDF @ 2% 10.00 1.33
iii. Commission @ 5 % 25.00 3.33

448
iv. Miscellaneous expenses 13.09 1.75
5. Margin of the wholesaler 41.91 5.59
6. Wholesaler’s sale price/
retailer’s purchase price 600.00 80.00
7. Expenses borne by the retailer 51.59 6.88
i. Transportation cost 10.25 1.37
ii. Labour 2.70 0.36
iii. Rent of shop/rehri 1.92 0.26
iv. Packing cost 14.22 1.89
v. Loss, wastage and spoilage @
2.50% 15.00 2.00
vi. Miscellaneous cost 7.50 1.00
8. Margin of the retailer 98.41 13.12
9. Retailer’s sale price/
consumer’s purchase price 750.00 100.00
(Rs 750 per qtl). The expenses borne by the producer were Rs 66 per qtl which were about nine
per cent of the consumer’s purchase price. The net price received by the producer was about Rs
454 per qtl which was 61 per cent of the consumer’s price. The expenses borne by the retailer
were about Rs 111 per qtl which were 15 per cent of the consumer’s price. The retailer’s margin
was Rs 119 per qtl which in percentage terms was about 16 of the consumer’s purchase price.
The margin of the retailer was high in supply chain II as compared to the supply chain I because
the wholesaler was not there in the latter.

449
Table 6: Price spread of potato in Jalandhar market, January 2009
(Supply chain II: Producer-retailer (through commission agent)-consumer)
Sr.
No. Particulars Rs per qtl
%age share in
consumer’s price
1. Producer’s sale price/ retailer’s
purchase price 520.00 69.33
2. Expenses borne by the producer 65.78 8.77
i. Grading, filling, stitching etc. 13.92 1.86
ii. Cost of packing 29.93 3.99
iii. Transportation cost 12.31 1.64
iv. Loading, unloading and wastage 9.62 1.28
3. Net price received by the farmer 454.22 60.56
4. Expenses borne by the retailer 111.27 14.84
i. Market fee @ 2 % 10.40 1.39
ii. RDF @ 2% 10.40 1.39
iii. Commission @ 5 % 26.00 3.46
iv. Miscellaneous expenses 16.85 2.25
v. Transportation cost 10.25 1.37
vi. Rent of shop/rehri 2.02 0.27
vii. Labour 8.10 1.08
viii. Loss, wastage and spoilage @ 13.00 1.73

450
2.50%
ix. Packing cost 14.25 1.90
5. Margin of the retailer 118.73 15.83
6. Retailer’s sale price/ consumer’s
purchase price 750.00 100.00
The price spread of the potato in Apni Mandi of Jalandhar market has been worked out in Table
7 and graphic presentation is shown in Figure 4. It may be stated that there is no middleman
involved in the sale of farm produce in the Apni Mandi. There is direct sale of the produce by the
producer to consumer. This scheme was introduced in major cities/towns of Punjab at the
initiative of the then Financial Commissioner (Development), Punjab, Mr Manohar Singh Gill,
IAS in February, 1987. The major objective of this scheme was to increase producer’s share in
the consumer’s purchase price particularly for perishable commodities like vegetables. Another
aim was to supply fresh vegetable to the consumers at low price in comparison to the prevailing
market price through traditional supply chains.
A perusal of Table 7 reveals that producer’s sale price/consumer’s purchase price was Rs 700 per
qtl in Apni Mandi of Jalandhar market. The expenses borne by the producer were Rs 52 per qtl
which were 7.45 per cent of the consumer’s price. The net price received by the producer was 93
per cent of the consumer’s price. As compared to the supply chain I and II, the producer’s share
in supply chain III was more on account of direct sale by the producer to the consumer. But this
is also a fact that major share of the vegetables can not be sold through Apni Mandi because the
traditional wholesalers and retailers have their own role in vegetable marketing. It is a part of the
Indian culture that traditional vegetable hawkers supply various vegetables at the doorsteps of
the consumers in various localities of cities and towns.
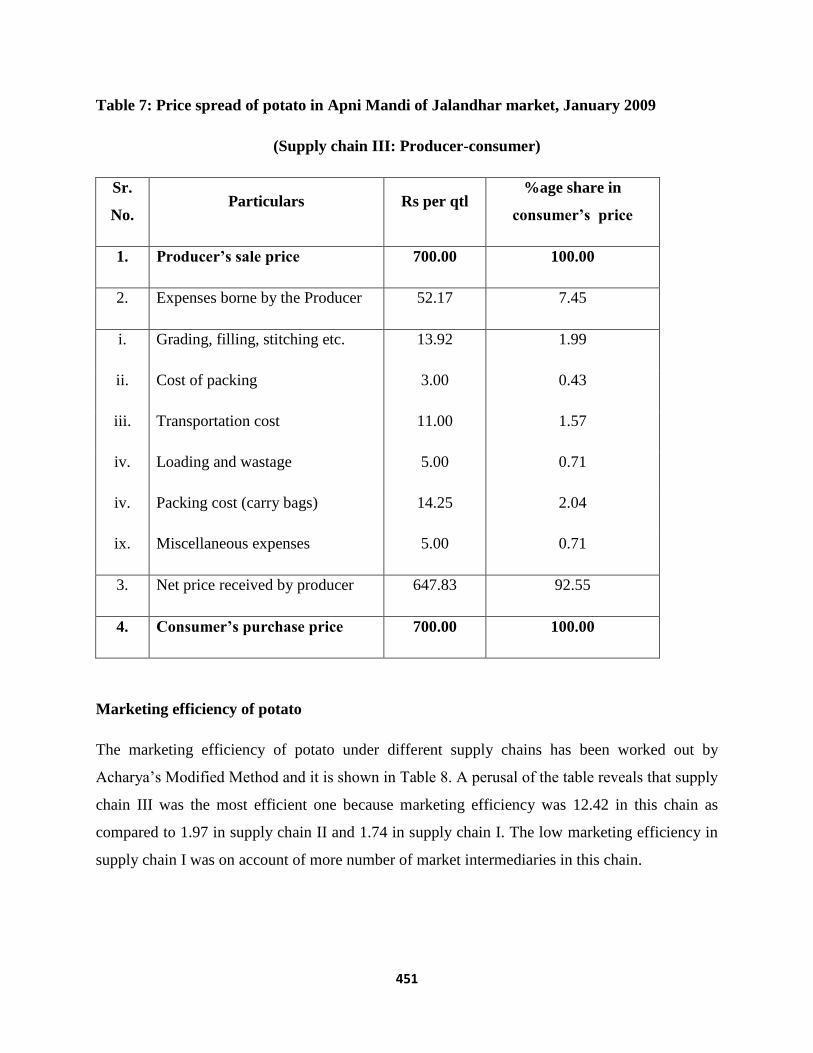
451
Table 7: Price spread of potato in Apni Mandi of Jalandhar market, January 2009
(Supply chain III: Producer-consumer)
Sr.
No. Particulars Rs per qtl
%age share in
consumer’s price
1. Producer’s sale price 700.00 100.00
2. Expenses borne by the Producer 52.17 7.45
i. Grading, filling, stitching etc. 13.92 1.99
ii. Cost of packing 3.00 0.43
iii. Transportation cost 11.00 1.57
iv. Loading and wastage 5.00 0.71
iv. Packing cost (carry bags) 14.25 2.04
ix. Miscellaneous expenses 5.00 0.71
3. Net price received by producer 647.83 92.55
4. Consumer’s purchase price 700.00 100.00
Marketing efficiency of potato
The marketing efficiency of potato under different supply chains has been worked out by
Acharya’s Modified Method and it is shown in Table 8. A perusal of the table reveals that supply
chain III was the most efficient one because marketing efficiency was 12.42 in this chain as
compared to 1.97 in supply chain II and 1.74 in supply chain I. The low marketing efficiency in
supply chain I was on account of more number of market intermediaries in this chain.

452
Table 8: Marketing efficiency of potato under different channels
(Rs/qtl)
Sr.
No. Particulars
Supply
chain I
Supply
chain II
Supply
chain III
i. Consumer’s purchase price 750.00 750.00 700.00
ii. Producer’s sale price 500.00 520.00 700.00
iii. Total marketing costs 109.69 111.27 52.17
iv. Total margins of intermediaries 140.31 118.73 -
v. Net price received by farmer 434.22 454.22 647.83
Marketing efficiency 1.74 1.97 12.42
Price spread of tomato
The price spread of tomato in Kapurthala market in supply chain I (Producer-wholesaler
(through commission agent)-retailer-consumer) has been worked out in Table 18 and graphic
presentation is shown in Figure 5. The producer’s sale price of tomato was Rs 600 per qtl which
was only 50 per cent of the consumer’s purchase price (Rs 1200 per qtl). The expenses borne by
the producer were Rs 46.40 per qtl which were about four per cent of the consumer’s price. The
net price received by the producer was about Rs 554 per qtl which in percentage terms was about
46 per cent of the consumer’s purchase price. The expenses borne by the wholesalers and
retailers were Rs 68 and Rs 84 per qtl respectively. These respective expenses were about six and
seven per cent of the consumer’s purchase price. The margin of the wholesaler and retailer in
absolute terms was Rs 132 and Rs 316 per qtl respectively which in percentage terms was 11 per
cent and 26 per cent of the purchase price of consumer.

453
Table9: Price Spread of tomato in Kapurthala market, June 2009
(Supply chain I: Producer-wholesaler (through commission agent)-
retailer-consumer)
Sr.
No. Particulars Rs per qtl
%age share in
consumer’s price
1. Producer’s sale price/
wholesaler’s purchase price 600.00 50.00
2. Expenses borne by the producer 46.40 3.87
i. Grading, filling, stitching etc. 7.50 0.63
ii. Cost of packing 9.34 0.78
iii. Transportation cost 20.34 1.69
iv. Loading, unloading and wastage 9.22 0.77
3. Net price received by the farmer 553.60 46.13
4. Expenses borne by the wholesaler 67.95 5.66
i. Market fee @ 2 % 12.00 1.00
ii. RDF @ 2% 12.00 1.00
iii. Commission @ 5 % 30.00 2.50
iv. Miscellaneous expenses 13.95 1.16
5. Margin of the wholesaler 132.05 11.00
6. Wholesaler’s sale price/
retailer’s purchase price 800.00 66.67

454
7. Expenses borne by the retailer 83.74 6.98
i. Transportation cost 13.88 1.17
ii. Labour 2.72 0.23
iii. Rent of shop/rehri 0.43 0.03
iv. Packing cost 17.34 1.44
v. Loss, wastage and spoilage @
5% 40.00 3.33
vi. Miscellaneous cost 9.37 0.78
8. Margin of the retailer 316.26 26.36
9. Retailer’s sale price/
consumer’s purchase price 1200.00 100.00
As in case of potato, the margin of wholesaler was low in comparison to the retailer for tomato
also on account of high volume of business of the wholesaler. The retailer’s volume of business
was low, therefore, he kept high margin for himself on per unit sale of tomato.
The producer’s sale price was Rs 625 per qtl in supply chain II (Producer-retailer-(through
commission agent)-consumer) in Kapurthala market (Table 10) and the graphic presentation is
shown in Figure 6. The share of the producer’s sale price was 52 per cent in the consumer’s
purchase price (Rs 1200 per qtl). The producer’s expenses were Rs 46 per qtl which were about
four per cent of the consumer’s price. The expenses borne by the retailer were Rs 146 per qtl
which were about 12 per cent of the consumer’s purchase price. The margin of the retailer was
Rs 429 per qtl which was 36 per cent of the consumer’s price. The retailer’s sale price was the
same i.e. Rs 1200 per qtl in both the supply chain I and II. The retailer’s margin was
comparatively less in supply chain I as compared to supply chain II.

455
Table10: Price Spread of tomato in Kapurthala market, June 2009
(Supply chain II: Producer-retailer-(through commission agent)-consumer)
Sr.
No. Particulars Rs per qtl
%age share in
consumer’s price
1. Producer’s sale price/ retailer’s
purchase price 625.00 52.07
2. Expenses borne by the producer 46.40 3.87
i. Grading, filling, stitching etc. 7.50 0.63
ii. Cost of packing 9.34 0.78
iii. Transportation cost 20.34 1.69
iv. Loading, unloading and wastage 9.22 0.77
3. Net price received by the farmer 578.60 48.20
4. Expenses borne by the retailer 146.48 12.21
i. Market fee @ 2 % 12.50 1.04
ii. RDF @ 2% 12.50 1.04
iii. Commission @ 5 % 31.25 2.60
iv. Miscellaneous expenses 12.66 1.06
v. Transportation cost 13.88 1.16
vi. Rent of shop/rehri 8.14 0.68
vii. Labour 2.21 0.19

456
viii. Loss, wastage and spoilage @ 5% 31.25 2.60
ix. Packing cost 22.09 1.84
5. Margin of the retailer 428.52 35.72
6. Retailer’s sale price/ consumer’s
purchase price 1200.00 100.00
The price spread of tomato in Apni Mandi of Kapurthala market in supply chain III (Producer-
consumer) has been worked out in Table 11 and graphic presentation is shown in Figure 7. The
producer’s sale price of tomato was Rs 1100 per qtl. He had to bear expenses to the extent of Rs
76 per qtl. These expenses were about seven per cent of the consumer’s purchase price (Rs 1100
per qtl). The net price received by the producer was Rs 1024 per qtl which was 93 per cent of the
consumer’s purchase price. As already discussed in case of potato, the producer’s share was the
maximum in supply chain III because no market intermediary was involved.

457
Table 11: Price Spread of tomato in Apni Mandi of Kapurthala market, June 2009
(Supply chain III: Producer-consumer)
Marketing efficiency of Tomato
The marketing efficiency of all the three supply chains of tomato brought out that supply chain
III was the most efficient one (Table 12). The marketing efficiency of this supply chain was
13.42 as against 1.01 in supply chain II and 0.92 in supply chain I. The marketing efficiency of
supply chain III was high on account of the fact that no middleman was involved and produce
was directly sold to consumers. As compared to supply chain I, the marketing efficiency of
tomato was marginally high in supply chain II due to less number of intermediaries in the latter.
Sr.
No. Particulars Rs per qtl
%age share in
consumer’s price
1. Producer’s sale price 1100.00 100.00
2. Expenses borne by the producer 76.27 6.93
i. Grading, filling, stitching etc. 7.50 0.68
ii. Cost of packing 15.34 1.39
iii. Transportation cost 13.54 1.23
iv. Loading and wastage 10.14 0.92
iv. Packing cost (carry bags) 20.09 1.83
ix. Miscellaneous expenses 9.66 0.88
3. Net price received by producer 1023.73 93.07
4. Consumer’s purchase price 1100.00 100.00

458
Table12: Marketing Efficiency of tomato under different channels
(Rs per qtl)
Price spread of the green peas
The price spread of the green peas in Hoshiarpur market in supply chain I (Producer-wholesaler
(through commission agent)-retailer-consumer) has been given in Table 13 and graphic
presentation is shown in Figure 8. The producer’s sale price was Rs 900 per qtl which was 72 per
cent of the consumer’s purchase price. The expenses borne by the producer were Rs 67 per qtl
which were 5.36 per cent of the consumer’s price. The net price received by the producer was Rs
833 per qtl. This was about 67 per cent of the consumer’s price. The expenses borne by the
wholesaler and retailer were Rs 94 and Rs 92 per qtl respectively. These respective expenses
were 7.52 per cent and 7.36 per cent of the consumer’s purchase price (Rs 1250 per qtl). The
margin of the wholesaler was Rs 56 per qtl and that of retailer was Rs 108 per qtl. The
wholesaler’s and retailer’s margins were 4.48 per cent and 8.64 per cent respectively. The
retailer’s margin was high on account of his low volume of business in comparison to the
wholesaler.
Sr.
No. Particulars
Supply
chain I
Supply
chain II
Supply
chain III
i. Consumer’s purchase price 1200.00 1200.00 1100.00
ii. Producer’s sale price 600.00 625.00 1100.00
iii. Total marketing costs 151.69 146.48 76.27
iv. Total margins of intermediaries 448.31 428.52 -
v. Net price received by farmer 553.60 553.60 1023.73
Marketing Efficiency 0.92 1.01 13.42

459
Table 13: Price spread of green peas in Hoshiarpur market, January 2009
(Supply chain I: Producer-wholesaler (through commission agent)- retailer-
consumer)
Sr.
No. Particulars Rs per qtl
%age share in
consumer’s price
1. Producer’s sale price/
wholesaler’s purchase price 900.00 72.00
2. Expenses borne by the producer 66.96 5.36
i. Grading, filling, stitching etc. 7.05 0.56
ii. Cost of packing 22.42 1.79
iii. Transportation cost 16.46 1.33
iv. Loading, unloading and wastage 21.03 1.68
3. Net price received by the farmer 833.04 66.64
4. Expenses borne by the wholesaler 94.00 7.52
i. Market fee @ 2 % 18.00 1.44
ii. RDF @ 2% 18.00 1.44
iii. Commission @ 5 % 45.00 3.60
iv. Miscellaneous expenses 13.00 1.04
5. Margin of the wholesaler 56.00 4.48
6. Wholesaler’s sale price/
retailer’s purchase price 1050.00 84.00
7. Expenses borne by the retailer 91.94 7.36
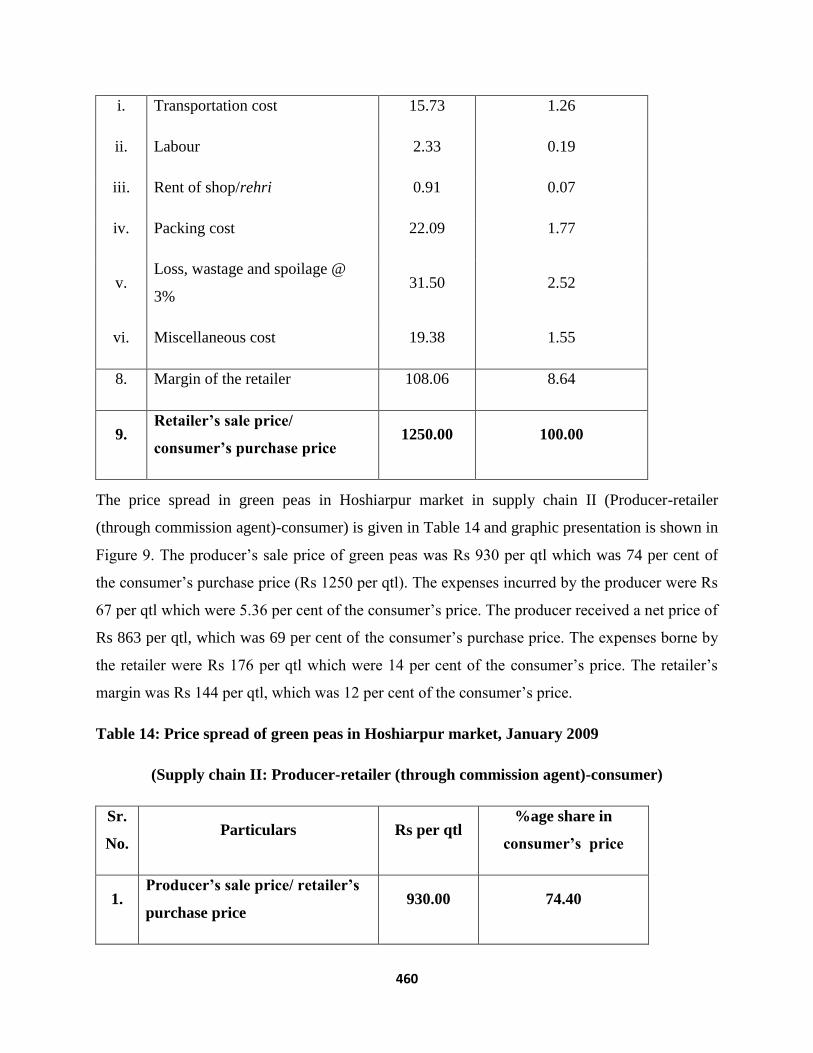
460
The price spread in green peas in Hoshiarpur market in supply chain II (Producer-retailer
(through commission agent)-consumer) is given in Table 14 and graphic presentation is shown in
Figure 9. The producer’s sale price of green peas was Rs 930 per qtl which was 74 per cent of
the consumer’s purchase price (Rs 1250 per qtl). The expenses incurred by the producer were Rs
67 per qtl which were 5.36 per cent of the consumer’s price. The producer received a net price of
Rs 863 per qtl, which was 69 per cent of the consumer’s purchase price. The expenses borne by
the retailer were Rs 176 per qtl which were 14 per cent of the consumer’s price. The retailer’s
margin was Rs 144 per qtl, which was 12 per cent of the consumer’s price.
Table 14: Price spread of green peas in Hoshiarpur market, January 2009
(Supply chain II: Producer-retailer (through commission agent)-consumer)
Sr.
No. Particulars Rs per qtl
%age share in
consumer’s price
1. Producer’s sale price/ retailer’s
purchase price 930.00 74.40
i. Transportation cost 15.73 1.26
ii. Labour 2.33 0.19
iii. Rent of shop/rehri 0.91 0.07
iv. Packing cost 22.09 1.77
v. Loss, wastage and spoilage @
3% 31.50 2.52
vi. Miscellaneous cost 19.38 1.55
8. Margin of the retailer 108.06 8.64
9. Retailer’s sale price/
consumer’s purchase price 1250.00 100.00

461
2. Expenses borne by the producer 66.96 5.36
i. Grading, filling, stitching etc. 7.05 0.56
ii. Cost of packing 22.42 1.79
iii. Transportation cost 16.46 1.33
iv. Loading, unloading and wastage 21.03 1.68
3. Net price received by the farmer 863.04 69.04
4. Expenses borne by the retailer 176.10 14.09
i. Market fee @ 2 % 18.60 1.49
ii. RDF @ 2% 18.60 1.49
iii. Commission @ 5 % 46.50 3.72
iv. Miscellaneous expenses 17.19 1.37
v. Transportation cost 15.73 1.26
vi. Rent of shop/rehri 1.59 0.13
vii. Labour 7.90 0.63
viii. Loss, wastage and spoilage @ 3% 27.90 2.23
ix. Packing cost 22.09 1.77
5. Margin of the retailer 143.90 11.51
6. Retailer’s sale price/ consumer’s
purchase price 1250.00 100.00
The price spread in green peas in Apni Mandi of Hoshiarpur market in supply chain III
(Producer-consumer) is depicted in Table 14 and the graphic presentation in Figure 10. The

462
producer’s sale price/consumer’s purchase price of green peas was Rs 1100 per qtl. The
producer’s expenses were Rs 69 per qtl which were 6.32 per cent of the consumer’s purchase
price. It was seen that producer realised higher price in supply chain III as compared to the
supply chain II and I. Similarly, the consumer benefited in supply chain III as his purchase price
was lower in comparison to his price in the latter two supply chains. Hence, we can say that
producers as well as consumers were the gainers in the Apni Mandi. The sale of vegetables in the
Apni Mandi resulted in more income to the producers and monetary savings to the consumers.
However, the volume of produce sold by vegetable producers in Apni Mandi was very small of
the total production.
Table 15: Price spread of green peas in Apni Mandi of Hoshiarpur market, January
2009 (Supply chain III: Producer-consumer)
Sr.
No. Particulars Rs per qtl
%age share in
consumer’s price
1. Producer’s sale price 1100.00 100.00
2. Expenses borne by the Producer 69.48 6.32
i. Grading, filling, stitching etc. 7.05 0.64
ii. Cost of packing 4.50 0.41
iii. Transportation cost 15.47 1.41
iv. Loading and wastage 11.03 1.00
iv. Packing cost (carry bags) 21.05 1.91
ix. Miscellaneous expenses 10.38 0.94
3. Net price received by producer 1030.52 93.68
4. Consumer’s purchase price 1100.00 100.00

463
Marketing efficiency of green peas
Table 16 shows the marketing efficiency of green peas under different supply chains. The supply
chain III was the most efficient one because the value of marketing efficiency was 14.83 as
against 2.70 in supply chain II and 2.38 in supply chain I. The marketing efficiency in supply
chain II was high as compared to supply chain I because the number of intermediaries was less in
the former.
Table 16: Marketing efficiency of green peas under different channels
(Rs per qtl)
Sr.
No. Particulars
Supply chain
I
Supply chain
II
Supply chain
III
i. Consumer’s purchase price 1250.00 1250.00 1100.00
ii. Producer’s sale price 900.00 930.00 1100.00
iii. Total marketing costs 185.40 176.10 69.48
iv. Total margins of intermediaries 164.06 143.90 -
v. Net price received by farmer 833.04 863.04 1030.52
Marketing efficiency 2.38 2.70 14.83
Price spread of brinjal
The price spread of brinjal in Jalandhar market in supply chain I (Producer-wholesaler (through
commission agent)-retailer-consumer) is shown in Table 17 and Figure 11. The producer’s sale
price of brinjal was Rs 650 per qtl which was 65 per cent of the consumer’s purchase price which
was Rs 1000 per qtl. The marketing expenses of the producer were Rs 64 per qtl which formed
6.40 per cent of the consumer’s price. The net price received by the producer was Rs 586 per qtl

464
which was 59 per cent of the consumer’s price. The respective expenses borne by the wholesaler
and retailer were Rs 78 and Rs 44 per qtl which were eight and four per cent of the consumer’s
price. The margin of the wholesaler was 10.16 per cent whereas the margin was 12.65 per cent in
case of retailer. As in case of other vegetables, the margin of the retailer was high in case of
brinjal too on account of low volume of business in comparison to the wholesaler.
Table 17: Price spread of brinjal in Jalandhar market, July 2009
(Supply chain I: Producer-wholesaler (through commission agent)- retailer-
consumer)
Sr.
No. Particulars
Rs per
qtl
%age share in consumer’s
price
1. Producer’s sale price/ wholesaler’s
purchase price 650.00 65.00
2. Expenses borne by the producer 64.01 6.40
i. Grading, filling, stitching etc. 13.43 1.34
ii. Cost of packing 20.69 2.07
iii. Transportation cost 23.43 2.34
iv. Loading, unloading and wastage 6.46 0.65
3. Net price received by the farmer 585.99 58.60
4. Expenses borne by the wholesaler 78.39 7.84
i. Market fee @ 2 % 13.00 1.30
ii. RDF @ 2% 13.00 1.30
iii. Commission @ 5 % 32.50 3.25
iv. Miscellaneous expenses 19.89 1.99

465
5. Margin of the wholesaler 101.61 10.16
6. Wholesaler’s sale price/ retailer’s
purchase price 830.00 83.00
7. Expenses borne by the retailer 43.54 4.35
i. Transportation cost 8.27 0.82
ii. Labour 1.32 0.13
iii. Rent of shop/rehri 0.38 0.04
iv. Packing cost 10.59 1.06
v. Loss, wastage and spoilage @ 2 % 16.60 1.66
vi. Miscellaneous cost 6.38 0.64
8. Margin of the retailer 126.46 12.65
9. Retailer’s sale price/ consumer’s
purchase price 1000.00 100.00
The price spread of brinjal in Jalandhar market in supply chain II (Producer-retailer (through
commission agent)-consumer) is presented in Table 18 and the graphic presentation is shown in
Figure 12. The producer’s sale price was Rs 670 per qtl which was 67 per cent of the consumer’s
purchase price (Rs 1000 per qtl). The producer’s expenses were Rs 64 per qtl which were 6.40
per cent of the consumer’s price. The retailer’s costs and margins were Rs 109 and Rs 221 per qtl
which were 11 per cent and 22 per cent of the consumer’s purchase price respectively. It may be
stated that producer’s sale price was high (Rs 670 per qtl) in supply chain II in

466
Table 18: Price Spread of brinjal in Jalandhar market, July 2009
(Supply chain II: Producer-retailer (through commission agent)-consumer)
Sr.
No. Particulars Rs per qtl
%age share in
consumer’s price
1. Producer’s sale price/ retailer’s
purchase price 670.00 67.00
2. Expenses borne by the producer 64.01 6.40
i. Grading, filling, stitching etc. 13.43 1.34
ii. Cost of packing 20.69 2.07
iii. Transportation cost 23.43 2.34
iv. Loading, unloading and wastage 6.46 0.65
3. Net price received by the farmer 605.99 60.60
4. Expenses borne by the retailer 108.68 10.87
i. Market fee @ 2 % 13.40 1.34
ii. RDF @ 2% 13.40 1.34
iii. Commission @ 5 % 33.50 3.35
iv. Miscellaneous expenses 8.27 0.83
v. Transportation cost 10.11 1.01
vi. Rent of shop/rehri 1.41 0.14
vii. Labour 2.60 0.26
viii. Loss, wastage and spoilage @ 2 % 13.40 1.34

467
ix. Packing cost 12.59 1.26
5. Margin of the retailer 221.32 22.13
6. Retailer’s sale price/ consumer’s
purchase price 1000.00 100.00
Comparison to Rs 650 per qtl in supply chain I but consumer’s purchase price of brinjal was the
same in both the supply chains. The producer’s sale price/consumer’s purchase price was Rs 900
per qtl in Apni Mandi in Jalandhar for brinjal (Table 19 and Figure 13). Both the producer’s sale
price and consumer’s purchase price was low in this supply chain as compared to supply chain I
and II. This happened due to absence of middlemen for sale and purchase of vegetables in Apni
Mandi. The expenses borne by the producer were Rs 63 per qtl for sale through supply chain III.

468
Table 19: Price Spread of brinjal in Apni Mandi of Jalandhar market, July 2009
(Supply chain III: Producer-consumer)
Sr.
No. Particulars Rs per qtl
%age share in
consumer’s price
1. Producer’s sale price 900.00 100.00
2. Expenses borne by the Producer 63.14 7.01
i. Grading, filling, stitching etc. 13.43 1.49
ii. Cost of packing 6.00 0.67
iii. Transportation cost 20.45 2.27
iv. Loading and wastage 3.25 0.36
iv. Packing cost (carry bags) 9.63 1.07
ix. Miscellaneous expenses 10.38 1.15
3. Net price received by producer 836.86 92.98
4. Consumer’s purchase price 900.00 100.00
This figure was seven per cent of the consumer’s price. The net price received by the producer
was about 93 per cent of the consumer’s price. It was significantly higher as compared to the net
price received by the producer in supply chain I and II.

469
Marketing efficiency of brinjal
The marketing efficiency of brinjal in three supply chains is shown in Table 20. The marketing
efficiency was the highest (13.25) in supply chain III as compared to 1.78 in supply chain II and
1.67 in supply chain I. The marketing efficiency of supply chain III was high on account of the
fact that no middleman was involved in this chain. The marketing efficiency in supply chain II
was high in comparison to supply chain I due to less number of intermediaries in the former.
Table 20: Marketing Efficiency of brinjal under different channels
(Rs per qtl)
Sr.
No. Particulars
Supply
chain I
Supply
chain II
Supply
chain III
i. Consumer’s purchase price 1000.00 1000.00 900.00
ii. Producer’s sale price 650.00 670.00 900.00
iii. Total marketing costs 121.93 108.68 63.14
iv. Total margins of intermediaries 228.07 221.32 -
v. Net price received by farmer 585.99 585.99 836.86
Marketing Efficiency 1.67 1.78 13.25
Price spread of okra
Table 21 and Figure 14 show the price spread of okra in Jalandhar market under supply chain I
(Producer-wholesaler (through commission agent)-retailer-consumer). The producer’s sale price
for okra was Rs 1150 per qtl which was about 70 per cent of the consumer’s purchase price (Rs
1650 per qtl). The producer’s marketing expenses were Rs 77 per qtl which were about five per

470
cent of the consumer’s price. The producer received net price of Rs 1073 per qtl, which was 65
per cent of the consumer’s purchase price. The marketing expenses of wholesaler and retailer
were Rs 120 and Rs 94 per qtl which were about seven and six per cent of the consumer’s price
respectively. The margins of the wholesaler and retailer were about seven and 11 per cent
respectively. The margin of the former was low but his volume of business was high. This
scenario was opposite in case of the retailer.
Table 21: Price spread of okra in Jalandhar market, July 2009
(Supply chain I: Producer-wholesaler (through commission agent)-retailer-
consumer)
Sr.
No. Particulars Rs per qtl
%age share in
consumer’s price
1. Producer’s sale price/
wholesaler’s purchase price 1150.00 69.70
2. Expenses borne by the producer 76.71 4.65
i. Grading, filling, stitching etc. 33.42 2.03
ii. Cost of packing 23.78 1.44
iii. Transportation cost 11.21 0.68
iv. Loading, unloading and wastage 8.30 0.50
3. Net price received by the farmer 1073.29 65.05
4. Expenses borne by the wholesaler 120.40 7.29
i. Market fee @ 2 % 23.00 1.39
ii. RDF @ 2% 23.00 1.39
iii. Commission @ 5 % 57.50 3.48

471
iv. Miscellaneous expenses 16.90 1.03
5. Margin of the wholesaler 109.60 6.63
6. Wholesaler’s sale price/
retailer’s purchase price 1380.00 83.63
7. Expenses borne by the retailer 93.83 5.69
i. Transportation cost 25.69 1.56
ii. Labour 1.32 0.08
iii. Rent of shop/rehri 0.34 0.02
iv. Packing cost 19.83 1.20
v. Loss, wastage and spoilage @ 3% 41.40 2.51
vi. Miscellaneous cost 5.25 0.32
8. Margin of the retailer 176.17 10.68
9. Retailer’s sale price/ consumer’s
purchase price 1650.00 100.00
The price spread of okra in the supply chain II (Producer-retailer (through commission agent)-
consumer) given in Table 22 and Figure 15 shows that the producer’s sale price was Rs 1180 per
qtl and the consumer’s price was Rs 1650 per qtl. The producer price formed 72 per cent of the
consumer price. The expenses borne by the producer for marketing of okra were about Rs 77 per
qtl, which was about 5 per cent of the consumer’s price. The producer’s net price was, therefore,
Rs 1103 per qtl which was 67 per cent of the consumer’s price. The retailer’s expenses were Rs
218 per qtl and margin Rs 252 per qtl, which were 13 per cent and 15 per cent of the consumer’s
price respectively.

472
Table 22: Price spread of okra in Jalandhar market, July 2009
(Supply chain II: Producer-retailer (through commission agent)-consumer)
Sr.
No. Particulars Rs per qtl
%age share in
consumer’s price
1. Producer’s sale price/ retailer’s
purchase price 1180.00 71.52
2. Expenses borne by the producer 76.71 4.65
i. Grading, filling, stitching etc. 33.42 2.03
ii. Cost of packing 23.78 1.44
iii. Transportation cost 11.21 0.68
iv. Loading, unloading and wastage 8.30 0.50
3. Net price received by the farmer 1103.29 66.87
4. Expenses borne by the retailer 218.45 13.24
i. Market fee @ 2 % 23.60 1.43
ii. RDF @ 2% 23.60 1.43
iii. Commission @ 5 % 59.00 3.58
iv. Miscellaneous expenses 18.15 1.10
v. Transportation cost 25.69 1.56
vi. Rent of shop/rehri 0.95 0.06
vii. Labour 12.07 0.73
viii. Loss, wastage and spoilage @ 3% 35.40 2.14

473
ix. Packing cost 19.99 1.21
5. Margin of the retailer 251.55 15.24
6. Retailer’s sale price/ consumer’s
purchase price 1650.00 100.00
The price spread of okra in Apni Mandi of Jalandhar market categorised as supply chain III
(Producer-consumer) presented in Table 23 and Figure 16 revealed that producer’s sale
price/consumer’s purchase price was Rs 1000 per qtl while his marketing expenses were about
Rs 74 per qtl. The net price received by the producer was, therefore, Rs 926 per qtl, which
constituted about 93 per cent of the consumer price. Like other vegetables, the producer’s share
was significantly higher than other supply chains in case of okra also in supply chain III where
no middleman was involved.
Table 23: Price spread of okra in Apni Mandi of Jalandhar market, July 2009
(Supply chain III: Producer-consumer)
Sr.
No. Particulars Rs per qtl
%age share in
consumer’s price
1. Producer’s sale price 1000.00 100.00
2. Expenses borne by the Producer 73.70 7.37
i. Grading, filling, stitching etc. 33.42 3.34
ii. Cost of packing 5.42 0.54
iii. Transportation cost 10.00 1.00
iv. Loading and wastage 5.03 0.50
iv. Packing cost (carry bags) 16.83 1.68

474
ix. Miscellaneous expenses 3.00 0.30
3. Net price received by producer 926.30 92.63
4. Consumer’s purchase price 1000.00 100.00
Marketing efficiency of okra
The marketing efficiency of okra under different supply chains is presented in Table 24. The
supply chain III was found to be the most efficient one because the marketing efficiency was
12.56, while it was 2.35 in supply chain II and 2.15 in supply chain I. The marketing efficiency
in supply chain II was high as compared to supply chain I due to less number of intermediaries in
the former supply chain.
Table 24: Marketing efficiency of okra under different channels
(Rs per qtl)
Sr.
No. Particulars
Supply
chain I
Supply
chain II
Supply
chain III
i. Consumer’s purchase price 1150.00 1180.00 1000.00
ii. Producer’s sale price 1650.00 1650.00 1000.00
iii. Total marketing costs 214.23 218.45 73.70
iv. Total margins of intermediaries 285.77 251.55 -
v. Net price received by farmer 1073.29 1103.29 926.30
Marketing efficiency 2.15 2.35 12.56

475
2.4 Factors affecting marketing efficiency
The functional analysis of the factors affecting the marketing efficiency of different vegetables is
shown in Table 25. The crop-wise details are as follows.
Potato
In case of potato, market margins and costs were the major explanatory variables significantly
affecting the marketing efficiency. It infers that with one percent increase in marketing margin
and cost, the resultant marketing efficiency declined by 0.61 and 0.37 percent respectively. The
impact of costs in reducing marketing efficiency was smaller than that of margins. The
coefficients of other explanatory variables such as transportation and labour costs were also
significantly negatively related with marketing efficiency. However, the coefficient of volume of
the produce handled was negative but non significant. On the contrary, the coefficient of net
price received was significantly and positively related with marketing efficiency which infers
that with one percent increase in the net price received, the marketing efficiency increased by
0.98 per cent.
Tomato
In case of tomato, the coefficients of marketing margins and costs were significantly and
negatively related with the marketing efficiency. The coefficient indicated that one percent
increase in these variables resulted into fall in the marketing efficiency by 0.69 percent and 0.38
percent respectively. Transportation and labour costs were also significantly and negatively
influencing the marketing efficiency in tomato. The net price received by the farmers was
efficiency enhancing while volume of the produce handled was non-significant and thus did not
affect efficiency. One percent increase in net price received was found to increase the marketing
efficiency by 1.10 per cent.

476
Table 25: Regression coefficients of Cobb-Douglas type functions for different
Vegetables of the selected farmers
Particulars Potato Tomato Green peas Brinjal Okra
Intercept
-0.3735
(0.0784)
-0.6798
(0.3465)
-0.9358
(0.1444)
-1.9838
(0.1928)
-0.9469
(0.1313)
Marketing costs (Rs)
-0.3703*
(0.0102)
-0.3814*
(0.0088)
-0.4467*
(0.0103)
-0.3274*
(0.0175)
-0.3752*
(0.0132)
Transportation costs
(Rs)
-0.1021*
(0.0044)
-0.0671*
(0.0121)
-0.0780*
(0.0019)
-0.0920*
(0.0076)
-0.0650*
(0.0022)
Labour charges (Rs)
-0.0609*
(0.0118)
-0.0607*
(0.0098)
-0.0325*
(0.0059)
-0.0655*
(0.0096)
-0.0465*
(0.0027)
Marketing margins
(Rs)
-0.6100*
(0.0073)
-0.6972*
(0.0148)
-0.4554*
(0.0236)
-0.5778*
(0.0122)
-0.5442*
(0.0054)
Volume of the
produce handled
(Kg)
-0.0017
(0.0051)
0.0058
(0.0066)
-0.0005
(0.0027)
-0.0077
(0.0068)
0.0015
(0.0014)
Net price received
(Rs)
0.9878*
(0.0078)
1.1036*
(0.0549)
0.9947*
(0.0062)
1.1874*
(0.0293)
1.0095*
(0.0165)
Adjusted coefficient
of multiple
determination (R2)
0.9951 0.9913 0.9965 0.9923 0.9965
Figures in parentheses are standard errors of regression coefficients
* indicate significance 1 percent level of significance

477
Green peas
In case of green peas, market margins and costs were the major explanatory variables
significantly affecting the marketing efficiency. It infers that with one percent increase in these
variables the resultant marketing efficiency declined by 0.45 and 0.44 percent respectively.
These coefficients were significant at one percent level of significance. The coefficients of other
explanatory variables such as transportation costs, labour costs and volume of the produce
handled were negatively related with dependent variable but the coefficient of latter one was
non-significant. On the other hand, the coefficient of net price received was significantly and
positively related with marketing efficiency which infers that with one percent increase in the net
price received, the marketing efficiency increased by 0.99 percent.
Brinjal
In case of brinjal, the various explanatory variables included in the model were significantly
affecting the marketing efficiency. The coefficients of market margins and costs were
significantly negatively related with the dependent variable. It can be inferred that with one
percent increase in these variables, the marketing efficiency declined by 0.57 percent and 0.32
percent respectively. The coefficients were significant at one percent level of significance.
Besides this, the coefficients of other explanatory variables such as transportation and labour
costs were significantly and negatively related with dependent variable. The coefficient of net
price received was positively and volume of the produce handled was negatively related.
However, the former was significant at one percent level of significance. It can be inferred that
with one percent increase in net price received, the resultant marketing efficiency increased by
1.18 percent.
Okra
In case of okra, the various explanatory variables included in the model were significantly
affecting the marketing efficiency. The coefficients of market margins and costs were
significantly negatively related with the dependent variable. It can be inferred that with one
percent increase in these variables, the marketing efficiency declined by 0.54 percent and 0.37
percent respectively. These coefficients were significant at one percent level of significance.
Besides this, the coefficients of other explanatory variables such as transportation and labour

478
costs were significantly and negatively related with dependent variable. The coefficient of net
price received and volume of the produce handled were positively related. However, the former
was significant. Thus, with one percent increase in net price received, the resultant marketing
efficiency increased by one per cent.
2.5 Production and marketing constraints as perceived by the selected farmers
The production and marketing constraints as perceived by the selected farmers for different
vegetables are discussed as under:
Potato
According to Garrett’s ranking technique, the major constraint in case of potato was high cost of
agro-chemicals like insecticides, pesticides and fungicides (Table 26). It may be stated that
potato can have attack of 90 different types of viral, fungal and bacterial diseases. Potato is quite
susceptible to the attack of diseases and insect pests. Therefore, the high cost of insecticides,
pesticides and fungicides was reported by the selected farmers as their major constraint. The next
most important constraint faced by the farmers was high transportation cost followed by
malpractices in the market, inadequate market infrastructure, high margins of middlemen, high
marketing cost and fluctuations in price. It must be noted that price risk was not as important for
potato growers as other constraints such as incidence of diseases and insect-pests and marketing
inefficiencies.
Table 26: Production and marketing constraints of potato as perceived by the selected
farmers.
Sr.
No. Particulars
Ranking according to
Garrett’s technique
1. High cost of insecticides, pesticides and
fungicides 1
2. High transportation cost 2
3. Malpractices in the market 3

479
4. Inadequate market infrastructure 4
5. High margins of middlemen 5
6. High marketing cost of the grower 6
7. Fluctuations in price 7
Tomato
Fluctuations in prices were the most important constraint for tomato producers inhibiting
expansion of its production in the state (Table 27). Tomato is a highly perishable vegetable and
price determination occurs on the basis of forces of demand and supply. The tomato production
has picked up in the state in late 1980’s and early 1990’s due to entry of Pepsi in processing of
tomato encouraging contract farming in tomato. But closure of Pepsi tomato processing plant
discouraged tomato production in the state. The next constraint was non-availability of packing
material followed by lack of procurement, malpractices in the market and transportation
problem. Degree of perishability was very high in tomato and a transportation loss in traditional
transport facilities (tractor trolleys) was very high.
Table 27: Production and marketing constraints of tomato as perceived by the
selected farmers.
Sr.
No. Particulars
Ranking according to
Garrett’s technique
1. Fluctuations in price 1
2. Non-availability of packing material 2
3. Lack of procurement 3
4. Malpractices in the market 4
5. Transportation problem 5

480
Green peas
The major constraint as perceived by the selected farmers was high cost of labour in case of
green peas as picking of green peas requires a lot of labour and higher wage rates in the state
cause high labour cost for peas (Table 28). The next constraint was high marketing cost, high
transportation cost, malpractices in market, un remunerative price, exploitation by the
commission agents and fluctuation in the price in green peas.
Table 28: Production and marketing constraints of green peas as perceived by the selected
farmers.
Sr.
No. Particulars
Ranking according to
Garrett’s technique
1. High cost of labour 1
2. High marketing cost 2
3. High transportation cost 3
4. Malpractices in the market 4
5. Un remunerative price 5
6. Exploitation by commission agents 6
7. Fluctuations in price 7

481
Brinjal
Brinjal is also highly vulnerable vegetable to the attack of insect-pests and diseases and
therefore, requires heavy dosage of agro-chemicals. Lack of awareness in using the right agro-
chemicals for their control and higher expenditure on their use were thus the major constraints in
the cultivation of brinjal faced by the farmers (Table 29). According to the Garret’s technique,
the number one constraint as perceived by the selected farmers was non-availability of
insecticides, pesticides and seedlings followed by high cost on insecticides and pesticides. High
transportation
Table 29: Production and marketing constraints of brinjal as perceived by the selected
farmers.
Sr.
No. Particulars
Ranking
according to
Garrett’s
technique
1. Non availability of insecticides, pesticides and
seedlings 1
2. High cost of insecticides/pesticides 2
3. High transportation cost 3
4. Inadequate facilities in the markets 4
5. High margins of middlemen 5
6. Un remunerative price 6
7. Fluctuations in price 7
cost, inadequate facilities in the market, high margins of the middlemen and un remunerative
price were the other important constraint in the production and marketing of brinjal.

482
Okra
The most important constraint as perceived by the selected farmers in case of okra was high cost
of insecticides and pesticides because large numbers of sprays are done to protect crop from
insect-pests and diseases (Table 30). The other constraints (rank-wise) were: inadequate facilities
in the market, high transportation cost, high marketing cost of farmers, high margins of the
middlemen, payment of commission to the commission agents, un remunerative price,
malpractices in the market and fluctuation in the prices.
Table 30: Production and marketing constraints of okra as perceived by the selected
farmers.
Sr.
No. Particulars
Ranking
according to
Garrett’s
technique
1. High cost of insecticides and pesticides 1
2. Inadequate facilities in the markets 2
3. High transportation cost 3
4. High marketing cost 4
5. High margins of middlemen 5
6. Payment of commission to the commission agent 6
7. Un remunerative price 7
8. Malpractices in the market 8
9. Fluctuations in price 9

483
2.6 Marketing constraints as perceived by the selected farmers in Apni Mandi
The major constraints as perceived by the selected farmers were non-availability of drinking
water in the Apni Mandi (Table 31). It is common observation of the researchers of the present
study that farmers in the Apni Mandi have to make payment for the supply of drinking water.
The vendors supply drinking water to the farmers there but they charge for this service although
not at par with price of bottle of mineral water. This constraint becomes more severe particularly
in the months of May and June every year. The next important constraint was unhygienic
conditions in
Table 31: Marketing constraints as perceived by the selected farmers in the Apni Mandi
Sr.
No. Particulars
Ranks according to
Garrett’s technique
1. Non-availability of drinking water 1
2. Unhygienic conditions in the markets 2
3. Inadequate market infrastructure 3
4. Frequent change in site for the farmer 4
5. Dominance of traditional retailers 5
6. Not Apni Mandi in the real sense 6
the market, inadequate market infrastructure, frequent change in site for the farmers, dominance
of traditional retailers and not Apni Mandi in the real sense. It has been observed that large
number of vendors come to the Apni Mandi for the sale of grocery items, plastic goods, ready-
made garments, cosmetics, eatables particularly snacks, cold drinks, ice-cream, etc. Such a
congested scenario in Apni Mandi creates traffic problems for the general public and loss of
business for the framers.

484
2.7 Constraints as perceived by the selected wholesalers in the market
The wholesalers highlighted the non-availability of drinking water as the number one constraint
in the wholesale vegetable markets (Table 32). The next constraint was unhygienic conditions in
the market followed by inadequate market
Table 32: Constraints as perceived by the selected wholesalers in the market
Sr.
No. Particulars
Ranks according to
Garrett’s technique
1. Non-availability of drinking water 1
2. Unhygienic conditions in the markets 2
3. Inadequate market infrastructure 3
4. Non-availability of cold stores in the markets 4
infrastructure and non-availability of cold stores in the markets. It may be stated that unhygienic
conditions in the markets become more severe in rainy season i.e. in the months of July and
August every year.

485
3. Summary and conclusions
Five important vegetables are studies in the study. These are potato, tomato, green peas, brinjal
and okra. Only those districts were purposively selected for the study, where there was
considerable area under particular crop. The convenience sampling technique was used for
selection of different types of respondents in the study. For each vegetable, the sample consisted
of 120 farmers except 93 for brinjal. Further, for each vegetable, 30 wholesalers, 30 retailers and
30 farmers from Apni Mandi were selected. Thus, the total sample consisted of 573 farmers, 150
wholesalers, 150 retailers and 150 farmers from Apni Mandi. For the present study, the total
number of all types of respondents was 1023. The personal interview method was used for
collection of data from the respondents.
The total area under vegetables was 2.20 per cent of the total cropped area during the year 2007-
08. Among different vegetable crops, potato was the dominant one having one per cent share in
the cropped area. The major reason for more area under potato was its semi-perishable nature as
compared to other vegetables which are perishable. Besides, the cold storage facilities are
available for potato in the state. The district-wise area under vegetables indicate that Jalandhar,
Hoshiarpur, S.B.S. Nagar, Kapurthala and SAS Nagar were the major vegetable producing
districts during the year 2007-08. The production of potato was 20.14 lakh tonnes during the year
2008-09. This figure was 1489, 1120, 468 and 193 hundred tonnes for tomato, green peas, brinjal
and okra respectively in the same year.
The price spread of potato in supply chain I in Jalandhar market brought out that the net price
received by the producer was Rs 434 per qtl which was about 58 per cent of the consumer’s
price. The expenses borne by the wholesaler and retailer were about Rs 58 and Rs 52 per qtl
respectively which were about 8 and 7 per cent of the consumer’s price (Rs 750 per qtl). The
margin of the wholesaler was about 6 per cent whereas this figure was about 13 per cent in
case of retailer. The margin of the wholesaler was less on account of high volume of business
as compared to retailer who handles low volume of business. The price spread of potato in
supply chain II in Jalandhar market revealed that the net price received by the producer was
about Rs 454 per qtl which was 61 per cent of the consumer’s purchase price. The expenses
and margins of the retailer were 15 per cent and 16 per cent respectively of the consumer’s
purchase price. The margin of the retailer was high in supply chain II as compared to the
supply chain I because the wholesaler was not there in the latter. There is direct sale of the

486
produce by the producer to the consumer in the Apni Mandi. The study indicated that
producer’s sale price/consumer’s purchase price was Rs 700 per qtl in Apni Mandi of
Jalandhar market. The expenses borne by the producer were Rs 52 per qtl which were 7.45 per
cent of the consumer’s price. The net price received by the producer was 93 per cent of the
consumer’s price. As compared to the supply chain I and II, the producer’s share in supply
chain III was more on account of direct sale by the producer to the consumer. The supply chain
III was the most efficient one because marketing efficiency was 12.42 in this chain as
compared to 1.97 in supply chain II
and 1.74 in supply chain I. The low marketing efficiency in supply chain I was on account of
more number of market intermediaries in this chain.
The study brought out that the net price received by the producer was about Rs 554 per qtl which
in percentage terms was about 46 per cent of the consumer’s purchase price in supply chain I in
Kapurthala market. The expenses borne by the wholesaler and retailer were Rs 68 and Rs 84 per
qtl. These respective expenses were about 6 and 7 per cent of the consumer’s purchase price. The
margin of the wholesaler and retailer was 11 per cent and 26 per cent of the purchase price of
consumer. The producer’s net price received was Rs 579 per qtl in supply chain II. This was
about 48 per cent of the consumer’s purchase price. The expenses and margins of the retailer
were about 12 per cent and 36 per cent of the consumer’s price. The retailer’s margins was
comparatively less in supply chain I as compared to supply chain II. For sale of tomato in supply
chain III (Apni Mandi), the net price received by the producer was Rs 1024 per qtl which was 93
per cent of the consumer’s purchase price. The marketing efficiency in supply chain III was
13.42 as against 1.01 in supply chain II and 0.92 in supply chain I. The marketing efficiency in
supply chain III was high on account of the fact that no middleman was involved and produce
was directly sold to consumers. As compared to supply chain I, the marketing efficiency of
tomato was marginally high in supply chain II due to less number of the intermediaries in the
latter.
The price spread of green peas in Hoshiarpur market in supply chain I revealed that the net price
received by the producer was Rs 833 per qtl which was about 67 per cent of the consumer’s
price. The expenses borne by the wholesaler and retailer were 7.52 and 7.36 per cent respectively
of the consumer’s purchase price (Rs 1250 per qtl). Their respective margins were 4.48 per cent
and 8.64 per cent of the consumer’s price. In supply chain II, the producer received a net price of

487
Rs 863 per qtl which was 69 per cent of the consumer’s purchase price. The expense and margins
of the retailer were about 14 per cent and 12 per cent respectively of the consumer’s price. For
sale of green peas in Apni Mandi (supply chain III), the producer’s sale price/consumer’s
purchase price was Rs 1100 per qtl. The producer’s expenses were Rs 69 per qtl which were 6.32
per cent of the consumer’s purchase price. The producer realised higher price in supply chain III
as compared to the supply chain II and I. Similarly, the consumer benefitted in supply chain III
as his purchase price was lower in comparison to his price in the latter two supply chains.
Therefore, both the producer as well as consumer was the gainers in Apni Mandi. The marketing
efficiency of green peas in supply chain III was most efficient one because the value of the
marketing efficiency was 14.83 as against 2.70 in supply chain II and 2.38 in supply chain I. The
marketing efficiency in supply chain II was high as compared to supply chain I because the
number of the intermediaries was less in the former.
The price spread of brinjal in Jalandhar in supply chain I brought out that the net price received
by the producer was Rs 586 per qtl which was 59 per cent of the consumer’s price. The expenses
borne by the wholesaler and retailer were 8 per cent and 5 per cent of the consumer’s price. Their
respective margins were about 10 per cent and 13 per cent. As in case of other vegetables, the
margins of the retailer were high in case of brinjal too on account of low volume of business in
comparison to the wholesaler. In supply chain II, the producer’s net price was Rs 586 per qtl
which was 59 per cent of the consumer’s purchase price (Rs 1000 per qtl). The retailer’s costs
and margins were 11 per cent and 22 per cent of the consumer’s purchase price respectively.
Producer’s sale price/consumer’s purchase price was Rs 900 per qtl in Apni Mandi (supply chain
III). Both the producer’s sale price and consumer’s purchase price was low in this supply chain
as compared to supply chain I and II. This happened due to the non-presence of middlemen for
sale and purchase of vegetables in Apni Mandi. The net price received by producer was about 93
per cent of the consumer’s price. It was significantly higher as compared to the net price received
by the producer in supply chain I and II. The marketing efficiency was the highest (13.25) in
supply chain III as compared to 1.78 in supply chain II and 1.67 in supply chain I. The marketing
efficiency of supply chain III was high on account of the fact that no middleman was involved in
this chain. The marketing efficiency in supply chain II was high in comparison to supply chain I
due to less number of intermediaries in the former.

488
The study revealed that producer received net price of Rs 1073 per qtl, which was 65 per cent of
the consumer’s purchase price of okra in Jalandhar market (supply chain I). The marketing
expenses of the wholesaler and retailer were about seven and six per cent of the consumer’s price
respectively. Their respective margins were about seven and 11 per cent respectively. The
margin of the former was low but his volume of business was high. This scenario was opposite in
case of the retailer. In supply chain II, the producer’s net price was Rs 1103 per qtl which was 67
per cent of the consumer’s price. The retailer’s expenses were Rs 218 per qtl and margin Rs 252
per qtl, which were 13 per cent and 15 per cent of the consumer’s price respectively. The net
price received by the producer was Rs 926 per qtl which constituted about 93 per cent of the
consumer price. Like other vegetables, the producer’s share was significantly higher than other
supply chains in case of okra in supply chain III where no middleman was involved. The
marketing efficiency of supply chain III was found to be most efficient one because the
marketing efficiency was 12.56 where it was 2.35 in supply chain II and 2.15 in supply chain I.
The marketing efficiency in supply chain II was high as compared to supply chain I due to less
number of intermediaries in the former supply chain.
The functional analysis of the factors affecting the marketing efficiency revealed that market
margins and costs were the major explanatory variables significantly affecting the marketing
efficiency of potato. It was inferred that with one per cent increase in marketing margins and
costs, the marketing efficiency declined by 0.61 and 0.37 per cent respectively. The impact of
cost in reducing marketing efficiency was smaller than that of margins. The coefficient of net
price received was positively and significantly related with marketing efficiency. It was inferred
that marketing efficiency increased by 0.98 per cent with one per cent increase in the net price
received. In case of tomato, marketing margins and costs were negatively and significantly
related with the marketing efficiency. Thus, with one per cent increase in these variables, the
resultant marketing efficiency declined by 0.69 and 0.38 per cent respectively. The coefficient of
net price received was positively related with the marketing efficiency, thereby increasing it by
1.10 per cent.
The marketing margins and costs were the major explanatory variables affecting marketing
efficiency of green peas. It inferred that with one per cent increase in these variables, the
marketing efficiency declined by 0.45 and 0.44 per cent respectively. Only net price received
was positively and significantly related variable which resulted in increase in marketing

489
efficiency by 0.99 per cent. In brinjal too, marketing margins and costs were the major variables
affecting the marketing efficiency of the crop. It was inferred that with one per cent increase in
these variables, the marketing efficiency declined by 0.57 and 0.32 per cent respectively. The
coefficient of net price received was positively and significantly related variable which resulted
in increase in marketing efficiency by 1.18 per cent. The marketing margins and costs were the
variables significantly affecting marketing efficiency of okra. It inferred that with one per cent
increase in these variables, the marketing efficiency declined by 0.54 and 0.37 per cent
respectively. The coefficient of net price received by positively related with marketing
efficiency. It showed that with one per cent increase in the net price, the marketing efficiency
also increased by one per cent.
According to Garret’s ranking technique, the major production and marketing constraints in case
of potato was high cost of agro-chemicals like insecticides, pesticides and fungicides. The next
most important constraint faced by the farmers was high transportation cost followed by
malpractices in the market, inadequate market infrastructure, and high margin of middlemen,
high marketing cost and fluctuations in price. Fluctuations in prices were the most important
constraint for tomato producers inhibiting expansion of its production in the state. The next
constraint was non-availability of packaging material followed by lack of procurement,
malpractices in the market and transportation problem. The major constraint as perceived by the
selected farmers was high cost of labour in case of green peas as picking of the green peas
require a lot of labour and higher wage rates in the state cause higher labour cost for peas. The
next constraint was high marketing cost, high transportation cost, malpractices in the market,
unremunerative price, and exploitation by the commission agents and fluctuations in the price of
green peas.
Brinjal is also highly vulnerable vegetable to the attack of insect-pests and diseases and
therefore, requires heavy dosage of agro-chemicals. Lack of awareness in using the right agro-
chemical for their control and higher expenditure on their use were thus the major constraints in
the cultivation of brinjal faced by the farmers. According to the Garret’s technique, the number
one constraint as perceived by the selected farmers was non-availability of insecticides,
pesticides and seedlings followed by high cost on insecticides and pesticides. High transportation
cost, inadequate facilities in the market, high margins of the middlemen and unremunerative
price were the other important constraints in the production and marketing of brinjal. The most

490
important constraint as perceived by the selected farmers in case of okra was high cost of
insecticides and pesticides because large numbers of sprays are done to protect the crop from
insect-pests and diseases. The other constraint (rank-wise) were: inadequate facilities in the
market, high transportation cost, high marketing cost of farmers, high margins of middlemen, un
remunerative price, malpractices in the market and fluctuations in the prices.
The major constraint as perceived by the selected farmers was non-availability of drinking water
in the Apni Mandi. The next important constraint was unhygienic conditions in the market,
inadequate market infrastructure, frequent change in the site of the farmers, dominance of the
traditional retailers and not Apni Mandi in the real sense. The wholesalers highlighted the non-
availability of the drinking water as the number one constraint in the wholesale vegetable
markets. The next constraint was unhygienic conditions in the market followed by the inadequate
market infrastructure and non-availability of cold stores in the markets. The unhygienic
conditions in the market become more severe in rainy season, i.e. the months of July and August
every year.
4. Suggestions to improve marketing efficiency
The high transportation has emerged as one of the major marketing constraints of the vegetable
farmers. It is suggested that vegetable farmers may form informal cooperatives/ groups. As a
large group, their per unit transportation will definitely come down. This will encourage
vegetable cultivation in the state. There are various malpractices in the markets. The enforcement
of Punjab Agriculture Produce Markets Act, 1961 and various other amendments made in this regard
may be made more effective at ground level. In the era of liberalization, privatisation and globalisation
(LPG), the existing market infrastructure is not up to the mark. A lot of efforts are required in this
direction. It is a known fact that state government and Punjab Mandi Board alone can not build modern
market infrastructure of the international standard. Therefore, the modern market infrastructure may be
built up with the public-private partnership to bring efficiency in the marketing of vegetables.
The study revealed that there was no sale of vegetables in the distant markets by the selected farmers
except in case of potato. The farmers may prefer cooperative/group marketing for sale of vegetables in the
distant markets like Delhi. The distance of Delhi from Punjab is not too long. This distance from
Amritsar, Jalandhar and Ludhiana is about 450, 375 and 325 km respectively. At present, the population
of Delhi is about 160 lakh having large consumption of vegetables. Besides, Delhi has become a big

491
distribution market of vegetables for the states like Uttar Pradesh, Haryana, Rajasthan, Himachal Pradesh,
Jammu and Kashmir, Punjab, Uttrakhand, Madhya Pradesh, Chandigarh, etc. The returns of the vegetable
growers will definitely increase from sale in a big consuming market like Delhi.
The Apni Mandi was introduced in Punjab in February, 1987. During the last more than 23 years, the
concerned market committee could not make the arrangement of drinking water in these markets. The
existing infrastructure in Apni Mandi is inadequate. A large number of vegetable vendors are also there. It
does not look like Apni Mandi in the real sense. The concerned market committee must ensure that only a
genuine vegetable grower should do their business in the Apni Mandi. The identity cards should be issued
to the genuine vegetable growers by the concerned market committee. It will enhance marketing
efficiency in the Apni Mandi. All these suggestions will definitely bring improvement in the marketing
efficiency of vegetables in the state.
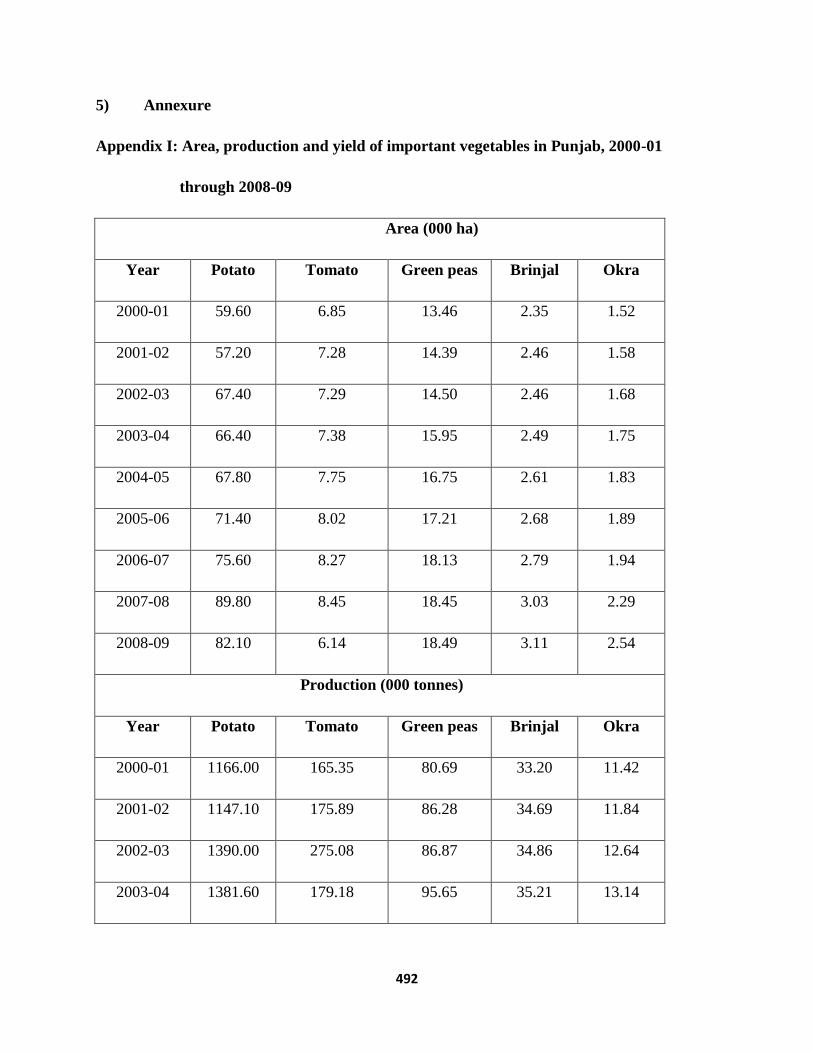
492
5) Annexure
Appendix I: Area, production and yield of important vegetables in Punjab, 2000-01
through 2008-09
Area (000 ha)
Year Potato Tomato Green peas Brinjal Okra
2000-01 59.60 6.85 13.46 2.35 1.52
2001-02 57.20 7.28 14.39 2.46 1.58
2002-03 67.40 7.29 14.50 2.46 1.68
2003-04 66.40 7.38 15.95 2.49 1.75
2004-05 67.80 7.75 16.75 2.61 1.83
2005-06 71.40 8.02 17.21 2.68 1.89
2006-07 75.60 8.27 18.13 2.79 1.94
2007-08 89.80 8.45 18.45 3.03 2.29
2008-09 82.10 6.14 18.49 3.11 2.54
Production (000 tonnes)
Year Potato Tomato Green peas Brinjal Okra
2000-01 1166.00 165.35 80.69 33.20 11.42
2001-02 1147.10 175.89 86.28 34.69 11.84
2002-03 1390.00 275.08 86.87 34.86 12.64
2003-04 1381.60 179.18 95.65 35.21 13.14

493
2004-05 1400.40 187.31 100.51 37.00 13.79
2005-06 1164.60 193.85 103.33 37.96 14.28
2006-07 1352.60 153.58 108.97 41.25 14.61
2007-08 1713.80 202.31 110.98 44.79 17.30
2008-09 2013.50 148.86 111.96 46.79 19.27
Yield ( qtls per ha)
Year Potato Tomato Green peas Brinjal Okra
2000-01 195.63 241.39 59.95 141.28 75.12
2001-02 200.55 241.61 59.98 141.32 75.17
2002-03 205.72 240.29 59.91 141.70 75.24
2003-04 200.23 242.64 59.96 141.78 75.28
2004-05 201.80 242.31 60.01 141.83 73.27
2005-06 163.11 241.70 60.41 141.92 75.33
2006-07 170.30 185.70 60.09 147.86 75.13
2007-08 186.97 239.45 60.14 147.83 75.72
2008-09 246.80 242.60 60.56 150.39 75.94
Source i) : Statistical Abstract of Punjab, various issues
ii): Department of Horticulture, Punjab, Chandigarh

494
15.33 0.55 2.54 2.68 1.04
84.67
99.45 97.46 97.32 98.96
0
20
40
60
80
100
120
Potato Tomato Green peas Brinjal Okra
Per
cen
tage
Marketed surplus of vegetables
Figure1

495
58%
5%
13%
9%
8%
7%
Potato: Margins and costs in supply chain I
Net price received by the farmer
Margin of the wholesaler
Margin of the retailer
Expenses borne by the producer
Expenses borne by the wholesaler
Expenses borne by the retailer
Figure 2
60% 16%
9%
15%
Potato: Margins and costs in supply chain II: Producer-retailer (through
commission agent)-consumer
Net price received by the farmer
Margin of the retailer
Expenses borne by the producer
Expenses borne by the retailer
Figure 3

496
93%
7%
Potato: Margins and costs in supply chain III
Net price received by the farmer
Expenses borne by the producer
Figure4
46%
11%
26%
4% 6%
7%
Tomato: Margins and costs in Supply chain I
Net price received by the farmer
Margin of the wholesaler
Margin of the retailer
Expenses borne by the producer
Expenses borne by the wholesaler
Expenses borne by the retailer
Figure 5

497
48%
36%
4%
12%
Tomato: Margins and costs in Supply chain II: Producer-retailer
(through commission agent)-consumer
Net price received by thefarmer
Margin of the retailer
Expenses borne by the producer
Expenses borne by the retailer
Figure 6
93%
7%
Toamto: Margins and costs in Supply chain III
Net price received by the farmer
Expenses borne by the producer
Figure 7
67% 4%
9%
5%
8%
7%
Green peas: Margins and costs in Supply chain I
Net price received by the farmer
Margin of the wholesaler
Margin of the retailer
Expenses borne by the producer
Expenses borne by the wholesaler
Expenses borne by the retailer
Figure 8

498
69%
12%
5%
14%
Green peas: Margins and costs in Supply chain II: Producer-retailer
(through commission agent)-consumer
Net price received by the farmer
Margin of the retailer
Expenses borne by the producer
Expenses borne by the retailer
Figure 9
94%
6%
Green peas: Margins and costs in Supply chain III
Net price received by the farmer
Expenses borne by the producer
Figure 10
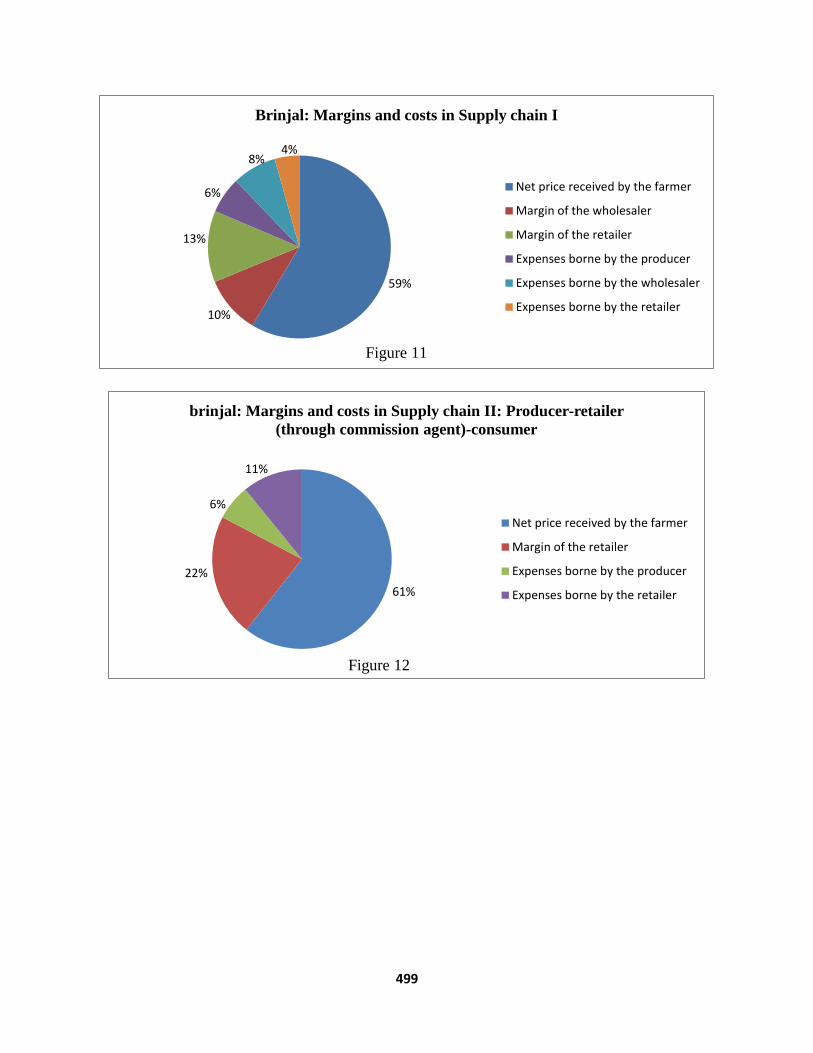
499
59%
10%
13%
6%
8% 4%
Brinjal: Margins and costs in Supply chain I
Net price received by the farmer
Margin of the wholesaler
Margin of the retailer
Expenses borne by the producer
Expenses borne by the wholesaler
Expenses borne by the retailer
Figure 11
61%
22%
6%
11%
brinjal: Margins and costs in Supply chain II: Producer-retailer
(through commission agent)-consumer
Net price received by the farmer
Margin of the retailer
Expenses borne by the producer
Expenses borne by the retailer
Figure 12

500
93%
7%
Brinjal: Margins and costs in Supply chain III
Net price received by the farmer
Expenses borne by the producer
Figure 13
65% 6%
11%
5%
7% 6%
Okra: margins and costs in Supply chain I
Net price received by the farmer
Margin of the wholesaler
Margin of the retailer
Expenses borne by the producer
Expenses borne by the wholesaler
Expenses borne by the retailer
Figure 14

501
67%
15%
5%
13%
Okra: Margins and costs in Supply chain II: Producer-retailer
(through commission agent)-consumer
Net price received by the farmer
Margin of the retailer
Expenses borne by the producer
Expenses borne by the retailer
Figure 15
93%
7%
Okra: Margins and costs in Supply chain III
Net price received by the farmer
Expenses borne by the producer
Figure16

502
6) References
Government of Punjab, Statistical Abstract- Various issues
Shergill, H.S. (1998), Rural credit and indebtedness in Punjab, Monograph
Series-IV, Institute for Development and Communication, Chandigarh,
pp 1-95.
Shergill, H.S. (2010), Growth of farm debt in Punjab- 1997 to 2008, Institute for
Development and Communication, Chandigarh, pp 1-92.

503
Estimating Marketing Efficiency of Vegetables in Andhra Pradesh
Bibliography
Annual reports of Horticultural mission of Andhrapradesh from 2005 to 2008
Seasonal and crop reports – (2007-08) Published by Directorate of Economics
and statistics
Annual reports of Horticultural university (2007-08)
India stat.com
Garratt (1969) Statistics in psychology education .
Aphorticulte.com
Annual report of Maize research center for the year 2007-08 Prepared by Maize Research
station.
Annual report of Kothapet Fruit Market for the year 2008-09.
504
Estimating Marketing Efficiency of Vegetables in Tamil Nadu
Bibliography
Action Plan for Tamil Nadu National Horticulture Mission Prepared by Rabo India Finance
Pvt. Ltd for Ministry of Agriculture Government of India September 2005
Birari K.S., D.S. Navadkar and J.T. Dorge “Marketing Efficiency of Cole Vegetables in
Western Maharashtra” Agricultural Marketing VOL.-XLVII, No.:3 pp23-28
Chennai, Martketing of Fruits and Vegetables in and Around Chennai, Research Study
No.130, Agro Economic Research Centre, University of madras, 2002-03,
Coimbatore -3 August, 2006
Farmers’ Market in Tamil Nadu – An Assessment of Current Performance and Potentials for
Future Expansion, Research report of the Department of Agricultural Economics
Tamil Nadu Agricultural University
Gangwar L.S., Dinesh Singh and D.B. Singh “Estimation of Post-Harvest Losses in Kinnow
Mandarin in Punjab Using a Modified Formula” Agricultural Economics Research
Review July-December 2007 Vol. 20 pp 315-331
Kusum Jain, Umesh Kumar Sharma, R. S. Kadian, R. K. Malik and S.L. Bhella. 2008. Direct
Marketing. Technical Bulletin (27), Directorate of Extension Education, CCS
Haryana Agricultural University, Hisar, India.
Rengasamy S, J Devavaram, T Marirajan, N Ramavel, K Rajadurai, M Karunanidhi, N
Rajendra Prasad and A Erskine “Farmers’ markets in Tamil Nadu: increasing options
for rural producers, improving access for urban consumers” Environment and
Urbanization 2003; 15; 25
Season and Crop Report, Department of Economics and Statistics,Government of Tamil
Nadu, 2005-06
Shamsher Singh and S.K. Chauhan “Marketing of Vegetables in Himachal Pradesh”
Agricultural Marketing VOL.-XLVII, No.:3 pp5-10
Srinivas T., M.Anantharaman Cassava Marketing System in India, Technical Bulletin Series:
43 CTCRI (ICAR), Kerala, India, December, 2005

505
Sudhandhiran C, The Sago & Starch Industry Cluster Salem (Tamil Nadu), SME Diagnostic
Study developed under the Cluster Development Agent Training Programme,
Organised By Unido Cdp, New Delhi & (Edii), Ahmedabad 2001
Viswanadham N, Food and Retail Chains in India, ISAS Working Paper No. 15 –October
2006

506
Estimating Marketing Efficiency of Vegetables in West Bengal
Bibliography
Acharya, S. S. and Agrawal, N. L. (2001). Agricultural Marketing in India, Oxford &
IBH Publishing Company, New Delhi.
Agmarknet (2010 a), Directorate of Marketing & Inspection, Ministry of Agriculture, Govt.
of India, http://agmarknet.nic.in/
Agmarknet (2010 b), Salient Features of the Model Act on Agricultural Marketing,
Directorate of Marketing & Inspection, Ministry of Agriculture, Govt. of India,
http://agmarknet.nic.in/
L.S. Gangwar, L. S, Singh, Dinesh and Singh, D.B. (2007) Estimation of Post-Harvest Losses
in Kinnow Mandarin in Punjab Using a Modified Formula, Agricultural Economics
Resaerch Review, Vol 20, July-December, pp. 315-331
Dhillon, Ashok, Khatkar, R.K. and Kumar, Arun (2005) Marketing Costs and Price Spread
for Marigold Flower in Haryana, Agricultural Marketing, Vol.XLVIII, No:1, pp.9-12.
Govt. of West Bengal (2010), Department of Sundarban Affairs, Block profile, www.
http://www.sadepartmentwb.org/Profile.htm
Govt. of West Bengal, (2010b), State Agricultural Marketing Board
Indian Horticulture Database 2008, Ministry of Agriculture, Govt. of India, www.nhb.gov.in
Metro Cash & Carry India, www.metro.co.in

507
ANNEXURE
Table 24. Arrival and Modal price of Bhindi and Brinjal at Baruipur market (Canning)
during 2009-10
Months Bhindi Brinjal
Arrivals
(kg)
Modal Price
(Rs/q)
Arrivals (kg) Modal Price
(Rs/q)
May, 1 1900 1500 2800 1300
May, 15 1500 2000 2200 1300
June, 1 1500 2200 2500 1700
June, 15 1600 1300 2100 1500
July, 1 1800 1400 2300 1600
July, 15 2000 2200 2400 2200
August, 1 3800 1300 3500 1400
August, 15 3600 1100 2800 1400
September, 1 3700 1300 3000 1500
September,
15
3200 1300 4100 1400
October, 1 3700 1300 3000 1500
October, 15 3200 1300 4100 1400
Source: http://agmarknet.nic.in/

508
Table 25. Arrival and Modal price of Tomato at Baruipur market (Canning) during
2009-10
Months Arrival (q) Modal Price (Rs/q)
May, 1 3300 1100
May, 15 2200 2300
June, 1 2200 2300
June, 15 700 3800
July, 1 2100 3100
July, 15 2200 2900
August, 1 2500 3000
August, 15 2000 2800
September, 1 2800 2500
September, 15 2900 2400
October, 1 2800 2500
October, 15 2900 2400
November, 1 1800 1900
November, 15 1700 2400
December, 1 1700 3800
January, 1 7700 600
January, 15 7500 700
February, 1 6600 700
February, 15 7500 600

509
March, 1 7500 400
March, 15 2200 1300
April, 1 5000 350
April, 15 5000 500
Source: http://agmarknet.nic.in/
Table 26. Arrival and Modal price of Guava at Baruipur market (Canning) during
2009-10
Months Arrival (q) Modal Price (Rs/q)
May, 1 22 3900
May, 15 25 4100
June, 1 20 4200
June, 15 15 4300
July, 1 60 2600
July, 15 125 1600
August, 1 500 700
August, 15 1300 450
Sept, 1 1150 550
Sept, 15 725 700
October, 1 1150 550
October, 15 725 700
Nov, 1 200 900

510
Dec, 15 135 800
January, 15 16 1000
February, 15 8 1300
March, 15 2 2100
April, 1 20 2000
April, 15 15 2400
Source: http://agmarknet.nic.in/

511
Estimating Marketing Efficiency of Vegetables in Rajasthan
Bibliography
Acharya, S. S. and N.L. Agarwal (2005). Agricultural marketing in India. Oxford & IBH
Publishing Co. (P) Ltd., New Delhi.
Baba S.H., M.H. Wani, S.A. Wani and Yousuf Shahid (2010). Marketed surplus and price
spread of vegetables in Kashmir valley. Agril. Econ. Res. Rev., 23 (10): 115-128.
Dhaka and Poonia (2010). Identification of constraints encountered by the farmers in
production and marketing of vegetables in Bundi district of Rajasthan. Ind. Jour.
Agril. Mktg., 24 (1): 20-25.
Government of Rajasthan (2009) Rajasthan Horticulture Statistics, Directorate of
Horticulture, Pant Krishi Bhawan, Jaipur (Various issues)
Kaur, H. and I.P. Singh (2010). Marketing of kinnow in Sri Ganganagar district of Rajasthan
state. Ind. Jour. Agril. Mktg., 24 (1): 141-149.
Saraswat S.P., Prem Singh Dahia, and Pratap Singh (2006). Production and marketing of
peach fruit: A case study of Rajgarh area of district Sirmour in Himachal Ptradesh.
Ind. Jour. Agril. Mktg., 20 (2): 81-91.
Tripathi, A.K., Subhasis Mandal, K.K. Datta and M. R. Verma (2006). A study on marketing
of ginger in RI – BHOI district of Meghalaya. Ind. Jour. Agril. Mktg., 20 (2): 106-
116.
Singh, Ram, D.K. Bishnoi and Abhey Singh (2010). Cost benefit analysis and marketing of
mushroom in Haryana. Agril. Econ. Res. Rev., 23 (10): 115-128.

512
Data sites for NCAP study
Fruit/ Vegetable District Tehsils Hamlets/ Villages
Kinnow Sriganganagar Sriganganagar CHAK 9 Q,
CHAK 10 Q,
CHAK 11 Q,
CHAK 10 F,
CHAK 8 H (BARA),
CHAK 1 H (BARA)
MADERAN,Bakhtana,
Sangatpura,
Mirjawala, Santpur,
FATUI, 12 EE, 1 G
(BARI), 6 ZA, 1Z1, 4
Z, Chak 3 H (BARA),
8 HH, 5 ML, Netawala
Karanpur CHAK 16H, CHAK
17 H, CHAK 18 H,
CHAK 19 H, CHAK
24 H, CHAK 26 H,
CHAK 31 H, CHAK 2
U, CHAK 23 F,
CHAK 2 W, CHAK 3
“O”, CHAK 5 “U”,
CHAK 5 “O”,CHAK 2
T JODHAWALA,
CHAK 3 W, CHAK 2
M, CHAK 35 F,
CHAK 5 Z,

513
DALPATSINGHPUR,
CHAK 2 M
FUSAWALA, CHAK
5 Z
Carrot Sriganganagar Sriganganagar Sadhuwali,
Chak 2 D CHHOTI,
Chak 3 D CHHOTI,
Chak 4 D CHHoTI,
Kaluwala 1 ML,
6 LNP,
Kundalawala
Aonla Jaipur Chomu Hathnoda, Morija
Aamer Achrol, Tala, Tola
Tomato Jaipur Chomu Cheetwari, Hathnoda,
Harota, Morija
Aamer Isarwala,
Pokhiriyawala

514
Estimating Marketing Efficiency of Vegetables in Manipur
Bibliography
Acharya, S.S. and Agarwal, N.L. (1999) Agriculture Marketing in India, Oxford & IBH
publishing Co. Pvt. Ltd., New Delhi
Ashturker, B.M. and Deole, C.D. (1985) Producers’ Share in Consumers Rupee: A Case
Study of Fruit marketing in Marathwada, Indian Journal of Agricultural Economics,
40: 3
Chole, V.M., Talathi, J.M. and Naik, V.G. (2003) Price Spread in Marketing of Brinjal in
Maharashtra State, Agricultural Marketing, 45 (3):5-7
G. Sunil Kumar Babu, Sri Hari Naidu and Y. Eswara Prasad (2003) Price Spread and
Marketing of Green Chillies – A case Study in Andhra Pradesh, Agricultural
Marketing, 45 (3):21-23
Gadre, A.V., Talathi, J.M. and Wadkar, S.S. (2002) Price Spread in Marketing of White
Onion in Raigad District of Maharashtra State, Agricultural Marketing, 44 (4):22-25
Gangwari, L.S. and Singh, S. (1999) Marketing of Nagpur Mandarins: A case study of
Nagpur District of Maharashtra, Agricultural Marketing, 41 (1):18-20
Garg, J.S. and Misra, J.P. (1996). Costs and Margins in the Marketing of Vegetables in
Kanpur, Agricultural Marketing, 8:2
Gogoi, M. (1978) Marketing of Orange in Dibrugarh District – A Case Study (Unpublished
M.Sc. Thesis), Department of Agricultural Economics, AAU, Jorhat.
Goswami, S.M. (1991) Price Spread of Tomato in a Vegetable Market of Kamrup District
Assam, Agricultural Marketing, 33(4):13-16
Goswami, S.N. and Singh, S.B. (2000) Problems and Prospects of Marketing of Horticultural
Crops in North-East India, Agricultural Marketing, 42 (2):23-26
Goyal, S.K. (1999) Economics of Rose Cultivation and its marketing in Sonepat District of
Haryana State, Indian Journal of Agricultural Marketing, 13(3):44-51

515
Saikia, T.N. (1985) Price Structure of Pineapple: A Study in Meghalaya, Indian Journal of
Agricultural Economics, 40:3
Shapoo, J.A. and Banerjee, B.N. (2003) Economics of Apple Trade in Anantnag District of
Jammu and Kashmir, Agricultural Marketing, 45 (3):36-39
Singh, M. (1985) Price Spread of Vegetables Marketing, Indian Journal of Agricultural
Economics, 40:3
Singh, R. (1988) A Study of Marketing of Pineapple in Central District of Manipur
(Unpublished M.Sc. Thesis), Department of Agricultural Economics, AAU, Jorhat.
Subbanarasaiah, N. (1991) Marketing of Horticultural Crops in India, Anmol Publishing Co.,
Delhi.
ZOPAR Export Pvt. Ltd. (www.zopar.in)

516
Estimating Marketing Efficiency of Vegetables in Punjab
Bibliography
Government of Punjab, Statistical Abstract- Various issues
Shergill, H.S. (1998), Rural credit and indebtedness in Punjab, Monograph
Series-IV, Institute for Development and Communication, Chandigarh,
pp 1-95.
Shergill, H.S. (2010), Growth of farm debt in Punjab- 1997 to 2008, Institute for
Development and Communication, Chandigarh, pp 1-92.