estimation of electrolytes in human blood samples …euacademic.org/uploadarticle/1794.pdf · 650...
TRANSCRIPT

4128
ISSN 2286-4822
www.euacademic.org
EUROPEAN ACADEMIC RESEARCH
Vol. III, Issue 4/ July 2015
Impact Factor: 3.4546 (UIF)
DRJI Value: 5.9 (B+)
Estimation of Electrolytes in Human Blood Samples
with respect to Different Eating Habits
KHAYRE AMIER MOHAMED IBRAHIM
Dr. PRASHANT ANTHONY
Dr. SUSHMA
Abstract:
Humans contain about 5 liters of blood in their body. The
circulation of this blood is important for the normal functioning of all
parts. Blood contains Plasma, which in turn contains all the proteins,
glucose and other nutrients. The electrolytes play an important part in
human health. Calcium, Potassium, Sodium, Magnesium and chloride
ions have been analyzed for 50 patients of different age groups,
different eating habits and genders. Standard kit methods were used
for the analysis. Each of the blood samples were analyzed for Ca, K,
Na, Mg and Cl ions and reported in mmol/L. The comparison was
done in between vegetarian and non vegetarian patients. Calcium
concentration in non vegetarians was found to be higher than that of
vegetarian patients. The other ion concentrations in all the patients
looked similar.
Key words: Blood Samples (Vegetarian & Non vegetarian),
Estimation of Ca, K, Na, Mg, Cl, Absorbance, Spectrophotometer.
Introduction
Blood is a constantly circulating fluid providing the body with
nutrition, oxygen, and waste removal. Blood is mostly liquid,
with numerous cells and proteins suspended in it, making blood
thicker than pure water (Franklin, 2009). The average person

Khayre Amier Mohamed Ibrahim, Prashant Anthony, Sushma- Estimation of
Electrolytes in Human Blood Samples with respect to Different Eating Habits
EUROPEAN ACADEMIC RESEARCH - Vol. III, Issue 4 / July 2015
4129
has about 5 liters (more than a gallon) of blood. When it reaches
the lungs, gas exchange occurs when carbon dioxide is diffused
out of the blood into the pulmonary alveoli and oxygen is
diffused into the blood. This oxygenated blood is pumped to the
left hand side of the heart in the pulmonary vein and enters
the left atrium. From here it passes through the mitral valve,
through the ventricle and taken all around the body by
the aorta. Blood contains antibodies, nutrients, oxygen and
much more to help the body work Liquid called plasma makes
up about half of the content of blood, (Alberts et al., 2012).
Chemically, electrolytes are substances that become ions
in solution and acquire the capacity to conduct electricity.
Electrolytes are present in the human body, and the balance of
the electrolytes in our bodies is essential for normal function of
our cells and our organs.
Common electrolytes that are measured by doctors with
blood testing include sodium, potassium, chloride, and
bicarbonate. The functions and normal range values for these
electrolytes are discussed below.
Sodium is the major positive ion (cation) in fluid outside
of cells. The chemical notation for sodium is Na+. When
combined with chloride, the resulting substance is table salt.
Sodium regulates the total amount of water in the body and the
transmission of sodium into and out of individual cells also
plays a role in critical body functions.
If sodium ion less than 135mmol/l in human body is
called (Hyponatremia disease)
If sodium ion higher than 155mmol/l in human body is
called (Hypernatremia disease)
Chloride is the major anion (negatively charged ion)
found in the fluid outside of cells and in the blood. Increase
chloride in human body up to 106mmol/L is called
(Hyperchloremia). Decrease chloride in human body less than
98 mmol/L is called (Hypochloremia), (Shiel, 2014).

Khayre Amier Mohamed Ibrahim, Prashant Anthony, Sushma- Estimation of
Electrolytes in Human Blood Samples with respect to Different Eating Habits
EUROPEAN ACADEMIC RESEARCH - Vol. III, Issue 4 / July 2015
4130
Calcium plays an essential role in many cell functions. It is
present in plasma in three forms free, bound to protein or
complexed with anions as phosphate, citrate and bicarbonate.
Normal range of calcium 2.15-2.58mmol/L, (Oberst, 1934).
Magnesium is a major intracellular cation. It is an
activator of various enzymes, it is also involved in amino acid
activation and protein synthesis. The normal range of
magnesium (0.46 – 0.60 mmol/L), (Resnick et al., 1984).
Potassium is the major positive ion (cation) found
inside of cells. The chemical notation for potassium is K+. The
proper level of potassium is essential for normal cell function.
Low potassium level is as known as (Hypokalemia).
High potassium level is as known as (Hyperkalemia), (Shiel,
2014).
Materials and Methods
The material and methods used in the present study of
(Estimation of the electrolytes in human blood samples with
respect to different eating habits (vegetarian and non-
vegetarian)) were as follows:-
Blood analysis was commonly carried out on a sample of
blood drawn from the vein of the arm then followed the steps
involve for blood analysis in the laboratory as putting the
blood's sample in special test tube and Separating the blood by
Centrifuge after that Assay the samples of blood by manual
ways and getting the results.
Sodium and potassium are major cations of extracellular
and intra cellular fluids respectively. Sodium maintains the
normal distribution of water and the osmotic pressure in the
various fluid compartments. Potassium influences the acid base
balance and osmotic pressure including water retention.
Increased Sodium levels are found in severe dehydration and
excessive treatment with sodium salts. Decreased levels were
found in severe poly urea, metabolic acidosis diarrhoea and

Khayre Amier Mohamed Ibrahim, Prashant Anthony, Sushma- Estimation of
Electrolytes in Human Blood Samples with respect to Different Eating Habits
EUROPEAN ACADEMIC RESEARCH - Vol. III, Issue 4 / July 2015
4131
renal insufficiency. Increased potassium levels are found in
renal fail urea, dehydration shock and adrenal in sufficiency.
Decreased levels are found in malnutrition, gastro – intestinal
fluid loss, and hyperactivity of the adrenal cortex. Chloride is a
major extracellular anion and maintains the cation / anion
balance between intra and extra cellular fluids, mostly as salt
with sodium. Increased levels are usually found in dehydration,
kidney dysfunction, and anaemia. Decreased levels are found in
extensive burns, vomiting, diarrhea intestinal obstructions, and
salt losing nephritis.
Table: Normal Reference Values of electrolytes in human blood.
135 – 155 mmol/L Sodium
3.5 - 5.5mmol/ L Potassium
98 – 106 mmol / L Serum / Plasma
Chloride
170 – 250 mmol/L Urine Chloride
120 – 135 mmol/L Csf Chloride
It's recommended that each Laboratory establish its own
normal range representing Its Patient population.
Principle:
Sodium is precipitated as a triple salt with Magnesium and
Uranyl acetate. The excess of uranyl ions are reacted with
ferrocyanide in an acidic medium to develop brownish colour.
The intensity of the colour produced is inversely proportional to
the concentration of sodium in the sample:
Uranyl ions + Mg ions + Na+UranylMgNa Precipitate
Free Uranyl Ions + K4Fe(CN)6 Brown colored Complex
Potassium reacts with sodium tetra-phenyl boron in a specially
prepared buffer to form a colloidal suspension.
The amount of the turbidity produced is directly
proportional to the concentration of potassium in the sample.

Khayre Amier Mohamed Ibrahim, Prashant Anthony, Sushma- Estimation of
Electrolytes in Human Blood Samples with respect to Different Eating Habits
EUROPEAN ACADEMIC RESEARCH - Vol. III, Issue 4 / July 2015
4132
Tetra phenyl Boron + K+White turbidity Chloride ions combine
with free mercuric ions and release thiocyanate from mercuric thiocyanate.
The thiocyanate released combines with the ferric ions to form
a red brown ferric thiocynate complex.
Intensity of the colour formed is directly proportional to
the amount of chloride present in the sample.
2 Cl- + Hg ( SCN )2 HgCl2 + 2( SCN )
3(SCN ) + Fe3+ Fe (SCN )
Table 3.2 mentions the details of the patients whose blood
samples were used to analyze the ions. The patients belonged to
different age groups, both vegetarian and non-vegetarian eating
habits.
Table: Sample details of Patients used for the present study
Sl. No.- Sample Name Age Gender NV/V
1 K1 31 Male V
2 K2 15 Male V
3 K3 49 Male NV
4 K4 64 Male V
5 K5 79 Male NV
6 K6 52 Female NV
7 K7 35 Male V
8 K8 40 Female NV
9 K9 39 Female V
10 K10 34 Female V
11 K11 7 Male NV
12 K12 83 Male NV
13 K13 38 Male NV
14 K14 33 Female V
15 K15 6 Male V
16 K16 62 Male V
17 K17 22 Female NV
18 K18 80 Male V
19 K19 21 Male V
20 K20 29 Female V
21 K21 19 Female NV
22 K22 6 Female V
23 K23 39 Female V
24 K24 30 Male NV

Khayre Amier Mohamed Ibrahim, Prashant Anthony, Sushma- Estimation of
Electrolytes in Human Blood Samples with respect to Different Eating Habits
EUROPEAN ACADEMIC RESEARCH - Vol. III, Issue 4 / July 2015
4133
25 K25 35 Female NV
26 K26 75 Male V
27 K27 60 Male NV
28 K28 80 Female V
29 K29 30 Male NV
30 K30 24 Female NV
31 K31 30 Male NV
32 K32 18 Female V
33 K33 30 Male NV
34 K34 27 Female NV
35 K35 32 Male V
36 K36 14 Male V
37 K37 34 Male NV
38 K38 37 Male V
39 K39 41 Male V
40 K40 27 Female V
41 K41 29 Male V
42 K42 38 Male NV
43 K43 19 Male NV
44 K44 25 Male NV
45 K45 40 Female V
46 K46 35 Male NV
47 K47 25 Male NV
48 K48 71 Male V
49 K49 55 Male NV
50 K50 49 Male NV
CHLORIDE KIT (Thiocyanate method ) Elyte 2 Kit
(Na+ and K+ Colorimetric ) Elyte 3 Kit.
( Na+ / K+ and Cl- Colorimetric for the determination of Na+ / K+ and Cl- in
Serum for In-vitro Diagnostic use Only) Procedure
Table: Wavelength of maximum absorption (λmax) for Sodium,
Potassium, Chloride, Magnesium and Calcium.
530nm (Hg 546) green Wavelength / Filter Sodium
630 nm (Hg 623) red Wavelength / Filter Potassium
505 nm (Hg 546) green Wavelength / Filter Chloride
510 nm ( Hg 546 nm ) Green Wavelength / Filter Magnesium
650 nm (Hg 630 nm) Wavelength / Filter Calcium
Storage Instructions and Reagent Stability:
The reagent and the standard are stable up to the end of the
indicated date of expiry on the vial label, if stored at 2 to 8 0C,

Khayre Amier Mohamed Ibrahim, Prashant Anthony, Sushma- Estimation of
Electrolytes in Human Blood Samples with respect to Different Eating Habits
EUROPEAN ACADEMIC RESEARCH - Vol. III, Issue 4 / July 2015
4134
protected from light and contamination is avoided. Should not
be freezed.
The standard is stable up to the end of the indicated
date of expiry on the vial label, if stored at 2 to 8 0C.
Storage & Stability
All reagents are stable at R.T till the expiry mentioned.
Reagent Preparation
Reagents are ready to use.
Sample Material
For sodium and potassium: Serum, free from hemolysis serum should
be separated from the clot immediately / as soon as possible.
For chloride: Serum, plasma urine and CSF. Dilute urine samples 1+1
with distilled water before the assay chloride is reported to be stable
in serum for 7 days at 2-8 Co.
1. Sodium Assay
1 – PRECIPITATION: For the precipitation the following
reagents were pipetted into clean dry test tubes labeled as
standard (S) and Test (T) as shown in table 3.4.
Table:- Show the component of Sodium Kit
Volume (ml) component
35 ml L1 : Precipitating Reagent
45 ml L2 : Acid Reagent
5 ml L3 : Colour Reagent
Table:-Method (I) of Sodium Assay T ( ml ) S (ml ) Addition sequence
1.0 1.0 Precipitating reagent
( L1 )
- 0.02 Na+/K+ Standard ( S )
o.o2 - Sample
The contents were mixed well and allowed to stand at R. T for 5
min, with shaking well intermittently after that the contents
were centrifuge at 2500 to 3000 RPM to obtain clear
supernatant.

Khayre Amier Mohamed Ibrahim, Prashant Anthony, Sushma- Estimation of
Electrolytes in Human Blood Samples with respect to Different Eating Habits
EUROPEAN ACADEMIC RESEARCH - Vol. III, Issue 4 / July 2015
4135
2 – COLOUR DEVELOPMENT: For the colour development the
reagents were pipetted into clean dry test tubes labeled as
blank (B), standard (S) and test (T) according to the table 3.6.
Table:-Method (II) Of Sodium Assay T ( ml ) S ( ml ) B ( ml ) Addition sequence
1.0 1.0 1.0 Acid Reagent ( L2)
0.02 0.02 - Supernatant Step 1
- - 0.02 Precipitation reagent ( L 1 )
0.1 0.1 0.1 Colour Reagent ( L 3 )
After development of colour the absorbance was recorded and
the sodium ion was estimated as per the following equation.
Calculation:-
Sodium ions in mmol = (Abs. B – Abs. T / Abs.B – Abs.S) * 150
2. Potassium Assay:
For the precipitation the following reagents were pipettedinto
clean dry test tubes labeled as blank (B) standard (S), and test
(T) as shown in table 3.7.
Table:-The Method of Potassium Assay T ( ml ) S ( ml ) B ( ml ) Addition sequence
1.0 1.0 1.0 Potassium Reagent ( L1)
- - 0.02 Deionised water
- 0.02 - Na+ / K+ Standard ( S )
- - - Sample
Table:-The component of Potassium Kit
Volume (ml) component
45 ml L1 : Potassium Reagent
5 ml S:Na+/K+ St (150/5 mmol/L
The contents were mixed well and incubated at R.T. for 5 min
measure after which the Absorbance of the standard (Abs.S)
and Test Sample (Abs.T) was measured against Blank within
15 min.

Khayre Amier Mohamed Ibrahim, Prashant Anthony, Sushma- Estimation of
Electrolytes in Human Blood Samples with respect to Different Eating Habits
EUROPEAN ACADEMIC RESEARCH - Vol. III, Issue 4 / July 2015
4136
Calculation:-
The amount of Potassium was estimated using the following
equation
Potassium ions in mmol / L = (Abs.T / Abs.S) * 5
3. Chloride Assay:
For the Chloride estimation the following reagents were
pipetted into clean dry test tubes labeled as Blank (B) standard
(S) and Test (T) according to Table 3.9
Table:-Method of Chloride Assay T ( ml ) S ( ml ) B ( ml ) Addition Sequence
1.0 1.0 1.0 Chloride Reagent ( L1 )
- - 0.01 Deionised water
- 0.01 - Chloride Standard ( S )
0.01 - - Sample
The contents were mixed well and incubated at R.T for 2 min,
after that measure the Absorbance of the standard (Abs.S), and
Test sample (Abs.T) against Blank, within 60 min.
Calculation:-
The chloride content was estimated according to the following
equation
Chloride ions in mmol / L = (Abs.T/Abs.S) * 100
4. Magnesium Assay:
Principle:
Magnesium combines with Calmagite in an alkaline medium to
form a red coloured complex. Interference of calcium and
protein is eliminated by the addition of specific chelating agents
and detergents. Intensity of the colour formed is directly
proportional to the amount of magnesium present in the
sample.

Khayre Amier Mohamed Ibrahim, Prashant Anthony, Sushma- Estimation of
Electrolytes in Human Blood Samples with respect to Different Eating Habits
EUROPEAN ACADEMIC RESEARCH - Vol. III, Issue 4 / July 2015
4137
Magnesium + Calcium Alkaline/Medium Redcoloured complex
Table:-Contents of Magnesium Assay
component Volume (ml)
Buffer Reagent ( L1 ) 12.5 ml
Colour Reagent ( L2 ) 12.5 ml
Magnesium Standard ( S ) 2 ml
Magnesium Kit:
(Calmagite method)
For the determination of Magnesium in serum, urine & CSF.
(ForInvitro Diagnostic Use Only)
Contents of the kit:
Procedure:
Table:-Shows the standard wavelength, temperature and path length
for Magnesium assay 510 nm ( Hg 546 nm ) Green Wavelength / filter
R.T. Temperature
1 cm Light Path
For the estimation of magnesium pipette into clean dry test
tube labeled as Blank (B), Standard (S), and Test (T) the
reagents according to table 3.
Table: Method of Magnesium Assay.
T ( ml ) S ( ml ) B ( ml ) Addition Sequence
0.5 0.5 0.5 Buffer Reagent ( L1 )
0.5 0.5 0.5 Colour Reagent ( L2 )
- - 0.01 Distilled Water
- 0.01 - Magnesium Standard ( S )
0.01 - - Sample
All the reagents were mixed well and incubate at RT (250 C) for
5 min. Then the absorbance of Standard (Abs.S), and Test
Sample (Abs .T) were measured against the Blank, within 30
min.

Khayre Amier Mohamed Ibrahim, Prashant Anthony, Sushma- Estimation of
Electrolytes in Human Blood Samples with respect to Different Eating Habits
EUROPEAN ACADEMIC RESEARCH - Vol. III, Issue 4 / July 2015
4138
Calculations:
The amount of magnesium was calculated according to
following equation
Magnesium ions in mEq/L = (Abs.T / Abs.S )* 2
5 Calcium Assay:
Principle:-
Calcium with Arsenazo III [2, 7– (bis (2- arsonophenyfazo)-1,8-
dihydroxynaphtaienc-3,6 – disulphoric acid] At neutral pH
yields a blue colouredcomplex , whose intensity is proportional
to the calcium concentration. Interference by magnesium is
eliminated by addition of 8- Hydroxyquinoline- 5 – sulfonic acid.
REAGENTS:
Table:-Components and Concentrations:
Assay Procedure:
Table:- The standard wavelength, path length and temperature for
calcium determination
Hg 630 nm, 650 nm Wavelength /filter
1cm Optical path
37 C0 Temperature
End point Mode
Bring all the contents of the kit to Room Temperature prior to
use.
Read absorbance of sample against reagent blank.
Table:-Method of Calcium Assay.
T (ml ) S (ml) B(ml) Addition Sequence
0.1 0.1 0.1 Reagent
- - 0.01 Deionised Water
- 0.01 - Standard
0.01 - - Sample/ Control
COMPONENTS AND CONCENTRATIONS :
100 mmol /L Imidazole Buffer
5 mmol /L 8- HydroxyQuinoline
120 µmol / L Arsenazo III
Preservative & Stabilizer
( 2.50 mmol/ L ) 10.0mg /dl Standard :

Khayre Amier Mohamed Ibrahim, Prashant Anthony, Sushma- Estimation of
Electrolytes in Human Blood Samples with respect to Different Eating Habits
EUROPEAN ACADEMIC RESEARCH - Vol. III, Issue 4 / July 2015
4139
The contents were mixed and incubated at R.T. for 2 minutes
after that the absorbance (A) of the standard (Abs.S), and Test
sample (Abs.T) against Blank, within 60 min.
Calculation:
The amount of Calcium was calculated according to following
equation:
conc of sample = ( concentration of St /Abs.of St – Abs.of Reagent
blank ) * Abs.of unknown sample- Abs.of Bla
Results and Discussion
As discussed in the materials and methods chapter, 50 patients
of different age groups and different eating habits (Vegetarian
and Non Vegetarian) and both male and female were analyzed.
The blood samples from these patients were analyzed for
Calcium, Sodium, Potassium, Chlorides and Magnesium ions.
The absorbance for each sample was read on a
spectrophotometer (Sartorius Stedium Biotech). The
absorbance readings were directly proportional to the
concentration of the ions of samples. These absorbance readings
were then used to calculate the overall concentration each ion
in each sample. The results were tabulated in the following
tables.

Khayre Amier Mohamed Ibrahim, Prashant Anthony, Sushma- Estimation of
Electrolytes in Human Blood Samples with respect to Different Eating Habits
EUROPEAN ACADEMIC RESEARCH - Vol. III, Issue 4 / July 2015
4140
Table:-Details of patients selected for the study and the
concentration of ions in their blood.
Sl.
No.
Sample
Name Age Gender NV/V
Calcium
(mmol/L)
Magnesium
(mmol/L)
Sodium
(mmol/L)
Potassium
(mmol/L)
Chloride
(mmol/L)
1 K1 31 Male V 0 0 140.2 19.67 97.05
2 K2 15 Male V 2.42 2.6295 100 59.07 119.7
3 K3 49 Male NV 1.95 2.85 139.4 26.6 90.64
4 K4 64 Male V 5.4 0 145 30.4 79.7
5 K5 79 Male NV 0.06 1.52 141.58 46.46 86.65
6 K6 52 Female N V 0.86 1.98 142.28 34.57 89.6
7 K7 35 Male V 0.51 1.79 143.6 39.88 80.24
8 K8 40 Female N V 3.88 4.26 134 44.76 85.78
9 K9 39 Female V 1.05 1.982 145.5 24 84.9
10 K10 34 Female V 2.16 2.93 130.49 26.65 82.8
11 K11 7 Male NV 1.12 1.9 136.88 28.5 85.96
12 K12 83 Male N V 1.35 0.3 197.1 31.2 84.05
13 K13 38 Male N V 12 6.8 168.4 45.3 105
14 K14 33 Female V 4.23 4.81 179.2 43.1 87.5
15 K15 6 Male V 3.7 4.8 164.07 42.2 92.2
16 K16 62 Male V 0.645 0.379 95.3 53.3 97.2
17 K17 22 Female N V 1.023 0.8 94.6 44.3 102.8
18 K18 80 Male V 0.65 0.25 69.8 39.88 88.9
19 K19 21 Male V 1.63 1.9 89.3 50.84 110.2
20 K20 29 Female V 2.113 0.559 84.02 64.3 96.8
21 K21 19 Female N V 1.37 0.6 29.78 56.53 98
22 K22 6 Female V 2.78 0.134 89.36 39 90.8
23 K23 39 Female V 3.01 5.39 108.2 58.8 162.5
24 K24 30 Male NV 14.6 0 86.5 70.19 185.09
25 K25 35 Female NV 1.19 2.72 129.2 47.9 106.5
26 K26 75 Male V 1.911 3.72 117.2 58.6 112.6
27 K27 60 Male NV 4.8 5.28 119.7 54.7 154
28 K28 80 Female V 2.93 0 86.7 67.76 202.2
29 K29 30 Male N V 2.26 3.218 126.7 72.19 107.9
30 K30 24 Female N V 1.56 2.76 114.48 58.9 111.6
31 K31 30 Male N V 0.25 0.34 127.25 53 85.09
32 K32 18 Female V 5.28 0 104.3 59.6 254.5
33 K33 30 Male N V 1.9 4.73 123.6 57 125.6
34 K34 27 Female NV 0.45 0.259 132 37.88 99.1
35 K35 32 Male V 1.08 0.198 116.25 48.2 91.33
36 K36 14 Male V 1.58 1.63 100 49.32 111.09
37 K37 34 Male N V 2.6 2.39 93.75 60.78 120
38 K38 37 Male V 0.75 0.288 124.5 36.4 93.9
39 K39 41 Male V 0.48 0.7 124.25 45.38 93.06
40 K40 27 Female V 0.04 1.2 114.75 46.8 105.9
41 K41 29 Male V 0.61 1.758 96.75 42.5 107.3
42 K42 38 Male N V 0.43 1.029 116.25 50.07 96.7
43 K43 19 Male N V 1.05 0.145 131 40.92 85.09
44 K44 25 Male N V 0.34 0.14 123.25 43.61 92.7
45 K45 40 Female V 1.32 0.26 108.2 33.9 85.78
46 K46 35 Male N V 3.12 1.17 96.8 31.5 94.6
47 K47 25 Male N V 0.57 2.41 60.7 69.5 154
48 K48 71 Male V 0.79 0.63 96.5 55.6 106.4
49 K49 55 Male N V 2.67 0.81 86.39 36.7 96.36
50 K50 49 Male N V 1.12 3.12 89.2 50 88.04

Khayre Amier Mohamed Ibrahim, Prashant Anthony, Sushma- Estimation of
Electrolytes in Human Blood Samples with respect to Different Eating Habits
EUROPEAN ACADEMIC RESEARCH - Vol. III, Issue 4 / July 2015
4141
Table: Normal Ranges of ions for comparison
135 – 155 mmol/L Sodium
3.5 - 5.5mmol/ L Potassium
98 – 106 mmol / L Serum / Plasma Chloride
1.84-2.76 mmol/L Calcium
0.46 – 0.60 mmol/L Magnesium
Fig: Graph showing the calcium ion level (mmol/L) for the samples
Fig: Graph showing the Magnesium ion level (mmol/L) for the
samples
Fig: Graph showing the Sodium ion level (mmol/L) the samples.
Khayre Amier Mohamed Ibrahim, Prashant Anthony, Sushma- Estimation of
Electrolytes in Human Blood Samples with respect to Different Eating Habits
EUROPEAN ACADEMIC RESEARCH - Vol. III, Issue 4 / July 2015
4142
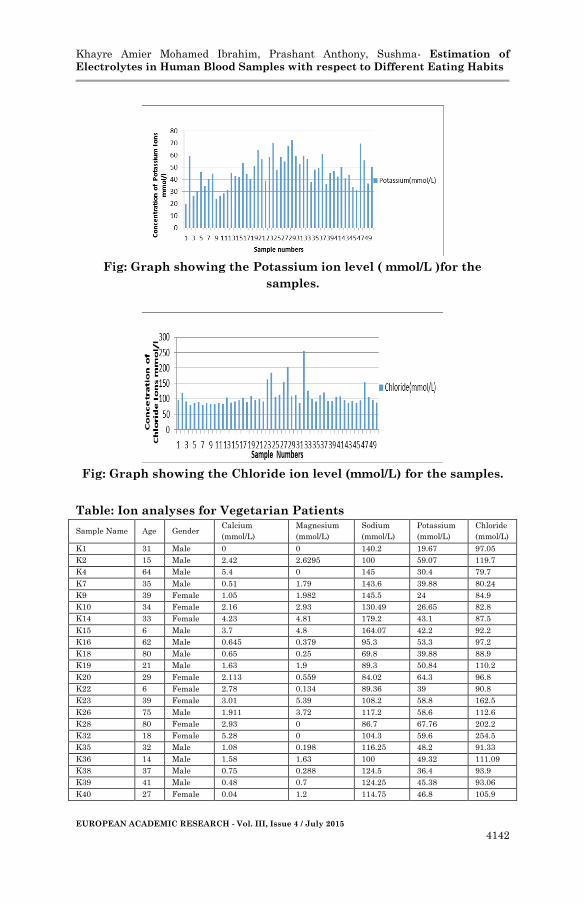
Fig: Graph showing the Potassium ion level ( mmol/L )for the
samples.
Fig: Graph showing the Chloride ion level (mmol/L) for the samples.
Table: Ion analyses for Vegetarian Patients
Sample Name Age Gender Calcium
(mmol/L)
Magnesium
(mmol/L)
Sodium
(mmol/L)
Potassium
(mmol/L)
Chloride
(mmol/L)
K1 31 Male 0 0 140.2 19.67 97.05
K2 15 Male 2.42 2.6295 100 59.07 119.7
K4 64 Male 5.4 0 145 30.4 79.7
K7 35 Male 0.51 1.79 143.6 39.88 80.24
K9 39 Female 1.05 1.982 145.5 24 84.9
K10 34 Female 2.16 2.93 130.49 26.65 82.8
K14 33 Female 4.23 4.81 179.2 43.1 87.5
K15 6 Male 3.7 4.8 164.07 42.2 92.2
K16 62 Male 0.645 0.379 95.3 53.3 97.2
K18 80 Male 0.65 0.25 69.8 39.88 88.9
K19 21 Male 1.63 1.9 89.3 50.84 110.2
K20 29 Female 2.113 0.559 84.02 64.3 96.8
K22 6 Female 2.78 0.134 89.36 39 90.8
K23 39 Female 3.01 5.39 108.2 58.8 162.5
K26 75 Male 1.911 3.72 117.2 58.6 112.6
K28 80 Female 2.93 0 86.7 67.76 202.2
K32 18 Female 5.28 0 104.3 59.6 254.5
K35 32 Male 1.08 0.198 116.25 48.2 91.33
K36 14 Male 1.58 1.63 100 49.32 111.09
K38 37 Male 0.75 0.288 124.5 36.4 93.9
K39 41 Male 0.48 0.7 124.25 45.38 93.06
K40 27 Female 0.04 1.2 114.75 46.8 105.9

Khayre Amier Mohamed Ibrahim, Prashant Anthony, Sushma- Estimation of
Electrolytes in Human Blood Samples with respect to Different Eating Habits
EUROPEAN ACADEMIC RESEARCH - Vol. III, Issue 4 / July 2015
4143
K41 29 Male 0.61 1.758 96.75 42.5 107.3
K45 40 Female 1.32 0.26 108.2 33.9 85.78
K48 71 Male 0.79 0.63 96.5 55.6 106.4
Table:- Ion analyses for Non-Vegetarian Patients
Sample Name Age Gender Calcium
(mmol/L)
Magnesium
(mmol/L)
Sodium
(mmol/L)
Potassium
(mmol/L)
Chloride
(mmol/L)
K5 79 Male 0.06 1.52 141.58 46.46 86.65
K6 52 Female 0.86 1.98 142.28 34.57 89.6
K8 40 Female 3.88 4.26 134 44.76 85.78
K11 7 Male 1.12 1.9 136.88 28.5 85.96
K12 83 Male 1.35 0.3 197.1 31.2 84.05
K13 38 Male 12 6.8 168.4 45.3 105
K17 22 Female 1.023 0.8 94.6 44.3 102.8
K21 19 Female 1.37 0.6 29.78 56.53 98
K24 30 Male 14.6 0 86.5 70.19 185.09
K25 35 Female 1.19 2.72 129.2 47.9 106.5
K27 60 Male 4.8 5.28 119.7 54.7 154
K29 30 Male 2.26 3.218 126.7 72.19 107.9
K30 24 Female 1.56 2.76 114.48 58.9 111.6
K31 30 Male 0.25 0.34 127.25 53 85.09
K33 30 Male 1.9 4.73 123.6 57 125.6
K34 27 Female 0.45 0.259 132 37.88 99.1
K37 34 Male 2.6 2.39 93.75 60.78 120
K42 38 Male 0.43 1.029 116.25 50.07 96.7
K43 19 Male 1.05 0.145 131 40.92 85.09
K44 25 Male 0.34 0.14 123.25 43.61 92.7
K46 35 Male 3.12 1.17 96.8 31.5 94.6
K47 25 Male 0.57 2.41 60.7 69.5 154
K49 55 Male 2.67 0.81 86.39 36.7 96.36
K50 49 Male 1.12 3.12 89.2 50 88.04
Fig: Graph showing the Calcium ion level (mmol/L) for both
Vegetarian and Non-Vegetarian samples in comparison.
Calcium values were found to be higher in non vegetarian
patients compared to vegetarian patients. The highest value
found to be over 3mmol/L for non vegetarians and around 2
mmol being the highest for vegetarians.

Khayre Amier Mohamed Ibrahim, Prashant Anthony, Sushma- Estimation of
Electrolytes in Human Blood Samples with respect to Different Eating Habits
EUROPEAN ACADEMIC RESEARCH - Vol. III, Issue 4 / July 2015
4144
Fig: Graph showing theMegnesium ion level (mmol/L) for both
Vegetarian and Non-Vegetarian samples in comparison.
Magnesium values were found to be similar for both non
vegetarian patients and vegetarian patients.
Fig: Graph showing the Sodium ion level (mmol/L ) for both
vegetarians and non vegetarians samples in comparison.
Sodium values were found to be similar for both non vegetarian
patients and vegetarian patients.The highest value observed
was 200 and lowest one was 25.
Fig: Graph showing the Potassium ions level (mmol/L) for both
vegetarians and non-vegetarians samples in comparison.

Khayre Amier Mohamed Ibrahim, Prashant Anthony, Sushma- Estimation of
Electrolytes in Human Blood Samples with respect to Different Eating Habits
EUROPEAN ACADEMIC RESEARCH - Vol. III, Issue 4 / July 2015
4145
Potassium values were found to be similar for both non
vegetarian patients and vegetarian patients. The highest
observed value was 70 and the lowest one was observed 10.
Fig: Graph showing the Chloride ion level (mmol/L ) for both
vegetarians and non-vegetarians samples in comparison.
Chloride values were found to be similar for both non
vegetarian patients and vegetarian patients.
Summary and Conclusion
In the present study, the effects of vegetarian food and non
vegetarian food on electrolytic level in the blood of 50
individuals has been checked. Calcium, Sodium, Potassium,
Chloride and Magnesium ions in the blood were checked.
Research material consists of blood samples taken from people
who only eat vegetables and those of eating both vegetables and
meat. This study was done in Bangalore at Credura Life
Science centre on Biochemistry section. The blood samples of 50
human beings from different ages, gender and eating habits
were drawn from the vein of the arm at Laboratory. After that
all the blood samples divided into two portions ( 25 Vegetarian
and 25 Non-Vegetarian ) comparison after that all the addition
sequence steps for each electrolytic analysis was done and the
results were determined by Spectrophotometer which were
proportional to the concentration of ions ( Na+ , K+ , Ca++ , Mg++
and Cl - ) in the blood samples.

Khayre Amier Mohamed Ibrahim, Prashant Anthony, Sushma- Estimation of
Electrolytes in Human Blood Samples with respect to Different Eating Habits
EUROPEAN ACADEMIC RESEARCH - Vol. III, Issue 4 / July 2015
4146
Human body is considered flexible for both meat and vegetables
at the same time it needs to check the requirement of the body.
Researchers have proved that vegetarians are slimmer,
leatherier, with lower risk of cardiovascular disease like blood
pressure, cancer and diabetes. However vegetarians suffer from
low blood pressure, lower level of cholesterol and lower IBM
values. At the same time researchers found that health related
risks are more with the non vegetarians. Disease like cancer,
high blood pressure, high IBM values. Therefore it tells us
different biochemistry of individuals having different food
habits. Bearing these differences in mind I was curious to know
the electrolytic levels of both vegetarians and non-vegetarians.
It was observed that almost all non-vegetarians have
high calcium level in blood as compared to that of vegetarians.
While there was not much variation of Na, K, Cl and Mg ions.
The variation of these ions has a striking effect on human
health. The prominent among them are hair loss, tooth decay,
weakening of bones, muscle aches, abdominal cramps, mental
disorders and dizziness. This need an early dose of deficient
electrolyte otherwise the delay in compensating the deficiency
can lead into severe disorders and diseases. Therefore after
careful investigation of 50 samples of both vegetarian and non-
vegetarians on estimation of electrolytes and their exact need
for a particular individual we come to the conclusion that a
person should take both the foods in an adequate amount in
order to maintain the electrolytic level of the body and prevent
it from different deficiency diseases.
REFERENCES
Alberts, B., Johnson, A., Lewis, J., Raff, M., Roberts, K., and
Walter, P. (2012). Table 22-1 Blood Cells. Molecular
Biology of the Cell. NCBI Bookshelf, (15), 421-425.
Khayre Amier Mohamed Ibrahim, Prashant Anthony, Sushma- Estimation of
Electrolytes in Human Blood Samples with respect to Different Eating Habits
EUROPEAN ACADEMIC RESEARCH - Vol. III, Issue 4 / July 2015
4147
Franklin, A. M. (2009). Blood – The Human Heart. Institute
Inc, (19), 14-17
Oberst, F. W. (1934). Na in Human Red Blood Cells. Indian
journal,(30), 123-127.
Resnick, L.M., Gupta, R.K., and Laragh, J.H. (1984).
Intracellular free magnesium in erythrocytes of essential
hypertension: relation to blood pressure and serum
divalent cationsProcNatlAcadSci U S A , 81(20), 65-115.
Shiel, C. W. (2014). The Vertebrate Body Philadelphia. Holt-
Saunders International,(3). 404–406.
Shmukler, M. (2004). Density of Blood. The Physics Factbook,
(4), 177-181.