estimation of annual ch and n o emissions from fluidised ... · pdf file2o emissions from...
TRANSCRIPT

1
Estimation of annual CH4 and N2O emissions from fluidised bed
combustion: an advanced measurement-based method and its application to
Finland
Eemeli Tsupari a *, Suvi Monni b, Kauko Tormonen a, Tuula Pellikka a, Sanna Syri a
a VTT, Technical Research Centre of Finland, P.O. Box 1000, FI-02044 VTT, Espoo, Finlandb Benviroc Ltd, Vanha Saunalahdentie 11 A 8, FI-02330, Espoo, Finland
* Corresponding author
[email protected], tel: +358 40 720 7363, fax: +358 20 722 7021
Abstract
The aim of this study was to develop and apply an advanced, measurement based method for the
estimation of annual CH4 and N2O emissions and thus gain improved understanding on the actual
greenhouse gas (GHG) balances of combustion of fossil fuels, peat, biofuels and REF. CH4 and N2O
emissions depend strongly on combustion conditions, and therefore the emission factors used in the
calculation of annual emissions contain significant uncertainties. Fluidised bed combustion (FBC) has
many good properties for combustion of different types of fuels and fuels of varying quality, e.g., biofuels
and wastes. Therefore, it is currently increasing its market share. In this study, long term measurements
(up to 50 days) were carried out at seven FBC boilers representing different size classes, loadings and fuel
mixes. Both decreasing load and increasing share of coal in fuel mix increased N2O emissions.
Measurement results from different loading levels were combined with the common loading curves of
similar plants in Finland to estimate annual emissions. Based on the results, recommendations for
emission factors for the Finnish GHG emission inventory are given. The role of FBC as a potential
technology for the utilisation of biofuels and wastes with future GHG reduction requirements is
discussed.

2
Keywords: methane; nitrous oxide; emission factor; partial load; fluidised bed combustion
1 Introduction
The most important greenhouse gas (GHG) source is carbon dioxide (CO2) from combustion of fossil
fuels (IPCC, 2001a). These emissions can be rather accurately estimated based on information on the
amount of fuel combusted and fuel-specific emission factors, as nearly all carbon in the fuel is typically
oxidised in combustion. According to the IPCC (2000), uncertainties in CO2 emission factors for traded
fuels are smaller than 5% (bounds of 95% confidence interval relative to the mean value expressed as
percent). There are also other direct greenhouse gases that are formed in combustion, namely methane
(CH4) and nitrous oxide (N2O), which are powerful GHGs. Estimates of CH4 and N2O emissions usually
contain significant uncertainties. The IPCC (2000) estimates that uncertainties in CH4 emission factors
are 50-150% and those of N2O even an order of magnitude. The large uncertainties are due to the
formation mechanisms of these gases in combustion.
CH4 is typically formed due to incomplete combustion - e.g. poor mixing and early quenched oxidation
reactions in the combustion process. Methane emissions of several mg/MJ occur rarely in well operating
large furnaces, but are more common in small-scale combustion, e.g. in heating stoves and open
fireplaces (IPCC, 2006).
N2O emissions occur in combustion at low (<950°C) temperatures, and they are affected by fuel type and
various other conditions, like fraction of excess air and catalytic activity of char and mineral matter
(Kilpinen & Hupa, 1991; Kramlich & Linak, 1994; Löffler et al., 2002). Both the amount of nitrogen in
fuel and fuel-O/fuel-N ratio have an effect on N2O emissions (Hämäläinen & Aho, 1996). N2O is formed
from volatile nitrogen species (e.g. HCN) originating from fuel nitrogen but also from nitrogen of char
and by heterogeneous reactions on char surface (Åmand et al., 1991). Therefore also amount of char may
have a significant effect on N2O emissions. Due to these properties, N2O emissions are usually larger for
geologically older fuels, i.e. larger for coal than for peat, and larger for peat than for wood when other
combustion conditions are equal. N2O emissions are not formed in temperatures above 950oC or below
500oC. The peak of N2O formation occurs around 700oC (IEA GHG R&D, 2000). In furnace areas where
3
temperature is above 950oC, N2O molecules that were formed earlier in the combustion process are
decomposed. In large boilers, it is assumed that 50 - 80% of N2O formed in the bottom of the boiler is
decomposed before it exits the boiler (Moritomi et al., 1999). The greater the furnace temperature, the
larger the share of N2O that is decomposed in enlarged hot areas.
Fluidised bed combustion (FBC) as a combustion technology is increasing its share in many countries due
to its advantages. Moist fuels like biomass, wastes and sludge can be efficiently combusted by FBC.
Technology is suitable especially for REF (recycled fuel, also called SRF or RDF) co-firing with other
fuels. FBC is a proven technology for efficient CHP (combined heat and power) production in large and
small scale, and in-process capture of SO2 and small NOx emissions are also important advantages. With
the future requirements of more stringent GHG reductions after the first Kyoto protocol period of the
United Nations Framework Convention on Climate Change (UNFCCC, 1998), increasing electrification
of developing countries and the growing utilisation of various-grade biofuels and waste, it can be
expected that FBC will continue to increase its global market share considerably.
The FBC can be divided into two categories. Bubbling Fluidised Bed (BFB) boilers have a lower velocity
of primary air than Circulating Fluidised Bed (CFB) boilers and therefore the bed (e.g. mixture of sand,
limestone and ash) of the BFB boiler is “bubbling”. In CFB boiler, bed material is circulating in boiler
and it is separated from flue gases by cyclone before returning back to furnace. Typically CFB boilers are
larger than BFB boilers because CFB technology is often more suitable for very large plants (Teir, 2003).
Low combustion temperatures of FBC reduce formation of NOx emissions, but at the same time N2O
emissions increase, as temperatures are typically in the range where N2O formation is notable. FBC
typically dominates N2O emission levels from large scale combustion in countries where the technology
is widely used. For example, in Finland FBC caused approximately 60% of N2O emissions from large
scale combustion in 2002 even though about 20% of fuel [TJ] was combusted by FBC (Ministry of the
Environment, 2004). Therefore, FBC is of special interest when developing more accurate estimates of
N2O emissions from stationary combustion in countries, where this technology is commonly used, namely
USA, Finland and Sweden and to some extent, e.g., Japan, China, India, Poland and Germany.
According to the reporting requirements set by the UNFCCC, industrial countries are liable to estimate

4
and report GHG emissions annually. For this purpose, emissions are usually estimated by calculations,
using activity data (e.g. amount of fuel combusted) and emission factors (emissions per unit activity).
Because fuel type, combustion technology and conditions during the combustion have a significant effect
on the CH4 and N2O emissions, it is challenging to develop representative emission factors for these
gases. In addition, temperature in the furnace in FBC often decreases with decreasing load, leading to
increased N2O emissions. Therefore, loading of boilers has to be taken into account when estimating
annual average emission factors for N2O. Estimation of emissions based on measurement carried out
during full load only may cause notable bias in the estimate.
This paper presents a method to estimate annual CH4 and N2O emissions from FBC, taking into account
the effect of load changes. Estimates are based on measurements done in seven FBC boilers, and on a
survey of loading conditions in Finnish plants. Measurements were carried out during rather long time
periods (up to 50 days), to gain information on the effect of different conditions on resulting emissions.
Measurement data presented in literature are typically collected during short periods compared to the
measurements presented in this study. In addition, measurements in literature are often carried out during
full load and stable conditions, representing optimal conditions rather than annual average emissions.
In this study, more weight was given to N2O than to CH4 due to the higher significance of N2O. Annual
estimated emissions from the stationary combustion (other than small scale combustion) in Finland were
4.62 Gg CH4 and 2.40 Gg N2O, according to the national GHG inventory submitted to the UNFCCC
(Ministry of the Environment, 2004). The Global Warming Potential (GWP) that measures the climatic
effect of the gas relative to CO2 is 23 for CH4 and 296 for N2O (IPCC, 2001b). Therefore the annual
emissions of the sector are 106 and 711 Gg CO2-equivalent, respectively.
Section 2 in this article gives an overview of power and heat production in Finland. Section 3 describes
the methods used, including both measurement methods and the survey of loading. Section 4 presents the
results of measurements and the survey, and the recommended emission factors for Finland. Discussion
and conclusions are in Section 5.

5
2 Power and heat production in Finland
Cold and varying weather during winter together with heavy and energy intensive industry set special
requirements for the Finnish energy system. Due to the varying heating demand of buildings and energy
consumption of forest and metal industry, both efficient CHP and a great adjusting capacity of heat
production are typical features of the Finnish energy system. Because the country is sparsely inhabited
and widely covered by forest, many different fuels are combusted in Finland. Small scale combustion of
wood is common but a large amount of biomass is also combusted in large-scale applications, e.g. in FBC
boilers and as black liquor in recovery boilers of forest industry. Co-combustion of biomass and peat by
FBC is very common. In addition, smaller amounts of other fuels like coal, REF and sludge from pulp
and paper mills are co-combusted with biomass and peat in many Finnish fluidised bed boilers (Mattila et
al., 2001). In Finland, most of the methane emissions from combustion sector come from small scale
combustion of biomass (Ministry of the Environment, 2004). However, this study concentrates on larger
scale (> 5 MWfuel) combustion. Most of these plants produce heat for district heating network and many
of them also electricity to grid and/or steam to industry.
In Finland, district heating is the most commonly used heating system for residential, commercial and
public buildings with a share of 20% of energy used for heating (Energy Statistics, 2004). District heating
plants are adjusted by the heating demand, which is strongly influenced by outdoor temperature. A typical
district heating network consists of larger plants (from 50 up to 600 MWfuel) which supply the base load
to the heating network often with their full capacity, and smaller plants which are used for adjusting the
supply to demand and are therefore started up and shut down during winter one after another when the
temperature changes. This recurs several times a year. Larger plants have at least one maintenance break
every year, but many boilers are shut down more often. FBC is a typical solid fuel firing technology in
CHP and district heating plants in Finland and therefore load changes are common in many Finnish FBC
boilers.
Industry uses a major share of the energy used in Finland (50% of primary energy) but it has a lot of its
own power and heat production by different kinds of boilers in the mills. For example, the recovery
boilers of forest industry are used at high load during the whole year and shut down once or twice a year

6
for maintenance. According to loading data obtained from industry and expert interviews, fluidised bed
boilers are often used to adjust steam supply to demand. Therefore FBC of forest industry may operate
even more at partial load than public district heating boilers with corresponding capacity.
3 Methodology
3.1 Survey of load distributions
Extensive temperature and air supply data from all boilers of Finland were very difficult to get due to
different data collection systems in plants. Therefore, a survey was conducted to obtain information on
typical load distributions and fuels. The purpose was to get automatically collected data, e.g., hourly
averages of the thermal input [MWfuel] from the most of the combustion plants in Finland. Load changes
affect N2O emissions [mg/MJfuel] mainly due to changes in combustion temperature. The plant types
considered were public heat or CHP producing plants, condensing power plants and industrial combustion
plants.
In Finland, the largest category (according to the number of plants and the amount of fuel combusted) is
heat and CHP production plants. Therefore, this study concentrated especially on these plants.
Combustion plants were divided into different types based on their fuel type (solid / liquid or gas), size of
heating network (village / small town / city) and purpose of plant in network (base load / adjusting / peak
load / reserve), because each of these plant types may have different load distributions. Data for the most
common plant types was obtained by contacting the combustion plants. By this method, enough loading
data from all the significant plant types was obtained and it could be divided to categories according to
different load distributions.
The loading data of many condensing power plants was available from Fingrid, the electricity
transmission system operator of Finland. Fingrid collects electricity production data, which is well
correlated with fuel load in the case of condensing power plants. This data is confidential at plant-level,
but load distributions were converted into a form where specific plants could not be identified. The
efficiency of electricity production decreases with load, but potential error caused to average load

7
distributions is insignificant when compared with other sources of uncertainty in developing national
average emission factors.
For comparison, the load distributions from two BFB boilers from forest industry are presented. These
boilers are used to adjust steam supply to mill because recovery boilers produce most of the steam needed
and are adjusted by other parameters. Therefore the average share of partial load for boilers of industry
may be larger than for other boilers.
Four loading levels, i.e. >80%, 60-80%, 40-60% and 0-40% energy input [MWfuel] of the nominal
capacity of the plant, were determined based on the data obtained. The share of each loading level of
annual energy input was then calculated based on plant-specific data. Results of the survey are presented
in Section 4.
3.2 Measurements and unit conversions
Continuous measurements were carried out in seven FBC plants. The aim was to find out the average
N2O and CH4 emission factors [mg/MJfuel] for each of the loading levels given in Section 3.1.
Measurement periods were long in order to include different load levels, start-ups, disorders etc. In
addition, measurements were done for different fuels and fuel mixes. All measurements were taken from
the stack or from the flue gas duct shortly before the stack.
Measurements were done by FT-IR (Fourier Transform Infrared Spectrometer) technique. FT-IR is a
sensitive, multicomponent analysis technique which has proven to be suitable for flue gas analysis in
several different applications. The quantitative analysis is performed by comparing the fraction of
radiation absorbed by an unknown sample to the absorption of samples of known concentration of the
same components. When FT-IR technique is used, it is an advantage that measurements can be performed
from hot and wet gases. Since there is no need for water removal, there are no risks for components to be
lost in the condensate.
Measurement results obtained using FT-IR were given as average concentration of each minute [ppmvol,

8
wet]. Temporal emission factors [mg/MJfuel]for figures 2, 3 and 4 were calculated by Equation [1]. Because
e.g. flue gas flow and thermal input data were automatically collected by combustion plants usually as
averages of each hour, the period mentioned after the Equation [1] was set to one hour for most of the
measurements presented in this study.
EFi = c * V * / P [1]
where EFi is the emission factor for a certain period [mg/MJfuel], c is an average of measured
concentrations during the period [ppmvol, wet], V is an average flue gas flow of the period [m3nwet/s], is
the density of the each gas [kg/m3n] and P is the average thermal input of the period [MWLHV]. Densities
were calculated by using the assumption of ideal gases. The corrections to normal temperature and
pressure (NTP) were also made. The letter n in the units [m3nwet/s] and [kg/m3n] stands for NTP.
The emissions of each hour [mg/h] were calculated by Equation [2].
Emissions = c * V * * 3600 [2]
Emissions calculated by Equation [2] were divided into four groups according to the prevailing load
(>80%, 60-80% etc.). Emissions of each of these groups were summed up and divided by the amount of
energy [MJ], which was calculated from thermal input [MW = MJ/s] and also divided into these four
groups and summed up. The average emission factor [mg/MJ] of each loading level was calculated by
Equation [3].
EFn = Emissionsn / Energyn [3]
where Emissionsn is the sum of the emissions at this loading level [mg] and Energyn [MJ] is the sum of
the energy content of the fuels fed in the furnace at this loading level.
To obtain annual emission factors for the typical Finnish plant types, emission factors for each loading

9
level (EFn) were combined with the loading data by Equation [4].
EF = (X80+ * EF80+ + X60-80 * EF60-80 + X40-60 * EF40-60 + X0-40 * EF0-40 ) / 100 [4]
where EF is the average emission factor for plant type [mg/MJfuel], Xn is the annual share of the load level
n [% of energy] and EFn is the average measured emission factor for load level n [mg/MJfuel]. Values for
Xn and EFn are presented in the section 4.
4 Results
The results of the survey of combustion plants loadings are presented in Table 1.
Table 1. Perceptual share of each loading level of annual fuel consumption by plant type.
Share of loading levels [%]Category Specification Size category
X80+ X60-80 X40-60 X0-40
Gas turbines < 50 MWe 40 34 13 13
< 50 MWe 72 22 4 2Condensing
power Others> 50 MWe 78 15 6 1
Forest industry BFB boilers All 29 38 25 8
< 50 MWfuel 33 39 17 11Solid fuels
> 50 MWfuel 85 9 5 0
< 50 MWfuel 16 28 16 41
50–100 MWfuel 76 12 8 6
District heating
& CHPOther fuels
> 100 MWfuel 91 8 1 0
The average loading distributions (Table 1) are defined for emission factor calculations and they are
relatively uncertain. In addition, loading levels of combustion plants are plant and time dependent and
vary from one plant to another. Therefore, this data should only be used as an average, not for single
plants. In the case of industry, load distributions presented should be considered as examples rather than

10
averages, because sample size was small.
Figure 1 presents average temperatures in the measured boilers as a function of boiler load, and Table 2
gives an overview of the measurements carried out.
Figure 1. Average temperatures in measured FBC boilers as function of load (% of nominal capacity).
Table 2. Overview on the measurements carried out in this study.
PlantSize
[MWfuel]Type Fuels a Emission
control b Purpose c
Duration of
measurements
[days]
A 50 – 100 CFB coal ESP, limestone DH 15
B > 100 BFB peat, biomass ESP CHP (DH) 1
C > 100 CFB peat, biomass ESP CHP (DH) 50
D > 100 CFBpeat, biomass, coal,
REFESP
CHP (industry and
DH)4

11
E > 100 BFB biofuels, peat, REF ESPCHP (industry and
DH)5
F < 50 BFB peat, biomass, REF ESPCHP (industry and
DH)6
G > 100 BFB biofuels, peat ESPCHP (industry and
DH)3
a In this study biomass stands for solid biofuels (e.g. bark) and biofuels for all biofuels (e.g. bark and
sludge).b ESP indicates electrostatic precipitator, limestone indicates limestone addition to fluidised bedc DH indicates district heating
Figures 2 and 3 present examples of the measurement results from plants C, D and E. Figures show how
the emissions (hourly averages) varied during measurement periods. Methane emissions were small in
most investigated boilers due to good mixing in the fluidised bed.
Figure 2. CO, N2O and CH4 emissions [mg/MJfuel] and boiler loading from plant C (> 100 MW peat and
biomass firing CFB).

12
Figure 3. N2O and CH4 emissions [mg/MJfuel] from plants D and E (> 100 MW mixed fuels firing CFB
and BFB, respectively).
Most changes in the N2O emissions presented in the figures can be explained by the changes of load or
fuel mix as the figure 4 shows. In figure 4 the measured N2O emissions are given as a function of load but
also divided into different fuel categories if data of temporal fuel use were available. From figure 4 also
the example of the effect of oil firing in boiler start up can be seen. Correlation between N2O emission
and load was notable in all the cases, but changes in the fuel mix results variation to emissions of some
plants.

13
Figure 4. Correlation between boiler load and N2O emissions [mg/MJfuel] in boilers A, B, C, D, E and G
with different fuel mixes.
By using the measurement data and methods described in the section 3.2, Table 3 can be compiled. Plant
F is not presented in the table because the plant could not supply the process data needed for calculations.
Unit conversions for measurement data in the case of this plant had to be done by the Equation [5].
EF = 0.4 * * c / (1- cH2O /100) * (20.9 – 6) / (20.9 - cO2) [5]
where 0.4 is a typical flue gas flow [m3n/MJ] as dry gases reduced to 6 % oxygen content in the case of
peat combustion (Jalovaara et al., 2003), is the density of CH4 or N2O [kg/m3n], c is a measured CH4 or
N2O concentration [ppmvol, wet] and cH2O and cO2 are the concentrations of H2O [%vol, wet] and O2 [%vol, dry],
respectively.

14
Table 3. Average CH4 and N2O emission factors for four loading levels of measured plants.
CH4 [mg/MJfuel] N2O [mg/MJfuel]
Plant EF80+ EF60-80 EF40-60 EF0-40 EF80+ EF60-80 EF40-60 EF0-40
A (CFB: coal) <0.5 <0.5 <0.5 <0.5 13.9 26.7 27.7 0.9 a
B (BFB: peat, biomass) 1.8 - - - 4.3 - - -
C (CFB: peat, biomass) 1.6 1.4 3.6 42.7 b 4.0 7.7 11.8 12.6
D (CFB: biomass 60%, peat
40%) c <0.5 0 - - 9.3 7.0 - -
D (CFB: peat 75%, biomass
24%, REF 1%) c 0 <0.5 - - 8.1 6.9 - -
E (BFB: biofuels, peat, REF) d - - <0.5 <0.5 - - 2.5 4.2
G (BFB: biofuels, peat) d <0.5 <0.5 0.7 - 0 <0.5 <0.5 -
- Indicates that there are no measurement data at that load level. Notation '<0.5' is used in cases where emission factor was between
0.05 and 0.5 (this is due to uncertainties in measurement data in case of small emissions). Notation '0' is used when emission factor
is <0.05.a Oil combustion during boiler start-up.b High value is due to disorder. Disorders, however, should be included in emission factors and therefore this value is used as others.c The main purpose of measurements in plant D was to find out the effect of different fuel mixes on N2O emissions. N2O emission
increased significantly when share of coal in fuel mix was increased (figure 4). Methane emission was low (<0.5 mg/MJ) with all
fuel mixes.d In this study biomass stands for solid biofuels (e.g. bark) and biofuels includes also sludge.
By using the data in Tables 1 and 3 the emission factors of Table 4 can be calculated by Equation 4. For
plant E we made a very conservative assumption that EFn does not decrease with increasing load further
than measured. Thus, emission factors of highest measured load level (50-60 %) were used also for higher
load levels. For plant G emission factors can be calculated for the case where share of 0-40% load is 0%
(>50 MW district heating or CHP plants). For the other cases estimation of load-dependent emission
factors is more difficult, because the effect of partial load on emissions of these boilers is unclear.
However, some conservative approximations for annual emission factors can be made. These
approximations are presented in Table 5.
15
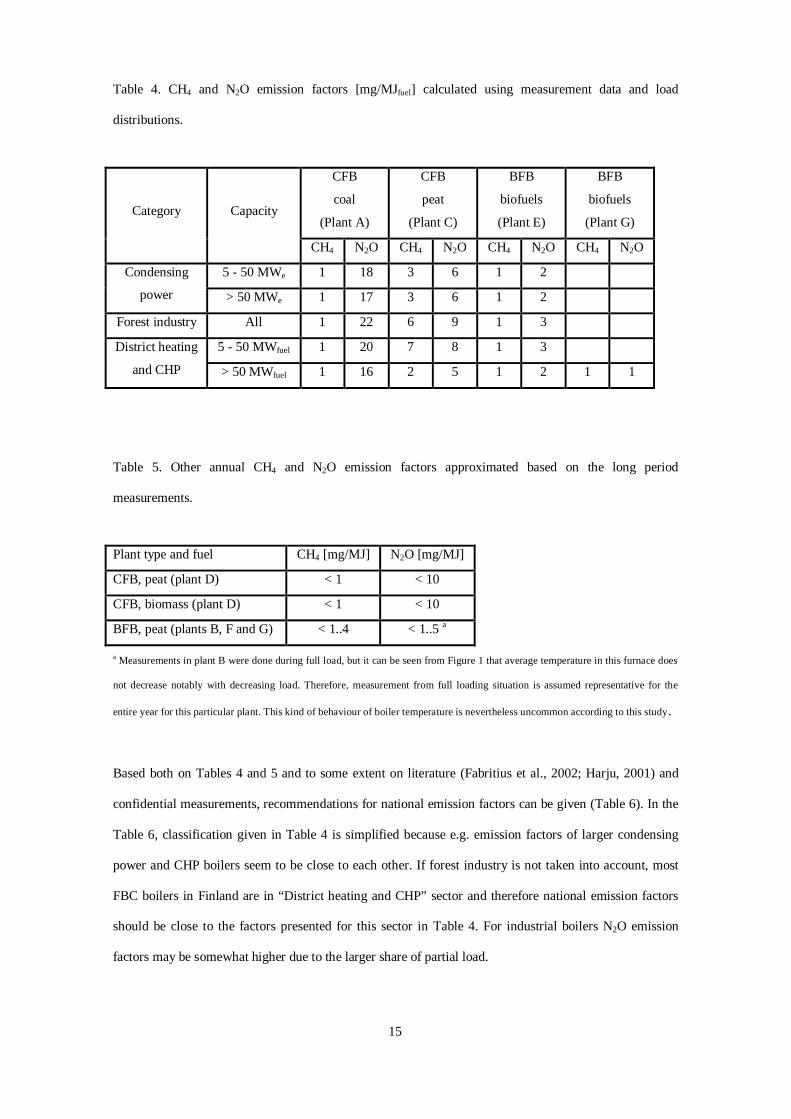
Table 4. CH4 and N2O emission factors [mg/MJfuel] calculated using measurement data and load
distributions.
CFB
coal
(Plant A)
CFB
peat
(Plant C)
BFB
biofuels
(Plant E)
BFB
biofuels
(Plant G)Category Capacity
CH4 N2O CH4 N2O CH4 N2O CH4 N2O
5 - 50 MWe 1 18 3 6 1 2Condensing
power > 50 MWe 1 17 3 6 1 2
Forest industry All 1 22 6 9 1 3
5 - 50 MWfuel 1 20 7 8 1 3District heating
and CHP > 50 MWfuel 1 16 2 5 1 2 1 1
Table 5. Other annual CH4 and N2O emission factors approximated based on the long period
measurements.
Plant type and fuel CH4 [mg/MJ] N2O [mg/MJ]
CFB, peat (plant D) < 1 < 10
CFB, biomass (plant D) < 1 < 10
BFB, peat (plants B, F and G) < 1..4 < 1..5 a
a Measurements in plant B were done during full load, but it can be seen from Figure 1 that average temperature in this furnace does
not decrease notably with decreasing load. Therefore, measurement from full loading situation is assumed representative for the
entire year for this particular plant. This kind of behaviour of boiler temperature is nevertheless uncommon according to this study.
Based both on Tables 4 and 5 and to some extent on literature (Fabritius et al., 2002; Harju, 2001) and
confidential measurements, recommendations for national emission factors can be given (Table 6). In the
Table 6, classification given in Table 4 is simplified because e.g. emission factors of larger condensing
power and CHP boilers seem to be close to each other. If forest industry is not taken into account, most
FBC boilers in Finland are in “District heating and CHP” sector and therefore national emission factors
should be close to the factors presented for this sector in Table 4. For industrial boilers N2O emission
factors may be somewhat higher due to the larger share of partial load.

16
The recommended N2O emission factor for coal CFB firing in Table 6 differs significantly from the
values given in Table 4. The reason for the difference is that in this case also unpublished measurement
data were taken into account. The data showed that N2O emissions of one plant varied between 45 and 12
mg/MJ when the temperature of bed varied between 870 and 920 oC, respectively. Because the typical
bed temperature for this plant is about 900 oC and the average N2O emission factor of plant A is 15
mg/MJ, emission factor 30 mg/MJ is recommended. This is a conservative estimation for Finnish boilers,
because these two plants cover most of the coal combusted in CFB boilers in Finland (excluding co-
firing). The emission factor is, however, strongly the dependent on e.g. temperatures in furnaces and the
type and age of coal and therefore it should not be generalised to other countries without further research
about e.g. furnace temperatures.
Table 6. Recommended emission factors (EF) for Finnish GHG inventory with estimated 95% confidence
intervals (CI).
Size
[MWfuel]
EF
[mg/MJfuel]
CI of EF
[mg/MJfuel]
CH4
CFB, coal > 50 1 <0.5 – 1.4
CFB, peat, biofuels > 50 3 0.6 – 4.8
BFB, peat 5 - 50 4 0.8 – 6.4
BFB, peat, biofuels > 50 2 <0.5 – 3.2
N2O
CFB, coal > 5 30 20 – 50
CFB, peat, biofuels > 5 7 3 – 14
BFB, peat, biofuels > 5 3 1 – 6
The recommended emission factors presented in Table 6 are for combustion of fuels mentioned or for fuel
mixes where only peat and biofuels are co-fired. If even a small share of coal is co-fired, the N2O
emission factors should be increased (figure 4). Small amounts (< 5% of energy input) of REF do not
significantly increase the emission factors presented in Table 6 if significant reduction in combustion

17
temperature is not occurring.
Uncertainties of emission factors arise due to many different reasons. Sources of uncertainty are presented
in the list below in decreasing order of importance, i.e. the first point has the largest effect on total
uncertainty:
representativeness of conditions in measured plants with regard to other plants of the same type
in Finland
uncertainties in average load distributions are due to (1) possible errors in data obtained from
plants; (2) potential unsuitability of one-year-data to present an average load distribution in any
year; and (3) representativeness of plants included in the survey with regard to the total plant
fleet in Finland
uncertainties in measured concentrations [ppm] are around 10%, but for concentrations
<10ppm, uncertainties are around 1 ppm
uncertainties arising from unit conversion from [ppm] to [mg/MJ], where data from plants is
needed, is estimated at 5%
The uncertainties given in Table 6 refer to uncertainties of the average annual emission factor of all plants
in Finland. If the emission factors were used for single plants, uncertainties would be much larger. In
addition, if these emission factors were used in other countries, uncertainties would increase due to
potential differences in fuel mixes, fuel type and quality or plant design, operation and maintenance.
Uncertainties of recommended emission factors are smaller upwards than downwards in most cases. This
is due to conservativeness of developed emission factors.
N2O emission factors presented above contain rather large uncertainties. On the other hand, continuous
measurements may be too expensive for the estimation of emissions. Therefore, we present a method
which gives more accurate emission estimates than emission factors, but is more cost-efficient than
continuous measurements.
Figure 4 presents correlations between N2O emissions and boiler load. Similarly, we can calculate the
correlation between emissions and furnace temperature or load by using measurement data gathered
during one day only. In case of plant C, the relationship between load and N2O emissions can be
described using Equation [6]. The equation is obtained by fitting a straight line to measurement data of a

18
randomly selected day (where enough different load levels exist).
N2O emission = i (-0.028 * Pi + 12.12) kg [6]
where Pi denotes average fuel load [MWfuel] during each hour, and i is the sum over all the hours that are
of interest, e.g. all the hours in a year.
If we use Equation [6] (which was derived based on measurements carried out during one day only) to
estimate the emissions during the whole measurement period in plant C (50 days), we get an emission
estimate of 4.70 t N2O, whereas continuous measurements during the same period gave an emission
estimate of 5.38 t N2O. The error made when using Equation [6] is thus 13%. This is notably less than the
uncertainties in emission factors.
5 Discussion and conclusions
The results reveal that boiler load has a notable effect on annual N2O emissions from FBC, especially in
the case of boilers that are used to adjust the heat supply to the demand. Currently, FBC as a combustion
technology is increasing its share in many countries due to its advantages. Moist fuels like biomass,
wastes and sludge can be efficiently combusted by FBC. Technology is suitable especially for REF
(recycled fuel) co-firing with other fuels. In-process capture of SO2 and relatively low NOx emissions are
important advantages regarding air pollution. It is to be expected that with the increasingly stringent
future GHG requirements, increasing electrification of developing countries and the growing utilisation of
various-grade biomasses and wastes, FBC will continue to increase its global market share considerably.
In Europe, due to CO2 emissions trading (Official Journal of the European Union, 2003) and increasing
MSW landfilling fees, landfilling prohibition and prices of recycled materials, combined steam and
electricity production in industry is moving from natural gas use towards the utilisation of bark and REF
fuels. Compared to direct MSW combustion, in the co-combustion of REF variation in the fuel quality is
minor. This contributes to better control of emissions but also corrosion problems remain minor, which
allows higher steam temperatures and increased electric efficiency and power to heat ratio. Both the

19
increasing energy prices and the recent EU directive on the promotion of cogeneration (EU, 2004) will
increase the share of CHP. This may increase also the occurrence of partial load among power plants and
due to the fuel flexibility and experiences in CHP production FBC may be one of the key technologies to
be used.
These trends emphasise the need for local studies of N2O emissions of the FBC plants in operation taking
into account furnace temperatures in different conditions (e.g. typical loading levels and fuel mixes) in
order to have accurate estimates of the actual GHG emission levels and the GHG emission reductions to
be achieved if e.g. old coal-fired combustion plants are replaced with new FBC plants operating with
various fuel mixes.
The emission factors recommended for FBC boilers based on this study varied from 1 to 4 mg CH4/MJ
and from 3 to 30 mg N2O/MJ depending of fuel, size class and technology of the boilers. The results show
that N2O emissions from peat and biofuels co-combustion are more dependent on other conditions than on
the share of these components in fuel mix. This is an important result for Finland and presumably also for
other countries where these fuels are co-fired. The share of coal has a major effect on N2O emissions but
the level of emissions is boiler specific mainly because of combustion temperatures and properties of
coal. Co-combustion of coal and biomass reduces N2O emissions compared to 100 % coal combustion
also according to the studies by e.g. Shen et al. (2003) and Leckner et al. (2004), when furnace
temperatures are the same. In practice, temperatures in 100% coal combustion are often higher than in
biomass or co-combustion, where lower temperatures are used due to the behaviour of alkali compounds
of biomass. For example in our study, N2O emissions [mg/MJfuel] from CFB, where 100 % of fuel was
coal (plant A), were smaller than N2O emissions from CFB where 40 % of the fuel mix was coal (plant
D). This was due to differences in combustion temperatures (Figure 1). However, emissions of plant D
increased when share of coal was increased and N2O emissions from both boiler A and D increased with
decreasing load. Figure 4 also presented N2O emissions from oil combustion during the boiler start-up.
The reason for low emissions in this case was high combustion temperature of oil burner, which was used
at its maximum load. At partial load also emissions of some oil burners increase according to
measurements.

20
According to this study, N2O emissions from BFB boilers were smaller than those of CFB boilers, but
varied notably between different plants mainly due to combustion temperatures. For example, N2O
emissions of > 4 mg/MJ were measured from plant B in peat combustion whereas emissions of plant G
were small (<0.5 mg/MJ) for all fuel mixes considered (peat 20 - 100% of energy). In Finland, there are
no pressurised FBC boilers (CFB boilers with high pressure in furnace with a gas turbine after the boiler
increasing power to heat ratio) in commercial use. Globally there are few PFBC boilers and according to
e.g. VTT Chemical Technology (2000) N2O emissions [mg/MJfuel] in coal firing at high load are near to
emission factors presented in this paper for plant A (coal firing CFB). In literature (e.g. König et al.,
1994; Hayhurst & Lawrence, 1992) it is estimated that limestone addition to fluidised bed for SOx
reduction may have a small effect also on N2O emissions. According to measurements of this study, the
correlation between limestone addition and N2O emissions could not be found and it was estimated
insignificant compared effect of fuel mix and temperatures.
We presented also an alternative method to estimate N2O emissions, which was based on measurement
and operation data from one day. Using this method, emissions could be estimated much more reliably
than by using emission factors. The method would be much more cost-efficient than continuous
measurements. Therefore, we recommend using this method, if more accurate data of N2O-emissions
from FBC boilers are of interest, but continuous measurements are considered too expensive.
The effect of load changes on annual emissions was small for largest public boilers, because most of the
fuel used was combusted with >80% load. For many other plant types, the occurrence of partial load is
nevertheless significant and should be taken into account in annual emission factors. The general
assumption that all large boilers are used nearly always at full load seems to be incorrect.
N2O emissions can be significantly reduced by several measures, including fuel selection. Coal
combustion can be reduced by increasing biomass and/or peat co-firing and the share of these fuels in fuel
mix of already co-firing boilers. However, possible decrease in furnace temperatures should be taken into
account when assessing the achievable N2O reduction. In addition, the coal type can often be changed.
Increase in furnace temperature decreases N2O emissions but often increases NOx emissions. However, a
stable temperature at all load levels could reduce N2O emissions without a significant increase in NOx

21
emissions. For example, in the measured boiler G, decreased load did not significantly increase N2O
emissions due to the stable bed temperature. The occurrence of partial load in FBC could also be
minimised.
CH4 emissions from large combustion plants are usually small, but larger methane emissions occur during
disorders and in some plants due to poor mixing. Peat and biomass combustion often results greater
methane emissions than coal or oil combustion. In the case of plant C the peak in methane emissions
occurred concurrently with the great and sudden decrease in fuel consumption. Estimation of frequency
and the effect of disorders is very difficult, and therefore, emission factors derived in this study contain
notable uncertainties. However, these emission factors should include also old and small boilers where
combustion is not as complete as in modern boilers and also frequency of disorders may be higher.
Therefore the recommended emission factors for methane are conservative to avoid underestimating
emissions. CH4 emissions are well correlated with CO emissions which are often continuously measured
by large combustion plants. This correlation could be used to estimate CH4 emissions more accurately,
but the use of this method may be toilsome when compared with the small importance of CH4.
IPCC recommends the use of national emission factors if data are available. This study presented one
method to estimate emission factors and indicated that the national emission factors may be significantly
smaller than given by international organisations even when the load changes and disturbances are taken
into account. For example, the IPCC (2006) gives a default emission factor of 61 mg N2O/MJ for coal
FBC and emission factor 7 mg N2O/MJ for wood and wood waste boilers to be used in absence of
national data. For peat combustion, IPCC (2006) recommends the emission factor obtained in this study
(Finland is the largest fuel peat consumer in the world). In the 1997 guidelines of the IPCC, a default
emission factor of 96 mg N2O/MJ for coal FBC was given (IPCC, 1997). IIASA (Klaassen et al., 2004)
uses an emission factor of 80 mg N2O/MJ in the RAINS model for the combustion of all fuels in FBC.
There are many reasons for relatively large differences between our results and international sources.
International emission factors may be overestimated due to uncertainties in the estimations of these
emissions and the unknown effect of load changes and disorders on emissions globally.
The emission factor presented in this study for coal firing in CFB is relatively low because temperatures

22
in the measured boilers were high. These boilers cover most of the coal fired in CFB boilers in Finland,
and therefore the emission factor is representative for Finland. Low N2O emissions are presented also e.g.
in studies by Kvaerner Power (2004), Orthofer et al. (1996), Rautanen et al. (1997) and VTT Chemical
Technology (2000) where N2O emission factors were smaller than 40 mg/MJ in all presented cases.
However, combustion of some coal types in very low furnace temperatures at small load (below 750 oC,
at 30 % boiler load) has resulted in N2O emission factors above 100 mg/MJ (Hiltunen, 2006).
6 Acknowledgements
This study was made at VTT, Technical Research Centre of Finland. We would like to thank the
organisations which funded this study, namely VTT, Statistics Finland, Association of Finnish Energy
Industries, Finnish Forest Industries Federation, Ministry of Trade and Industry, Ministry of
Environment, Foster Wheeler Ltd and Kvaerner Power Ltd. Our gratitude goes also to persons who
participated in this project in meetings, during measurements and by interviews.

23
REFERENCES
Energy Statistics, 2004. Energy Statistics of Finland from year 2003. Statistics Finland. University Press,
Helsinki.
EU, 2004. DIRECTIVE 2004/8/EC OF THE EUROPEAN PARLIAMENT AND OF THE COUNCIL of
11 February 2004 on the promotion of cogeneration based on a useful heat demand in the internal energy
market and amending Directive 92/42/EEC. Official Journal of the European Union 52/2004. http://eur-
lex.europa.eu/LexUriServ/site/en/oj/2004/l_052/l_05220040221en00500060.pdf (referred 26.9.2006).
Fabritius, M., Korhonen, S., Hoffren, H., Leskelä, J., 2002. N2O and CH4 emissions from different power
plant processes, in: Van Ham, J., Baede, A.P.M., Guicherit, R., Williams-Jacobse, J.G.F.M. (Eds.), Non-
CO2 greenhouse gases: Scientific understanding, control opitions and policy aspects. Millpress,
Rotterdam, Netherlands, pp. 67-72.
Harju, T., 2001. Material streams in wood energy combustion, in: Alakangas, E. (Ed.), Yearbook of
Wood Energy Technology Programme, 2001. Otamedia Oy, Espoo, Finland, pp. 389-394 (in Finnish with
English abstract).
Hayhurst, A., Lawrence, A., 1992. Emissions of nitrous oxide from combustion sources. Progress in
Energy and Combustion Science 18, 529-552.
Hiltunen, M., 2006. Nitrous oxide (N2O) emissions in fluidized bed boilers. Presentation in ECCP I
Review: Non-CO2 Gases. Brussels, Belgium.
http://forum.europa.eu.int/Public/irc/env/eccp_2/library?l=/eccp_fluorinated/presentations_meeting
(referred 8.2.2006).
Hämäläinen, J., Aho, M., 1996. Conversion of fuel nitrogen through HCN and NH3 to nitrogen oxides at
elevated pressure. Fuel 75 (12), 1377-1386.

24
IEA GHG R&D, 2000. Abatement of other greenhouse gases - Nitrous oxide. Report number PH3/29.
IPCC, 2006. The 2006 IPCC Guidelines for National Greenhouse Gas Inventories. Volume 2: Energy,
Chapter 2: Stationary Combustion. http://www.ipcc-nggip.iges.or.jp/public/2006gl/vol2.htm (referred
26.10.2006).
IPCC, 2001a. The Carbon Cycle and Atmospheric Carbon Dioxide, in: IPCC, Climate Change 2001: The
Scientific Basis. Contribution of Working Group 1 to the Third Assessment Report of the
Intergovernmental Panel on Climate Change. Cambridge University Press, Great Britain.
IPCC, 2001b. Radiative Forcing of Climate Change, in: IPCC, Climate Change 2001: The Scientific
Basis. Contribution of Working Group 1 to the Third Assessment Report of the Intergovernmental Panel
on Climate Change. Cambridge University Press, Great Britain.
IPCC, 2000. Good Practice Guidance and Uncertainty Management in National Greenhouse Gas
Inventories. Chapter 2: (Energy). Intergovernmental Panel on Climate Change (IPCC), Hayama, Japan.
http://www.ipcc-nggip.iges.or.jp/public/gp/english/2_Energy.pdf (referred 1.12.2005).
IPCC, 1997. Revised 1996 IPCC Guidelines for National Greenhouse Gas Inventories. Reference manual,
Chapter: Energy. http://www.ipcc-nggip.iges.or.jp/public/gl/invs6a.htm.
Jalovaara, J., Aho, J., Hietamäki, E., Hyytiä, H., 2003. The Best Available Technology (BAT) in 5-50
MW combustion plants in Finland. Finnish environment institute (SYKE). SY649.
http://www.ymparisto.fi/download.asp?contentid=3708&lan=fi (referred 2.11.2005, in Finnish with
English abstract).
Kilpinen, P., Hupa, M., 1991. Homogeneous N2O chemistry at fluidized bed combustion conditions: A
kinetic modeling study. Combustion and Flame 85, 1-2.
Klaassen, G., Amann, M., Berglund, C., Cofala, J., Höglund-Isaksson, L., Heyes, C., Mechler, R., Tohka,

25
A., Schöpp, W., Winiwarter, W., 2004. The Extension of the RAINS Model to Greenhouse Gases. IIASA
Interim Report IR-04-015. Laxenburg, Austria.
Kramlich, J., Linak, W., 1994. Nitrous oxide behaviour in the atmosphere, and in combustion and
industrial systems. Progress in Energy and Combustion Science 20 (2), 149-202.
Kvaerner Power, 2004. Measurement results from Kvaerner CFB boiler. Personal communication with
Roppo, J.
König, J., Klinge, T., Schimkat, A., 1994. Emissions of N2O from Rhenish Brown Coal Combustion in a
1.2 MWth Circulating Fluidised Bed Chamber, in: Hupa, M., Matinlinna, J. (Eds.), Proceedings of the 6th
International Workshop of Nitrous Oxide Emissions. June 7-9, 1994, Turku, Finland. Åbo Akademi
University, Turku, Finland. Pp. 59-78.
Leckner, B., Åmand, L.-E., Werther, J., 2004. Gaseous emissions from co-combustion of sewage sludge
and coal/wood in a fluidised bed. Fuel 83 (4-5), 477-486.
Löffler, G., Vargadalem, V., Winter, F., 2002. Catalytic effect of biomass ash on CO, CH4 and HCN
oxidation under fluidised bed combustor conditions. Fuel 81 (6), 711-717.
Mattila L., Saastamoinen J., Helynen S., Hämäläinen J., Mäkinen T., Lohiniva E., McKeough P., Wolff
J., Nordman H., Tuunanen J., Sipilä K., Tuhkanen S., 2001. Energy production technologies, in: Kara,
M., Hirvonen, R., Mattila, L., Viinikainen, S., Tuhkanen, S., Lind, I. (Eds.), Energy Visions 2030 for
Finland. Edita Plc, Helsinki, Finland.
Ministry of the Environment, 2004. Greenhouse Gas Emissions in Finland 1990-2002. National Inventory
Report to the UNFCCC Secretariat. Common Reporting Formats (CRF) 1990-2002 and background data
of inventory. Ministry of the Environment, Helsinki.
Moritomi, H., Shimizu, T., Suzuki, Y., Ninomiya, Y., Naruse, I., Ono, N., Michiaki, H., 1999.

26
Measurement of N2O emission from commercial scale and bench-scale coal fired fluidised bed
combustors. Proceedings of the 15th International Conference on Fluidised Bed Combustion. Paper No.
FBC99-0036.
Official Journal of the European Union, 2003. Common Position (EC) No 28/2003 adopted by the
Council on 18 March 203 with a view to adopting Directive of the European Parliament and of the
Council establishing a scheme for greenhouse gas emission allowance trading within the Community and
amending Council directive 96/61/EC, Official Journal of the European Union C 125 E/72-95.
Orthofer, R., Knoflacher, H., Zueger, J., 1996. Nitrous oxide emissions in Austria. Energy Conversion
and management 37 (6-8), 1309-1314.
Rautanen, M., Kinni, J., Kokko, A., 1997. Experinece with multifuel industrial scale BFB and Cymic
boilers, in: The future of fluidised bed combustion. VGB technical scientific report. TW212e. VGB-
Kraftwerkstechnik GmbH, Essen, Germany.
Shen, B., Mi, T., Liu, D., Feng, B., Yao, Q., Winter, F., 2003. N2O emission under fluidised bed
combustion condition. Fuel processing technology 84 (1-3), 13-21.
Teir, S., 2003. Steam Boiler Technology. 2nd ed. Helsinki University of Technology. Department of
Mechanical Engineering, Energy Engineering and Environmental Protection Publications. Espoo,
Finland.
UNFCCC, 1998. Conference of the Parties. Report of the Conference of the Parties on its third Session,
held at Kyoto from 1 to 11 December 1997, Document FCCC/CP/1997/7/Add.1, 18 March 1998, Bonn,
Germany.
VTT Chemical Technology, 2000. Optimal utilisation of coal in modern power plants with respect to
control of mass flows and emissions of VOCs/PAHs and mercury (OMPAC). Draft final report. ECSC

27
Coal Research Agreement no. 7220-ED/089.
Åmand, L.-E., Leckner, B., Andersson, S., 1991. Formation of N2O in Circulating Fluidized Bed Boilers.
Energy & Fuels 5, 815–823.