estimating wartime support resource … · 0report documentation page 1prcoleigfm 1. "rort...
TRANSCRIPT

AD-A147 923 ESTIMATING WARTIME SUPPORT RESOURCE REQUIREMENTS V/2STATISTICAL AND RELATED POLICY ISSUES(U) RAND CORPSANTA MONICA CR L 6 EMBRY JUL 84 RRND/N-2163-RF
UNCLASSIFIED F49620-82-C-O618 F/G 15/5 ML
1111 2 .40 111112.8
IIIL .4____ ____
MICROCOPY RESOLUTION TEST CHART
.....................................................................
A RAND NOTE
ESTIMATING WARTIME SUPPORT RESOURCE REQUIREMENTS:
STATISTICAL AND RELATED POLICY ISSUES
Lloyd B. Embry
July 1984
N-2163-AF
Prepared for The United States Air Force
DTIC-'-~F IE CTEv
NO 2 9'~84
Randl
84 11 16 011
The research reported here w'as spnsored by the Directorate of Operational0 Requirements, Deputy Chief of Staff/Research, Development, and Acquisi-
tion, Hq USAF, under Contract F49620-82-C-0018. The United StatesGovernment is authorized to reproduce and distribute reprints for govern-mental purposes notwithstanding any copyright notation hereon.
The Rand Publications Series: The Report is the principal publication doc-umenting and transmitting Rand's major research findings and final researchresults. The Rand Note reports other outputs of sponsored research forgeneral distribution. Publications of The Rand Corporation do not neces-sarily reflect the opinions or policies of the sponsors of Rand research.
Published by The Rand Corporation
- . - .
0REPORT DOCUMENTATION PAGE 1PRCOLEIGFM1. "RORT "UMf 2.GVT ACCESSION NO. RECIPIENTSi CATALOG NUM*ER
N-2163-AF14. TITLE I's" Sub6t#@ S. TYPE OF REPORT A PERIOD COVERED
Estimating Wartime Support Resource Requirements InterimStatistical and Related Policy Issues 4. PERFORMING ORG. REPORT NUBER
7. AUTHOR(e) 4. CONTRACT OR GRANT NUMBER(@)
Lloyd B. Embry F49620-82-C-O0lS
S. PERFORMING ORGANIZATION MNICE AND ADDRESS 10. PROGRAM ELEMENT. PROJECT. TASKAREA 6 WORK UNIT NUMSERS
The Rand Corporation1700 Main StreetSantaMonica,_CA. 90406 ______________
III. CONTROLLING OPPICIR NAIM AND ADDREMSS 12. REPORT DATE
Requirements, Programs & Studies Group (AF/RDQM) July 1984
Ofc, DCS/R&D and Acquisition 13. NUMEtR OF PAGES
Ho UAF Wshinton.D.C. 20330______________14.m MOIORN AECNA AODRESS4'If dUiffont &OW Conditilhd 011800) 15. SECURITY CLASS. (of this report)
Unclassified
I. CLASSIFICATON/D-OWNGRAING0 SCM EDUL S
to. DISTRIBUTION STATEMENaT (of this Aspen)
Approved for Public Release: Distribution Unlimited
17. DISTRIGUTION STATEENT (o el 8A. abrlut mW@mi heb~ Slock int 411NSMft A111110)
No restrictions
III. SUPPLEMENTARY NOTES
IS. KECY WORDS (Cmvi.... an revers side It .w oeosrrd Jdmndfj p look ... mw)
Spare parts Military AircraftFailure Aircraft enginesLogistics planning Military suppliesWeapons systems
20. ABSTRACT (Centimne an... rees ide It nlecesary sad I~dIif 6p bleak Isemlh j
See reverse side
P ORM 43 DJAN 73 47 T1ioN OP 1 Nov e to1 owsoLETi UNCLASSIFIED
SE4CURITY CLASSIFICATION OF TWI1S PAGE (wpm.ow Daa nm)
* wwene

UNCLASSIFIED
SECURITY CLASSIFICATION OF Ti41S PAGIE(Wth. Doe maereOd)
7his Note aUdresses statistical a i. policy"- -" issues cc:,tLdi to impLovinq estimates of
t. tiT suppo-t resource re4uirezents. ItjsLs the cuLreat problem of establishingt!' level of invu;tment in spare enginesfor thE C-5 dircraft to elucidate a numbero these issue-. The author examines the" ass umptions us-I to project peacetimeexperience to 4artime activity levels andcojiclukes tLat peacetinme operatioralexperiment3, c:.upled with engineering1rojections of wartime fdilure rates, could -i1 e jsed to test these assumptions and-rovilT an improved basis for resource.i eiuirewents comrputations.
aucumivv UNCLASSIFIED
16UIYCLAUMPSCAION 07 THIS PAGS(~a, Da Ente,.0
* - ..'.7•-
*66
A RAND NOTE
ESTIMATING WARTIME SUPPORT RESOURCE REQUIREMENTS:STATISTICAL AND RELATED POLICY ISSUES
Lloyd B. Embry
* July 1984
N-2163-AF
Prepared for The United States Air Force
.Accession 'or
'N T IU
r,T1C T.
CI
RmnedSANTA4 t)% 4 A 9A)) :I
* ~AFMVED FOR MIAIC MU21il DISIWH WUNW
- iii -
PREFACE
The Air Force spends several billion dollars annually to procure
the spare parts and other resources needed to support modern aircraft
weapon systems. A large fraction of this investment is used to obtain
assets for support of wartime operations. Because wartime data are not
available to estimate the parameters used in computing wartime support
requirements, these requirements are based on projections from peacetime
experience.
The assumptions used to project peacetime experience to wartime
activity levels have important resource implications, but little has
been done to test them empirically. Peacetime operational experiments,
4coupled with engineering projections of wartime failure rates, could be
*- used to test these assumptions and provide an improved basis for
resource requirements computations.
This Note addresses statistical and policy issues central to
improving estimates of wartime support resource requirements. It uses
the current problem of establishing the level of investment in spare
engines for the C-5 aircraft to elucidate a number of these issues. The
results should be of interest to policymakers concerned with logistics
resource allocation, operational commanders whose wartime capabilities
are affected by statistical assumptions and related policy decisions,
and the personnel responsible for producing requirements estimates.
This work was conducted as part of the study effort "The Driving
1" Inputs and Assumptions of Stockage/Assessment Models" within the Project
AIR FORCE Resource Management Program. The text of the Note has been
accepted by the Rand Graduate Institute in partial fulfillment of the
requirements for the doctoral degree in policy analysis.
% 1r:!i
-v-
SUMMARY
' This Note addresses the issue of forecasting wartime demands for
C-5 engines and proposes use of a combination of engineering
projections and operational experience to improve demand estimates.
File research was undertaken because the analytic basis for the key
assumptions that are currently used to forecast wartime demand is very
weak, even though these forecasts drive requirements for billions of
dollars worth of support resources.
As a case in point, the Air Force budgeted over $3 billion in FY
1983 to buy the exchangeable' spare parts needed to support modern
aircraft. Funding needs are projected to triple over the next few
4 Years. Although the high cost of spares has received a great deal of
attention in the press lately, most of this publicity has dealt with
only one cause of large spares budgets--the high unit costs charged by
some government suppliers. The procedures used to determine procurement
quantities represent another important explanation for high support
costs.
The Air Force has completed a detailed study of the reasons for
growth in spares requirements that focused primarily on methods used to
develop requirements to support peacetime operations. Stocks are also
purchased in peacetime to support the increased operating tempo expected
in time of war. War reserve needs represent a large fraction of the
total "requirement" for any particular item. However, wartime data are
not available to support computation of wartime requirements, so
estimates are based on extrapolations from peacetime data.
The assumptions used to project peacetime experience to wartime
activity levels warrant careful scrutiny. Unfortunately, little effort
has been devoted to this issue, and peacetime operating policies are not
designed to generate the data that would be needed to test them
empirically. The Air Force has reason to be concerned about the
validity of some of these assumptions, and it should consider policy
:-"Exchangeable" components can be repaired and restored to service
after they fail.
.............................................
..........................................'.****

l , "
, .• % . . - .- . . - ' • . . . - • .-. • • • • . . • . . . . . . .
- vi
changes that would make them less difficult to address. The
contemporary problem of estimating the requirement for spare C-5 engines
is used as a vehicle to address these issues.
STATISTICAL ASSUMPTIONS AND REQUIREMENTS ESTIMATES
The most critical assumption embedded in nearly all stockage
requirements methodologies is that the demand for spare parts is
proportional to the aircraft flying program. This relationship, which is* often improperly referred to as the "linearity" assumption, drives
estimates of the stock and maintenance resources needed to support the
surge from peacetime to wartime levels of activity.
Over the years a considerable body of evidence has accumulated
that refutes the "linearity" assumption. Several studies have found that
the demand rate--the number of demands for spare parts recorded per
flying hour--declines with increasing sortie lengths or aircraft
utilization rates. This phenomenon has been observed in both military
and civilian airline data.
The apparent inverse relationship between utilization and demand
rates has been observed across a wide range of components, but it is
particularly well documented for turbine engines used in transport
aircraft. There is a straightforward engineering explanation for this
phenomenon. Power transients, or engine cycles, contribute at least as
much to the stress that leads to engine removal as do engine flying
hours. Hence cycle density, or the cycles per flying hour ratio, should
affect removal rates measured in removals per flying hour.
The training syllabus for fighter pilots is designed to approximate
wartime sortie profiles. Nevertheless, cycle density for tactical
aircraft might increase in wartime as pilots are forced to make frequent
throttle changes in response to tactical developments. Average cycle
density should decrease for bomber and cargo missions because these
aircraft will not be making multiple landings during a single sortie as
they do during many peacetime training missions. This decrease in cycledensity implies a decrease in the wartime engine removal rate. If this
effect is not offset by that of increased time at full throttle, which
would tend to increase the removal- rate, a linear extrapolation of
peacetime demand experience could result in an overstatement of wartime
resource requirements.
AL]i" . =P - - .i '
° , ° ' ° -"". " " . "+ • " , , " . . ' +, " • -
' %,, • • . . .-
Q 7 1 4 77 T - w°.
'0 - vii -
. One obvious alternative to the linearity assumption is to develop
wartime removal rates for different components based on an assessment
of their dominant failure modes and analysis that links these modes to
*.. measures of aircraft utilization. This approach recognizes that:
* The component removal rate observed in peacetime reflects the
combined result of a number of component failure modes,
* At least some of these failure modes can be associated with
aircraft (and component) utilization,
* Utilization patterns in wartime will differ from peacetime
experience,
* Peacetime simulation of wartime operating conditions can
provide a basis for:
Estimating the relationship between utilization parameters and
component life,
Developing logistics parameter estimates for use in wartime
resource requirements computations.
" .SCHEDULING POLICIES AND LOGISTICS DATA
The C-5 is used for both cargo and training missions in peacetime.
Thus there should be a distribution of average cycle lengths in the
S. peacetime data that could shed light on the wartime requirements
-- " .problem. However, day-to-day variability in utilization cannot be used
*. to address this problem, because engine stress is cumulative. Variation
in cycle density over engine "lifetimes"--measured from installation to
removal--is needed to develop a relationship between engine removal
rates and utilization.
*... The Air Force is planning to spend about $100 million for
additional war reserve spare engines to support an expanded C-5 fleet.
This resource requirement is driven by an estimate of the wartime demand
rate. The original intent of this analysis was to exploit natural
[ ,ariability in peacetime mission demands to develop an improved wartime
C-5 (TF-39) engine removal rate estimate.
KA .....-'.%
- . . . i-
- viii -
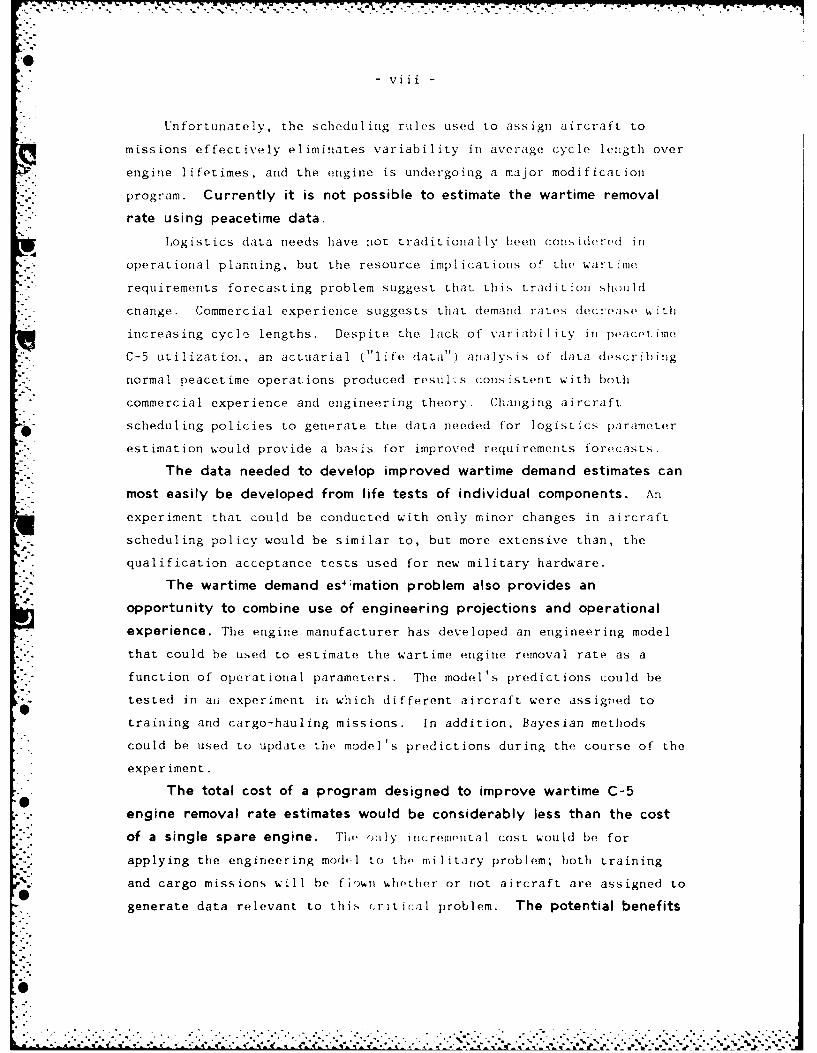
Unfortunately, the scheduling rules used to assign aircraft to
missions effectively eliminates variability in average cycle length over
engine lifetimes, and the engine is undergoing a major modification
- program. Currently it is not possible to estimate the wartime removal
- rate using peacetime data.
Logistics data needs have not traditionally been cons idered in
operational planning, but the resource implications of the wartime
requirements forecasting problem suggest that this tradition sholuld
, change. Commercial experience suggests that demand rates decrease with
increasing cycle lengths. Despite the lack of variability in peacetime
C-5 utilizatioI,, an actuarial Clife data") analysis of data d'scribing
normal peacetime operations produced resu l1s cons istent with both
commercial experience and engineering theory. Changing aircraft
- scheduling policies to generate the data needed for logistics parameter
estimation would provide a basis for improved requirements forecasts.
The data needed to develop improved wartime demand estimates can
most easily be developed from life tests of individual components. An
experiment that could be conducted with only minor changes in aircraft
scheduling policy would be similar to, but more extensive than, the
qualification acceptance tests used for new military hardware.
The wartime demand es4 mation problem also provides an
opportunity to combine use of engineering projections and operational
experience. The engine manufacturer has developed an engineering model
" . that could be used to estimate the wartime engine removal rate as afunction of operational parameters. The model's predictions could be
tested in aiL experiment in which different aircraft were assigzied to
training and cargo-hauling missions. In addition, Bayesian methods
could be used to update the model's predictions during the course of the
experiment.
The total cost of a program designed to improve wartime C-5
engine removal rate estimates would be considerably less than the cost
of a single spare engine. The only inc:remontal cost would be for
applying the engineering modrl to the military problem; both training
and cargo missions will be fiown wiether or not aircraft are assigned to
generate data relevant to this (.rit ical problem. The potential benefits
0•.
. . .-. . . .
- ix-
of such a program could include savings in engine and engine spares
procurement of over $100 million. Savings for other components,
including those used on other types of aircraft, and for other support
resources could increase this total considerably.
IMPROVING REQUIREMENTS ESTIMATES
'ist . tudi,, s~ uggest strongly that the iinearity assumption
overst Ite" ttIrlrime de manlld for the componients used on cargo aircraft, but
it may. rs t it demand for some components used in the tactical fleet.
Nevertheless, t!ce services continue to use this assumption in
requiremets ,.,reputations for all types of aircraft.
There are undoubtedly many explanations for why research
results haver not prompted changes in computational methods. One of the
most important is that the linearity assumption is considered
conservative. A conservative assumption that overstates requirements
* for one type of resource, however, reduces the level of wartime
" -capability that can be obtained for a limited budget; and defense
budgets are always constrained, regardless of what the press would have
us believe. Use of such conservative estimates can limit other aspects
of combat capability through an overcommitment of limited resources to
.- procurement of support resources for airlift.
Although the data currently available cannot be used to develop a
wartime removal rate estimate for C-5 engines, the necessary data can be
collected at fairly low cost. Increasing pressures on the Defense
budget, compounded by internal pressures to restrain support cost
* growth, demand a rigorous examination of the assumptions that provide
the basis for spares requirements estimates. Hence the Air Force
should implement a program to deal with the specific problem of C-5
engine requirements, as well as other programs to address the more
- "general problem of estimating wartime resource requirements.
0
-± . .
7- 77 .77 - -' I'- - - -- -
AC KNO WLEDG MEN TS
Michael Creasy's experience at Dover Air Force Base enabled him to
address C-5 operations, data sources, and data quality issues with
unusual clarity. D~onald Johnson of the Oklahoma City Air Logistics
Center extracted the data needed for the study. John Fitzgerald of
Headquarters, Air Force Logistics Command explained the engine
requirements Computation arid identified a body of past work that
suggests that cycle density affects engine removal rates. Colonel
William Smiley of the Air Staff served as project officer, and opened
the door to several Air Force organizations.
James Duhig of the Lockheed-Georgia Company described Lockheed's
* engine maintenance analyses and provided a notional wartime route
structure for the C-5 fleet. Richard Young, Manager of the TF39 Engine
* Program at General Electric, explained the results of the engine
Manufacturer's failure analyses. Patrick Sibley of the Northrop
Corporation identified several cases in which cycle density appears to
have affected the demand for engines in peacetime. Stanley Nowlan,
former chief maintenance analyst for United Airlines, recommended an
actuarial approach to the data analysis problem and summarized the
results of some work done at United. Charles S. Smith of the System
Development Foundation helped structure the discussion of the engine
failure process, and Professor Richard Soland of George Washington
University explained some of his past work in Bayesian estimation and
* renewal theory.
Rand colleagues William Rogers, Gordon Crawford, and John Abell
provided a great deal of assistance with statistical problems. Michael
Rich, director of the Project AIR FORCE Resource Management Program,
contributed to the definition of the policy aspects of the requirements
problem. Arthur Alexander's suggestion that the literature on engine
monitoring systems should be relevant to the requirements problem led to
the proposal to combine engineering estimates and operational data to
generate wartime parameter estimates. Milton Kamins located several key
references. Charles Wolf, Jr. arranged the funding needed to complete

-xii-
the study, and Carol Tripp, the "Dean for Students" at the Rand Graduate
Institute, offered continuing emotional support.
I also wish to thank Gail Halverson for doing most of the initial
data processing, and Dee Saenz and Kim Schlotterback for administrative
support early in the study. Barbara Urwin patiently made many changes
and prepared the final manuscript.
Any remaining errors of fact or interpretation are my
responsibility.
. . ..... ... ... ... ... .... ... ... .... .... .... ... ... ... ... .... ... ... ... ... ...
-xiii-
CONTENTSj
PREFACE.............................................................11
K SUMMARY............................................................. v
ACKNOWLEDGMENTS.......................................................xi
FIGURES...............................................................xv
TABLES...............................................................xvii
Section
1. INTRODUCTION...................................................1
Statistical and Policy Issues That Affect RequirementsForecasts....................................................2
The C-S Engine Requirements Problem.......................... 3Outline of the Report..........................................5
II. ESTIMATING STOCKAGE REQUIREMENTS...............................6
Weaknesses in the Assumptions Used To Develop StockageRequirements.................................................10
Wartime Failure Rates of Aircraft Engines.....................12
III, AIRCRAFT TURBINE ENGINE RELIABILITY.......................... 13
Reasons for Engine Removal.....................................13*Measuring Engine Stress........................................15
Implications of the Mission Profile for the EnieFalrLRate....................................................... 17VAirline Engine Removal Experience............................. 19
An Engineering Model of the Engine Failure Process............21
IV. C-S ENGINE UTILIZATION DATA AND EXPLORATORY DATA ANALYSIS . 24
V. ESTIMATING WARTIME REMOVAL RATES..............................32
Statistical Analysis of Engine Utilization Data...............33KA Survival Analysis of Engine Removal Data................... 36Estimating the Parameters of a Weibull Distribution.......... 42
6-
S -xiv-
VI. GENERATING DATA FOR LOGISTICS PARAMETER ESTIMATION............46
*An Approach to the Experimental Design Problem................46A "Clinical Trial" of Engine Treatment Alternatives .... 49Testing and Updating Predictions of the GE OPSEV Model ... 56
VII. FORECASTING LOGISTICS RESOURCE REQUIREMENTS: POLICYIMPLICATIONS................................................. 59
Airlift Analogies to the C-S Engine Requirements Problem . 60* .Analogies in Other Settings.................................. 62
Other Applications of Life Test Results.......................63Engineering Projections vs. Operation~al Experience............64Incentives for Change........................................ 65
* . Appendixes
A. SENSITIVITY OF REQUIREMENTS TO PARAMETER ESTIMATES............69
B. THE GE OPSEV MODEL........................................... 75
C. DATA PROCESSING.............................................. 78
D. BAYESIAN ANALYSIS OF REMOVAL DATA..............................83
BIBLIOGRAPHY........................................................ 89
0.
16
- X7V
FIGURES
1. The Aviation Logistics Support System ...................... 8
2. Requirements Sensitivity to Parameter Estimates ............ 9
3. Typical Mission Sortie Profile ............................. 16
4. Representative Training Sortie Profile ..................... 17
5. Commercial Engine Removal Experience ....................... 20
6. Air-line Engine Removal Experience vs. OPSEV ModelPredictions ................................... 2............ 23
7. Monthly C-5 Flying Hours and Landings ...................... 27
8. Monthly Average Time Between Landings.........................27
9. Monthly Average Sortie Lengths ............................. 28
10. Flying Hours vs. Sorties to Removal ........................ 28
11- "Lifetime" Average Sortie Length ........................... 29
12. "Lifetime" Average Time Between Landings ................... 30
13. Percentage of Engines Removed by Age Interval .............. 37
14. Cumulative Percentage of Engines Removed ................... 38
15, Conditional Probability of Removal by Age Interval ......... 39
16. Survival Curves for Different Cycle Lengths ................ 40
17. Mean Time Between Removal for Different Cycle Lengths ...... 41
18. Weibull Probability Plot ................................... 44
19. Predicted and Observed Survival Curves ..................... 45
20. Exponential and Weibull Survival Curves .................... 57
A.-. Stockage Requirements with Varying Demand Rates............ 72
A.2. Stockage Requirements with Varying Demand Rates and Reduced
Pipeline Time .. .............................................. 72
5,}2
I - xvii-
TABLES
1. Sample Size Requirements for the Logrank Test..................51
A.l. Pipeline Times Used for TF39 Engine RequirementsComputations.................................................. 70
A.2. Effects of Changing Parameter Values............................71
B.1. OPSEV Model Inputs..............................................77
B.2. OPSEV Predictions for Other Applications........................77
I. INTRODUCTION
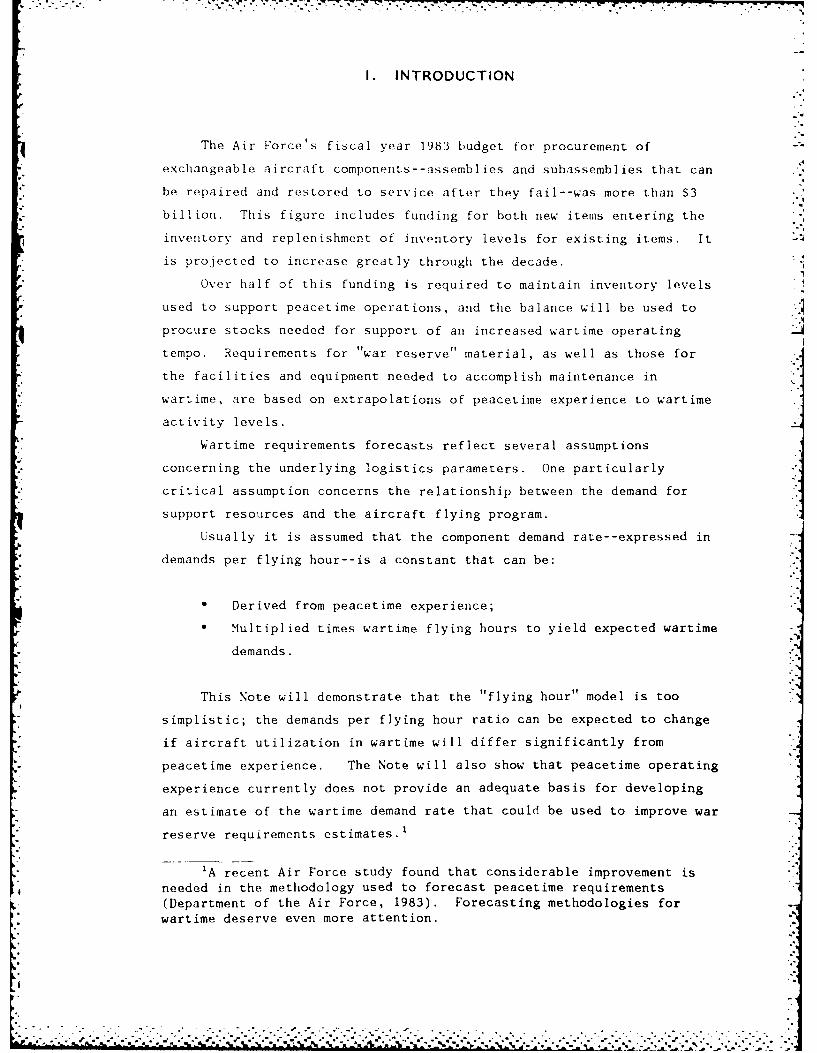
The Air Force's fiscal year 1983 budget for procurement of
exchangeable aircraft components--assemblies and subassemblies that can
be repaired and restored to service after they fail--was more than $3 ."
billion. This figure includes funding for both new items entering the
inventory and replenishment of inventory levels for existing items. It
is projected to increase greatly through the decade.
Over half of this funding is required to maintain inventory levels
used to support peacetime operations, and the balance will be used to
procure stocks needed for support of an increased wartime operating "
tempo. Requirements for "war reserve" material, as well as those for
the facilities and equipment needed to accomplish maintenance in
wartime, are based on extrapolations of peacetime experience to wartime
activity levels. .w
Wartime requirements forecasts reflect several assumptions
concerning the underlying logistics parameters. One particularly
critical assumption concerns the relationship between the demand for
support resources and the aircraft flying program.
Usually it is assumed that the component demand rate--expressed in
demands per flying hour--is a constant that can be:
" Derived from peacetime experience;
* Multiplied times wartime flying hours to yield expected wartime
demands.
This Note will demonstrate that the "flying hour" model is too
simplistic; the demands per flying hour ratio can be expected to change
if aircraft utilization in wartime will differ significantly from
peacetime experience. The Note will also show that peacetime operating
experience currently does not provide an adequate basis for developing
an estimate of the wartime demand rate that could be used to improve war
reserve requirements estimates.1
'A recent Air Force study found that considerable improvement isneeded in the methodology used to forecast peacetime requirements(Department of the Air Force, 1983). Forecasting methodologies forwartime deserve even more attention.

-2-
STATISTICAL AND POLICY ISSUES THAT AFFECTREQUIREMENTS FORECASTS
From an engineering standpoint, the assumption that demand is
strictly a function of aircraft flying hours is very tenuous. Operating
time can result in aging that may increase the probability of failure
for some components. However, most failure mechanisms are considerably
more complex, and the factors that affect component reliability
undoubtedly vary across component types. For example, the life of
electronic components is probably affected more by the number of power
surges to which they are subjected than operating hours; landing gear
life should be influenced primarily by takeoffs and landings; and engine
* "life should be affected by rotational speed changes, which are
accompanied by heat transients and pressure changes.
Operating time provides an adequate proxy for these factors for
peacetime requirements computations because of a peculiar institutional
feature of peacetime operations. Because operating patterns do not vary
.* much from one year to the next in peacetime, the ratio of sorties,landings, etc. to flying hours is quite stable over time. Flying hours
can therefore serve as a proxy for these other kinds of stresses. In
wartime, however, there will be radical changes in the way aircraft are
used. Therefore, even if the operating time proxy is adequate for
projecting peacetime requirements, it probably is not sufficient for
projecting wartime demand. The stockage requirements methodology for
wartime must take account of the underlying failure mechanism if it is
to generate reasonable estimates of wartime needs.
Aircraft are used in various peacetime missions, but they do not
generate the data needed to forecast wartime requirements because key
utilization measures, such as sortie length and time between landings,
. do not vary much across aircraft during a year. The data needed to
generate improved wartime forecasts could be generated from peacetime
operations but are not because the need to collect useful logistics data
is not considered in aircraft scheduling policy.
L .. . . . . . .
. . . . . . . . . . . . . . . . . . . . . .

-3-
Current ly aircraft art- as- igned to miss ions based on training
demands and opeit ional comm tmieo s , and no effort is made to commit
specific aircraft Lo parti.ular- pes of missions for extended periods
of time. The effec(t of this scheduling practice is to reduce
variability in utilization statistics over time. In fact, in some cases
reducing variation in utilization is a scheduling objective.
Attempts to assess the validity of, or improve, wartime support
. resource requirements estimates must thus confront several interrelated
issues:
- The statistical assumptions embedded in current requirements
methods have large resource implications;
- The validity of these assumptions has not been established and
cannot be tested because varability in peacetime aircraft
utilization is lacking;
. Current scheduling policies are unlikely to generate the dataneeded in the future;
* Some changes are needed in aircraft scheduling policies to
provide an empirical basis for requirements forecasts.2
. This Note uses the current problem of estimating wartime requirements
for spare engines for the C-5 as a means to elucidate these issues.
:. .*THE C-5 ENGINE REQUIREMENTS PROBLEM
Aircraft engines are the most expensive exchangeable items used by
the Air Force. Estimates of the parameters used to compute engine
requirements have particularly serious resource implications. If the
wartime and peacetime demand rates differ, requirements estimates that
reflect a constant demand rate are erroneous.
This issue is both important and timely. The Air Force is in the
pro(.ess of buying 30 C-5B aircrart to augment the existing fleet of 77.
This aircraft procurement will generate an additional requirement for
spare TF39 engines, as well as the modules and spare parts needed to
repair these ongines.
'" 2Engi,,ering estimates may provide a means to limit the impact ofthese c(hanges.
S.,................

-4-
Air Force records indicate that there are 150 spare TF39 engines,
or nearly one spare per two installed engines, currently in the
* inventory. Some of these "engines" have been cannibalized3 extensively
and now consist of little more than a nameplate. Nonetheless, if spare
* engines were procured for the new aircraft at this same ratio, the cost
for spare engines alone would approach $300 million. The costs of
additional spare engine modules and components would further increase
this investment.
Current plans do not include maintaining this ratio of spares to
installed engines, but the Air Force does plan to buy another 25
engines. If the assumptions and methodology used to size wartime
* inventories result in an overstatement of spares rcquirements, a
* considerable portion of this more than $100 million cost could be
* avoided without undermining established wartime capability goals.
The original objective of this research was to develop an improved
* methodology for estimating wartime logistics parameters and to use this
* methodology to estimate wartime engine support requirements for the C-5.
The hypothesis was that cumulative engine stress could be measured by a
- combination of engine operating hours and engine "cycles," or large
- rotational speed changes.
Unfortunately, the lack of variability in peacetime aircraft
utilization, coupled with a change in the configuration of the TF39
engine, made it impossible to complete this task. This Note presents an
- approach to the problem of estimating wartime support resource
* requirements that would relax the constraints created by limitations of
* the available data. This approach, which uscs a combination of
engineering and peacetime maintenance data, is relevant to the specific
* problem of computing requirements for spare turbine engines used on the
* -C-5 and other aircraft, as well as the more general problem of
* estimating wartime support resource requirements.
3 "Cannibalization" is the use of parts from one engine to repair* another. This maintenance practice consolidates spare parts shortages* to minimize the number of engines out of service. The missing parts
should eventually be replaced, but some TF39 engines have been* cannibalized so extensively that it might be cheaper to purkchase new
ones than to replace all of the miSsing parts.
-5-
OUTLINE OF THE REPORT
Section II describes the parameters used in spares requirements
computations, some of the weaknesses of the assumptions on which
parameter estimates are based, and the computational methodology that
uses these estimates. Section III contains a discussion of the
engineering reasons for engine performance deterioration or failure and
summarizes some of the lessons learned from commercial experience with
aircraft turbine engines. This experience is reflected in an
.. engineering model that has been used to predict engine removal rates in
a variety of applications. Both airline experience and the model's
predict-ions are consistent with engineering explanations of the reasons
for engine removal.
Engineering theory and commercial experience, however, do not
provide an adequate basis for projecting the removal rate for C-5
engines in wartime. Differences between the engines used in commercial
• and military applications, compounded by differences in both utilization
and maintenance practices, preclude direct application of commercial-_ ._data to the military requirements problem. Section IV therefore
describes the Air Force data that were collected to estimate the wartime
C-5 engine demand rate as well as an exploratory data analysis that
... established the inadequacy of available peacetime data for this purpose.
Section V describes an alternative approach to the data analysis
problem--application of actuarial, or "life" data, analytic techniques.
Although the lack of variability in peacetime utilization data also
constrains this approach, the results of the analysis further reinforce
the hypothesis that aircraft utilization affects the removal rate. This
analysis also provides an introduction to some of the issues addressed
in the discussion of a proposal for generating more useful data
presented in Sec. VI.
Section VII addresses the implications of the proposal for
peacetime C-5 operating policies. It also describes some potential
applications of the analytic approach to other aircraft systems and its
". implications for a wide range of support resource requirements.
%%

-6-.4
II. ESTIMATING STOCKAGE REQUIREMENTS
Most stockage requirements methodologies used within the Department
of Defense assume that demand is generated by a simple Poisson process.'
This assumption implies that the probability of having a needed part on
hand when it is required, or the probability of no "stockout" [P(NO)], :1is given by the expression:
s-1 (tkeXt
P(NO) = kt
k=0
where
X = The daily demand rate for the item
t = The time needed to repair and return an item to the operating
forces
k = The number of components tied up in repair or transportation
pipelines"
s = The stock level maintained for the part.
This formula is used to compute both peacetime and wartime requirements.
P(NO) for engines is set at .8 as a matter of policy--engine
requirements" provide 80 percent confidence that an engine will be
available when needed--if the demand process is simple Poisson with
parameter X 2
'The events in a simple Poisson process occur singly and arestatistically independent; the occurrence of one event does not affectthe probability of another event. This is a mathematical description ofa process in which the events are totally random, hence completelyunpredictable. The interarrival times for a Poisson process aredistributed exponentially, and the only parameter that must be specifiedto describe it is the average number of events per period (e.g., flyinghour, day) (Walker, Chaiken, and Ignall, 1979). It is reasonable toassume that the removal process is simple Poisson unless there iscompelling evidence to contradict this assumption (conversation withWilliam Rogers, a statistician at The Rand Corporation, 1980).
21f this formula is applied to each item individually, and theprobability of stockout for each item is set at the same level, theresulting stock level will provide approximately even protection against
...
$~~~~~~~~~~~~~~~.......... ...'. ".".'...:....... .............. '.......-..'.....................•..... ,.....=. . . , " .. :_ € ._."." " ."t . •. . • ' ' '. . . .'. .'.. '.. ... • .. . ... .. .'.'... ".'." 4
-7-
* The assumption that underlies both peacetime and wartime aircraft
component stockage reqUirements estimates is that part removals, hence
demands for stock, are driven by the aircraft flying hlour program.
* . Peacet ime demand experience is converted to a demand rate by dividing
the number of requests for an item (demand) by the number of hours flown
during the period. This rate of demands per flying-hiour is then
4 ~converted to peacetime and war-time Daily Demand Rates (DDRs) by
multiplying it by the projected peacetime and wartime daily flying
programs.
The DDR is used in conjunction with estimates of the length of
resupply pipelines--the amount of time needed to move, accumulate,
* repair, and return failed components to the aircraft--to determine
stockage requirements. The pipeline time used for computing
requirements is a weighted average of the time spent at different
maintenance echelons and in the transportation segments connecting the
other elements of the support system to the flight line.
The logistics system described above is shown graphically in Fig.
*1. Demands for parts to replace items removed at the flight line "pull"
stock from the supply system, and failed components are "evacuated" for
- - maintenance. Components that can be repaired locally are returned to
local supply to satisfy future demands. Those beyond the capability of
stockouts across the inventory. Requirements methodologies for some* - resources use marginal analysis techniques to provide a specified level-. of protection across the inventory rather than a fixed level of
protection for each item.3As was suggested above, one of the key parameters used in
requirements computations is the demand rate, usually expressed in* demands/flying hour. It is useful to distinguish among (1) failures,
(2) removals, and (3) demands. A failure is defined as anunsatisfactory condition. It may be either a functional failure, whichis an inability to meet a specified performance standard, or a potentialfailure, which is an identifiable physical condition indicating thatfunctional failure is imminent (Nowlan and Heap, 1974). Failures lead
* to removals, and usually also generate demands. However, in peacetimenot all removals reflect failure, nor do they necessarily generatedemand. Demand is the event of interest for requirements computationbecause it levies a requirement on the logistics system. The demandrate will exceed the functional failure rate because potential failures(and even some functional failures) are defined by policy. The
peacetime component demand rate is less than or equal to the removalE . rate; the demand rate should equal the removal rate in wartime.
I~%

E4 -. - - -- ' . , ' .."
8
'" local maintenance, or "Not Repairable this Station" (NRTS), are shipped
to the depot to be repaired and returned to central system stocks. They
are transferred back to a base when local inventories are depleted, or
when demands cannot be satisfied from base supply.
* "Pipeline stock, or the expected value of pipeline contents, is
equal to the product of DDR and pipeline time. If spares are not
provided to cover these pipeline requirements, the necessary components
. will be cannibalized from other aircraft, and some aircraft will be
- unable to perform their missions because parts are lacking.
Spares computations also provide protection against stochastic
.- variability in demand and resupply times with "safety levels." The total
stock level is set to provide a specified level of confidence that a
component will be available when needed, or to minimize backorders
subject to a cost constraint, on the assumption that the demand process
is Poisson.
pa Transpo itationI ircraft availability and]dsr toL mission capability
0tim Wole ale Acuiito
g er not reparabe sp epoi
Fig. 1 - The aviation logistics support system
i.lc p
" ",-,'"".. .v "
0
In summary, requirements computations produce stock levels that are
intended both to cover pipelines and provide protection against
-. -stockouts due to variation in pipeline contents. Peacetime experience
is normally the basis for estimating both the DDR and pipeline times.
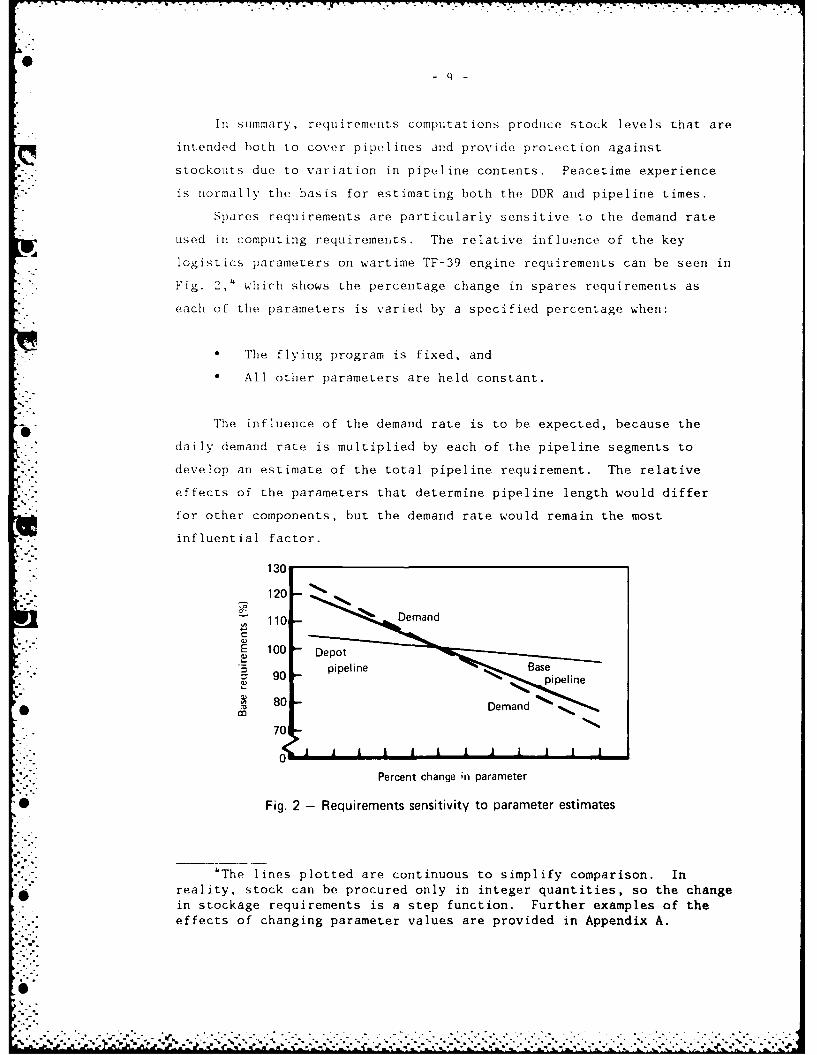
Spares requirements are particularly sensitive to the demand rate
used in computing requirements. The relative influence of the key
logistics parameters on wartime TF-39 engine requirements can be seen in
Fig. 2," which shows the percentage change in spares requirements as
each of the parameters is varied by a specified percentage when:
* The flying program is fixed, and
0 All other parameters are held constant.
The influence of the demand rate is to be expected, because the
daily demand rate is multiplied by each of the pipeline segments to
develop an estimate of the total pipeline requirement. The relative
effects of the parameters that determine pipeline length would differ
for other components, but the demand rate would remain the most
* influential factor.
130
1 1 0 ,
E 100 DepotL- "' 5pipeline Base
90 ipipelin
O 80 Demand
70
0
Percent change in parameter
* Fig. 2 - Requirements sensitivity to parameter estimates
'The lines plotted are continuous to simplify comparison. In*" reality, stock can be procured only in integer quantities, so the change
in stockage requirements is a step function. Further examples of the.' effects of changing parameter values are provided in Appendix A.
%.- * .. K
*. . . . . . . . . . . . . . . . .... . .- .

WEAKNESSES IN THE ASSUMPTIONS USEDTO DEVELOP STOCKAGE REQUIREMENTS
Several past studies have cast doubt on the assumption that
component demand is (or should be) proportional to the flying program.
This assumption is often incorrectly labeled the "linearity" assumption,
even though proportionality is only one of an infinite number of
-' possible linear relationships between flying activity and demand.
Most of these studies have dealt with the effects of changing
sortie lengths (e.g., Casey, 1977; Donaldson and Sweetland, 1968;
Hunsaker, 1977; Kern and Darns, 1966; Sallee, 1974; Shaw, 1982;,
Shurman, 1970), although some have addressed the effects of increasing
aircraft utilization rates with constant sortie lengths (e.g., Embry and
Crawford, 1983). The majority of this work has been based on data
analysis rather than tests of engineering hypotheses, but the data are
* consistent with engineering explanations of the variable failure rate
phenomenon.
These studies suggest that the linearity assumption may lead to an
overstatement of spare TF39 engine requirements. The wartime employment
* of strategic airlift aircraft will differ considerably from peacetime
* experience. Utilization rates (in flying hours per day) will increase
* by a factor of five to six, the sortie mix will shift to favor heavily
* loaded cargo flights rather than lightly loaded training missions,
* average sortie lengths will increase, and the average number of landings
per sortie will decrease greatly. All of these factors can be expected
I to change the demand for engines from that experienced in peacetime.
Although this study emphasizes the problem of estimating the demand
* rate, the assumption that wartime pipeline times will approximate those
experienced in peacetime is also suspect.5 The time needed to repair
I components in wartime could decrease because personnel and facilities
- are utilized more intensively, or might increase if capacity constraints
* cause queuing in the maintenance process. Transportation times can also
be expected to change under wartime conditions. Furthermore,
maintenance policy would probably change in response to wartime demands.
- L! Su
S-.Operational realities would change perceptions concerning the need for
maintenance, as well as the availability of resources to accomplish it.
Finally, the assumption that demand is generated by a simple
Poisson process is questionable. Various data analyses conducted
S..over the years have found that the variance-to-mean ratio of demand
often exceeds that implied by the Poisson assumption and that removals
of some components are not independent events.6
The exponential distribution of service life is characteristic of
Poisson models (Tribus, 1967), and implies that the probability of
failure is independent of age. In contrast, the Weibull distribution
allows recognition of a time-dependent failure rate--an increasing (or
decreasing) probability of failure over time. Several analysts have
concluded that distributions of "lifetime" (time to failure) data for
complex, multi-component items, including aircraft turbine engines, fit
a Weibull distribution (e.g., Barlow and Proschan, 1975; Chorafas, 1960;
Walker, 1980).7
The level of wartime capability attainable for a fixed defense
budget is constrained unnecessarily to the extent that any of these
assumptions result in an overstatement of wartime resource requirements.
Over investment in any one resource category consumes resources that
51n some instances, wartime pipeline times are established bypolicy. For example, spares kits for tactical aircraft have been
computed assuming that local repairs can be accomplished in two days.This would be a difficult goal to achieve even if the necessary
.* maintenance resources were available, but logistics plans do not providefor delivery of these resources until later in the scenario.
6The distribution of a simple Poisson process has a variance that' is equal to its mean. Variance-to-mean ratios greater than one have
been observed in logistics data for several years (e.g., see Feeney, Peterson
" and Sherbrooke, 1963). A ratio greater than unity would result if removalswere hot truly independent events. Because troubleshooting procedures
-- frequently provide ambiguous results, particularly for electronic components,
removals may not be independent. An experienced technician may decide
Ai to replace a component whether or not the component has failed because
replacing it corrected similar problems in the past. Thus a removal may
- reflect the technician's experience, and the probability of removal may
be affected by this experience.7The exponential is a special case of the Weibull distribution.
The more general distribution has also been used to describe other
phenomena (Berretoni, 1962; Weibull, 1951). It is discussed further in
Sec. V.. '-
0~.",

12
could be used more efficiently in other areas (Hitch and McKean, 1960).
These assumptions may lead to an understatement of requirements for some
components, particularly those used on tactical aircraft that will be
subject to greater stress in wartime than they are in peacetime. All of
these assumptions, particularly those affecting wartime demand rate
forecasts, deserve careful attention.
WARTIME FAILURE RATES OF AIRCRAFT ENGINES
Several approaches could be taken to the problem of estimating
wartime turbine engine removal rates. These alternatives include:
- Utilizing data obtained by operators of similar engines (e.g.,
* the airlines) to account for the effects of changing
utilization patterns;
. Applying engineering models of the failure process to project
removal rates as a function of utilization;
* Employing peacetime data to statistically estimate wartime
parameters;
- A combination of the above.
Each of these estimating methodologies is open to criticism. For
* example, military operators are quick to point out the differences
between civilian and military operations; engineering models have never
been considered to be a reliable source of removal rate estimates;
peacetime data obviously do not reflect wartime conditions; and any
combination of the alternatives will inherit the deficiencies, as well
as the strengths, of the individual approaches considered.
Nonetheless, a removal rate estimate is needed to develop war
reserve stockage requirements. Section III presents an engineering
rationale for expecting a change in the engine demand rate in wartime,
summarizes airline experience that supports the engineering hypotheses,
and describes an engineering model that captures the effects of this
commercial experience. Analyses of available military data are provided
in Secs. IV and V.
-~~- -7 - . -
-13
111. AIRCRAFT TURBINE ENGINE RELIABILITY
Turbine engines have been installed on most commercial and military
aircraft manufactured in the last two decades. Considerable effort has
been dedicated to understanding and improving the reliability
characteristics of these engines for both safety and economic reasons.
The subjects of this research have ranged from metallurgy and fluid
mechanics to development of monitoring and diagnostic systems to track
engine operating parameters through the various stages of flight.
Analysis of the data generated across the research spectrum has piovided
engineers with a reasonably good understanding of what causes engine
failures and an ability to estimate engine removals as a function of
* utilization.
The research has not progressed to the point that engineers can
* predict with any certainty when a particular engine will be removed,
partly because there are many reasons for engine removal, and engine
failure is a random process. Dominant failure modes have been
identified, however, and these modes have been associated with
parameters that vary with engine utilization. This section discusses
the effects of utilization on observed engine reliability and its
implications for development of estimates of the wartime engine demand
rate for strategic airlift aircraft.
REASONS FOR ENGINE REMOVAL
0 Engine removal reasons can be divided into two broad classes:
*"Engine-caused" attributable to
- Failure of an engine component or
- Deterioration in engine performance
* Attributable to other causes, such as
-Foreign object damage (FOD)
-Other environmental factors
* - Scheduled (preventive) engine maintenance
-To facilitate other aircraft maintenance
-Cannibalization.
4 -14-
Some FOD results from carelessness, such as leaving a wrench in the
engine, but a much more common cause is ingestion of material from the
runway or a bird while in flight. Thus the FOD rate should be
influenced by the frequency with which the aircraft enters an
environment in which it is at risk to foreign object damage. Other
environmental reasons for engine removal are associated with the
*operational environment.' Presumably most removals that are not engine-
* caused could be postponed during wartime.
Many engine caused removals occur when operating parameters exceed
acceptable limits. For example, an engine may be removed because it has
insufficient turbine inlet temperature (TIT) margin.2
Exhaust gas temperature (EGT) is also watched closely because it is
an indicator of internal wear that reduces engine efficiency. The TIT
* margin will eventually deteriorate, or the EGT rise, to the point that
* the engine must be removed to restore operating tolerances even if no
component failure has occurred.3
Many engines do not "live" to the point that removal will be
* required simply to restore internal tolerances. A failure of one or
more of the engine's internal components is likely to cause a removal
* for corrective maintenance before the engine has an opportunity to wear
'For example, sand may be drawn through the engine during takeoffs* and landings in a desert environment, which would increase component
wear. The effects of such adverse environmental conditions can beestimated for different operational scenarios.
2 "TIT margin" is the difference between observed and allowed-turbine inlet temperature. Engine performance (thrust) can be improvedI by increasing turbine inlet temperature, but only at the expense of the
engine Is useful life. "Trimming" to increase thrust raises temperaturein the engine and may lead to premature failure.
'The number of removals for reasons other than component failuremay also be affected by the frequency of exposure to maintenance, the
* level of workload in maintenance facilities, etc. The maintenanceA activity can exercise some latitude in scheduling a removal when
performance parameters are beyond or near established limits. Hence ithas been suggested that the demand rate may be in part a reflection ofthe workload in maintenance facilities rather than simply a measure ofthe amount of workload than can be expected to be generated.
eR02
0 -15-
out. Failure of one component generally leads to collateral damage in
other parts of the engine, so determining the reason for failure does
not itself identify which components will have to be replaced. An
understanding of primary failure modes, however, can be used to predict
* the number of failures likely to be experienced over some future time.
Further analysis of primary and secondary failure effects cam then be
used to estimate parts requirements.
A primary cause of component failure is - phenomenon known as "low
cycle fatigue," which is usually associated with turbine rotor speed
changes. Additional stress is created by the large heat transients and
pressure changes that occur during takeoff and landing. The number and
duration of such stressful events will influence component, hence
engine, life. This phenomenon is not unique to aircraft turbine
engines; low cycle fatigue is a major concern in other applications
where metal expands and contracts repeatedly. For example, changes in
temperature and pressure in steam generators and piping systems used in
electrical generating plants can result in low cycle fatigue failures.'
Operating hours are not a good proxy for the stress due to low
cycle fatigue, although they may be important to the life of mechanical
components (e.g., bearings). Operating time may also affect the life of
other components. Since failures may be related to hours, cycles, or
both, the problem of estimating "engine caused" failures is one of:
* Identifying engine failure modes;
* Associating appropriate measures of engine utilization with
these modes.
MEASURING ENGINE STRESS
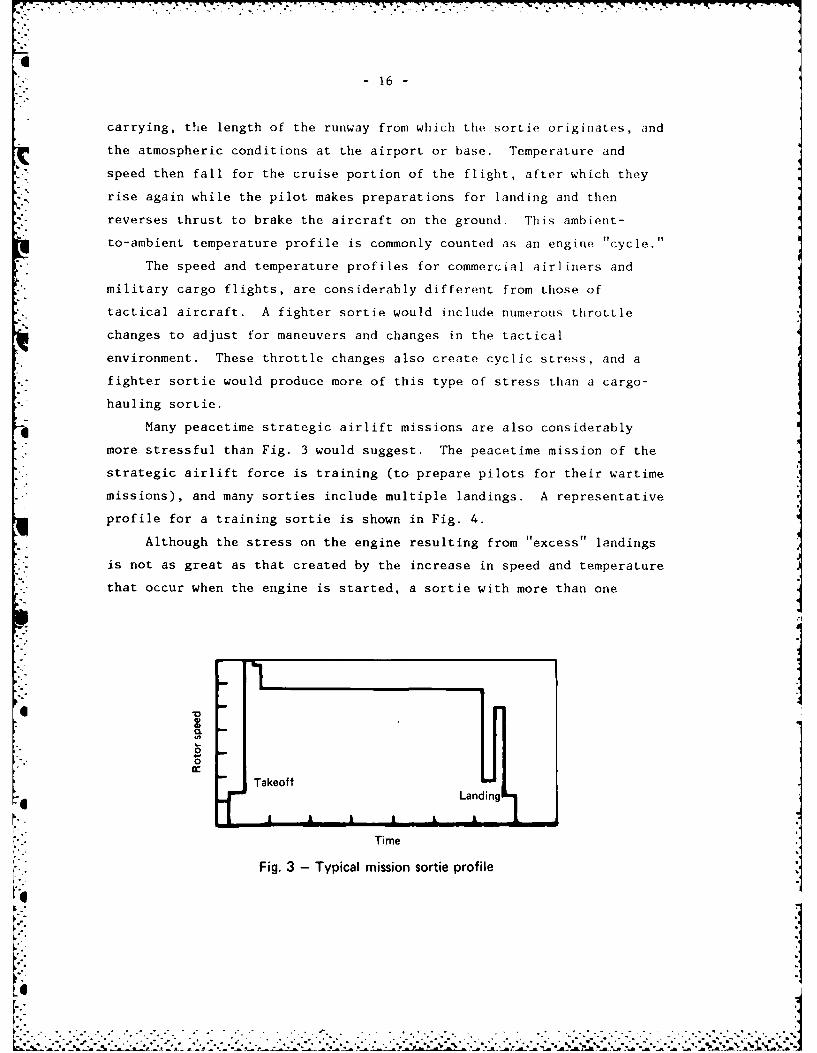
The operating profile for an aircraft turbine engine employed in a
typical (commercial or military) point-to-point sortie is displayed in
* Fig. 3. Starting the engine causes a temperature transient that
continues through the takeoff and climb-out phases of flight; its
intensity and duration is a function of the load the aircraft is
obviously broader than that used for describing turbine engine stress.
An engineer from San Diego Electric pointed out the importance offatigue effects during a conversation with the author during 1983.
I
- 16
carrying, the length of the runway from which the sortie originates, and
the atmospheric conditions at the airport or base. Temperature and
speed then fall for the cruise portion of the flight, after which they
rise again while the pilot makes preparations for landing and then
-- reverses thrust to brake the aircraft on the ground. This ambient-
to-ambient temperature profile is commonly counted as an engine "cycle."
The speed and temperature profiles for commercial airliners and
"- military cargo flights, are considerably different from those of
'. tactical aircraft. A fighter sortie would include numerous throttle
changes to adjust for maneuvers and changes in the tactical
environment. These throttle changes also create cyclic stress, and a
- fighter sortie would produce more of this type of stress than a cargo-
- hauling sorLie.
Many peacetime strategic airlift missions are also considerably
* more stressful than Fig. 3 would suggest. The peacetime mission of the
strategic airlift force is training (to prepare pilots for their wartime
missions), and many sorties include multiple landings. A representative
profile for a training sortie is shown in Fig. 4.
Although the stress on the engine resulting from "excess" landings
is not as great as that created by the increase in speed and temperature
that occur when the engine is started, a sortie with more than one
.° V
00
Takeoff LLanding
Xi
Ti me
Fig. 3 - Typical mission sortie profile
[" -

-17
"Excess" landings
L Ta keo ff Land iri
Time
Fig. 4 - Representative training sortie profile
landing is harder on an engine than a point-to-point sortie.5 In fact,
_ •differences between the planned and actual engine "duty cycle" have been
shown to greatly affect engine deterioration and removal experience
(Birkler and Nelson, 1979; Cote and Birkler, 1979).
Cycle accrual is one of the measures recorded in the C-5 Ground
Processing System (GPS), a data system that records TF39 utilization
statistics (Department of the Air Force, 1981). Training sorties are
counted as two "cycles" in this system. Past studies of airline data
have treated within-mission throttle changes as half-cycles (Byrd,
Barrial, and Kostomay, 1978).
IMPLICATIONS OF THE MISSION PROFILE FOR THE ENGINE FAILURE RATE
Engine life is affected by both environmental factors and
utilization. Based on their understanding of the materials used to
build engines, their analysis of the data accumulated using engine
-.-. monitoring and diagnostic systems, and detailed analysis of both failed
[ . engines and statistical failure data, engine manufacturers have
* identified three primary utilization measures that influence engine
life:
5Training sorties may also create the conditions for a phenomenon
known as "hot rotor reburst." The static elements of an engine coolfaster than rotating elements. Differences in the rate of expansion andcontraction of different engine parts that result from cutting power toidle and then reapplying it can cause rotor blades to "chew out" theturbine case (Wulf, 1980).
p.°.
• ,-,- -- BQI; .? • , . " ° U . . . . .
- 18
0 Cycle accrual;
0 Operating time;
0 Time at maximum operating temperature.
Most of the engine monitoring systems that have been designed to
track engine performance deterioration record measures of these
parameters (see National Aeronautics and Space Administration, 1981).
As is suggested by Figs. 3 and 4, strategic airlift engines will be
subjected to fewer cycles per sortie in wartime than they are in
peacetime. Engine "cycle density," or cycles per flying hour, will
decrease from a peacetime value of about .38 to about .2 in wartime.
Engines may experience longer operating times at maximum temperature in
wartime because the aircraft will be carrying heavier loads and may have
to operate from shorter runways. The extent to which that effect will
offset one attributable to a lower cycle per flying hour ratio has not
been determined.6 However, even in wartime most sorties will not be
flown fully loaded. On balance, the changes in wartime flying should
result in a reduction in the engine-caused removal rate.
Even though the probability of FOD might increase in wartime, the
frequency of exposure to FOD should decrease with decreasing landings
per sortie, so FOD removals per flying hour should not change very much.
Finally, most convenience and scheduled maintenance removals can and
should be postponed during the surge period. The net result is likely
to be a reduction in the engine demand rate observed during wartime.
r.4
6The engine manufacturer computes the percentage of total operatingtime spent at full throttle for a reference and other missions and usesthe ratio of this percentage to estimate the difference between expected
4 removal rates for different mission profiles. Although the time spentat maximum throttle on any given wartime sortie may exceed that for
* peacetime cargo missions, the percentage of total operating time spentat full throttle should not increase much because average sortie lengthswill increase in wartime.
%o.
*..1

- 19 -
AIRLINE ENGINE REMOVAL EXPERIENCE
Turbine engines power the modern jet aircraft used by all of the
.* major airlines. Because propulsion costs represent a considerable
fraction of their total operating costs, airline operators are very
interested in understanding the reasons for engine failure, as well as
the relationship between failure rate and operating parameters. The
"- diversity in route structures within and across airlines also ensures
considerable variability in utilization data. Hence airline experience
is relevant to the military demand rate estimation problem, even if the
results of this experience cannot be used directly to compute military
resource requirements.
Engine and aircraft manufacturers have an even stronger motivation
to understand the factors that drive engine requirements. Their
*customers consider operational reliability an important performance
parameter and may require warranties as a condition of purchase.7 The
*" major engine manufacturers spend a great deal of time and money
-* collecting engine utilization and failure data from all of their
customers, including the military. These data are used for improvement
of existing products and as an input to new designs.
Airline maintenance executives and analysts have long been aware
that maintenance requirements vary with aircraft utilization.
Commercial operators are driven to achieve utilization rates of 12 or
more hours per day, not only because economics dictate that expensive
capital equipment should be fully utilized, but because maintenance
demands per flying hour have been observed to decline with increasing
utilization rates.*
'The military services have also obtained warranties on some oftheir equipment purchases, but experience with such warranties has beenmixed (Gandara and Rich, 1977). Nevertheless, the Congress haslegislated a requirement that most future major procurements includewarranty provisions.
.Conversation with the former Vice President for Maintenance,United Airlines, May 1983. The specific example cited was the Caravellejet. Maintenance costs became intolerable when Caravelle utilizationrates were descreased to less than eight hours per day.
. ..*..,.
S.. . . .. . . . . . . . . . . . . . . . . . . . . . .
f~~~~~...- -. -,.. ...... . . . ... ... ._.. .. .. .. ..
S/
- 20 -
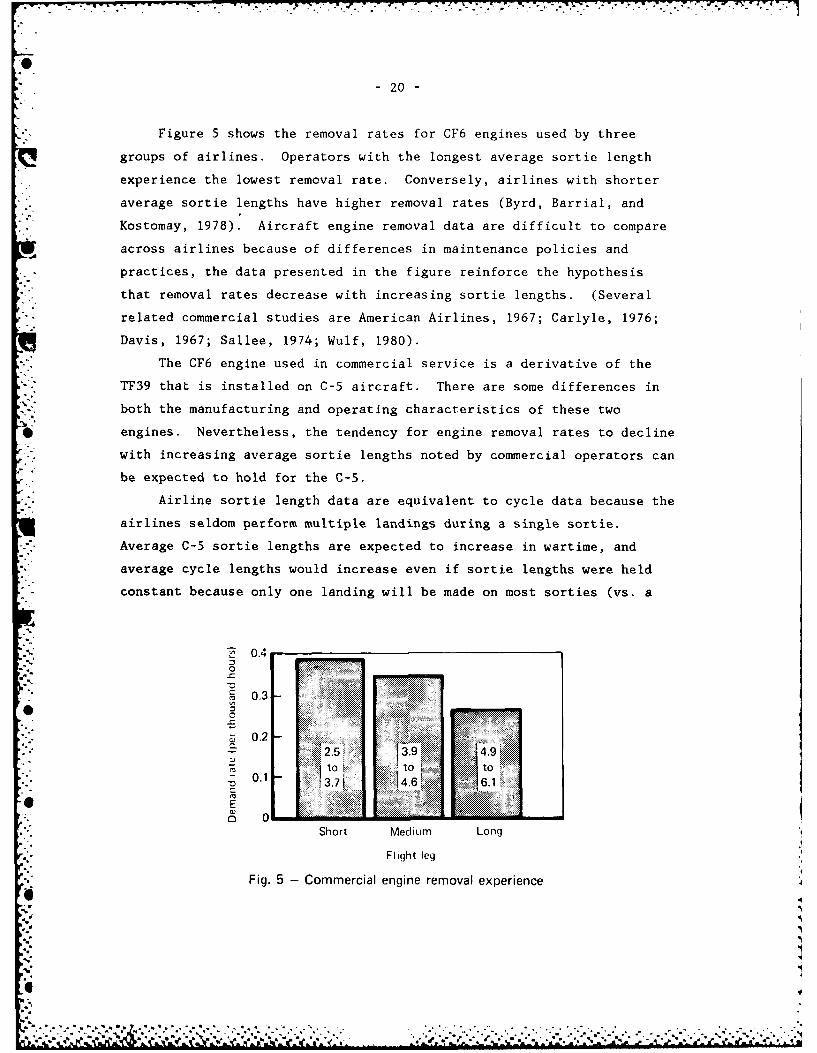
Figure 5 shows the removal rates for CF6 engines used by three
groups of airlines. Operators with the longest average sortie length
experience the lowest removal rate. Conversely, airlines with shorter
average sortie lengths have higher removal rates (Byrd, Barrial, and
Kostomay, 1978). Aircraft engine removal data are difficult to compare
across airlines because of differences in maintenance policies and
* .practices, the data presented in the figure reinforce the hypothesis
' that removal rates decrease with increasing sortie lengths. (Several
related commercial studies are American Airlines, 1967; Carlyle, 1976;
Davis, 1967; Sallee, 1974; Wulf, 1980).
The CF6 engine used in commercial service is a derivative of the
- TF39 that is installed on C-5 aircraft. There are some differences in
both the manufacturing and operating characteristics of these two
*Q engines. Nevertheless, the tendency for engine removal rates to decline
with increasing average sortie lengths noted by commercial operators can
be expected to hold for the C-5.
Airline sortie length data are equivalent to cycle data because the
airlines seldom perform multiple landings during a single sortie.
Average C-5 sortie lengths are expected to increase in wartime, and
average cycle lengths would increase even if sortie lengths were held
constant because only one landing will be made on most sorties (vs. a
0.40- O=
. 0.3
8 0.2 -4C_,
0.1 61:3.71,4.6[
Er 01 - -- ,---- I
Short Medium Long
Flight leg
% Fig. 5 - Commercial engine removal experience
"%
4'":'" """ "" ""''"";""' """ Re~, ,'& ' " " " ",.**J* ** *. " " :*,% i*'.' *.,'""" "~ "" ,--'

-21-
peacetime average of 3.07). This implies that the wartime TF39 removal
rate should be lower than that experienced in peacetime.
Unfortunately, the airline data cannot be used to infer how much of
a reduction in TF39 removal rates should be observed in wartime. Thus
these data merely reinforce the hypotheses that could not be tested
using peacetime C-5 flying data. However, they also encourage further
exploration of alternatives for developing removal rate estimates.
" AN ENGINEERING MODEL OF THE ENGINE FAILURE PROCESS
General Electric has developed an engineering model of the engine
failure-process that reflects the effects of the three types of stress
identified above (Byrd, Barrial, and Kostomay, 1973). It has been used
to predict removal rates under various operating conditions, including
use of the core engine in ship propulsion and pump operating
applications.
The model estimates the failure rate for a particular mission by
comparing the "severity" of the mission to a "reference" mission.
"Severity" is defined as the ratio of failure rates; the objective of
the model is to estimate this ratio based on detailed analysis of
component failure modes and the mission profiles of the "reference" and
comparison missions.
The severity ratio is developed as follows:
* Subdivide the engine into major assemblies;
' Establish reference failure rates for each major assembly based
on:
- Comparison with similar systems
- Failure modes and effects analysis (FMEA)
* Define a reference mission
* Specify comparative missions
* Develop utilization measures (e.g., cycle accrual) for
these missions and estimate their effects on component
removals
[. • . .. . . .
..-. •
| p . . . . . . . * ."*~
-"22
Compute severity ratios by dividing the estimated
failure rates for the comparative missions by that for the
reference mission. A
The key to the analysis is estimation of the relative contributions "
of cyclic and hour effects to the failure rates of the individual
components. These estimates depend on engineering judgment, as it is
* difficult to ascribe failures to a particular type of stress through
either examination of failed engines or data analysis. Hence the model
inputs cannot be verified analytically; the only measure of their
validity is the accuracy of the model's predictions.
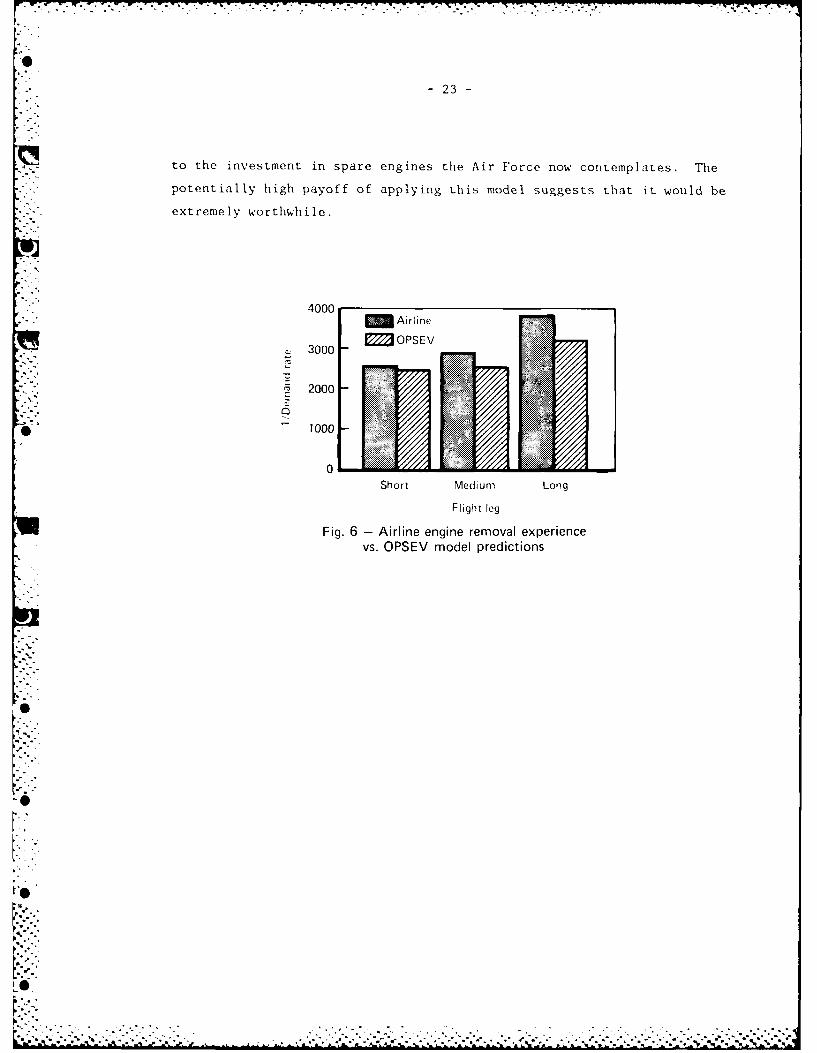
The model's predictions, when compared with actual airline
operating experience, have proven to be remarkably accurate. Figure 6
the reciprocal of the observed demand rates shown in Fig. 5, or the Mean
Time Between Removal (MTBR), in contrast to the predicted values for the
same parameter. The predictions appear to be conservative, and this
tendency increases with increasing flight leg length. The fact that the
predicted removal rates are consistently higher than those observed by
the airlines should allay some Air Force concerns about using this
model. Appendix B provides an additional description of the model and
representative inputs.
The inputs to the model suggest that over half of expected
reference mission failures are attributable to cycle-related stress if
time at maximum operating temperature is held constant. Increasing
cycle density would further increase the relative contributions of
cycles to the total failure rate. This is consistent with the results
of Wulf (1980), which found that both engine cycles and operating time
• .contribute to engine deterioration. Increasing the time at maximum
operating temperature is predicted to increase the failure rate due to
both cycle- and operating time-induced stress.
The parameter values that are needed to drive the engineering model
for the TF39 would differ from those used for the CF6. To apply the
model to the problem of estimating C-5 wartime engine removal rates
aawould require an "up front" investment, but it would be small relative
.4
- 23 -
to the investment in spare engines the Air Force now contemplates. The
.- potentially high payoff of applying this model suggests that it would be
extremely worthwhile.
4000.'- ." M Airlinie
3000 .......
" 2000 ..E
01000
0
Short Medium Long
Flight leg
Fig. 6 - Airline engine removal experiencevs. OPSEV model predictions
I.

-24
IV. C-5 ENGINE UTILIZATION DATAAND EXPLORATORY DATA ANALYSIS
The engineering rationale and airline experience presented in the
preceding sections reinforce the hypothesis that MTBR increases with
decreasing cycle density. Models for projecting the wartime C-5 engine
removal rate, however, should be based on military data.
This section describes the TF39 utilization data that were obtained
to support statistical modeling of the C-5 engine removal process and
summarizes the data processing procedures.' An exploratory data analysis
exposed an important limitation of the data: a lack of variability in
" peacetime aircraft utilization, which is attributable to aircraft
scheduling policies designed to equalize utilization across aircraft.0
DATA DESCRIPTION
The primary source of the data extracted for the analysis was the
Ground Processing System (GPS), a special data collection system
developed for the C-5 that receives input from on-board monitoring
instruments and ground personnel (Department of the Air Force, 1981).
Compared with the data available from other Air Force data systems,
GPS data are fairly clean. Unfortunately, the removal reasons specified
in the relevant Air Force Technical Orders (TOs) generally do not
provide a reliable indicator of engine failure mode, so the failure mode
cannot be determined from the engine histories developed from GPS data
files.
Extracts from two files maintained in the GPS system were used:
Aircraft flying histories, which record daily sorties,
landings, and flying hours by aircraft tail number
Engine installation and removal histories, including removal
reason, by engine serial and aircraft tail number.
KA more detailed description of the data processing is provided inAppendix C.
~......... ........................ ............
-25
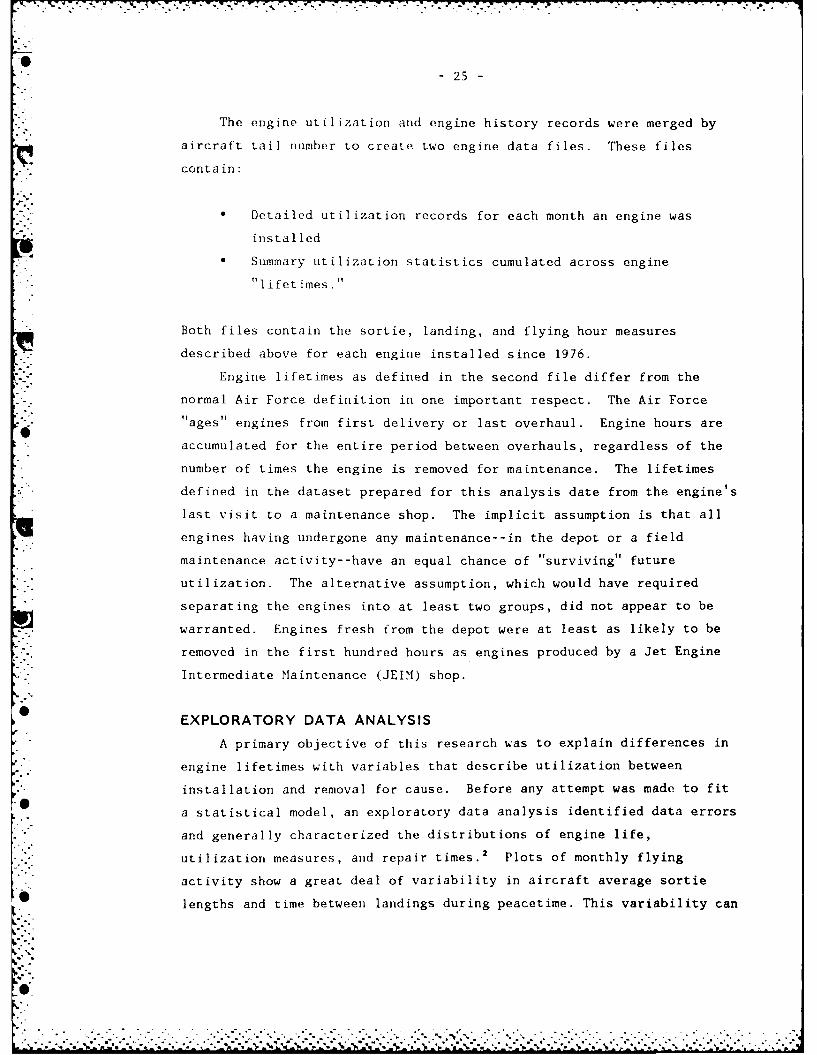
The engine utilization and engine history records were merged by
aircraft tail number to create two engine data files. These files
contain:
* Detailed utilization records for each month an engine was
installed
* Summary utilization statistics cumulated across engine
"lifetimes."
Both files contain the sortie, landing, and flying hour measures
described above for each engine installed since 1976.
Engine lifetimes as defined in the second file differ from the
normal Air Force definition in one important respect. The Air Force
"ages" engines from first delivery or last overhaul. Engine hours are
accumulated for the entire period between overhauls, regardless of the
number of times the engine is removed for maintenance. The lifetimes
-*defined in the dataset prepared for this analysis date from the engine's
last visit to a maintenance shop. The implicit assumption is that all
engines having undergone any maintenance--in the depot or a field
maintenance activity--have an equal chance of "surviving" futureutilization. The alternative assumption, which would have required
separating the engines into at least two groups, did not appear to be
warranted. Engines fresh from the depot were at least as likely to be
removed in the first hundred hours as engines produced by a Jet Engine
Intermediate Maintenance (JEIM) shop.
EXPLORATORY DATA ANALYSIS
A primary objective of this research was to explain differences in
engine lifetimes with variables that describe utilization between
installation and removal for cause. Before any attempt was made to fit
aa statistical model, an exploratory data analysis identified data errors
* and generally characterized the distributions of engine life,
utilization measures, and repair times. 2 Plots of monthly flying
activity show a great deal of variability in aircraft average sortie
+. lengths and time between landings during peacetime. This variability can
o . . . . . . . .... .. . . . . . . ... 9 .- . 9 -.. . .... .
7, 9 9 -

-26-
be seen in Fig. 7, which is a plot of monthly landings vs. flying hours
for all of the records contained in the working data file.
As might be expected, the figure indicates that some aircraft are
used predominantly for long cargo-hauling missions and others are used
primarily for multiple-landing training sorties during any given month.
These two extremes define a "wedge" in the plot that contains all of the
remaining data points. The left side of this wedge shows the maximum
sortie lengths for peacetime cargo missions, and the lower edge
represents the minimum time needed to circle the field between training
landings. The conclusion that some aircraft are dedicated to particular
* - types of missions during a month is reinforced by the frequency
- ,* distribution of average time between landings presented in Fig. 8.
Figure 9 shows the distribution of average sortie length for these
* monthly data. It indicates that most peacetime sorties last from 4 to
5.5 hours. The distribution of time between landings suggests that many
of these sorties include multiple landings. These averages, however,
obscure the true variability in peacetime sortie lengths. A frequency
plot for individual sorties would show greater dispersion than can be
seen in the monthly data.
Even this month-to-month variability is smoothed out over an engine
; lifetime. The lack of variability in the lifetime data can be seen inthe plot of sorties vs. flying hours between removals presented as Fig.
.1 10. The line plotted in the upper right quadrant of the figure shows
the results of a linear regression of flying hours on sorties; the
remainder of the line is covered by the individual data points. The
tight clustering of points around the regression line indicates that
there is little difference in lifetime average sortie length across
engines in peacetime.
The frequency distribution of average sortie lengths shown in Fig.
11 confirms this observation. The distribution is much tighter than
that of the monthly data presented in Fig. 8.
Figure 12 shows the distribution of average time between landings
over installed engine lifetimes. These data are more variable than the
sortie data shown in Figs. 10 and 11 and are distributed differently
than similar monthly data.
2The techniques proposed by Tukey (1977) were used in the initialstages of this analysis.
ip.o. d7
-f. -'. , - ..- - ,- - .
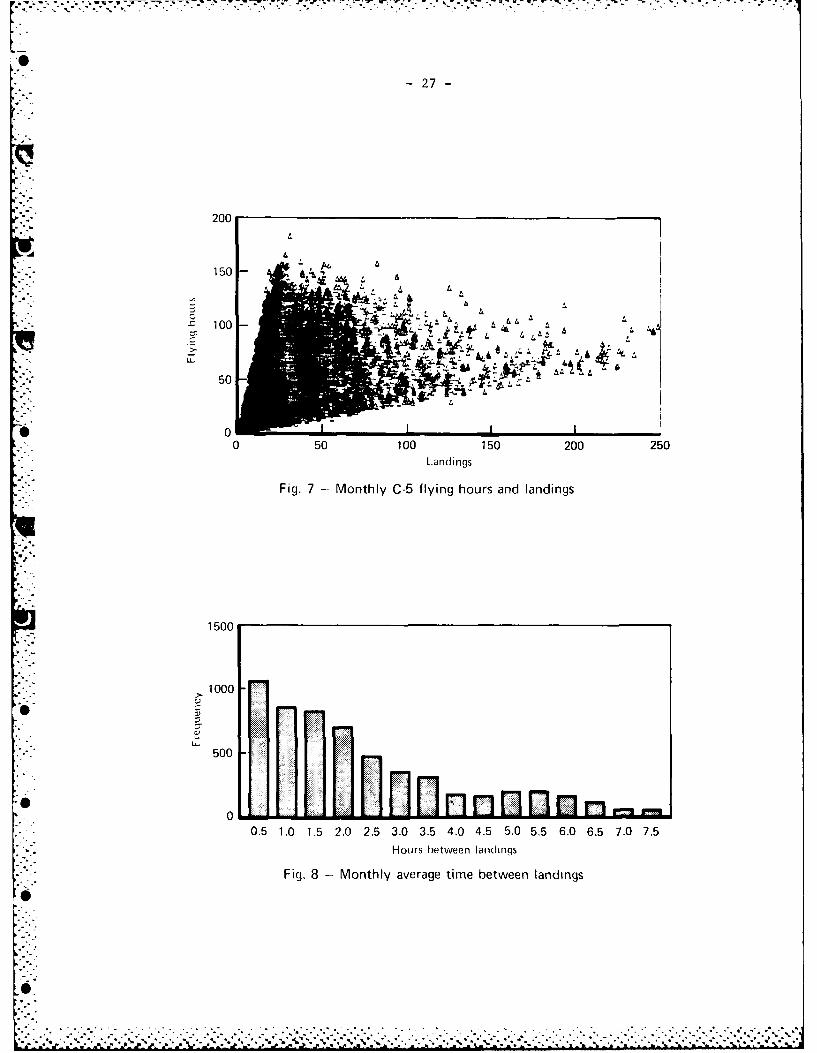
- 27 -
200
LA-* -
50 100 50 200 250
Landings
Fig. 7 -Monthly C-5 flying hours and landings
1500
1000
-*.-. ;. -
500
--iD 0
0.5 1.0 1.5 2.0 2.5 3.0 3.5 4.0 4.5 5.0 5.5 6.0 6.5 7.0 7.5
SHours between andins
Fig. 8 - Monthly average time between landings
150
o
A

.r .--. . -. . - . . - . -_ .- k . < .- . . -. - . ,. i -.. r .. r.. . rr . -. . -x ' ? -. ' -' -' --.
28 -
1000
800
> 600C,
: 400
200
000.5 1.5 2.5 3.5 4.5 5.5 6.5 7.5 8.5
1.0 2.0 3.0 4.0 5.0 6.0 7.0 8.0 9.0Hours
Fig. 9 - Monthly average sortie lengths
2500
&tAh .'
2000it
S 1500 4L0
-- ,
~1000
m 500
"° • 0
0 100 200 300 400 500 600Sorties
Fig. 10 - Flying hours vs. sorties to removal
. . - .. .. . . . . . . . - . - . -. . . " ... . .
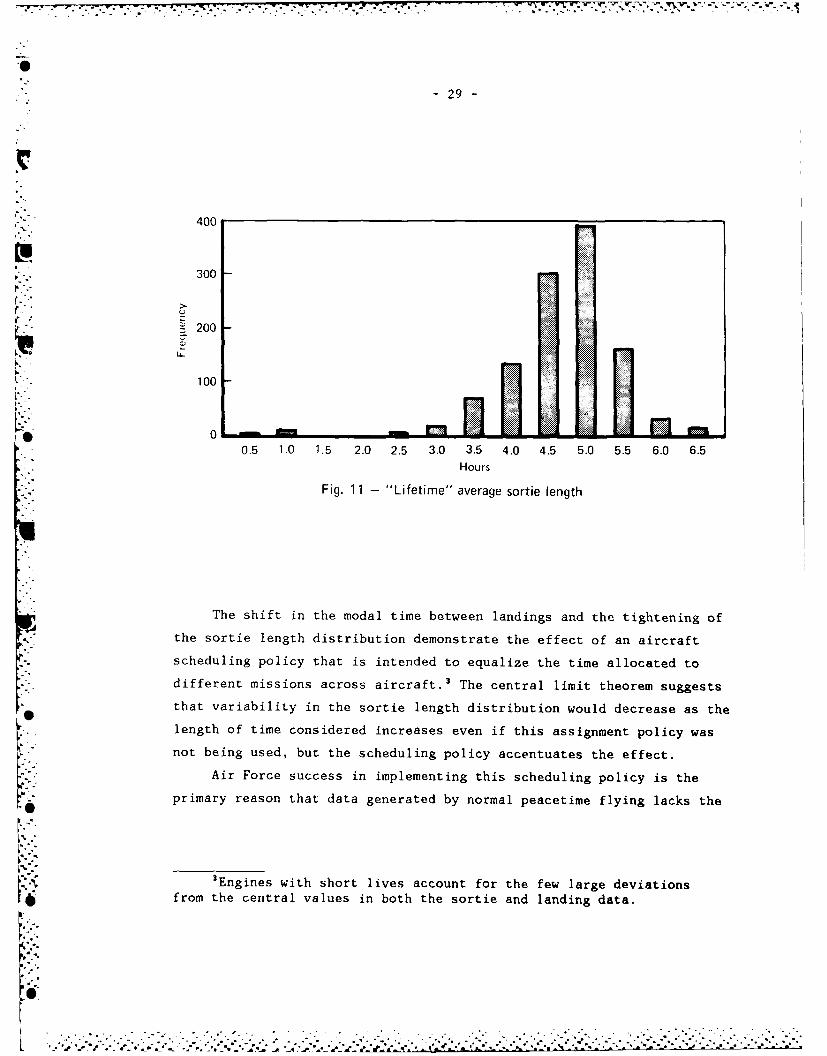
17~~ V---
-i
- 29 -
" 400
300
- 200
100
0.5 1.0 1.5 2.0 2.5 3.0 3.5 4.0 4.5 5.0 5.5 6.0 6.5Hours
Fig. 11 - "Lifetime" average sortie length
The shift in the modal time between landings and the tightening of
the sortie length distribution demonstrate the effect of an aircraft
scheduling policy that is intended to equalize the time allocated to
different missions across aircraft.3 The central limit theorem suggests
that variability in the sortie length distribution would decrease as the
length of time considered increases even if this assignment policy was
not being used, but the scheduling policy accentuates the effect.
Air Force success in implementing this scheduling policy is the
primary reason that data generated by normal peacetime flying lacks the
2Engines with short lives account for the few large deviations* from the central values in both the sortie and landing data.
KP 2 %
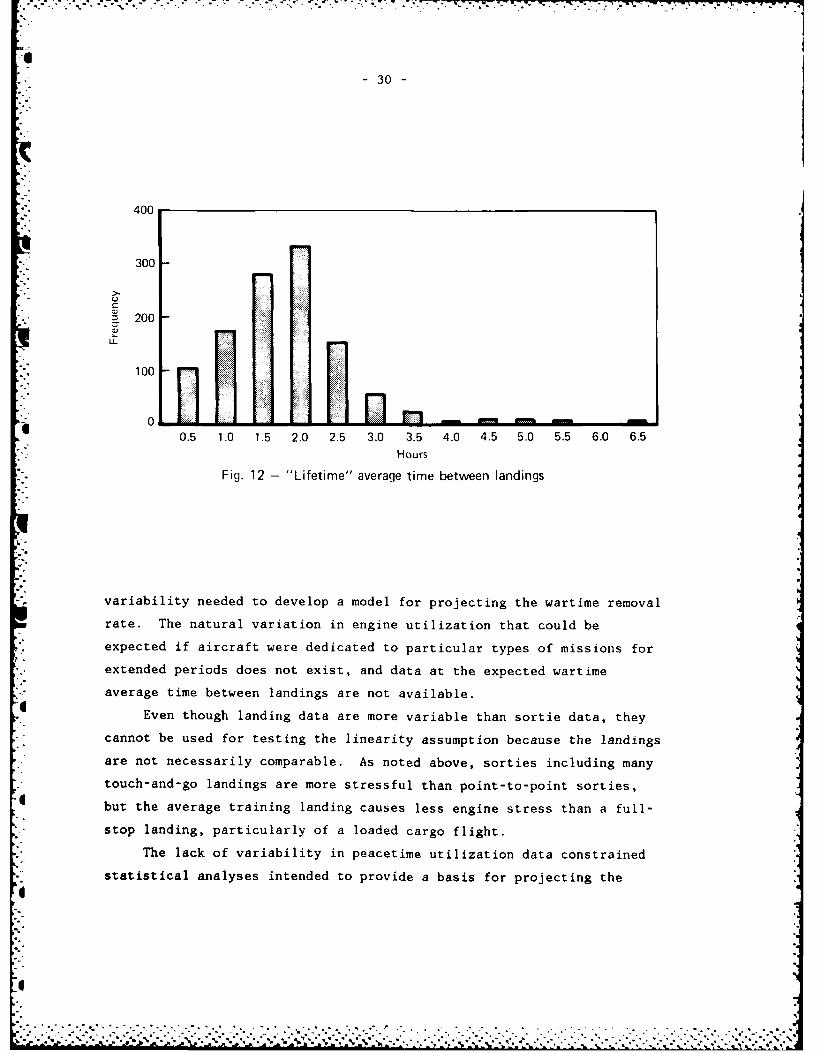
...,.,. -. -.. ..-. .-.- w -.- .- -- .- ., -. , .. - ; .. .: . . :. : = . , / . ,. . . . . . . . ; . > .
67
30 -
400
300
" 200
U-
10:
1 0 J :I I
0.5 1.0 1.5 2.0 2.5 3.0 3.5 4.0 4.5 5.0 5.5 6.0 6.5Hours
Fig. 12 - "Lifetime" average time between landings
.-
variability needed to develop a model for projecting the wartime removal
rate. The natural variation in engine utilization that could be
expected if aircraft were dedicated to particular types of missions for- extended periods does not exist, and data at the expected wartime
-. average time between landings are not available.
Even though landing data are more variable than sortie data, theycannot be used for testing the linearity assumption because the landings
are not necessarily comparable. As noted above, sorties including many
touch-and-go landings are more stressful than point-to-point sorties,but the average training landing causes less engine stress than a full-
stop landing, particularly of a loaded cargo flight.
The lack of variability in peacetime utilization data constrained
statistical analyses intended to provide a basis for projecting the
I
I. . % .- - ., , - % , . ' ' ., .... - ' . - , -, ' -. ' . .. ' . - - ' . " .. .' , , ., - . ' - ' j ' , , .- '
-.. . . . . . . . . . .-.. ... ". . ... .. .*." " ' " -'" '-
-31-
wartime TF39 engine removal rate. The following section provides the
results of these analyses. Although the results are not conclusive
-- because of the limitations in the data, they are consistent with those
described in Sec. III. I
..
0 ,
..- . -. "
• . rr r * ..... *.- - N - C . .I C.bw n - -V
'0
-32-
V. ESTIMATING WARTIME REMOVAL RATES
* If the engine failure process is more complex than suggested by the
simple flying hour model, it should be possible to explain much of the
variability in observed engine life with variables that describe engine
use during the installed lifetime. The analytic model structured to
capture the effects of these other variables could take several forms:
The failure process is purely random; the mean time to removal
for the population is a random variable that can be estimated
from the data,
*-Failure results from a discrete event immediately preceding or
coincident with the failure,
Failure is the result of cumulative stresses on the engine
during its lifetime.
Although each model may apply to some failure modes, none
* adequately describes the engine failure process. If flying hours
- between removals are used as the measure of utilization, the first of
these alternatives could be no more than a restatement of the linearity
assumption. Flying hours do contribute to TIT margin deterioration,
which is at least partially an aging phenomenon, as well as bearing
" wear. The second model describes some catastrophic failure modes,
* particularly FOD. Finally, past research and engineering theory suggest
that cumulative cycles and average cycle length are important measures
of stress. They should help to explain unscheduled removals not
attributable to FOD. Testing the latter type of model was a primary
objective of this research. INot all of the variability in observed engine life can be explained
. with variables other than flying hours because some failure modes
depend partly on operating age. Identification of cycle-related
variables that help to explain variations in engine life would validate
the general hypothesis that the flying hour model is too simplistic and
would provide a partial basis for predicting wartime removal rates. The

| . " ... .
"- - 33-
- data described in the previous section were used in two types of
analyses designed to quantify the effects of such explanatory variables.
STATISTICAL ANALYSIS OF ENGINE UTILIZATION DATA
The objectives of the first of the two approaches to analysis of
the engine data were to:
.. Establish whether engine experience just before the removal
explained engine failure,
-- Develop a model of the removal process using utilization
parameters cumulated over an engine's installed life.
The initial hypothesis was that cycle-oriented utilization measures
cumulated over the installed engine lifetime could be used to predict
engine life. These measures were expected to be more powerful 7
predictors of engine life than experience just before failure because
engineering analyses suggest that engine stress is cumulative. The
first of the two data files described in the previous section was used
to test this hypothesis.
If the removal process is driven by the flying program, it should
' be possible to predict the probability of removal as a function of total
hours accrued on an engine.' Because total hours is the sum of hours
flown in the 30 days before removal and hours accrued before this
-,' period, a model of the form:
Pr (removal) = + A (recent hours) + 2 (past hours) + c
+. can be used to simultaneously test the effects of recent utilization and
total flying hours.
* 'The purpose of this analysis was to establish whether utilizationin the period immediately preceding engine removal influenced theprobability of removal. The unit of observation was an individualengine during each month it was installed, with a categorical variableindicating whether the engine was removed during that month. Linearregression was used to test the relative effects of "recent" and
* "previous" experience. If "recent" hours appeared to have an effect,more rigorous analysis with other analytic techniques would have beenindicated. In addition, the regression results show the effect of themonthly hour accumulation rate. If the removal process is driven byflying hours, the probability of removal should increase with increasingmonthly flying activity.
%.o.
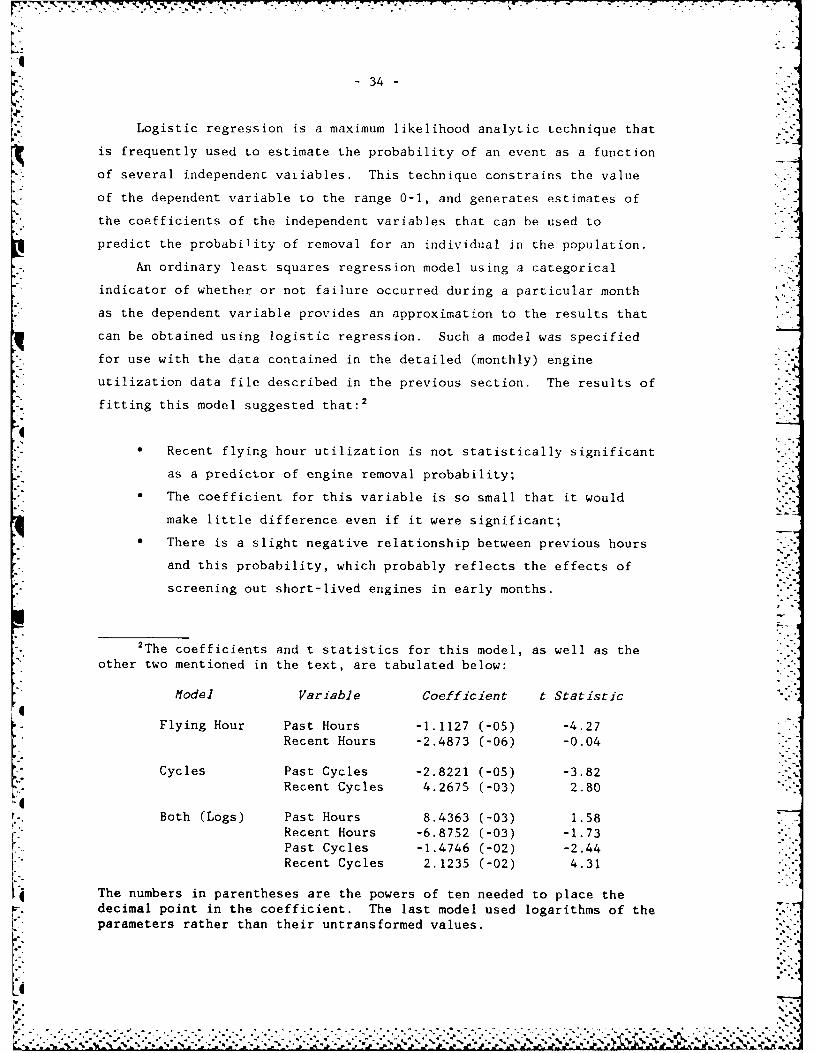
-34-
K" Logistic regression is a maximum likelihood analytic technique that
is frequently used to estimate the probability of an event as a function
*. of several independent variables. This technique constrains the value
of the dependent variable to the range 0-1, and generates estimates of
the coefficients of the independent variables that can be used to
predict the probability of removal for an individual in the population.
An ordinary least squares regression model using a categorical
- indicator of whether or not failure occurred during a particular month
as the dependent variable provides an approximation to the results that
can be obtained using logistic regression. Such a model was specified
for use with the data contained in the detailed (monthly) engine
utilization data file described in the previous section. The results of
fitting this model suggested that:2
Recent flying hour utilization is not statistically significant
as a predictor of engine removal probability;
The coefficient for this variable is so small that it would
make little difference even if it were significant;
There is a slight negative relationship between previous hours
and this probability, which probably reflects the effects of
screening out short-lived engines in early months.
2The coefficients and t statistics for this model, as well as theother two mentioned in the text, are tabulated below:
Model Variable Coefficient t StatisticI
Flying Hour Past Hours -1.1127 (-05) -4.27Recent Hours -2.4873 (-06) -0.04
Cycles Past Cycles -2.8221 (-05) -3.82Recent Cycles 4.2675 (-03) 2.80
Both (Logs) Past Hours 8.4363 (-03) 1.58Recent Hours -6.8752 (-03) -1.73Past Cycles -1.4746 (-02) -2.44Recent Cycles 2.1235 (-02) 4.31
The numbers in parentheses are the powers of ten needed to place thedecimal point in the coefficient. The last model used logarithms of theparameters rather than their untransformed values.
Ld
• %'.%
K. .< .: :.:.:.:...:.. .. .:::::::::.: .. : .:: , ::.,, ..-...,..o , _ _ _ , -::::: : .. :::-.: : -- .v - °:. , -. .: :

-.0
-35-
In contrast, a model that used recent and previous cycles as the
independent variables showed a statistically significant relationship
between recent cycles and removal probability, as did a model containing
both flying hours and cycles. This suggests that cycles are a better
measure of engine stress than engine flying hours, and confirms the " -
relationship expected for engineering reasons.
Since cyclic stress appears to be an important explanator of engine
removals, a model that related the MTBR for an engine population to
cycle-oriented measures of engine utilization could be used to predict
the wartime removal rate. The preferred model would deal with
individual engine removals, and would be of the form:
,MTBR = + (cycle length) + e
0 1
Such a model, however, would be subject to specification error. Total
-" hours is both the dependent variable and the numerator of the fraction
to be used as the key independent variable, so positive correlation
could be expected even if cycle length had no effect. Hence it is not
appropriate to estimate a model of this form.
Although there are no good proxies for either total hours or cycle
length that can be used to avoid this specification problem, a model
using cycles per sortie and sortie utilization rate (in sorties/day) as
independent variables to describe utilization was fitted to the data.
This model, which explained only about 30 percent of the variation in
engine life, suggests that increasing the average number of landings per
. sortie from one to four will reduce engine life by about 160 hours. It
also suggests that increasing the sortie utilization rate can be
expected to increase engine life.3
3 The equation fit to the model was:
"Lifetime" hours = 720.8 - 164.2 (cycles/sortie) + 2757.5 (sorties/day)
Standard error 68.3 37.1 128.5
t Statistic 10.6 -4.4 21.5
Airline experience (see fn 2, Sec. IV) and other analyses (e.g., Bermanet al., unpublished research) do suggest that increasing utilization
decreases removals/flying hour. However, utlization ranged only from.004 to .69 sorties/day, and the bulk of the data was concentrated in
-. . . .. . . . .r° . _ * * * %,': L. . -i :": : ""."': :. ": : -'-L "'':-? ¢ .?- '- -.'-5"ii-: -T -j-2 -: .,.';: :'-:--:29 - .'.-i- .. •-.:--::.:::'-" : -?-? -::.:- :::%
* . . . . . . . . - ' . . .... . . .
*36" 36 -:'
In view of the limitations of both the predictive power of this
model and the data on which it was based, an alternative approach to the
data analysis problem was pursued. The results of this analysis are
described below.
A SURVIVAL ANALYSIS OF ENGINE REMOVAL DATA
The problem of estimating the MTBR of aircraft engines is quite
similar to that faced by the actuary charged with developing life
expectancy tables for insurance underwriting or the biostatistician .
comparing disease treatment alternatives. In fact, actuarial techniques
have been used for the analysis of engine removal and failure data since
World War II (Altman and Goor, 1948).
The actuarial analyst is concerned with the distribution of time to
removal as well as the removal rate, which is simply the reciprocal of
the MTBR for an exponential distribution of time to removal. Figure 13
shows the percentage of engines removed by 100 hr age interval for the
data described in the previous section.4 It suggests that the
probability of removal decreases consistently after an initial increase
during the early stages c engine life.
This decrease is expected, because engines that are removed during
one interval do not have the opportunity to be removed during subsequent
intervals. Although the probability of removal appears to be low for
"old" engines, premature removals would truncate the distribution.
Artificially constraining the distribution could affect the MTBR, hence
the demand rate.
- the rar.ge .05 to .24 sorties/day. It would be inappropriate to use thisresult to project to the expected wartime sortie rate. Furthermore,
- the result may reflect the fact that "good" airplanes are flown more often;causality may be the reverse of that implied by the model. In short,
*O this model should not be used to project removal rates. The solereason for describing it is to show that the effects of both variables,and in particular that used as a proxy for cycle density, are in theexpected direction.
4Splines have been used to connect the data points in the plotsshown in this section. In reality, only discrete step functions can beinferred from the data. Several methods for fairing a smooth curvethrough this step function are described in the literature (e.g., Gans,1982; Miller and Singpurwalla, 1977; Parzen, 1962).
1:z,-
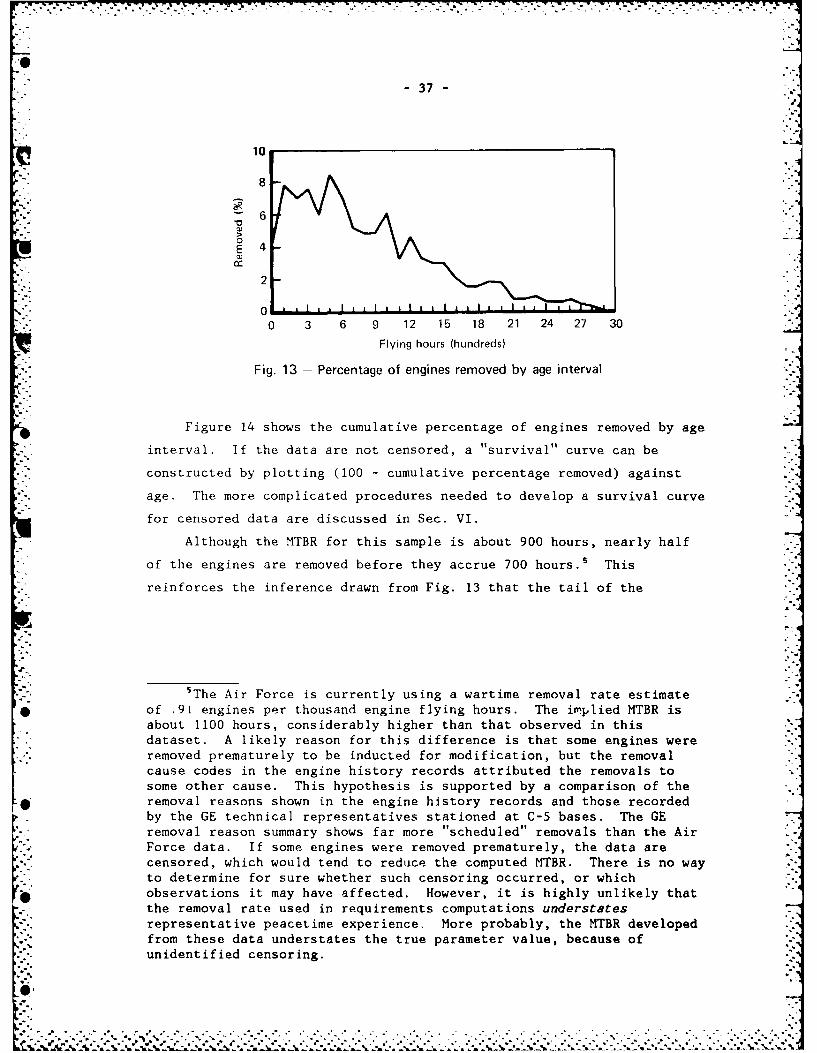
T.. - 7 -. -
-37-
~~~10 k-,
8
6
0
E 4
2
0
0 3 6 9 12 15 18 21 24 27 30
Flying hours (hundreds)
Fig. 13 -Percentage of engines removed by age interval
Figure 14 shows the cumulative percentage of engines removed by age
interval. If the data are not censored, a survival" curve can be
constructed by Plotting (100 - cumulative percentage removed) against
age. The more complicated procedures needed to develop a survival curve
for censored data are discussed in Sec. VI.
Although the MTBR for this sample is about 900 hours, nearly half
of the engines are removed before they accrue 700 hours.5 This
reinforces the inference drawn from Fig. 13 that the tail of the
6The Air Force is currently using a wartime removal rate estimate* of .91 engines per thousand engine flying hours. The im~plied MTBR is
about 1100 hours, considerably higher than that observed i~n thisdataset. A likely reason for this difference is that some engines were
* . removed prematurely to be inducted for modification, but the removalcause codes in the engine history records attributed the removals tosome other cause. This hypothesis is supported by a comparison of the
* removal reasons shown in the engine history records and those recordedby the GE technical representatives stationed at C-5 bases. The GEremoval reason summary shows far more "scheduled"' removals than the AirForce data. If some engines were removed prematurely, the data arecensored, which would tend to reduce the computed MTBR. There is no wayto determine for sure whether such censoring occurred, or which
*observations it may have affected. However, it is highly unlikely thatthe removal rate used in requirements computations understatesrepresentative peacetime experience. More probably, the MTBR developedfrom these data understates the true parameter value, because ofunidentified censoring.
0O
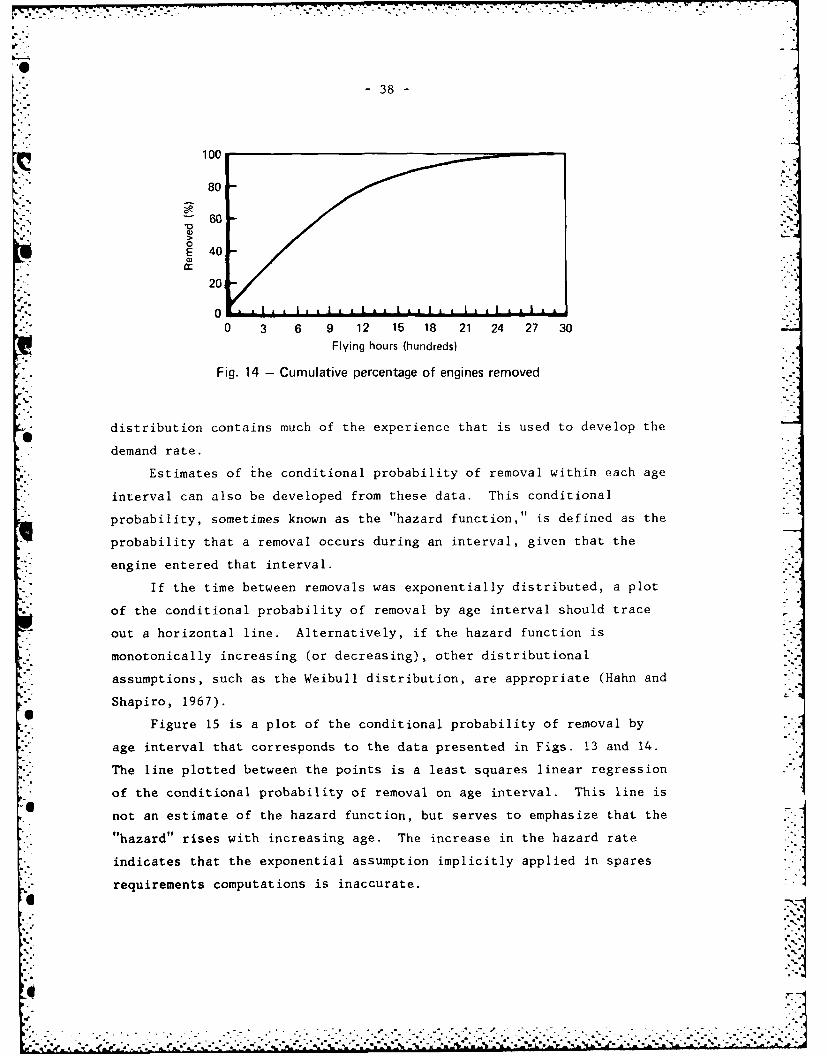
7 -77 7"7
38 -
100
80
60E 40
20
00 3 6 9 12 15 18 21 24 27 30
Flying hours (hundreds)
Fig. 14 - Cumulative percentage of engines removed
distribution contains much of the experience that is used to develop the
demand rate.
Estimates of the conditional probability of removal within each age
interval can also be developed from these data. This conditional
probability, sometimes known as the "hazard function," is defined as the
probability that a removal occurs during an interval, given that the
engine entered that interval.
If the time between removals was exponentially distributed, a plot
of the conditional probability of removal by age interval should trace
out a horizontal line. Alternatively, if the hazard function is
monotonically increasing (or decreasing), other distributional
assumptions, such as the Weibull distribution, are appropriate (Hahn and
Shapiro, 1967).
, Figure 15 is a plot of the conditional probability of removal by
age interval that corresponds to the data presented in Figs. 13 and 14.
• The line plotted between the points is a least squares linear regression
of the conditional probability of removal on age interval. This line is
not an estimate of the hazard function, but serves to emphasize that the
"hazard" rises with increasing age. The increase in the hazard rate
"- indicates that the exponential assumption implicitly applied in spares
requirements computations is inaccurate.
.W-d'~~~~..". ...-. " ..... -.. ".-'.... "-...".'... -.....-... "...-...-.v.'...v"--.--.'.,
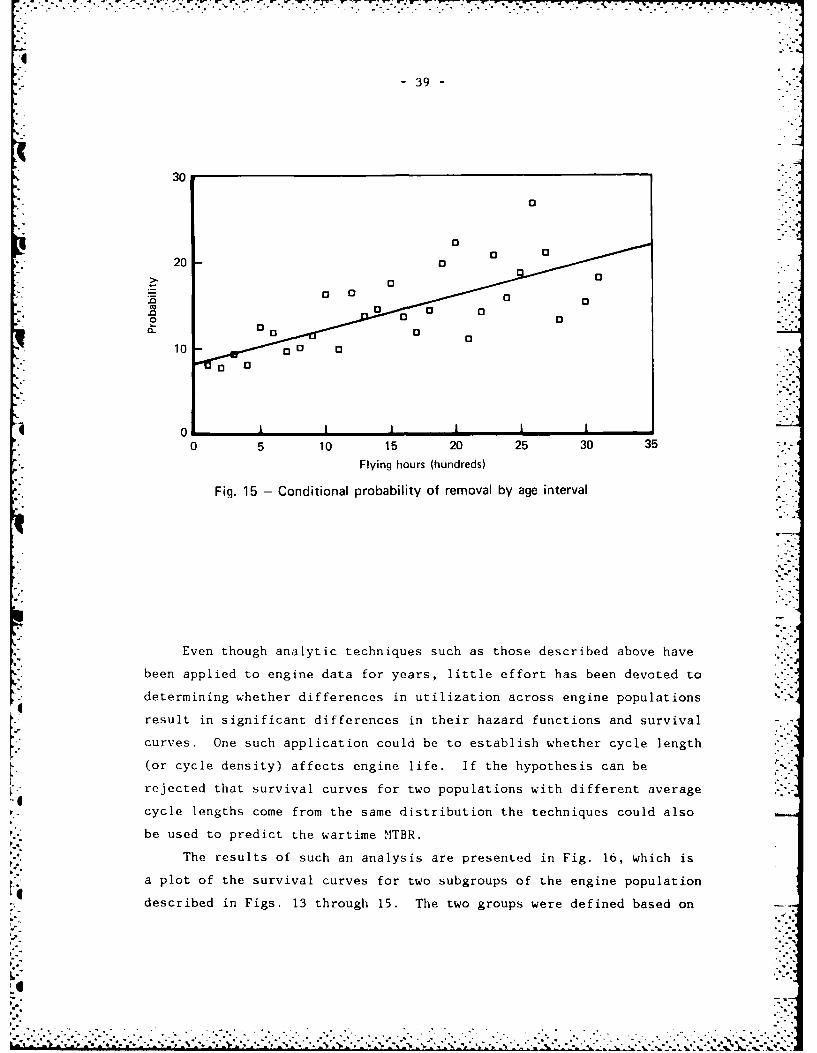
39 -
30
20 "0
> o
20 0 "aa13 0
o a•. .10130 3
'I 0 II5 10 15 20 25 30 35
Flying hours (hundreds)
Fig. 15 -Conditional probability of removal by age interval
Even though analytic techniques such as those described above have
been applied to engine data for years, little effort has been devoted to
determining whether differences in utilization across engine populations
result in significant differences in their hazard functions and survival
curves. One such application could be to establish whether cycle length
(or cycle density) affects engine life. If the hypothesis can be
rejected that survival curves for two populations with different average
cycle lengths come from the same distribution the techniques could also
be used to predict the wartime MTBR.
The results of such an analysis are presented in Fig. 16, which is
a plot of the survival curves for two subgroups of the engine population
described in Figs. 13 through 15. The two groups were defined based on
.I.-
. ... ". .
- . ° . .o . . . . . . . . , - . .• . * . , __. . . . • ^ . . . -
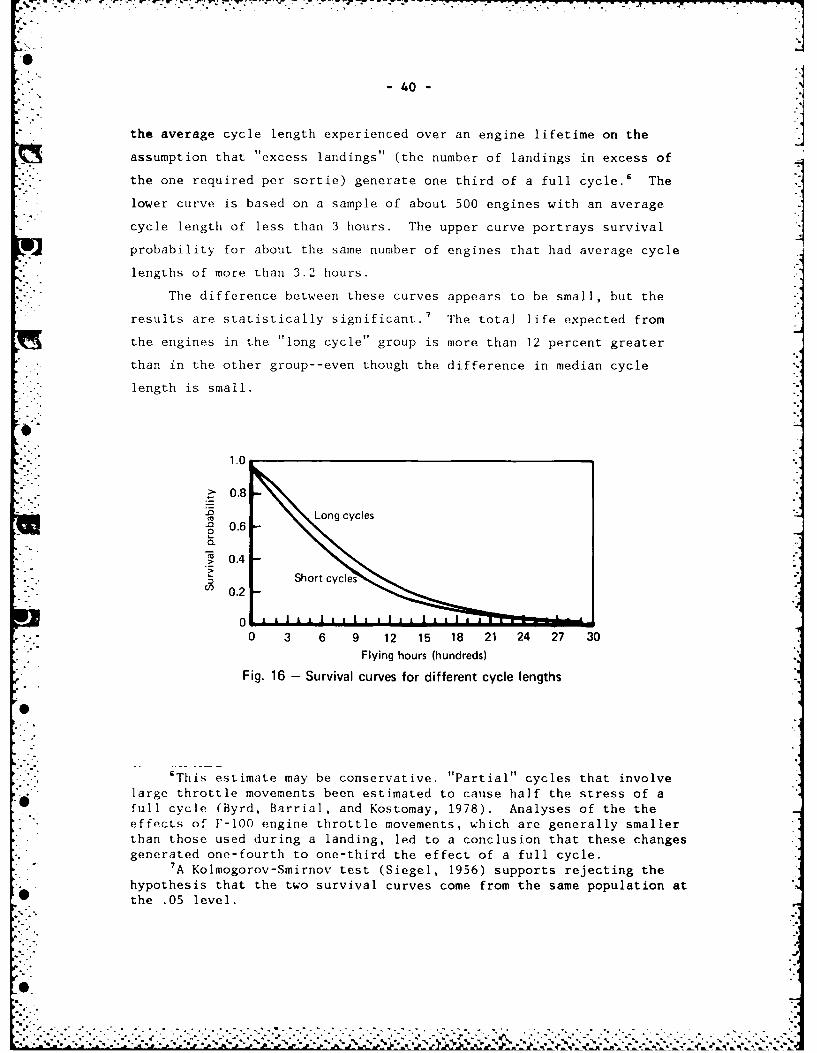
'I -j. -
-40-
• .the average cycle length experienced over an engine lifetime on the
assumption that "excess landings" (the number of landings in excess of
the one required per sortie) generate one third of a full cycle.6 The
lower curve is based on a sample of about 500 engines with an average Icycle length of less than 3 hours. The upper curve portrays survival
probability for about the same number of engines that had average cycle
* . lengths of more than 3.2 hours.
The difference between these curves appears to be small, but the
results are statistically significant. The total life expected from
the engines in the "long cycle" group is more than 12 percent greater
than in the other group--even though the difference in median cycle
length is small.
. 10"i.0
0O.8
Long cycles0.6
0.4
. -. Short cycles
-'' 0.2
0 6J0 3 6 9 12 15 18 21 24 27 30
Flying hours (hundreds)
Fig. 16 - Survival curves for different cycle lengths
St
6This estimate may be conservative. "Partial" cycles that involvelarge throttle movements been estimated to cause half the stress of a
full cycle (Byrd, Barrial, and Kostomay, 1978). Analyses of the theeffects of F-100 engine throttle movements, which are generally smallerthan those used during a landing, led to a conclusion that these changesgenerated one-fourth to one-third the effect of a full cycle.
7A Kolmogorov-Smirnov test (Siegel, 1956) supports rejecting thehypothesis that the two survival curves come from the same population at
* the .05 level.
'--%
o.oo.-. ...-.. .-.-. . .....-. °.. . -,. -. . -, • o- °. . -. . . . . . . . . .

,.41
The average life for the short :id 1iog-cycle engine groups is
contrasted with that of the total population in Fig. 17. Projecting
these results to the 4.5-5 hour average sortie (cycle) length expected
in wartime yields an expected wartime M1TBR of about 1050 hours, which is
about 20 percent more than the average engine life realized in
peacetime.
This result is consistent with tho engineering discussion presented
in Sec. Ill, and suggests that larger differences in average cycle
length should result in correspondingly greater differences in survival
probability. It is also consistent with airline exu(rience.s
Hazard data can also be used to identify a theoretical distribution
that fits the data. The increasing conditional probability of removal
with age shown in Fig. 15 violates the exponential distributional
6 assumption. The monotonically increasing hazard rate suggests a time
dependency that is captured in the Weibull distribution. Several
analysts have found that this distribution describes lifetime data for
many complex items.
1000
800
,, 600
0
400 .-.,
200 IA
0Short Total Lonq
Fig. 17 - Mean time between removalfor different cycle lengths
$Comparison of the data in Figs. n and 17 also reveals that AirForce removal rates are much higher than those experienced by theairlines. The Air Force has attributed this disparity to differences inmilitary and commercial missions, but it is at least possible that AirForce maintenance practices also play an important role.
-- .% "s-°
'- . .
- 42 -
The Weibull is the limiting distribution for the minimum of n
values from a large number of initial distributions bounded at the left
(Hahn and Shapiro, 1967). Because a turbine engine is a complex item
consisting of many components, and the engine fails when the first of
these components fails, the Weibull distribution can be expected to fit
empirical life data.
ESTIMATING THE PARAMETERS OF A WEIBULL DISTRIBUTION
The cumulative probability of removal for the Weibull distribution
is given by:
F(t) = 1-exp[(t - X)l(n -)
where a is the shape parameter, T) is the scale parameter or
characteristic life, and T is a location parameter. The failure rate is
a power function of time for this distribution.
Several graphical methods have been developed to facilitate visual
tests of the fit between empirical and theoretical data. These methods
take advantage of the fact that ln{l/[l - F(t)]) will plot as a straight
. line against ln(time) if the distribution is Weibull (L. S. Nelson,
" 1967). The location parameter accounts for a period during which no
failures occur. It is usually assumed to be zero, unless there are
physical reasons to believe there is a minimum life, or successive
trials indicate that adjusting failure time by a fixed amount
"straightens" the plot.
One of these methods is to plot the cumulative percent failure
against time on a Weibull probability chart.9 The shape and scale
* parameters for the distribution can then be estimated directly.
9 Another method is to plot the cumulative hazard number, defined asthe sum of the conditional probabilities of removal to time t, againstIn t on special graph papers. If the data fit a Weibull distribution,the hazard number should plot as a straight line against t on Weibullprobability paper (Nelson, 1969). A third approach requires plottingthe total time on Lest vs. t and using templates to fit a theoreticaldistribution to the resulting curve (Barlow and Campo, 1975). Theresults of applying this technique are equivalent to those of the othermethods, but the graphical evidence of the fit between the data and thehypothesized distribution is less readily apparent.
V " I43
Figure 18 presents such a We ibu Il probability plot for the engine2
failure data. It indicates that the data fit a Weibull distribution
with a scale parameter of 960 and a shape parameter of 1.33, and the
survival funct ion for these data can be approximated hy: 10
S(t) =exp[(-t/960) 1.3
This function is platted in Fig. 19. The survival curve from thej
engine failure data is also plotted, but it is difficult to discriminate
between the two curves.
Survival curves developed from this peacetime operational
experience cannot be used to estimate the wartime TF39 removal rate
because:
0 Data at expected wartime cycle lengths are not available
* The engine has undergone a major modification that is expected
to increase the MTBR since these data were collected.
These analytic techniques can be used to both design and interpret the
results of the operational tests that are needed to develop a removalrate estimate.
"Grouped data were used to develop the Weibull probability plot.A maximum likelihood procedure developed by William Rogers of the RandCorporation (Rogers and H-anley, 1982) was used to estimate theparameters from the individual data points. This procedure yieldedestimates for the shape and scale parameters of 1.36 and 982respectively. This procedure was also used to estimate the parametersof the distributions plotted in Fig. 16. For the short cycle group, theprocedure yielded estimates of a =1.27 and r = 914, which are close tothe values of 1.26 and 890 estimated from the grouped data. The maximumlikelihood estimates for the long cycle group were a =1.43, n 1046vs. 1.39 and 1040 with the graphical technique.

7 7-
WEISULL PROBABILITY CHART
s. Total sample ______ 18
911111011 'P 1.33
S860 ewwscLU 960 :
00
C-
-. E
C-4-
SL
10 1000 1,0Age at failure
Fig. 18 -Weibull probability plot

-45-
1.0
>.0.8
.~0.6f
S0.4
W0.2
00 3 6 9 12 15 18 21 24 27 30
Flying hours (hundreds)
Fig. 19 -Predicted and observed survival curves
. ,. . ... . . . ... . .. . ..... . ,.. .. .... ..- • , .. - -]! . . . . 7!- . -.. ,
- j
- 46 -
VI. GENERATING DATA FORLOGISTICS PARAMETER ESTIMATION
Despite a considerable body of evidence that increasing cycle
lengths should reduce engine failure rates, requirements computations
continue to be based on the assumption that removals are driven by the
flying program. This may be partially attributable to the fact that
other models are not available. Although the GE engineering model could
be used to project the wartime failure rate, military managers would
probably be reluctant to base their requirements estimates on the
predictions of an engineering model without some empirical validation of
its predictions.1
The model's predictions could be tested, or the wartime removal
rate could be estimated directly, by means of an experiment designed to
accumulate data concerning the effects of cycle length on observed
. "engine life. Such an experiment could be conducted without increasing
- .the level of C-5 flying activity by changing the scheduling rules used
to assign aircraft to missions for the approximately 50,000 hours flown
each year. Thus no additional flying would be needed to test the cycle
length hypothesis, although changes in the policies used to assign
, aircraft to missions in peacetime would be necessary.
This section describes an experiment that could be used to test the
effects of varying cycle lengths. It also outlines a Bayesian approach
for estimating the wartime removal rate and discusses the implications
of the experimental design for aircraft scheduling policies.
AN APPROACH TO THE EXPERIMENTAL DESIGN PROBLEM
The problem of designing an experiment to explore the effects of
utilization on aircraft engine life is quite similar to that of
designing a clinical trial to test the effects of treatment alternatives -
on medical patients. Such "life tests" require sample sizes large
enough to permit statistically valid conclusions to be drawn from
* 'The model has been validated empirically, as was discussed in Sec.
III, but the Air Force would probably require validation in a militarysetting.
[-•- , •:~~% ~

- 47 '
experimental results. In addition, they take a considerable amount of
time to accumulate sufficient data. Medical studies usually follow
their patients for several years to establish the relative effectiveness
of treatment alternatives.
Typically clinical trials in medicine are structured to support
direct comparison of treatment alternatives; researchers usually do not
have a basis for estimating the survival curves for the alternatives
before the experiment begins. One approach to the problem of estimating
engine life as a function of "treatment" would be to design a test
similar to those used to discriminate among treatments in medicine. The
results of the test could be used to project the wartime removal rate.
The same data could be used to test the GE model's predictions. An
engine survival curve could be developed from the wartime removal rate
projection and compared with actual test results. The preliminary
estimate could then be updated as experience accumulated with Bayesian
methods. This approach would enable the Air Force to develop wartime
removal rate estimates before the test was complete. IAny experimental design involves decisions concerning:
" The number of subjects (engines) to be used in the experiment;
" The method to be used to assign subjects to treatments;
* The length of the test;
* Techniques for extracting the maximum amount of information
from the data before all of the results are in;
* Procedures to avoid introducing bias into the experiment;
* The analytic techniques to be applied to the experimental
results.
The number of engines needed for the test is a statistical issue
and should be based on the degree of statistical validity desired. The
sample needs to be large enough to permit observation of sufficient
events, where the events of interest for survival analysis are "deaths"
rather than trials (Freedman, 1982). Thus the sample size needs to be
adequate to provide: (1) statistically valid results when the desired
number of deaths have occurred and (2) a reasonable probability that
this number of deaths will have been observed at the time selected for
analysis.
%.. .

- - , . . .o , -, --.. -. . . .. .. ,% .... Cr .- r: J . . ~ . - . . - '..i '
- 48 -
Most experimental designs that are intended to compare two or more
treatments require a randomization protocol to ensure that test results
are not biased (Armitage, 1982). Bias could be introduced if there are
differences in the characteristics of subjects that have nothing to do
with the variables being tested. So long as none of the engines
selected for test contain components with life limits that might require
them to be removed prematurely, there should be no such differences
among engines produced by the depot or a particular JEIM shop. Minimum
limits on the remaining life of components used in engine repair are
established by policy (Department of the Air Force, 1982). Hence
-.selecting an engine from stock or JEIM production to meet an aircraft
• "requirement constitutes random assignment; a formal randomization scheme
should not be required for this test.
The calendar time needed for the test will be determined by: (1)
the length of time needed to bring the required number of engines onto
- test and (2) the number of failures to be observed to yield the desired
*levels of statistical power. It would take over a year to introduce a
large sample of engines to test, 2 and years longer for all of the
engines used in a treatment experiment to fail. Fortunately it is not
necessary to wait that long to perform the analysis. Interim results
* can be obtained using the Bayesian methods described in this section and
illustrated in Appendix D. Reasonably complete results for classical
statistical analysis will be available after only part--preferably 60 to
70 percent--of the engines have been removed.
Terminating the experiment (for analysis purposes) while 30 percent
- of the engines remain in service imposes Type II censoring on the data.
However, the product-limit (PL) estimate of survival probability has
been shown to be the maximum likelihood nonparametric estimate for this
probability even when the data are censored. The PL estimate exploits
the fact that units either failing or removed from trial during one
interval are not susceptible to failure during subsequent intervals.
2The test could be initiated more rapidly if several engines wererefurbished and installed before removals were necessary. This wouldcreate an unreasonable burden on maintenance.
LO
17- -. -6 ~ *. )

-49-
The product-limit estimate of the probability of survival to time t
is:
P(t) = r [(N - r)/(N -r + 1)]
where r includes the positive integers for which tr' < t, and tr' is the
age at failure. The expression allows for the possibility of censored
observations (Kaplan and Meier, 1958). This method of treating censored
data will be assumed for all of the discussion that follows.
A "CLINICAL TRIAL" OF ENGINE TREATMENT ALTERNATIVESIf training sorties cause greater engine stress than cargo sorties
that have longer average cycle lengths, the survival curves for engine
populations exposed to the two operating environments should differ.
The data presented Sec. V suggest that survival probabilities for
engines treated with long cGycle lengths have higher survival
probabilities, particularly at low age, than those cycled more
intensively.
One approach to establishing the effect of cycle length on engine
life would be to assign n aircraft to cargo missions and mi aircraft to
training missions for the duration of the experiment. Experimental
aircraft would be assigned to fly most cargo missions, and the balance
of programmed C-5 flying hours would be distributed across the remainder
of the fleet. The number of aircraft required in each group would be
determined by the size of the sample needed to distinguish between the
two survival curves.
The logrank test is frequently used to test the difference between
two life distributions and is particularly good when the ratio of the
hazard functions for the two treatment groups is approximately constant
over time (Peto et al., 1975, 1976).3 The test statistic is essentially
a comparison of the observed number of failures in each group and the
"expected" number assuming no difference in the two curves (Kalbfler~sh
and Prentice, 1980). Minimum sample sizes needed to reject the
hypothesis that two survival curves come from the same distribution
using the logrank test have been tabulated (Freedman, 1982). An extract
-:-. ~ ~-,.**.~. *~*~y*%*******' ,,' * N.

-50-
from Freedman's table is reproduced as Table 1, which shows the sample
size (number of engines) needed to reject the hypothesis that the
"control" and "experimental" survival curves come from the same
population at various levels of confidence and test "power." These
sample size requirements assume that half of the number shown in any
given cell of the table are designated "controls,"' and the other half
are included in the experimental group. Normal theory can be used to
compute the effective experimental sample size when the populations in
the experimental and control groups differ in size using the expression:
2(1/nl*) = (1/n) + (1/rn)
To apply the table the analyst must specify:
The control group survival probability at which the analysis is
to be conducted,
~. 9'- * The expected difference in survival probability between the two
groups when the appropriate percentage of the control group has
"died."
The experiment should continue until at least 60-70 percent of the
control engines have failed. The calendar time needed to attrit 70
percent of the controls is a function of: (1) the utilization rate of
the test aircraft; and (2) the distribution of time to removal for the
TF39-IC engine.
* 'The test can also be used when the two groups do not faceproportional hazards." The differences between the shape and scaleparameters estimated for the distributions fit to data from the "short"and "long" cycle groups described in Sec. V indicate that the hazard
funcionsfor the short and long cycle groups are not proportional.Engines exposed to short cycles have a shorter characteristic life, but
0 they also have a smaller shape parameter. Thus the hazard functions forthe two groups should converge beyond the characteristic life of thelong-cycle group.
'Tabulated values refer to the number of engines; one-fourth thenumber of aircraft would be needed. In parentheses are the expectednume of failures experienced across the total sample for that cell of
the matrix.
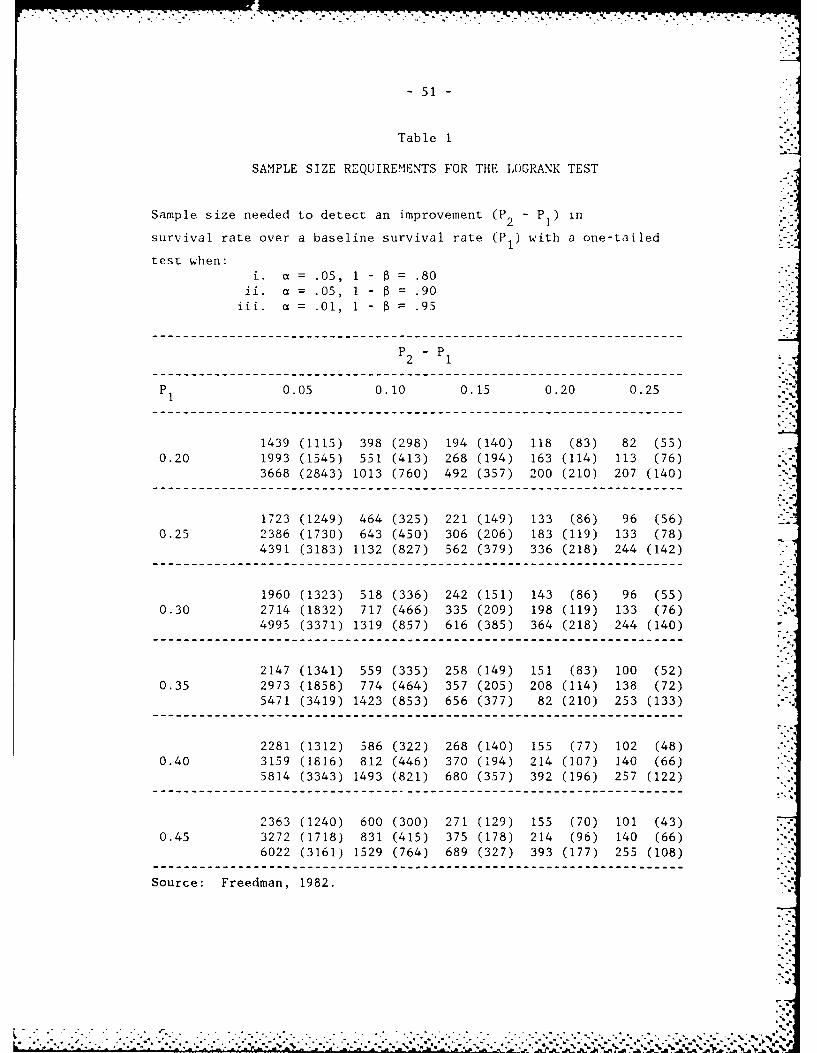
- 51 -
Table 1
SAMPLE SIZE REQUIREMENTS FOR THE LOGRANK TEST
Sample size needed to detect an improvement (P2 - P1) in
survival rate over a baseline survival rate (P1 ) with a one-tailed
test when:i . a = .05, 1 - .= 80 "1
ii. a = .05, 1 - .90iii. a = .01, 1 - .95
2 1"P 2 - PI 1.
P 0.05 0.10 0.15 0.20 0.25
1439 (1115) 398 (298) 194 (140) 118 (83) 82 (55)0.20 1993 (1545) 551 (413) 268 (194) 163 (114) 113 (76)
3668 (2843) 1013 (760) 492 (357) 200 (210) 207 (140)
1723 (1249) 464 (325) 221 (149) 133 (86) 96 (56)0.25 2386 (1730) 643 (450) 306 (206) 183 (119) 133 (78)
4391 (3183) 1132 (827) 562 (379) 336 (218) 244 (142)
1960 (1323) 518 (336) 242 (151) 143 (86) 96 (55)0.30 2714 (1832) 717 (466) 335 (209) 198 (119) 133 (76)
4995 (3371) 1319 (857) 616 (385) 364 (218) 244 (140)
2147 (1341) 559 (335) 258 (149) 151 (83) 100 (52)0.35 2973 (1858) 774 (464) 357 (205) 208 (114) 138 (72)
5471 (3419) 1423 (853) 656 (377) 82 (210) 253 (133)
2281 (1312) 586 (322) 268 (140) 155 (77) 102 (48)0.40 3159 (1816) 812 (446) 370 (194) 214 (107) 140 (66)
5814 (3343) 1493 (821) 680 (357) 392 (196) 257 (122)
2363 (1240) 600 (300) 271 (129) 155 (70) 101 (43)0.45 3272 (1718) 831 (415) 375 (178) 214 (96) 140 (66)
6022 (3161) 1529 (764) 689 (327) 393 (177) 255 (108). . . . . . . . . . . . . . . . . . . . . . . . . . . . . . . . .-- . . . . . . . . . . . . . . . . . . . . . . . . . . . . . . . . . .- -
Source: Freedman, 1982.
%- ..
There are two strong airguments for us ing normal peacetime training
experience as tl e contro] for the proposed ',xpo r iment:s
.- Only part of the test subjects would ne!ed to be identified
explicitly,
'ihe calendar time needed for the test could be reduced relative
to that required if two groups of engines were placed on test
at the same time.
The average utilization rate of the C-5 fleet has been less than
three hours per aircraft per day for the past several years, and
reliability improvement was part of the justification for the
" modification that converted the TF39 to the IC configuration. If the
MTBR for the modified engine is in the 1400 hour range,6 as is expected,
it would take nearly two years to generate 70 percent of the removals
. from the control group at recent utilization rates.
Clearly the time needed to accumulate data on control engines could
create a testing constraint. However, life data for the TF39-IC engines
that have been previously or are currently installed in the fleet can be
used to construct a control group survival curve. This curve could
provide a basis for comparison with that for test engines as failures
occur. Using this experience for an experimental control could also
increase the effective size of the experimental sample.
Estimating the expected improvement in experimental group survival
probability when 70 percent of the control engines have been removed is
a more difficult problem. Two sources of data relevant to this problem
are available:
5The data described here cannot be used to construct the controlsurvival curve because they predate the TF39-1C modification. Usingpeacetime (TF39-IC) experience rather than training flights as thecontrol would tend to reduce the expected difference in survival
probability between the control and experimental groups, but this costis more than offset by the benefits outlined above.
6The analysis in Appendix A demonstrates that no additional spare
engine procurement is necessary if the expected MTBR for the TF39-1Cengine is realized.
?[.,i- .- .- .. , -"...- -,". . .- -.. .- , . .- v ,.. .. .- .- - . , , .
53
* The airline experience described in Sec. III,
* The analyses presented in Sec. V.
A linear interpolation of the airline data indicates that the
expected MTBR for engines exposed to 4.7 hour sorties is more than 30
percent greater than that for engines used on 2.9 hour sorties. A
similar projection of the C-5 engine life data analysis results suggests
that there should be at least a 20 percent difference in MTBR for the
control and experimental average cycle lengths.7
These facts, coupled with the statistical results indicating that
cycles are a better measure of engine stress than flying hours and that
increasing sortie utilization rates increases engine life, suggest that
it is not unreasonable to expect a .15 difference in survival
probability when 30 percent of the control engines survive.'
Assuming that 18 aircraft can be designated as test platforms (n =
72) and that engines installed on other aircraft, as well as previous
TF39-1C removals, are treated as controls (m 436), the effective total
sample size (2n*) is 247. Table 1 indicates that this sample is
sufficient to reject the null hypothesis with 80 percent power when: (a)
70 percent of the control engines have been removed and (b) 45 percent
of the experimental group survive.
7Both of these estimates are based on fitting a line to the MTBRdata using median cycle length to represent group experience. Dependingon the method used to introduce engines to test and the number of pre-test failures used to increase the effective sample size, the mediancontrol cycle length should be between 2.4 and 2.7 hours per cycle. Theexperiment should be structured to ensure that the median cycle lengthfor experimental engines is about 5 hours.
8 1f half of the available C-5 flying hours are flown by theexperimental group with average sortie (cycle) lengths of 5 hours, andthe remaining aircraft make the balance of the landings that are made ina typical year, the average cycle length for the control group will beabout 1.9 hours. Averaging this value with that for an assumed 200
" prior failures with average cycle lengths of 3.1 hours (the averageobserved in the data), the overall average control group cycle lengthwill be about 2.45 hours. Extrapolating the difference between shortand long cycle survival probability to the cycle length expected for theexperimental group yields an expected difference in survival probabilityof nearly .16 when about 30 percent of the controls survive. This
*O calculation does not account for any possible increase in experimentalgroup survival probability attributable to an increase in aircraftsortie rate, suggested by the regression results described in Sec. V.
0-
• ".", - " " '."- - ".". . "-. .."". .".".. .'.".. .. ", 'i,. : . ">2 -i, -","• .' " ' ,' >,

- 54 -
Discrimination between the two survival curves could be improved by
increasing the size of the experimental group. However, it is unlikely
.- that more aircraft could be assigned as test platforms without creating
," an unacceptable constraint on peacetime aircraft scheduling. This need
not limit the experiment even if the difference between experimental and
control group sourvival probability is less than .15 at the analysis
point. Although the tabulated values for the logrank test were used to
address the sample size issue, other tests can be used to analyze the
experimental results.
In particular, the Kolmogorov-Smirnov test could be used in the
analysis. This test is the most powerful for detecting many possible
differences between two distributions (Siegel, 1956) and is more
S. sensitive to differences in survival curves than the logrank test. It
was not used to address the sample size issue because it is easier to
infer sample size requirements for the logrank test.
.. . Minimizing the number of engines that must be monitored during an
- •experiment would limit its effect on peacetime aircraft scheduling.9 It
should also reduce the potential for operator-induced bias in the
experimental results. The risk of bias could be further reduced if new
scheduling rules were promulgated without disclosing the purpose of the
test.
The experiment would be conducted by assigning "test" aircraft to
fly cargo missions exclusively, with minimum average sortie (cycle)
lengths of four hours. Although it would take a great deal of time for
the test aircraft to accumulate experience at recent aircraft
utilization rates, utilization has been constrained because of wing
cracking problems that are in the process of being corrected through a
wing modification program. Thus it should be possible to accelerate the
S. "test by allocating more of the available C-5 flying hours to the test
aircraft.
.As has alr iady been noted, aircraft schedulers have done aremarkable job of equal izing the distribution of missions across
aircraft because of the C-5 wing cracking problem. Rules designed toO induce variation in utilizition should present less of a scheduling
problem, particularly it (nly a fow aircraft are affected.

- 55 "
In peacetime aircraft are assigned to a home station at either
Dover or Travis Air Force Base. If half of the test aircraft were
assigned at each of these bases, average utilization rates of nearly
four hours per day on normal channel missions should be possible.)0 The
fact that these aircraft would not be available for training missions
would create some scheduling constraints, but these constraints should
be less binding than those aircraft schedulers have had to confront for
the past several years.
A final factor that must be considered to estimate the calendar
time needed for the test is the procedure to be used to introduce
engines to test conditions. It would be unreasonable (if not
impossible) to refurbish and change over 70 engines in a short period of
time simply to begin an experiment, regardless of its importance.
However, waiting for unscheduled removals to occur could take a very
long time just to introduce the required number of engines to test even
at an increased aircraft utilization rate. Fortunately an alternative
is available. The wing modification program is producing an average of
1.5 aircraft per month. Each of these aircraft must be fitted with four
engines before it is returned to the Air Force. The required number of
engines could be brought on test by installing repaired engines from
stock on the aircraft generated by the modification program. Some of
these engines might come from aircraft introduced to test earlier after
opportunistic engine replacements. This would permit all of the
necessary engines to be placed on test within a year and would have the
additional advantage of providing a "lead the fleet" test of the wing
modification itself. 1" Preliminary results of the test would be
available within a matter of months, and fairly complete results could
be expected within two years.
'0The Military Airlift Command (MAC) routinely serves severaloverseas channels in peacetime. For example, several C-5 flights a weekare scheduled from Travis to Clark AFB in the Phillipines, and severalmore fly from Dover to Europe. Two or more sorties are flown on each ofthese missions.
'The first aircraft to receive the wing modification is alreadybeing used in a "lead the fleet" program.
-Z
LL.
-56-
This proposal for a test addresses the experimental design issues
listed earlier. To recap, two changes in current aircraft assignment
- . and utilization policies are needed to structure a "clinical trial" of
* . the effect of cycle length on engine removal rate:
0 Assign 18 aircraft to fly cargo missions exclusively,
* Increase utilization rates for these aircraft.
Some data for the control group would he available when the test
was initiated, so results for the test group could be compared with
control group data during the course of the experiment with any of
several available tests. The Kolmogorov-Smirnov test is a simple
procedure for testing the hypothesis that two survival curves have been
* generated from the same distribution. Procedures for developing
nonparametric confidence limits for the survival curve have also been
developed (Kaplan and Meier, 1958; Simon and Lee, 1982). The log-effect
- function, the ratio (in logarithms) of the hazard rates faced by the two
groups of engines, is a simple test for proportional hazards (Kay and
Schumacher, 1983). It should also reveal divergence between the two
hazard functions. Finally, estimates of the log survivor and hazard
functions could be made directly (Rice and Rosenblatt, 1976).
TESTING AND UPDATING PREDICTIONS OF THE GE OPSEV MODEL
GE's OPSEV model could be used to predict the wartime removal rate.
* .This prediction, coupled with an assumption concerning the distribution
of time to removal, could be used to construct a survival curve that
could be tested in an experiment.
For example, assume that the model predicted a removal rate of .7
engines per thousand engine flying hours, and that engine life is
believed to fit a Weibull distribution with a shape parameter of 1.3 and
* * a scale parameter of 1550. The resulting "predicted" survival curve is
* . shown in Fig. 20. An exponential distribution with parameter X=.0007 is
also shown to contrast the classic exponential assumption with the
S Weibull survival curve. The apparently minor differences between the
two curves suggest that the exponential assumption is probably adequate
0%

- 57
* for most purposes. However, life data analyses that use parametric
methods should use the distribution that best fits the data. The
Weibull distribution appears to meet this criterion for engine life
data.
This procedure would permit comparison of experimental results with
predictions made using the engineering model as well as the comparisons
of controt and test group experience. Actual failure data accumulated
during the test could be used to construct an empirical survival curve
using the methods described in Sec. V. This curve could then be
compared with the estimated curve using the statistical tests mentioned
above.
This procedure could be used initially to validate the model's
predictions and ultimately to develop a new removal rate projection. An
* alternative would be to use Bayesian methods to update estimates of the
parameters of the Weibull distribution during the course of the test.
The methods provide a means for continuing update of the removal rate
estimate as removals occur.
Bayesian methods take advantage of the information available before
the test begins. Furthermore, they can be used to estimate the value of
the information obtained by test (Raiffa, 1968). A great deal of work
has been devoted to applying these methods to reliability problems
(Shimi and Tsokos, 1977), and the reliability methods have addressed
1.0
> 0.8 Weibull
-.'0.60
-i 0.4
. 0.2.
,'.0 I |L I
;0"20 5 10 15 20 25 30 35 40 45 50 55,.Flying hours (hundreds)
Fig. 20 - Exponential and Weibull survival curves
.. >.
-58-
* procedures for applying them to the Weibull distribution (e.g., Mann,
1970; Soland, 1968, 1969). Appendix D provides an example of the
calculations required.

-59-
VII. FORECASTING LOGISTICS RESOURCE REQUIREMENTS:POLICY IMPLICATIONS
The effort to address the C-5 engine requirements problem has
exposed two larger problems that must be addressed by policy:
The "statistical" problem of estimating the wartime demand rate
implicitly requires a policy decision,
The basis for estimating this parameter can be improved by
changing aircraft scheduling policies.
Policy decisions (including those couched as assumptions)
concerning statistical issues are irrational if there are better
* alternatives available. Although there will always be some uncertainty
* . concerning the validity of statistical models, and the appropriate model
is likely to vary among components, the resource implications of the
* - wartime resource requirements estimation problem demand improvements in
the analytic basis for requirements estimates.
This need is not confined to the C-5 engine requirements problem.
Requirements for other resources are probably inaccurate for reasons
analogous to those that affect the engine requirements issue. The
approach outlined here should be applied to other resources.
The major difference between peacetime and planned wartime utilization
of the C-5 aircraft makes estimating C-5 spare engine requirements an
important issue. Although parallel problems in estimating other
* support resource requirements may not be as dramatic, the problems,
potential solution approaches, and sources of resistance to change
parallel those addressed in the C-5 context. A framework for addressing
these problems can be summarized as follows:
Component removal rates observed in peacetime reflect the
combined result of several individual component failure modes,
S.7.-P . . . .

.'60 -
* At least some of these failure modes can be associated with
aircraft (and component) utilization,
* Utilization patterns in wartime will differ from peacetime
experience,
* Peacetime simulation of wartime operating conditions can
provide a basis for:
-. - Estimating the relationship between utilization parameters
and component life,
Developing logistics parameter estimates for use in wartime
resource requirements computations.
AIRLIFT ANALOGIES TO THE C-5 ENGINE REQUIREMENTS PROBLEM
Utilization rates for all of the Air Force's aircraft are expected
to increase in wartime. The rate of increase is particularly important
for strategic airlift aircraft because peacetime training requirements
. are low relative to the airlift capacity required in time of war.'
Requirements for compohents other than engines used on these aircraft
should also be affected by the major change in utilization and landing
* rates that will occur in wartime.
Structural components, especially landing gear, should reflect
particularly noticeable effects, even though wartime landings will
involve heavier loads. However, the resource implications of changing
base-level removal rates for landing gear components will be small
because most landing gear repairs are accomplished during Periodic Depot
Maintenance (PDM) in peacetime (Embry, 1982). These components are also
much less expensive than engines and engine components.
Changes in landing-related stress could also affect avionics
components, which account for a large fraction of both peacetime and
projected wartime maintenance requirements. The observed increase in
avionics maintenance requirements associated with frequent landings has0
'The peacetime flying program is structured to meet minimum pilotproficiency needs. The airlift fleet has a great deal of transportationcapability that could also be used in peacetime, but its use is limitedto avoid placing the service in direct competition with privateindustry.
Ai
•,K : , , , -, , . . . , . , , .. . , - , , , . . . . . .
-, ." -- - -.- -. *~
* -61-
prompted the Navy to (unofficially) designate specific aircraft for
multiple-landing missions ("bounce" aircraft). The avionics systems on
these aircraft are permitted to degrade during peacetime training
operations.
Avionics components also account for a large fraction of computed
war reserve investment needs for strategic airlift aircraft. If demand
rates for these components can be expected to change in wartime for
reasons analogous to the cycle density effect on engines, revising
parameter estimates would also greatly affect avionics war reserve
requirements.
A reduction in the number of landings per flying hour is not the
only reason to believe that the demand for avionics components, at least
-. for cargo and bomber aircraft, would decrease in wartime. Although the
* reasons for failure of these components may not be as well understood as
they are for engines, the demand for electronic items has been observed
to decrease with increasing utilization in a wide range of applications.
Shurman's time-dependent model of aircraft maintenance requirements was
developed primarily from avionics data (Shurman, 1979); Shaw's estimates
of the demand-sortie length relationship applied to avionics as well as
. . engines (Shaw, 1982); airline experience suggests that maintenance
.. manhours per flying hour decrease with increasing utilization (Carlyle,
1976); maintenance manhour per flying hour analyses in military settings
confirm this experience (Donaldson and Sweetland, 1968); and the demand
.-. for shipboard electronic components on vessels deployed off the coast of
Viet Nam was lower than that observed during routine peacetime
steaming.2
One reason for such changes in the demand rate for avionics items
might be that components are subjected to fewer power surges per flying
hour (power surge density is lower) when utilization rates increase. In
fact, the basic premise of accelerated life testing is that stress
affects component life, and testing under increased levels of stress can
provide information concerning life distributions under normal levels of
stress. 3
2Conversation with LCDR James McClure, Supply Officer of a surfacecombatant during the Viet Nam conflict, summer 1974.
3Accelerated life tests are sometimes used to explore componentfailure modes. Methods to use the results of these tests to predictservice life have also been proposed (Barlow and Schener, 1971; Kahn,1977; Singpurwalla and Al-Khayyal, 1977).
, ' ........... .". ..... o.. ....... ..... .........
- 62 -
Engineers undoubtedly already know a great deal about the effectsof utilization on the failure modes of avionics items, but there was no
opportunity to explore the existing state of knowledge during the course
of this research. It is an area that warrants investigation similar to
that proposed for C-3 engines. In fact, the tests proposed for
establishing the wartime demand rate for engines could also generate
data that could be used for research into the effects of utilization on
the life of other components installed on strategic airlift aircraft.4
ANALOGIES IN OTHER SETTINGS
If utilization affects the demand for components used on strategic
airlift aircraft, it should also affect that recorded for tactical
aircraft. In some instances, even though tactical training syllabi have
been designed to approximate wartime requirements, wartime demand
rates may increase over those experienced in peacetime. Tactical pilots
may find it necessary to increase throttle use in response to combat
situations, which could result in an increase in the wartime engine
demand rate. Equipments might also be subjected to greater G forces
than they are in peacetime.
Increasing utilization could also decrease demands for some
components by limiting the effects of changes in the equipment's
* -" operating environment. Increasing the sortie rate for an individual
aircraft could reduce the effects of temperature changes on some
equipments,' and limit the frequency of power transients experienced by
others. Operational schedules that required use of all aircraft would
limit the opportunity for hydraulic seals to dry out, etc., as sometimes
happens in peacetime when the operating unit can afford to use only some
of its aircraft.
'Survival analysis similar to that proposed for engines would beappropriate. Some of the early work dealing with electronicsreliability characteristics found that the Weibull distribution fit lifedistributions for electron tubes (Kao, 1959), and similar results were
*. obtained for transistor technology. Modern integrated circuits are not
subject to the same failure modes as earlier electronics circuitdesigns, but utilization probably affects the life of these componentsas well, and theoretical distributions could be fitted to their survivaldata.
" - sBecause temperature affects avionics life (Jones, 1983),temperature changes will probably also have an effect.
- . . .
. . . . .. . . . . . . . . . . . . . . .
663
Although research is continuing, the changes in malfunction rates
observed in two F-16 squadrons during a surge exercise have yet to be
explained (Embry and Crawford, 1983). Current research is investigating
a "good vs. bad airplane" hypothesis;6 additional effort might be
expended profitably to improve understanding of equipment failure modes
and their relationship to utilization. The possible effects of such
changes could be explored using means such as those proposed for testing
the effects of utilization on C-5 engine requirements. There is no
reason to believe that the "linearity" assumption has any more validity
in the tactical than the airlift context.
OTHER APPLICATIONS OF LIFE TEST RESULTS
The discussion here has emphasized the implications of wartime
*O demand estimates for the problem of developing war reserve inventory
requirements. In reality, these parameter estimates have more far-
reaching implications. Requirements for test equipment and maintenance
manpower in the field are based on forecasts of maintenance workload
that depend on this same parameter. Depot maintenance capacity
requirements are also based on wartime workload projections. Thus a
change in demand rate estimates would influence not only spares but
manpower, facilities, and equipment requirements. There are no
data available to estimate the amount of money spent on support
resources whose "requirements" are based on wartime demand rate
estimates, but it is safe to say that total costs are measured in
billions of dollars.
Changing demand rate estimates would not only influence the costs
of provisioning a system to support the operating forces with the
current support structure but would change perceptions of the viability
of support structure options. Previous analyses have shown that wartime
*"Good" airplanes are those that experience few failures. Anatural selection process operates to ensure that these good airplanesfly more often than those with higher failure rates. One possibleexplanation for the decrease in removal rates observed when activitylevels increase is that the "bad" airplanes are removed from the sampleearly in the exercise. Even if this hypothesis is verified, it does notaddress the question of why some aircraft have higher failure rates than
I:" others.b.
- . . .. . . . . . . . . . . . . .. . I
• • . .. . . . . . . .. .. . . • . , • . . .. . .
-64-
* capability could be improved and support costs reduced if such
structural options were implemented (Drezner, 1975; Shulman, 1980).
ENGINEERING PROJECTIONS VS. OPERATIONAL EXPERIENCE
Engineering models and reliability predictions are used routinely
during the design process. One purpose of acceptance testing is to
ensure that MTBF goals can be met (Department of Defense, 1977). Thus
the services already have experience in using the results of tests
(experiments) to validate the predictions of engineering models.
Except in the case of reliability improvement warranties and
modification programs, however, little use is made of engineering
projections after the government has accepted an equipment. In-service
life distribution data are considered only through the indirect means of
* developing demand rate estimates once a system is operational in the
field.
This Note provides evidence that continued analysis of life data
could improve the basis for estimating peacetime as well as wartime
logistics parameters, and that engineering estimates can play a useful
role in these analyses--particularly if aircraft scheduling policies are
modified to reflect the need to generate meaningful logistics data.
Continued testing is particularly important because original
acceptance tests do not predict reliability in the field very well. On
* one hand, acceptance test conditions seldom approximate field operating
* conditions (Cote and Birkier, 1979). On the other, complex items
* . usually undergo modification programs that enhance their reliability.
'OI
* The "hazard curve" tends to decline toward the horizontal curve implied
by the exponential distribution as a result of these modification
programs (Nowlan and Heap, 1976).
Continued attention to life distribution data could hasten
.4 identification of the failure modes that are responsible for poor field
reliability. This could aid the redesign process that is implemented
pithrough modifications and support "maturational development" of military
equipment.
stuThe term "maturational development" was coined in a proposal forimproving field performane by sequential development of subsystemsindependent of platform development. This approach to design is taken
with engines and could profitably be applied to avionics system
"S' eprmns ovldt h peitoso niern oes
- 65
The testing program proposed here is really no more than an
expanded acceptance test procedure that would use engineering
projections in Bayesian analyses of acceptance trial data. Coppola
(1981) proposed such an approach for initial acceptance testing.
INCENTIVES -FOR CHANGE
Demands for considering support requirements early in the
acquisition process and for making "supportability" a design requirement
have increased over the past few years (e.g., Mullins, 1983; Rice, 1979;
Rich and Drezner, 1982; Walker, 1980). This interest is attributable to
the rising costs of support as well as to the recognition that support
capability may be the Achilles heel of combat capability in future
conflicts. The need for increased emphasis on support, however, is not
confined to the acquisition process. Operational practices should be
designed to accumulate information relevant to the resource requirements
problem. This should entail modifications in operating policies to
maximize the amount of information that can be obtained from normal
peacetime operating data.
The algorithms used to schedule aircraft in peacetime are usually
designed to achieve operational (training) objectives, subject to the
constraints created by material problems or maintenance availability.
Thus logistics does create constraints, but scheduling operations to
support collection of logistics data is not one of them. In fact,
surge exercises are typically preceded by a massive effort to
accumulate extra support resources to ensure that logistics problems do
not constrain operational flying activity. There is even some evidence
that equipment failures may not be reported when they might require that
the aircraft be removed from the flying schedule (Lippiatt, 1978).
development (Shulman et al., 1981). The proposal is to extend theapproach to equipment already in the field and use life data analysistechniques to quantify the value of design improvements. The redesignproblem also presents an opportunity for combining engineering
* projections and operational data to improve design (Jones, 1983) andlogistics parameter estimation.
=[ :. . * ,"~* .. . . . . .
- 66
Data collected to improve requirements estimation could reduce the
level of assets for support operations, which is a disincentive to
explore the relationship between flying activity and maintenance
demands. Operators are not forced to confront the tradeoff between
investments in support and in new weapons procurement. In fact, they do
not even incur direct support costs. From the perspective of an
- - operating command, most support (with the exception of intermediate
level maintenance) appears as a free good. Nonetheless, the resource
implications of the assumptions that are currently made in the absence
of data demand improved requirements estimates. Realistic tests should
stress the support system and provide meaningful estimates of both
Fi logistics requirements and logistics capability constraints.
This Note does not provide an improved estimate of wartime C-5
engine requirements because of data limitations. It does outline the
engineering reasons for expecting engine removal rates, at least for
transport aircraft, to be lower in wartime than in peacetime. There may
be similar engineering reasons for refuting the linearity assumption for
other types of aircraft and equipment.
Undoubtedly the primary reason that the linearity assumption has
continued to be used for requirements computation is that it is easy to
specify and implement. Requirements statements based on this assumption
have survived budget scrutiny for years. Furthermore, the assumption
has intuitive appeal--flying should have something to do with demand--
and is widely accepted. Changing this assumption, or using assumptions
that vary with equipment and application, would make it much more
difficult to explain requirements statements.OCurrent pressures to reduce support resource demands can only
intonsify as the true costs of supporting new weapons become visible.
"luch of the attention thus far has focused on the prices being paid for
oparv and repair parts, but the total cost of spares will remain high
even if suppliers can be induced to reduce their prices. Price is only
on(, element of the total cost equation. Other support costs will also
continue to be affected by demand forecasts.
Vh.°
"o .-° " . . . ..'.- * .

L
V-7 7 7' V- ..
S-67-
Whether or not engineering models are available to predict wartime
removal rates, additional effort should be devoted to exploiting
potential variability in peacetime aircraft utilization to provide a
basis for wartime requirements estimates. Using this natural data
source will require behavioral changes within the Air Force. The costs
of not making these changes, however, are likely to be reflected in
reduced wartime support capability.
This Note has identified a strategy for overcoming the limitations
of the available data and improving requirements computations. Buying
too much of one item reduces the resources available to procure others.
In view of this economic reality, "conservative" assumptions are not
really conservative; they merely obscure the true costs of delivering
needed wartime capabilities.
i
II
. .. . . . .-.
[" -S q ;; . ~t~~
-- - . - - .* .
..1
Appendix A
SENSITIVITY OF REQUIREMENTS TO PARAMETER ESTIMATES
Tihe se('mitivity of wartime support resource requirements to the
parameter estimates used in requirements computation is demonstrated by
a series of examples. The examples do not consider distributional
requirements to simplify exposition.' Methods to optimize inventory
levels for a multi-site logisitics system are discussed in the
literature (e.g., Landi, 1967; Muckstadt, 1973).
Engine requirements are computed to provide 80 percent confidence
that an engine will be available when needed, under the assumption that
the demand process is Poisson. The total engine requirement consists of
pipeline" stockage, or the expected value of the number of engines tied
up in pipelines, and safety stock to protect against variations in N
demand or resupply. The safety factor to provide an 80 percent
confidence level for the Poisson distribution is .8 times the square
root of the expected pipeline (Plossl and Wight, 1967). The safety
level requirement derived from this relationship must be rounded up to
the next integer value to provide at least 80 percent confidence of no
stockout.
The pipeline times used in the computation are specified in TO
2-1-18 (Department of the Air Force, 1982). Total times for the base
and depot repair cycle are shown in Fable A..
The "requirement" for spare engines at peak wartime flying levels
based on these parameters and a wartime demand rate estimate of .91
removals per flying hours is 171 engines. Distributional
considerations, and the fact that some engines will be shipped to
overseas loations, account for the differeice between this number and
the Air Force's computed requirement for 175 engines implied in the
text.
The derivation of the 171 "requirement" is shown in Table A.2,
which also shows the change in the level of stock required if each of
the parameters used in the computation is varied by one unit. The stock
'The need to support many different operating locations tends to
increase the total stockage requirement.
S""..... ... ... . ...... . .. " .... . . . . . . . .. .. .,,..',. .-.-.-..... . -.. , ,.. . ., .- v. .-. ,•.--".'€" t-'' i-"
' _- _.. .. . . ,.. . . . . . . . . . . ..... . . ..". . . . . . ..-- - '" "' " " ..". .."" ' " .- "" - • "' , ".". -

* .. "... ... . .. .
i-
Table A. 1
PIPELINE TIMES USED FOR TF39 ENGINE REQUIREMENTS COMPUTATIONS
Pipeline Segment Base Depot
Removal to start work 2
Base Repair 23Removal to shipment 5
Shipping 4b
Depot Process/Repair 30
Return shippingReceipt to start work 2Build up 16
Total 25 67
apeacetime in-work time is 22 days;
total wartime repair cycle time is 25 days,assuming 2 shifts, 7 days per week.
bShipping times given are within
CONUS. Overseas shipping times are 7 days ineach direction. Only the peacetime shippingtimes are used in the examples to follow. Thebase return rate (percentage of engines thatthe basecan repair) is established as 92 percentin the TO.
level is quite sensitive to all of the parameters except the depot
repair cycle. This long pipeline has little effect because only 8
percent of the engines flow through it.
Figure A.] shows the requirement for several different demand rates
with all other parameters held constant. These demand rates were
*0 developed as follows:
- A: The current demand rate estimate,
* B: Assumes all failures are cycle-driven,
* C: Assumes half of the demand rate is attributable to cycles
and half to hour effects,
0%
-.. A 7.. .. *) * *...
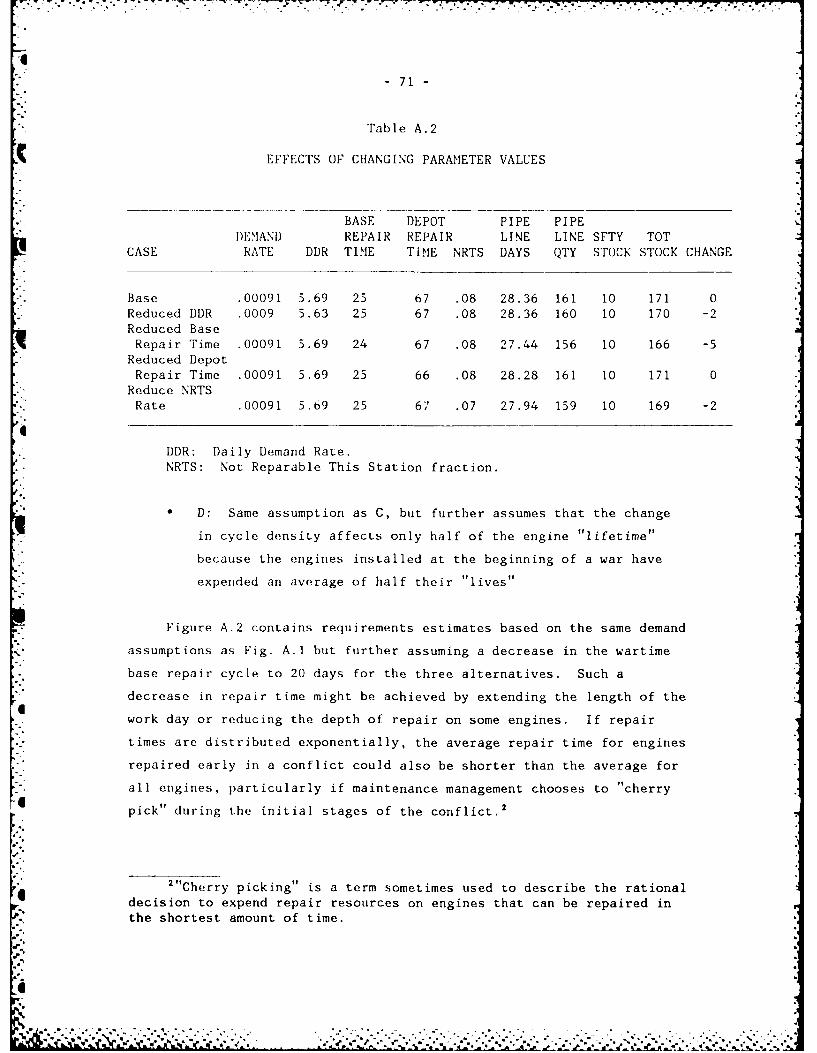
I!- 71 -
Table A.2
CEFFECTS OF CHANGING PARAMETER VALUES
BASE DEPOT PIPE PIPEDEMAND REPAIR REPAIR LINE LINE SFTY TOT
CASE RATE DDR TIME TIME NRTS DAYS QTY STOCK STOCK CHANGE
Base .00091 5.69 25 67 .08 28.36 161 10 171 0Reduced DDR .0009 5.63 25 67 .08 28.36 160 10 170 -2Reduced BaseRepair Time .00091 5.69 24 67 .08 27.44 156 10 166 -5
Reduced DepotRepair Time .00091 5.69 25 66 .08 28.28 161 10 171 0
Reduce NRTSRate .00091 5.69 25 67 .07 27.94 159 10 169 -2
DDR: Daily Demand Rate.NRTS: Not Reparable This Station fraction.
D: Same assumption as C, but further assumes that the change
in cycle density affects only half of the engine "lifetime"
because the engines installed at the beginning of a war have
expended an average of half their "lives"
Figure A.2 contains requirements estimates based on the same demand
assumptions as Fig. A.1 but further assuming a decrease in the wartime
base repair cycle to 20 days for the three alternatives. Such a
decrease in repair time might be achieved by extending the length of the
work day or reducing the depth of repair on some engines. If repair
times are distributed exponentially, the average repair time for engines
repaired early in a conflict could also be shorter than the average for
all engines, particularly if maintenance management chooses to "cherry
pick" during the initial stages of the conflict.2
2"Cherry picking" is a term sometimes used to describe the rationaldecision to expend repair resources on engines that can be repaired inthe shortest amount of time.
"64....- . . .
:¢' " " -','2" "v .",'"" "-.'' " ,-" " - " ". . . • ~ " " ". . .S .. . .~... .
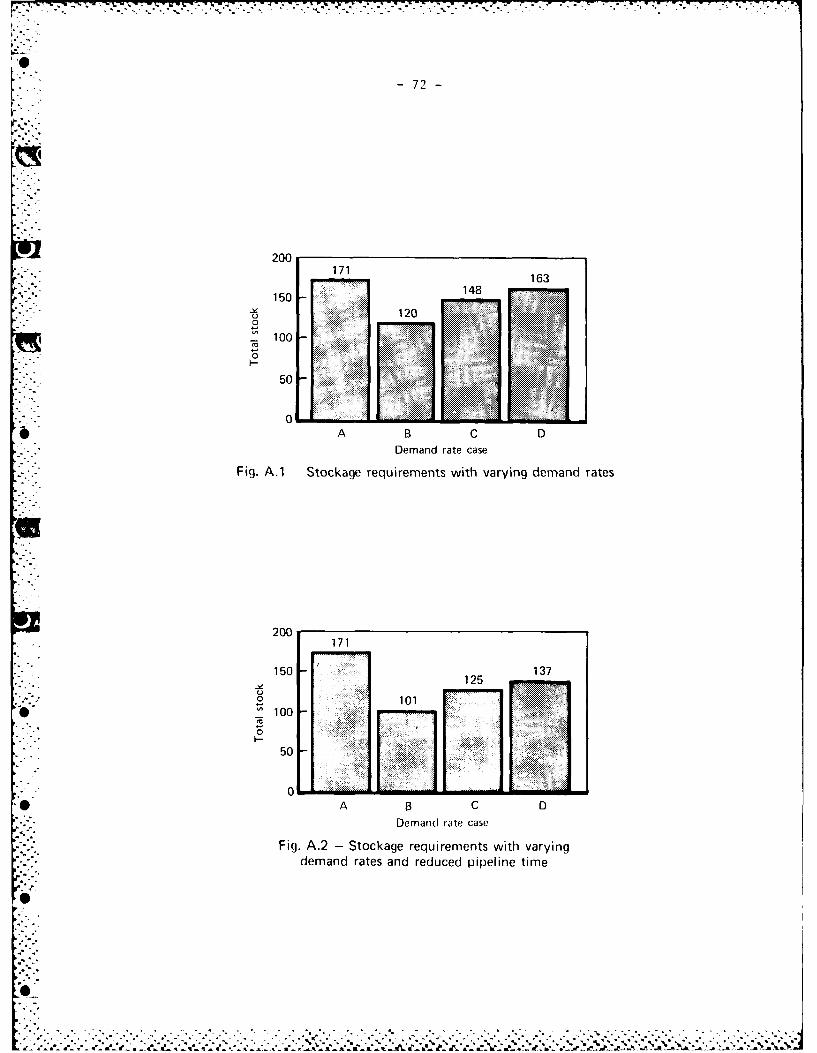
-72
200
151
-10
0100
50
00
Demand rate case
Fig. A.1 -Stockage requirements with varying demand rates
200171
150 1371252 101
* "' 100 I
*A B C D
Fi.A.2 - Stockage requirements with varyingdemand rates and reduced pipeline time
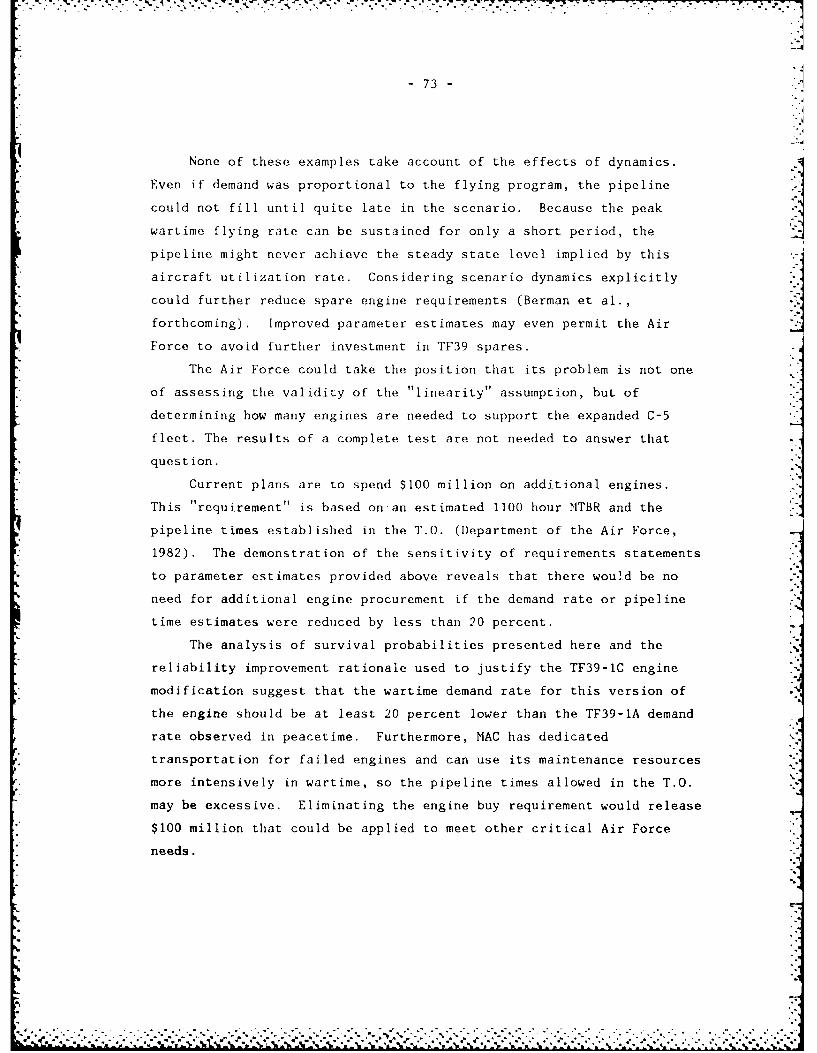
73
None of these examples take account of the effects of dynamics.
Even if demand was proportional to the flying program, the pipeline
could not fill until quite late in the scenario. Because the peak
wartime flying rate can be sustained for only a short period, the
pipeline might never achieve the steady state level implied by this
aircraft utilization rate. Considering scenario dynamics explicitly
could further reduce spare engine requirements (Berman et al.,
forthcoming). Improved parameter estimates may even permit the Air
Force to avoid further investment in TF39 spares.
The Air Force could take the position that its problem is not one
of assessing the validity of the "linearity" assumption, but of
determining how many engines are needed to support the expanded C-5
fleet. The results of a complete test are not needed to answer that
question.
Current plans are to spend $100 million on additional engines.
This "requirement" is based on-an estimated 1100 hour MTBR and the
pipeline times established in the T.O. (Department of the Air Force,
1982). The demonstration of the sensitivity of requirements statements
to parameter estimates provided above reveals that there would be no
need for additional engine procurement if the demand rate or pipeline
time estimates were reduced by less than 20 percent.
The analysis of survival probabilities presented here and the
reliability improvement rationale used to justify the TF39-1C engine
modification suggest that the wartime demand rate for this version of
the engine should be at least 20 percent lower than the TF39-1A demand
rate observed in peacetime. Furthermore, MAC has dedicated
transportation for failed engines and can use its maintenance resources
more intensively in wartime, so the pipeline times allowed in the T.O.
may be excessive. Eliminating the engine buy requirement would release
$100 million that could be applied to meet other critical Air Force
needs.
4 ..

J.J.
- 75 -
Appendix B
THE GE OPSEV MODEL
The manufacturer of the CF6 and TF39 engines has developed an
engineering model that has been used successfully to predict commercial
engine removal rates in several settings. The basic assumptions
embedded in this model are:
* Engine-caused removals are attributable to either functional or
potential failure of individual engine components;
* Component failures are due to a combination of cyclic and
steady state (flying hour) stress;
* The total failure rate for a component is equal to the sum of
its cyclic and steady state failure rates;
* Component failure rates for different mission profiles will
differ because cycle density affects the cyclic component of
the removal rate;
* The failure rate for the engine as a whole is equal to the sum
of the failure rates for these components;
* Increasing the percentage of time that an engine operates at
maximum throttle will hav- a proportional effect on both
elements of the failure rate;
"De-rating" an engine (operating it at less than maximum
allowable power) can greatly increase engine life.
The severity ratio developed by the model is simply the failureI
rate estimated for a particular mission divided by that for a reference
-'-
mission. The data needed to operate it include:
The failure rates for the individual components; iiThe percentage of the failure rate attributable to cyclic
stress;
S%
Thetoalfalue atefo acopoen iseqa to th .sm .
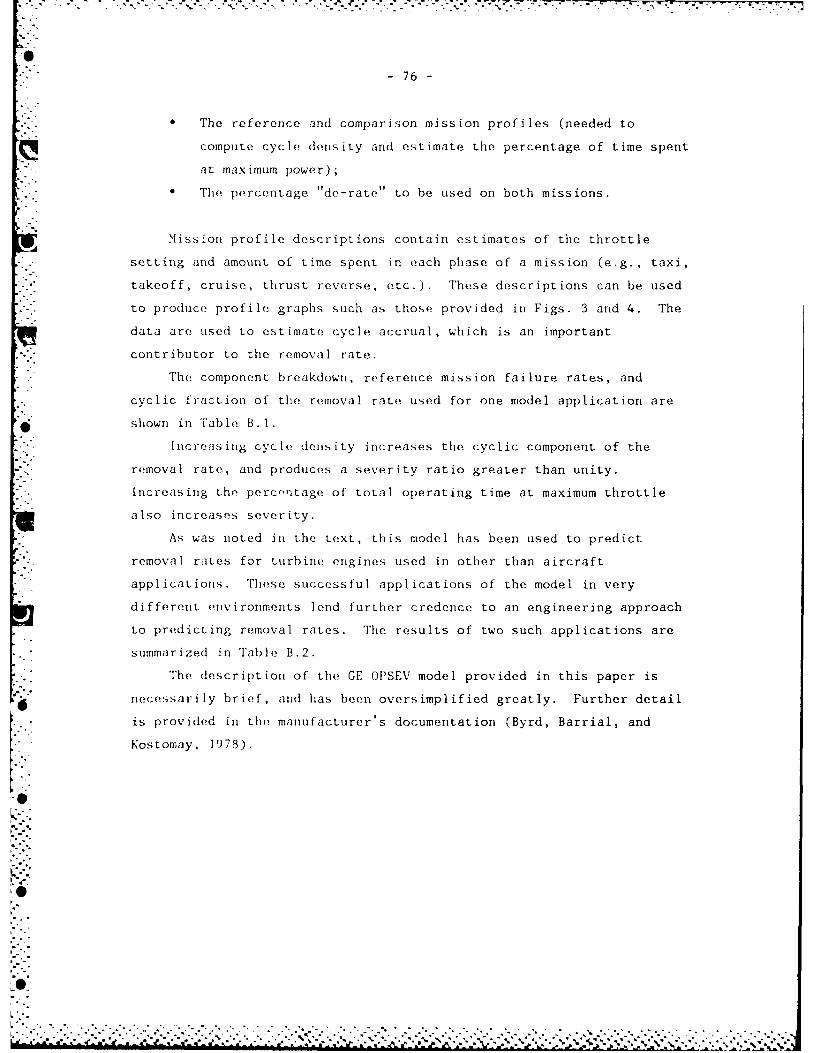
-. ... .. . -. .-.-- - . ... -. t. ..
'0
-"76 -
- The reference and comparison mission profiles (needed to
compute cycle density and estimate the percentage of time spent
at maximum power);
The percentage 'de-rate" to be used on both missions.
Mission profile descriptions contain estimates of the throttle
setting and amount of time spent in each phase of a mission (e.g., taxi,
takeoff, cruise, thrust reverse, etc.). These descriptions can be used
to produce profile graphs such as those provided in Figs. 3 and 4. The
data are used to estimate cycle accrual, which is an important
contributor to the removal rate.
The component breakdown, reference mission failure rates, and
cyclic fraction of the removal rate used for one model application are
shown in Table B. 1.
Increas ing cycle density increases the cyclic component of the
removal rate, and produces a severity ratio greater than unity.
Increasing the percnrtage of total operating time at maximum throttle
also increases severity.
As was noted in the text, this model has been used to predict
removal rates for turbine engines used in other than aircraft
applications. These successful applications of the model in very
different environments lend further credence to an engineering approach
to predicting removal rates. The results of two such applications are
summarized in Table B.2.
The description of the GE OPSEV model provided in this paper is
necessarily brief, and has been oversimplified greatly. Further detail
is provided in the manufacturer's documentation (Byrd, Barrial, and
Kostomay, 1978).
L
L....................... . . ......
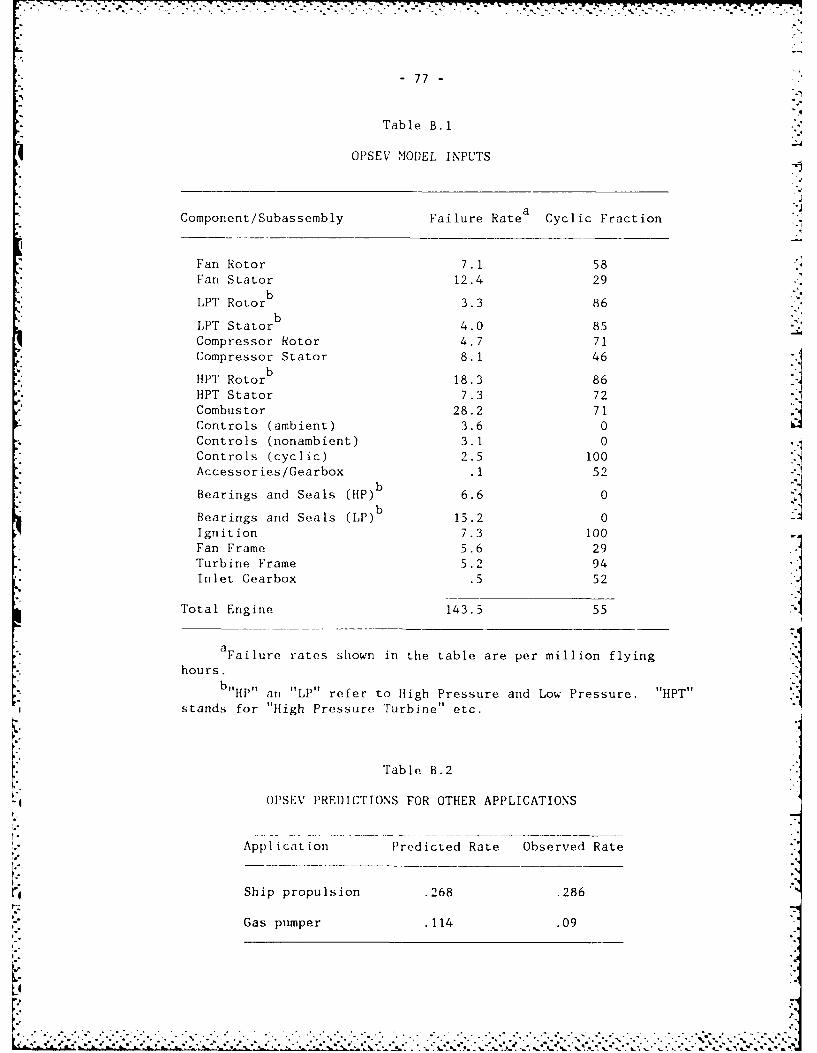
- 77 -
Table B.1
OPSEV MODEL INPUTS
Component/Subassembly Failure Rate Cyclic Fraction
Fan Rotor 7.1 58Fan Stator 12.4 29
LPT Rotor.3 86
LPT Statorb 4.0 85Compressor Rotor
4.7 71
Compressor Stator 8.1 46
1HPT Rotorb 18.3 86HPT Stator
7.3 72 jCombustor
28.2 71
Controls (ambient) 3.6 0Controls (nonambient) 3.1 0Controls (cyclic) 2.5 00
Accessories/Gearbox .1 52
Bearings and Seals (HP)b 6.6 0
Bearings and Seals 15.2 0
-1
Ignition 7.3 100Fan Frame 5.6 29Turbine Frame
5.2 94
Inlet Gearbox .5 52
Total Engine 143.5 55
aFailure rates shown in the table are per million flying
hours.
HP" an "LP" refer to High Pressure and Low Pressure. "HPT"
stands for "High Pressure Turbine" etc.
Table B.2
O(PSEV PREDICTIONS FOR OTHER APPLICATIONS
Application Predicted Rate Observed Rate
Ship propulsion .268 .286
Gas pumper .114 .09
- . . . .. . . . . .. . . . . . . . .
.... .... ... .... ... .... ... .... .... .. .11 . . . . . . . .
[0
- 78 =
Appendix C
DATA PROCESSING
This appendix provides additional detail concerning the procedures
used to process the data used in the exploratory and statistical
analyses as well as several observations concerning the data collected
for the analysis.
DESCRIPTION OF THE DATA
As was indicated in Sec. IV, extracts from two files maintained in
the GPS system were used to create the working datasets:
" Aircraft flying histories,
* Engine installation and removal histories.
The aircraft utilization file records several utilization measures,
including:
* Flying hours,
* Sorties,
• Full-stop landings,
0 Total landings,
0 Total landing gear cycles.
These parameters are recorded by (1) aircraft tail number, (2) location,
and (3) day. Monthly summary records contain the same utilization
parameters summed across operating locations, as well as monthly and
cumulative totals for each of the utilization measures. ThLese data are
also maintained in the Aerospace Vehicle Status and Utilization
-. . Reporting System (Department of the Air Force, 1976).
The Engine Status Reporting System maintained at the Oklahoma City
Air Logistics Center is updated by both periodic inventory
reconciliation and status change reports (Department of the Air Force,
S- -. - ---..---. 2j , . i-"2-,, .l. .2°i-"".1. .:.1"-"f2 . . , . .. ,. .l-.-----/ , :- -2"l.i.:l :=7 -'-l-2: l., .: .2i2.1.:"-'.:"-F i.F , . , . ., :t.:
- 79 -
1975). In addition to the quarterly reports of engine status and hours,
this system is updated whenever an engine is installed, removed, or
transferred to another accountable organization. The latter
transactions are also recorded in the GPS system.
Both installation and removal reports record:
* Aircraft tail number,
* Engine position,
• The transaction date,
* Engine hours at the time of the transaction.
Removal records also contain a code indicating the reason for
removal, which describe the symptoms that led to a decision to remove
the engine rather than the cause of failure. Some of these removal
reasons are not maintenance-significant. For example, an engine may be
removed to facilitate other aircraft maintenance or to fill a hole in
another aircraft. However, the aircraft, transaction date, and engine
hour data can be used to link engine and aircraft records so that it is
possible to include the more complete aircraft utilization data in
engine lifetime histories.
The flying history records obtained for this study cover the period
from late 1972 through the end of 1982. Engine removal records were
available from 1969 through 1982. Not all of these data could be used,
however, because several pre-1976 engine histories were incomplete.
DATA PROCESSING
The engine utilization and engine history records were merged by
aircraft tail number to create engine lifetime records, which contain
all of the aircraft utilization parameters described above for each
engine installed since 1976.
Although most data deficiencies were eliminated by excluding the
pre-1976 data, some problems remained. There were a few inconsistencies
in reported engine installation and removal dates. In addition, some of
the flying records contained obvious errors. For example, some records
recorded more sorties than full-stop landings.
'$ 7,
.. . .. . . .S"

-80
The engine history problems resulted from an effort to improve GPS
data quality several years ago. Although not all transaction dates were
*'[ -corrected, engine hours were recorded accurately. Thus engine hours
were used in conjunction with the flying records to determine the true
installation date. Because every aircraft has only four engines
installed when it operates, reconstructing these engine installation
histories was tedious but straightforward.
Air Force personnel familiar with the GPS system indicated that
some of the problems encountered in the flying records were attributable
to the fact that landing data were not always recorded accurately in the
mi.dl-1970s. The sortie data were considered to be more reliable, so the
data were edited to ensure that the number of landings was at least
equal to the number of reported sorties. Fewer than 5 percent of the
engine utilization records were affected by this edit. Its. effe t, if
any, was to increase the average cycle length computed for the affected
engines in the analyses described in Secs. VI and VII.
The final step in this preliminary processing was to sum the
relevant utilization parameters across engine records when the removal
reason code indicated that the removal was not maintenance-significant.
Thus the records contain utilization data from installation until the
engine was removed for cause "Censored" records--for engines that had
not been removed for cause by the end of 1982--contain the hours,
sorties, etc. accrued on the engine since installation.
These same data were used to create the detailed utilization
records for each month an engine was installed. The removal records
* were used as the key to extract monthly summary records for the engine's
lifetime. Flying hours were allocated for the month of installation and
removal cn the assumption that monthly flying hours were spread equally
across the days in the month
" DATA OBSERVATIONS
The TF39-lA engine has had a maximum Time Between Overhauls (TBO)
of 3000 hours for several years. The TBO limit, which is a policyI. variable, could censor some of the data if time-change limits resulted
in engine removal before performance deterioration or failure required
the engine to be removed.
:..'v. . • - ,.' . ,-'- '- .. ;.. . . .. . . . . . . . . . . . . . . .-... ...,. .. v.. ... "... . . .,'.-.. ..- v... ...-.... ..- '..--.-.. .,
"- - 81 -
There were no "maximum time" removals in the data. In fact, there
were several examples of engines that never "aged" more than 2000 hours
because they were overhauled repeatedly. This suggests either that some
engines are "lemons" or that engines are being evacuated to the depot
when they could be repaired by JEIM. Some recent data undoubtedly
included records for engines forced to the depot for conversion to the
TF39-IC configuration, but this factor alone cannot explain all of these
. apparently premature overhauls.
Some other engines were removed for cause several times after
accumulating only a few hours. These could also have been lemons--
or else maintenance repeatedly failed to correct the problem that
prompted the initial removal.
Despite these problems, compared with the data contained in other
Air Force data systems, GPS data quality was surprisingly good. The
errors that did exist were corrected quite easily. One factor that
differentiates GPS from most other data systems is that it is used for
base maintenance management as well as to collect maintenance data. The
user is motivated to provide accurate inputs by the fact that the
outputs affect his ability to perform his job.
One of the common problems with centralized data collection systems
is that the people responsible for updating the system do not realize
any benefit for their efforts. Those responsible for the GPS system
design appear to have addressed this problem by making the reporting
system a local management system. This helps to account for the
relatively high quality of the data.
4
. .

I! AD-R147 923 ESTIMATING WARTIMIE SUPPORT RESOURCE REQUIREMENTS 2/2STATISTICAL RHO RELATED POLICY ISSIJES(U) RAND CORPSANTA MONICA CA L 8 EMORY JUL 84 RRND/N-2163-RF
UCSIFI F62-82-C-08 8 F/G 0/ NLUNLA EooEEEEE monsoo
Bo i -wv __ '1
11111 11110
1111.25 .~l4 1.6
MICROCOPY RESOLUIION TLST CHART
Z %. '
0 - 83
Appendix D
BAYESIAN ANALYSIS OF REMOVAL DATA
Bayesian methods can be used to update estimates of the engine
removal rate during the course of an experiment designed to test the
effect of cycle length on the removal rate. The example provided below
follows the approach previously documented in the reliability literature
(Soland, 1968, 1969).
Assume that the GE model yields a wartime removal rate estimate for
the TF39-IC of .0007 (before adjusting for increased wartime time at
maximum power). This corresponds to an MTBR of about 1430 hours.
Assume further that removals are believed to be generated by a
-aWeibull process with parameters a and T = 0. Parameter values
are unknown. Uncertainty concerning their values will be expressed by
assuming a discrete distribution for a and a continuous distribution for
conditional on the distribution of a.
The parameter values are not of direct interest but will be useful
for deriving a posterior mean life estimate for the Weibull distribution
(a prior estimate was obtained with the model). Although product
improvements tend to reduce the slope of the hazard function for turbine
engines (Nowlan and Heap, 1974), the IC modification is unlikely to
result in an exponential distribution of TF 39-1C life. Bayesian
procedures will be used to update estimates of the Weibull parameters
*and through them the mean life estimate.
The shape parameter is assumed to lie in the range 1.2 S a < 1.3
based on past data and the expected results of the engine modification
program. Probabilities are assigned to discrete values as follows:1
a. Pr(a. = a)
1.2 .4
1.3 .6
0
'An infinite number of values of a could be assumed. This exampleuses only two to simplify exposition.
01
. ..
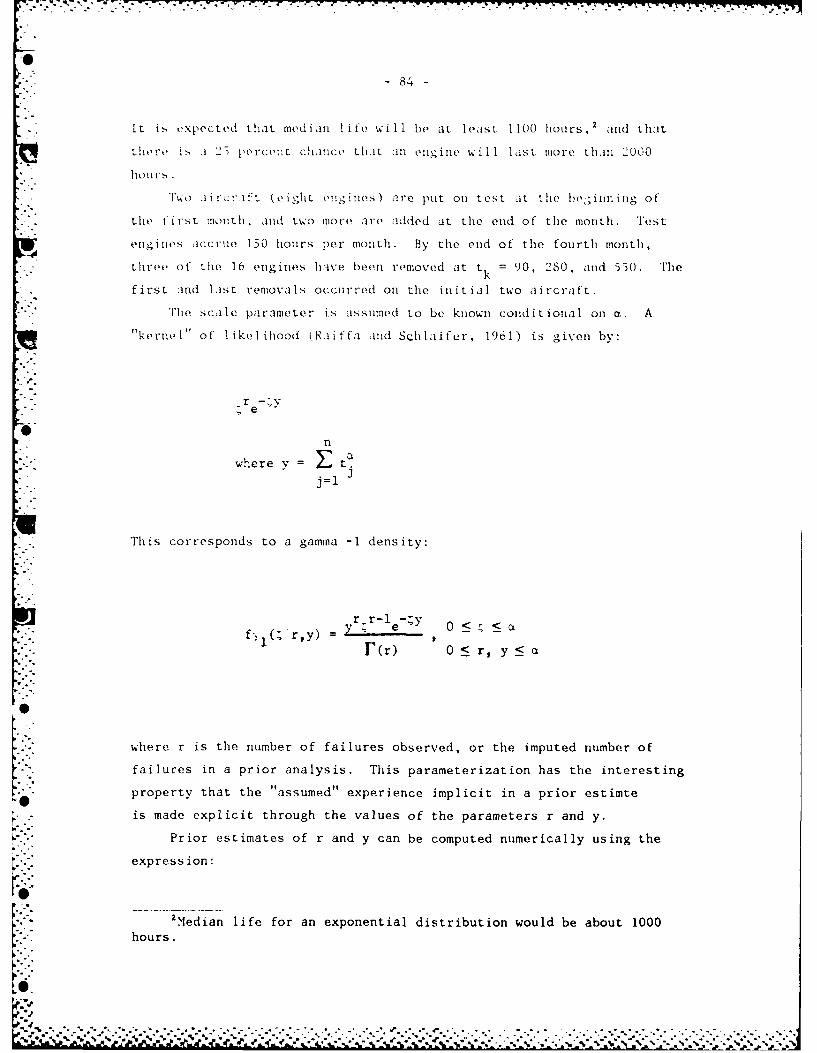
7 84 7--
It is expected that med ian l ife w Il be at 1 ea S t 1100 hours ,2 and( that
there17 As. 2 erntchan1ce that anl eng-ine will I,'S 11store 0th1n 2000
houlr.
Two i rcratt boight e'.nes) are, put Onl test at the he' inn iii" of
*the I i rs t month , .ind two mnore are added at, the enld Of the mon th . Te st
engines accrue 150 hours per month. By the end of the fourth month,
three of the lb) engines have been removed at t k = 90, 280, and 550. The
first and last removals occurred onl the initial two aircraft.
The scale parameter is assumned to be known conditional onl a. A
"kernel" of likel1ihood (Ra iffa and Sch laifer , 1961) is given by:
% r -- ye
n
where y =
This corresponds to a gamma -1 density:
yr r-1 e-;y 0
F~r) 0 ~ ,y <
where r is the number of failures observed, or the imputed number of
failures in a prior analysis. This parameterization has the interesting
property that the "assumed" experience implicit in a prior estimte
is made explicit through the values of the parameters r and y.
Prior estimates of r and y can be computed numerically using the
expression:
2 Median life for an exponential distribution would be about 1000hours.
ok
.................... .... .

6 -85-
It r
iii -F t 0J = y~ /(y. ']
(The notation E', y', r' refers to the prior estimates).
These values for the data available before the experiment are:
1.2 14.46 908911.3 4.29 51276
rSoland defines an additional statistic v= H t
k=1k
where t k are the times of the r failures. The likelihood of the
*evidence given the preposterior estimates of the Weibull parameters is
then. ;ivenl by:
r rCt. v e
and a posterior distribution of a can be developed using Bayes' theorem
as follows:
P r Y'~ Fr: [a.~ r)
Pr jcL =L ari ~r) [r \)r r.
Pai Ii gi I ~r
where r, r.i + r, y, =Yi + y1.
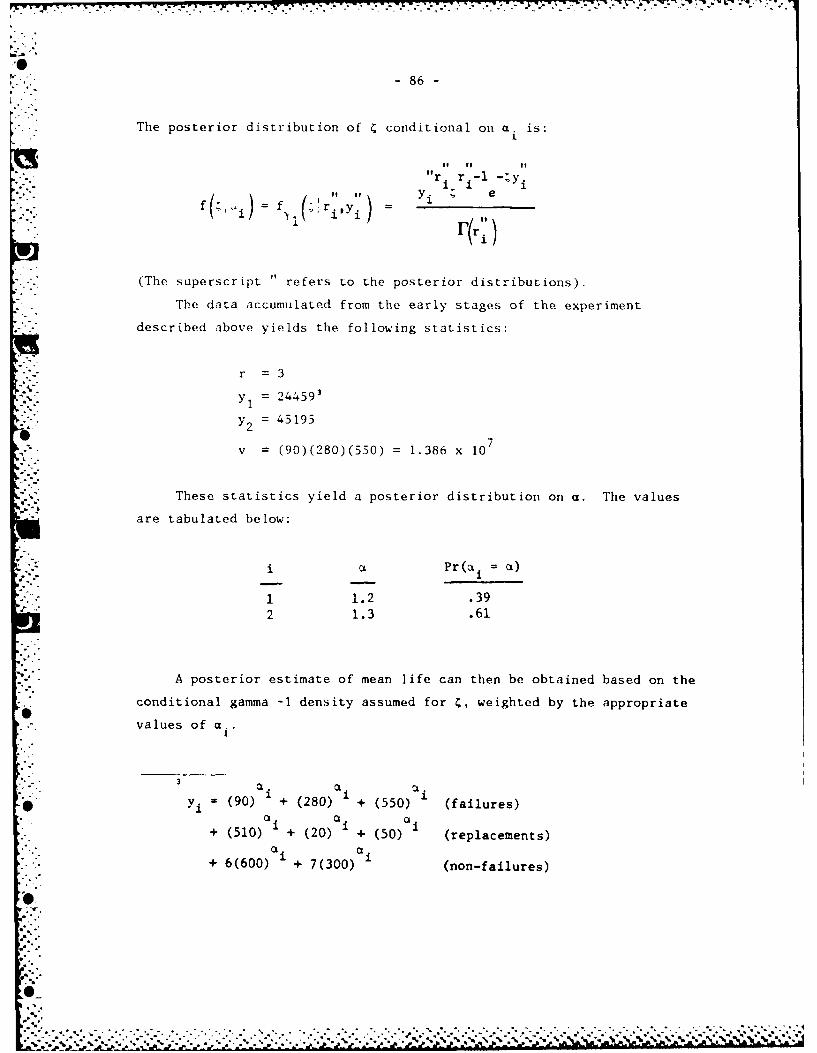
i.- -.86.
The posterior distribution of C conditional on a. is:
"r. r -1-y1 ifr'...fr.. ), Yi['... f ; ,i = f - 'ri Y i
I'(r)
* - (The superscript " refers to the posterior distributions).
The data accumulated from the early stages of the experiment
described above yields the following statistics:
r 3
Y 244591
-) = 45195
v = (90)(280)(550) = 1.386 x 10
These statistics yield a posterior distribution on a. The values
are tabulated below:
- a Pr( i = c)
1 1.2 .39
2 1.3 .61
A posterior estimate of mean life can then be obtained based on the
conditional gamma -1 density assumed for , weighted by the appropriate
values of a..I
-a. Cl. C
" (90)++ (550) (failures)•~ Y+ (90550)(80.. ai a t a
+ (510) + (20) + (50) (replacements)[".a i a i
i C1i+ 6(600) + 7(300) (non-failures)
.p%
O0
• ... . . .' •.. ,. - , - • '," ' .'.", '-'-'% -. . , . % % .,, % ,% % " •* V% % °
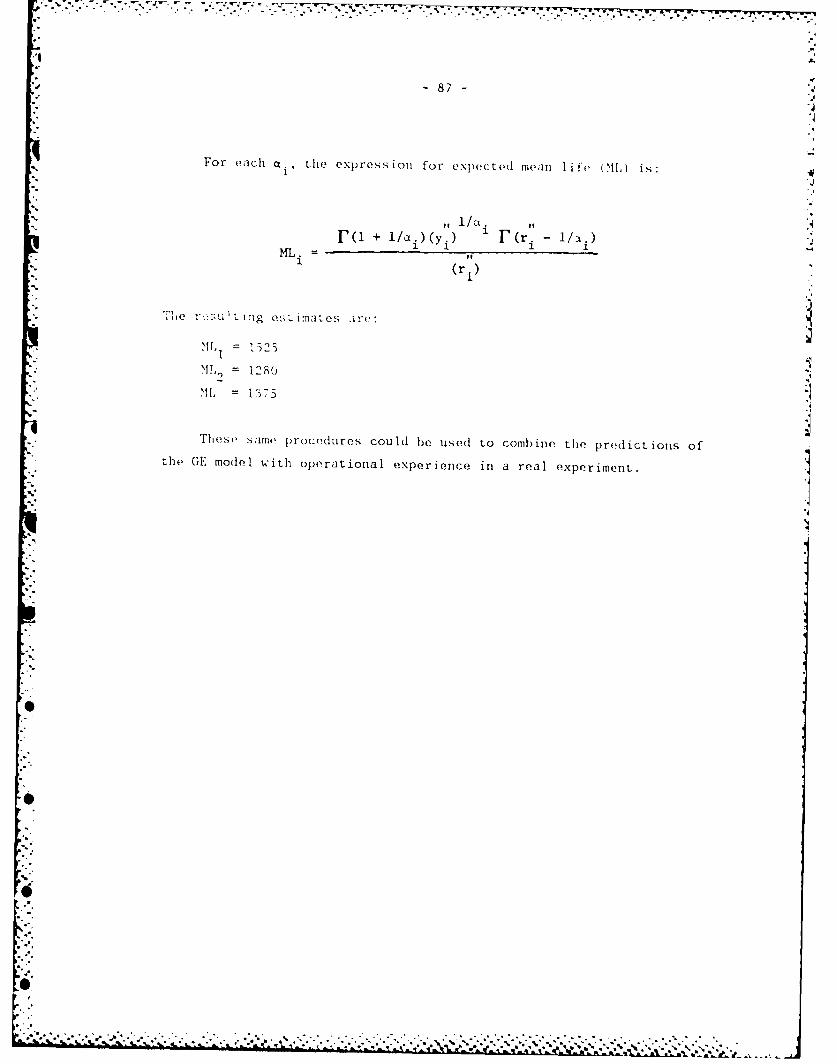
*'- . -
878
For each a , the expression for expected mean life 1.,) is:
+/i (Yi (ri-,, 1/at ,,1
" 7(1 + l/n)y) i VFr - 1/a.)MfL. =
1" - ( r .)
" 1-The r';U!t ltg et;s imates ire:
M L = 1525
M 1 1280
Theso same procedures could be used to combine the predictions ofthe GE model with operational experience in a real experiment.
%
hS4
........... .!I
% * * . * * -
* 4°° *
6
- 89 -
BIBLIOGRAPHY
Altman, O.L. and C.G. Goor, "Actuarial Analysis of the Oprating Life ofB-29 Aircraft Engines," Journal of the American StatisticalAssociation, 48, 1948, pp. 190-203.
American Airlines, Inc., The VALUE of Maintenance, presented at. the FAAMaintenance Symposium, Oklahoma City, November 1967.
Armitage, P., "The ;Aole of Randomization in Clinical Trials," Statisticsin Medicine, 1, 1982, pp. 343-352.
Barlow, R.E. and R.A. Campo, "Total Time on Test Processes andApplications to Failure Data Analyses," Reliability and Fault TreeAnalysis: Theoretical and Applied Aspects of System Reliability andSafety Assessment, SIAM, Philadelphia, 1975, pp. 451-481.
Barlow, R.E. and F. Proschan, Statistical Theory of Reliability and LifeTesting: Probability Models, Holt, Rinehart and Winston, Inc., New
York, 1975.
Barlow, R.E. and E.M. Schener, "Estimation from Accelerated Life Tests,"
Technometrics, 13-1, February 1971, pp. 145-159.
Berman, M.B., T.F. Lippiatt, E. Poggio, and R. Sims, Predicting AircraftComponent Removal Rates with Varying Flying Programs: A TF33-7 EngineCase Study, The Rand Corporation, unpublished research.
Berrettoni, J.N., "Practical Applications of the Weibull Distribution,"ASQC Convention Transactions, Cincinnatti, 1962, pp. 303-323.
Birkler, J. L. and J. R. Nelson, "Aircraft Turbine Engine MonitoringSystems: Overview and Lessons Learned from Six Case Studies," TheRand Corporation, P-6337, May 1979.
* Breslow, N., "Statistical Methods for Censored Survival Data,"Environmental Health Perspectives, 32, 1979, pp. 181-192.
Byrd, F., H. Barrial, and D. Kostomay, Turbine Engine Life DevelopmentDefinition: Final Report, General Electric Aircraft Engine Group,
AFAPL-TR-78-45, June 1978.
Carlyle, L. Comparison of Military and Commercial Design-to-CostAircraft Procurement and Operational Support Practices, McDonnellDouglas Corp., Long Beach, AFFDL-TR-75-147, January 1976.
* Casey, D.L., Logistics Impact of Longer C-5 Missions, AFLC TechnicalReport No. 76-16, May 1977.
S%
"N*

r 74w, 7-.j .".."-:. -..- - .-...-:. .,.. .....->-.....- .-,< .. . .. ,... ....,j.. . , ..<.. .. .... .. ,.. .-.....,.. .....
90 -
Choro fas, I). N St:a ist ical 'roct,.ssos and Rliability Engineering, D.
Van Nos .rand (.o. I nc. , Pri ceto n 19o0.
Coppola, A.,":av' s .an Reliability Tests Made 'ractical, Rome AirD-o Ive opmont Coiter , RAI)C-TR-8 1-106, Ju lv 1981
Cote , S. .. and J. 1,. B irk r , Simulated Mission Fndurance Test (SMAT)
for ar i:rcr: En'rgine to be Used in a Fighter/At tack Role, Naval Air
Development Cen ter, NAI)C-77,031-30, Apri1 1979.
Davis, N.K. , Un:.,ed Airlines T,;t and Replace as Nece.ssary (TARAN)
Progr.,, preseflted at the FAA >1.]intenance Symposium, Oklahoma City,OK, Noem br '6.
Department of the Air Force, Aerosuace Vehicle Sllt us and Utilization
Reporting System, AI-R-oS-I10, 1976.
Department of the Air Force, Aircraft Engine and Module Management by
Operating Limits and Pipeline Times, TO 2-1-18, July 1982.
Department of the Air Force, "An Analysis of the Aircraft ReplenishmentSpares Acquisition Process: Report of the Corona Require Study
Group," Mlarch 1983.
Department of the Air Force, C-5 Ground Processing System, TO 1-1G-1,
1981.
Department of the Air Force, Engine Status Reporting, AFM-400-1, August-$. 1973.
Department of Defense, Reliability Design Qualification and Production
Acceptance Tests: Exponential Distribution, MIL-STD-781C, October
1977.
Donaldson, T.S. and A.F.M. Sweetland, The Relationship of Flight-Line
Maintenance Man Hours to Aircraft Flying Hours, The Rand Corporation,
R%.-3701-PR, August 1968.
Drezner, S.M., "The Analogs 80 Project: Reallocation of Activities
Alternative," The Rand Corporation, unpublished briefing, 1975.
Embry, L.B., "Estimating Wartime Depot Workload," The Rand Corporation,
unpublished briefing based on results of analysis of the landing gearfacility at Ogden ALC, 1982.
Embry, L.B. and G.B. Crawford, "Extrapolating Peacetime DemandExperience to wartime Activity Levels: The 'Linearity' Issue,"
*.. Published in the Proceedings of the USAF Capability Assessment
. Symposium (LOGCAS 83), Air Force Logistics Management Center, AFLMCReport 781029-4, May 1983.
%
.-.. .
1* -*.-..- .. - . . . . . . . . . . . . . ..-
Feeney, G. J., J. W Petersen and C. C. Sherbrooke, "An Aggregate BaseStockage Policy for Recoverable Spar(, Parts," The Rand Corporation,R-3044-PR, June 19o3. 4
Freedman, L.S., "T1'ables of the Number of Patients Required in ClinicalTrials using the Logrank Test," Statistics in Mdicine, 1, 1982, pp.121- 129..
Gandara, A. aid M.D. Rich, Reliability Improvement Warrant is forMil icary Procurement, The Rand Corporation, K-22o4-AF, Do)emrwr 1977.
Gans, D.J. , "A Simple Method Based oil Broken-line Interpolttion forDisplaying Data from Long-Term Clinical Trials," Stat'st ics inMedicine, 1, 1982, pp. 131-137.
Groover, C.W., "Resource Allocation for Readiness and Sustainability,"unpublished briefing delivered at the Industrial College of the ArmedForces, 1984.
Hahn, G.J. and S.S. Shapiro, Statstical Models in Engineering, Jo1 .,
Wiley & Sons, Inc., New York, 1967.
Hall, W.J. and J.A. Wellner, "Confidence Bands for a Survival Curve fromCensored Data," Biometrika, 67-1, 1980, pp. 133-143.
Hirschman, A.O., Exit, Voice and Loyalty, Harvard University Press,Cambridge, 1970.
Hitch, C.J. and R.N. McKean, The Economics of Defense in the Nuclear Age,The Rand Corporation, R-346, March 1960.
Hunsaker, H.D. et al., Logistics Impact of Sortie Oriented AircrewTraining, AFLC Technical Report No. 76-7, April 1977.
Jones, T.V., "Logistics and the Military End Game," Defense ManagementJournal, 19, December 1983, pp. 12-16.
Kahn, H.D., "Least Squares Analysis of Accelerated Life Tests for the
Power Rule and Arrhenius Models," The Theory and Applications ofReliability with Emphasis on Bayesian and Nonparametric Methods,Volume II, Academic Press, New York, 1)77, pp. 381-400.
Kalbfleisch, J.D. and R.L. Prentice, The Statistical Analysis of
Failure Time Data, John Wiley and Sons, New York, 1980.
Kao, J.K., "A Graphical Estimation of Mixed Weibull Parameters in Life-
Testing of Electron Tubes," Technometrics, 1-4, November 1959, pp..
389-407.
Kaplan, E.L. and P. Meier, "Nonparametric Estimation from IncompleteObservations," Journal of the American Statistical Association, 53,June 1958, pp. 457-481.
.V. h .," *. ,. . . - . + . . . . . . . .. . . .. . . . , , . . ... .. o . .. .%--*.-.% %,...-.+ .+ . % . .. % ," ,..,.- '- . ..,.- ,. .. . . . .. .. . . . , . ._.,. . .,.. .. .. , , ,, b JR ,, * P .p ,,. et+ ,+ .
- 92
Kay, R. and M. Schumacher, 1'nbiased Assessment 0l Treatment Effects onDisease Recurrence and Survival in Clinical Trials, Statistics inlledicine, 2, 1983, pp. 41-58.
Kern, ]. A .,and T. M. Darns, OperaLional Influences on Rl jbiiity, Rome
Air Development Center, AFSC, RADC-TR-76-366, December 19b6.
Landi, I).M.. Positionrig Recov'erab H Spares in Military AirliftNetworks, The Rand Corporation, RM-5087-PR, larch 1967.
'-" Lippiatt T.F. "Analysis of Maintenance Data from the SALTY ROOSTERExe rc ise , unpublished briefing, The Rand Corporation, 1978.
Mann, N.R., Exter:sion of Results Concorning Parameter Estimators,Tolerance Bounds and Warranty Periods for Wibull Models, Rocketdyne,Canoga Park, Ca., ARI, 70-0010, January 1970.
Miller, D.R. and N.D. Singpurwalla, Failure Rate Estimation Using RandomSmoothing, George Washington University School of Engineering andApplied Science, Washington, D.C., T-347, A:)ril 1977.
Muckstadt, J.A., "A Model for a Multi-Item Multi-Echelon InventorySystem," Management Science, 20-4, December 1973, pp. 472-481.
Mullins, General J.P., "Establishing Supportability as a Critical
Requirements Factor," Defense Management Journal, 19-4, December 1983,pp. 2-6.
National Aeronautics and Space Administration (NASA) Lewis ResearchCenter, Aircraft Engine Diagnostics, Proceedings of a Conference held
in Cl *, oland, Ohio, May 1981.
Nelson, L.S. , "Weibull Probability Paper," Evaluation Engineering,
May/June 1967.
Nelson, Wayne, "Hazard Plotting for Incomplete Failure Data," Journal of
Quality Technology, 1-1, January 1969, pp. 27-52.
Nowlan, F.S. and t1. Heap, Reliability-Centered Maintenance, Office of
the Assistant Secretary of Defense (Manpower, Reserve Affairs andLogistics), Washington, D.C., 1974.
Parzen, E., "On Estimation of a Probability Density Function and Mode,"
Ann. Math. Statist., 33, 1962, pp. 1056-1076.
Peto, R., M.C. Pike, P. Armitage, N.E. Breslow, D.R. Cox, S.V. Howard,: N. Mantel, K. MIctherson, J. Pete, and P.G. Smith, "Design and Analysis
of Randomized Clinical Trials Requiring Prolonged Observation of Each
Patient I. Introduction and Design," Briish Journal of Cancer, 34,1976, pp. 585-612.
io- .

Peto, R., M.C. Pike, P. Armitage, N.E. Breslow, D.R. Cox, S.V. Howard,N. Mantel, K. McPherson, J. Peto, and P.G. Smith, "Des igni and Analysisof Randomized Clinical Trials Requ iring Prolonged Observation of Each
e.o". Patient II. Analysis and Examples," British Journal of Cancer, 35,1975, pp. 1-39.
Plossl, G.W. and O.W. Wight, Production and Inventory ControlPrentice-Hall, Inc., Englewood Cliffs, N.J., 1967.
Raiffa, Hf., Decision Analysis, Addison-Wesley Publishing Company,Reading, >lass., 1968.
Raiffa, H. and R. Schlaifer, Applied Statistical Decision Theory,Harvard Graduate School of Business Administration, Boston, 1961.
Rice, D.B., Defense Resource Management Study: Final Report,Washington, D.C., 1979.
Rice, J. and M. Rosenblatt, "Estimation of the Log Survivor Function andL'' Hazard Function," The Indian Journal of Statistics, 38-A-], 1976, pp.* 60-78.
Rich, M.D. and S.M. Drezner, "An Integrated View on Improving CombatReadiness," The Rand Corporation, N-1797-AF, February 1982.
-- Rogers, W.H. and J. Hanley, "Weibull Regression and Hazard Estimation,"SAS Users Group International Conference Proceedings, February 1982.
Sallee, G. Philip, Economic Effects of Propulsion System Technology onExisting and Future Transport Aircraft, American Airlines Inc., NASACR 134645, July 1974.
Shaw, Col. C.C., The Effect of System Operation Duration on FailureRate: A Study of Strategic Airlift Aircraft, U.S. Air Force ACOSStudies & Analysis, December 1982.
Shimi, I. and C.P. Tsokos, "The Bayesian and Nonparametric Approach toReliability Studies: A Survey of R' cert Work," The Theory andApplications of Reliability with Emphasis on Bayesian andNonparametric Methods, Volume II, Academic Press, New York, 1977, pp.5-47.
* Shulman, H. and J. Gebman, "Maturational Development," unpublishedbriefing, The Rand Corporation, 1981.
Shulman, H., J. Gebman and N.Y. Moore, "F-15 AIS Study," unpublishedbriefing, The Rand Corporation, 1980.
Shurman, Maurice, B-52D Operations - Southeast Asia vs. CONUS, BoeingMilitary Airplane Systems Division, D162-10015-1, September 1970.
.% .. *. .. . . . . . .

-94-
* Surmn ,Mauice 'Time -lDepelen11t Fa iiore Rate s for A ircra ft
* Componenrts '' unlpublisheIld br ie fing , Boe ing Aerospace Company , 1979.
Siegel . S. , Nonparairetric Stati1st ics for the Behavioral Sciences,M(Ari-liilBlook Co., Inc-. , New 'York, 16,
S imon . R. aid Y . J Leev, ''Noiparamet r ic Con fidence Limits for Snurv iv'alP rI biI anid Med (ian Su rv ival T'ime ,"' Cancer Treat mont Reports , 66-I , J ioo ry 1982, pp. 3-2
* S ln.purwal In , N.1). and F.A. Al -Khavval , ccelerated Life Tests Us ing-. - the Powe r La w M1odel for the We ibull D)istribhut ion ,"' The Theory and
A,.pl )icat ions of Re]liability with Ephasi's on Bayesian andNonparame7tric Methods, Volume 11 , Academic Press, New York, 1977. pp.381 -400.
So l and, R . '1. , 'Bayes ian Analiys is of the We ibu 11 Process with UnknownScale Parameter and Its Application to Acceptance Sampling," IEEETransactions on Reliabili;ty, R-17-2, June 1968, pp. 84-90.
* So land, R . M. , Baves ian Ana lys is of the We ibulI I Process with UnknownScale and Shape Paramters," IEEE Transact ions on Re]liability, R-18-4,November 19o'., pp. 181-184.
Tribus, M1yron, Rat ional Descript ions, Decisions and Designs, PergamonPress, New York, 1907.
Tukey, J.W. , Exploratory Data Analysis, Addison-Wesley Publishing Co. ,Reading, Mass., 1977.
Walker, G.lI. , Logist ics Forecasting for- Achieving Low Life Cycle Costs,Advisory Group for Aerospace Research and Development, Ah'ARD-ILS-107,May 1980.
Walker, W., J.M. Chaiken and E.J. Ignall (eds.) Fire DepartmentDeployner?t Analysis, North Holland, New York, 1979.
* Weiholl, W. , "A Statistical Distribution Function of Wide* Applicability," Journal of Applied Mechanics, 18, 1951, pp. 293-297.
Wuolf, R. N., Encine Diagnostics Program: CF6-50 Engine PerformanceDeteriorat ion, General Electric Company Aircraft Engine BusinessK:Group, NASA CR-159867, November 1980.
%Ir

I7"
J.
6
4..44
..
4247
iAlt
* *Wm