estimating species trees using multiple-allele … · estimating species trees using...
TRANSCRIPT

ORIGINAL ARTICLE
doi:10.1111/j.1558-5646.2008.00414.x
ESTIMATING SPECIES TREES USINGMULTIPLE-ALLELE DNA SEQUENCE DATALiang Liu,1,2,3 Dennis K. Pearl,4,5 Robb T. Brumfield,6,7,8 and Scott V. Edwards1,9
1Museum of Comparative Zoology, Harvard University, Cambridge, Massachusetts 021382E-mail: [email protected]
4Department of Statistics, The Ohio State University, Columbus, Ohio 432105E-mail: [email protected]
6Museum of Natural Science, 119 Foster Hall, Louisiana State University, Baton Rouge, Louisiana 708037Department of Biological Sciences, Louisiana State University, Baton Rouge, Louisiana 70803
8E-mail: [email protected]: [email protected]
Received August 8, 2007
Accepted April 15, 2008
Several techniques, such as concatenation and consensus methods, are available for combining data from multiple loci to produce
a single statement of phylogenetic relationships. However, when multiple alleles are sampled from individual species, it becomes
more challenging to estimate relationships at the level of species, either because concatenation becomes inappropriate due to
conflicts among individual gene trees, or because the species from which multiple alleles have been sampled may not form
monophyletic groups in the estimated tree. We propose a Bayesian hierarchical model to reconstruct species trees from multiple-
allele, multilocus sequence data, building on a recently proposed method for estimating species trees from single allele multilocus
data. A two-step Markov Chain Monte Carlo (MCMC) algorithm is adopted to estimate the posterior distribution of the species tree.
The model is applied to estimate the posterior distribution of species trees for two multiple-allele datasets—yeast (Saccharomyces)
and birds (Manacus—manakins). The estimates of the species trees using our method are consistent with those inferred from other
methods and genetic markers, but in contrast to other species tree methods, it provides credible regions for the species tree. The
Bayesian approach described here provides a powerful framework for statistical testing and integration of population genetics
and phylogenetics.
KEY WORDS: Bayesian hierarchical model, coalescent theory, gene tree, species tree.
The advance of molecular biological technologies has enabled
the rapid collection of multiple alleles from a given species
in the context of building phylogenetic trees of multiple species.
Multiple-allele data contain more information about the evolu-
tionary history of species than single allele data, and recent years
have seen a growth of statistical approaches that effectively com-
bine the multiple-allele information from multiple loci. These
3Corresponding author: Organismic and Evolutionary Biology, Har-
vard University, 26 Oxford Street, Cambridge, Massachusetts 02138
approaches address several important phylogeographic models,
such as gene flow, population growth, and population divergence
(Nielsen and Slatkin 2000; Beaumont and Rannala 2004; Hey and
Nielsen 2004; Degnan and Salter 2005; Beerli 2006; Degnan and
Rosenberg 2006). However, available techniques for estimating
phylogenetic trees from multiple-allele data remain limited, de-
spite the fundamental importance of trees for historical inference.
Commonly used techniques, such as the concatenation method
(Nylander et al. 2004), the consensus tree method (Bull et al.
1993; de Queiroz 1993; Huelsenbeck et al. 1994; de Queiroz et al.
2080C© 2008 The Author(s) . Journal compilation C© 2008 The Society for the Study of Evolution.Evolution 62-8: 2080–2091

ESTIMATING SPECIES TREES
1995; Wiens 1998), and gene tree parsimony (Page and Charleston
1997; Slowinski et al. 1997; Page 1998) are not well suited for
pooling the information from multiple alleles and multiple genes
to build a species tree in which only the actual species, instead
of all individual alleles, are of interest. These techniques may
not be able to provide useful information on the ancestral his-
tory of species if the individual alleles of a species appear to
be polyphyletic, which unfortunately occurs in many multiple-
allele datasets, even for mitochondrial DNA (Funk and Omland
2003).
The deep coalescence approach (Maddison and Knowles
2006) has been shown to be useful in estimating species trees
from multiple-allele data. It does so by finding the species tree
that minimizes the topological discrepancy—the number of deep
coalescences—between the collected gene trees and the proposed
tree, summed over all genes. Although useful, this approach
ignores information about branch lengths in gene trees, which
may compromise and limit the utility of phylogenetic inference.
A Bayesian hierarchical model has been proposed to estimate
species trees for single allele data (Edwards et al. 2007; Liu and
Pearl 2007). In this article, we extend that Bayesian hierarchi-
cal model to reconstruct species trees from multiple-allele data.
The multiple-allele Bayesian hierarchical model is able to extract
information from all individual alleles of a species to make infer-
ences concerning the ancestral history of the species and therefore
estimate a species tree, despite the fact that the taxonomic units
in the gene trees are alleles. Using simulations, we show that
the Bayesian estimate appears to be statistically consistent in the
sense that it moves closer to the true species tree in probability as
the number of genes and the sequence length go to infinity, even
in situations in which there is substantial topological and branch
length heterogeneity among genes and between the gene tree and
species tree.
Details of the ModelWe use the following abbreviations: D: Sequence data; G: a vector
of gene trees across genes; �: Parameters in the likelihood func-
tion except the gene tree vector G; S: Species tree; �: Transformed
effective population sizes, � = 4Ne�.
The Bayesian hierarchical model consists of five compo-
nents: (1) the likelihood function, f (D | G, �); (2) the prior dis-
tribution of �, f (�); (3) the probability distribution of gene tree
vector G given the species tree S (topology and branch lengths)
and �, f (G | S, �); (4) the prior distribution of the species tree,
f (S); and (5) the prior distribution of �, f (�).
The likelihood f (D | G, �) is derived from substitution mod-
els such as the HKY (Hasegawa et al. 1985) or GTR (Lanave
et al. 1984) model for nucleotides or the WAG model for proteins
(Whelan and Goldman 2001). The prior distribution of � depends
Figure 1. A multiple-allele gene tree and a species tree. There are
two alleles for species A (A1 and A2), three alleles for species B
(B1, B2, B3), and one allele for species C (C1). The shaded regions
in the gene tree represent the corresponding populations in the
species tree. Populations A and B are contemporary populations
for species A and B. Population AB is the ancestral population of
species A and B. Population ABC is the ancestral population of
species A, B, and C.
on the nature of the data at hand. Different users may choose dif-
ferent priors for �. For example, a variety of options for the prior
of � are available in MrBayes (Huelsenbeck and Ronquist 2001;
Ronquist and Huelsenbeck 2003), which we use to sample gene
trees from the posterior distribution.
The probability distribution of gene trees given the species
tree has been derived under the Kingman coalescent process
(Kingman 1982, 2000) for the case in which multiple alleles are
sampled from individual species related in a phylogeny (Rannala
and Yang 2003). For example, consider the case when there are
three species—A, B, and C (Fig. 1). In this example, two gene
copies are sampled from species A, three copies from species B,
and one copy from species C. The shaded areas in A and B repre-
sent current populations of species A and B. Population AB is the
common ancestral population of species A and B, whereas ABC
is the common ancestral population of all three species. The pop-
ulation size of an extant population is considered only if multiple
alleles are sampled from that species. In this example, species A
and B have estimable population sizes.
The probability distribution of a gene tree topology and the
(m − n) coalescent times t n+1, . . . , tm for a single population
reduced from m to n sampled alleles along a branch of length � in
a species tree is (Rannala and Yang 2003)
exp
(−n(n − 1)
�
(� −
m∑j=n+1
t j
))m∏
j=n+1
[− 2
�exp
(− j( j − 1)
�t j
)].
(1)
For a vector of gene trees, G, that are independent given the species
tree, we multiply (1) across gene trees to find the likelihood for a
single population, i.e.,
EVOLUTION AUGUST 2008 2081
LIANG LIU ET AL.
W∏k=1
{exp
(−nk(nk − 1)
�
(� −
mk∑j=nk+1
tk j
))
×mk∏
j=nk+1
[2
�exp
(− j( j − 1)
�tk j
)]}, (2)
in which W is the number of genes. We can simplify (2) as(2
�
)a
e−b� , (3)
where b = ∑Wk=1{nk(nk − 1)(� − ∑mk
j=nk+1 tk j ) + ∑mkj=nk+1
j( j − 1)tk j } and a = ∑Wk=1 (mk − nk). We use a conjugate prior
for � to reduce the computational demand for species tree estima-
tion (Hey and Nielsen 2007). With a conjugate prior, the parameter
� can be more easily integrated out of the likelihood function, en-
abling us to form a new likelihood function without �. Here we
choose the inverse gamma distribution as the conjugate prior of
�, i.e.,
f (�) = ��
�(�)�−�−1e−�/�
with mean ��−1 and variance �2
(�−1)2(�−2) for � > 2. The likelihood
of a gene tree in a single population is then obtained by integrating
out � in (3) with respect to the conjugate prior of �, i.e.,∫�
(2
�
)a
e− b�
��
�(�)�−�−1e
−�� d� = 2a��
�(�)
�(� + a)
(� + b)(�+a).
The probability density f (G | S) of the gene tree vector G given
the species tree is the product of such likelihoods across all ex-
tant and ancestral populations under the assumption that the co-
alescent processes within different populations are independent.
Apparently, f (G | S) does not involve �. When using an MCMC
(Hastings 1970) algorithm to estimate the posterior distribution
of the species tree, we would then not have to update � and would
therefore reduce the computational burden for our species tree
estimation routine, although � can still be estimated with this ap-
proach. The parameters � and � in the inverse gamma distribution
reflect the magnitude of influence of the prior distribution of pop-
ulation sizes on the function f (G | S). Large values of � and �
may result in strong influence of the inverse gamma prior on the
function f (G | S). We suggest using small values (e.g., � = 3 and
� = 0.03) for � and � to reduce the effect of the prior on the
function f (G | S) unless there exists some information about the
possible values of � and �. Another choice for the prior on � is
the gamma distribution. In our current implementation, the user is
allowed to use the gamma distribution, but this approach is some-
what slower than when using the inverse-gamma. Both priors,
however, are able to yield estimates of the posterior distribution
of the parameter � for each node in the species tree.
Finally, we assume that the prior distribution of the topology
and branch lengths of the species tree follows a birth-and-death
process (Nee et al. 1994; Alfaro and Holder 2006).
Molecular ClockCoalescent theory assumes that a molecular clock holds for gene
trees. However, when estimating gene trees from DNA sequences,
the assumption of a molecular clock may introduce estimation
bias. To relax this assumption, an unrooted gene tree unconstrained
by a molecular clock is proposed to calculate the probability of
DNA sequences given the gene tree as in a typical Bayesian anal-
ysis. The proposed gene tree is then rooted by an outgroup. For
computational ease, the model only accommodates a single out-
group sequence. The rooted gene tree is then converted to an
ultrametric tree to calculate the probability of the gene tree given
the species tree using an ad hoc method described by Edwards
et al. (2007) in which all tips of the gene tree are made contempo-
raneous and then the total tree length is normalized to the original,
nonclock tree length.
AlgorithmThe MCMC algorithm is implemented to estimate the posterior
distribution of the species tree. It is unnecessary to update � in
the MCMC algorithm because � has already been integrated out
of the model and the probability distribution of gene trees only
depends on the species tree (topology and branch lengths). As
a consequence, updating the species tree is based on the prior
distribution f (S) and the probability density function f (G | S).
The posterior distribution of the species tree is
f (S | D) =∫
Gf (G | D) f (S | G)dG,
i.e., the posterior of the species tree given gene trees f (S | G)
weighted by f (G | D). This motivates a two-step MCMC algo-
rithm in which the posterior distribution of gene trees is estimated
in the first MCMC and then used to estimate the posterior dis-
tribution of the species tree in the second MCMC (Liu and Pearl
2007).
However, in the first MCMC algorithm using DNA sequences
to estimate the posterior of gene trees, the prior of gene trees,
f (G), is unknown. Theoretically, f (G) is equal to the integration
of f (G | S) with respect to the species tree (topology and branch
lengths),
f (G) =∫
Sf (G | S) f (S)dS.
We apply the harmonic mean technique (Newton et al. 1994) to
approximate the joint probability distribution, f (G), of the gene
2082 EVOLUTION AUGUST 2008
ESTIMATING SPECIES TREES
tree vector by f̃ (G) = (∑k
j=11
f (G | Sj ))−1, where {Sj, j = 1,. . .,k}
are the species trees generated from an MCMC sampler for which
we use the Maximum Tree (MT) (Liu 2006; Edwards et al. 2007;
Liu and Pearl 2007; Mossel and Roch 2007) as the start tree. The
MT is the tree in the species tree space with the longest possible
branches that are temporally compatible with all gene trees in the
vector. It has been shown that the MT is itself a consistent estimator
of the species tree if the gene trees are given without error (Liu
2006; Liu and Pearl 2007; Mossel and Roch 2007). Using the
MT as the start tree greatly increases the convergence rate of the
MCMC sampler and reduces the computational time, in the same
way that starting a typical Bayesian analysis with a neighbor-
joining tree, or any other good approximation of the tree, would
accelerate convergence. Although we use the MT as the starting
tree, the algorithm still samples an arbitrary number of species
trees differing in topology and branch lengths. The accuracy of
the approximation depends in part on the number of species trees
sampled in this first step. However, sampling a large number of
species trees will dramatically increase the computational burden
of the algorithm. As a trade-off, we instead sample a relatively
small number of species trees to calculate f̃ (G).
We have incorporated the approximate joint probability
distribution of the gene tree vector f̃ (G) into the popular
Bayesian phylogenetic program MrBayes (Huelsenbeck and Ron-
quist 2001). This modified version of MrBayes provides an option
for users to estimate gene trees jointly as described above. In the
second MCMC algorithm, the posterior distribution of the species
tree is estimated for each gene tree vector generated from the first
MCMC algorithm. The sample of species trees across all gene
tree vectors is used as the provisional estimate of the posterior
distribution of the species tree. Additionally, f̃ (G) is recalculated
in the second MCMC algorithm by sampling a large number of
species trees. Finally, we use importance sampling to correct the
error made in calculating f̃ (G) by using an approximate prior on
gene trees in the first MCMC algorithm.
The number of species trees that are sampled to calcu-
late f̃ (G) in the first MCMC is determined by two factors—
computational burden and accuracy of the approximation. We
suggest running a small pilot trial in which only a few gene tree
vectors (e.g., 100 for an eight-species tree) are generated in the first
MCMC and find the minimum number of species trees required
to be sampled to deliver a relatively accurate approximation of
f (G), as indicated by the difference between the approximate
f̃ (G) in the first MCMC algorithm and the recalculation of f̃ (G)
in the second MCMC algorithm. Further work is needed to de-
velop an algorithm to automatically find an optimal number of
species trees to approximate the joint probability distribution of
gene trees.
The convergence of the first MCMC algorithm is assessed
by setting mcmcdiagn = yes in MrBayes if two or more com-
pletely independent analyses have been conducted for the dataset
(Huelsenbeck and Ronquist 2001; Ronquist and Huelsenbeck
2003). However, running two analyses will dramatically increase
the computation time. More commonly, the convergence of the
MCMC algorithm is evaluated for a single run by examining the
log-likelihood values, which is also used to monitor the conver-
gence of the second MCMC algorithm.
Any number of summaries of the posterior distribution of
species trees can be used (Beaumont and Rannala 2004; Cranston
and Rannala 2007). As an estimate of the species tree, we use
the majority rule consensus tree of the sample of species trees
generated from the algorithm. The multiple-allele algorithm has
been incorporated in the program BEST (Bayesian Estimation
of Species Trees, version 1.6) and is available for download
(www.stat.osu.edu/∼dkp/BEST).
SimulationTo test the multiple-allele BEST method, three species trees were
generated randomly using the Yule model in Mesquite version
1.12 (Maddison and Maddison 2006) with the fixed tree height
1. The species trees had 10, 20, 30 species with three alleles per
species. The value of � was generated from a uniform distribution
(0, 0.1) for each population in the three species trees and used in
MCMCcoal (Rannala and Yang 2003) to simulate 50 gene tree
vectors of 5, 10, 20, 30, and 40 gene trees. The length of the gene
tree vector represented the number of loci. The gene tree vec-
tors were then used to estimate the posterior distribution of the
species tree using BEST. For each gene tree vector, a consensus
tree was constructed from the estimated posterior distribution of
the species tree and used as the estimate of the species tree. No
DNA sequences were used in this simulation—we used the gener-
ated gene tree vectors as data. Thus, although there was substantial
gene tree heterogeneity, there was no gene tree error in these sim-
ulations. The proportion of trials yielding the true species tree is
reported in Figure 2. The discrepancy between the true species tree
and the consensus tree in both topology and branch lengths was
measured by the branch score distance (Kuhner and Felsenstein
1994; Felsenstein 2004).
The results show that the species tree estimate given by BEST
converges to the true species tree with probability 1 as the number
of loci increases (Fig. 2). The convergence rate depends primarily
on the number of species. The convergence rate for 30 species is
much slower than that for 10 species. With five loci, the propor-
tion of trials yielding the true species tree is 0.38 for the tree with
30 species, whereas it is 0.96 for the tree with 10 species. Sim-
ilarly, the branch score distance appears to converge to 0 as the
number of loci increases (Fig. 3). The convergence rate for branch
score distance is negatively related to the number of loci. The re-
sults suggest that the multiple-allele BEST method (topology and
EVOLUTION AUGUST 2008 2083

LIANG LIU ET AL.
Figure 2. The proportion of trials yielding the true species tree
versus the number of genes. A set of 50 gene tree vectors of 5,
10, 20, 30, 40 genes were generated from three species trees sim-
ulated from Mesquite (Maddison and Maddison 2006). Each gene
tree vector was used as data to estimate the species tree. The pro-
portion of trials yielding the true species tree appears to converge
to 1 as the number of loci increases, but the convergence rate is
negatively correlated with the number of species.
branch length) is statistically consistent when the gene trees are
given without errors.
In the second simulation, DNA sequences were generated
from three prespecified species trees and used as the data to
estimate the species phylogeny. The simulation was conducted
for four species: A, B, C, and D. The species A, B, and C had
two alleles respectively, whereas species D had one sequence.
The three species trees were: Tree 1: (((A:0.01, B:0.01):0.001,
C:0.011):0.1, D:0.111); Tree 2: (((A:0.01, B:0.01):0.005, C:
0.015):0.1, D:0.115); Tree 3: (((A:0.01, B:0.01):0.01, C:0.02) :
0.1, D:0.12); All effective population sizes were set to 0.01. Ac-
cording to coalescent theory, the level of difficulty for recovering
the true species tree is determined by the ratio of internode lengths
Figure 3. The branch score distance versus the number of genes.
The branch score distance between the estimated species tree and
the true species tree appears to converge toward 0 as the number
of genes increases, but the convergence rate is negatively corre-
lated with the number of species.
and the corresponding effective population size. The internode
lengths for the population (AB) in Tree 1, Tree 2, and Tree 3 were
0.001, 0.005, and 0.1, respectively. Hence, Tree1 was the most
difficult and Tree 3 was the easiest scenario to recover the true
species tree, in terms of isometry with the contained gene trees.
We used MCMCoal to generate 2, 4, 6, and 20 gene trees for each
species tree. DNA sequences of 300 bp and 1000 bp were simu-
lated for each gene tree under the Jukes-Cantor model and used as
the data to estimate the species tree using BEST. The simulation
and estimation was repeated 10 times for each species tree and
the average posterior probability of the true species tree reported
(Fig. 4). Clearly, the posterior probability of the true species tree
converges to 1 as the number of genes increases (Fig. 4). How-
ever, the convergence rate depends on the true species tree. The
posterior probabilities of Tree 2 and Tree 3 are already close to
1 with only six genes whereas Tree 1 required about 20 genes to
reach an estimated probability of 1. In addition, the proportion of
trials yielding the true species tree was also 100% for Tree 3 when
the number of genes was just 2 (Fig. 5). For Tree 2, the BEST
method was able to correctly estimate the true species tree in 80%
of the trials when the number of genes was six. The worst scenario
was with Tree 1, in which BEST recovered the true species tree
in only 50% of the trials when the number of genes was six. As
Figure 4. The posterior probability of the true species tree ver-
sus the number of genes. Three species trees are specified; Tree 1:
(((A:0.01, B:0.01):0.001, C:0.011):0.1, D:0.111); Tree 2: (((A:0.01,
B:0.01):0.005, C: 0.015):0.1, D:0.115); Tree 3: (((A:0.01, B:0.01):0.01,
C:0.02) : 0.1, D:0.12); The program MCMCcoal (Rannala and Yang
2003) was used to generate 2, 4, 6 and 20 gene trees for each
species tree. DNA sequences of 300 bp and 1000 bp were simu-
lated for each gene tree and then used as the data to estimate the
species tree using BEST. The markers on each line represent the
average posterior probabilities across 10 repeats and the vertical
line around the marker represents the standard error. The dashed
lines are the posterior probabilities for sequences of length 1000
bp. The solid lines are the posterior probabilities for sequences of
length 300 bp.
2084 EVOLUTION AUGUST 2008
ESTIMATING SPECIES TREES
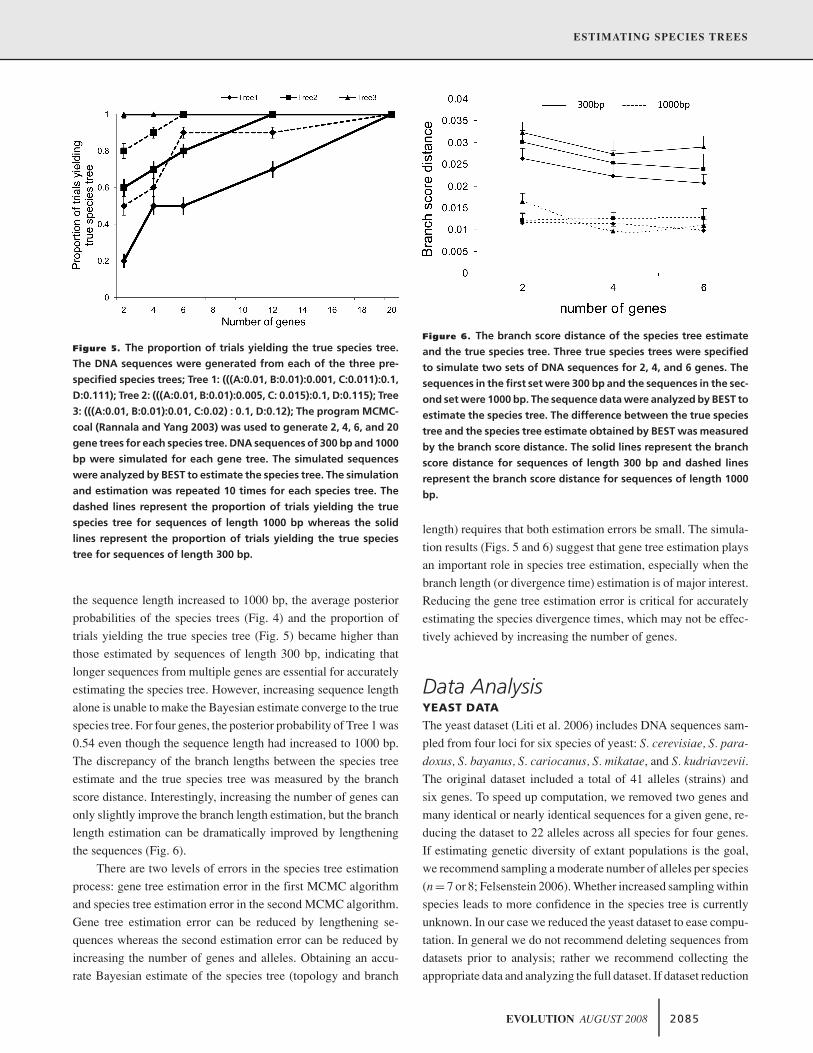
Figure 5. The proportion of trials yielding the true species tree.
The DNA sequences were generated from each of the three pre-
specified species trees; Tree 1: (((A:0.01, B:0.01):0.001, C:0.011):0.1,
D:0.111); Tree 2: (((A:0.01, B:0.01):0.005, C: 0.015):0.1, D:0.115); Tree
3: (((A:0.01, B:0.01):0.01, C:0.02) : 0.1, D:0.12); The program MCMC-
coal (Rannala and Yang 2003) was used to generate 2, 4, 6, and 20
gene trees for each species tree. DNA sequences of 300 bp and 1000
bp were simulated for each gene tree. The simulated sequences
were analyzed by BEST to estimate the species tree. The simulation
and estimation was repeated 10 times for each species tree. The
dashed lines represent the proportion of trials yielding the true
species tree for sequences of length 1000 bp whereas the solid
lines represent the proportion of trials yielding the true species
tree for sequences of length 300 bp.
the sequence length increased to 1000 bp, the average posterior
probabilities of the species trees (Fig. 4) and the proportion of
trials yielding the true species tree (Fig. 5) became higher than
those estimated by sequences of length 300 bp, indicating that
longer sequences from multiple genes are essential for accurately
estimating the species tree. However, increasing sequence length
alone is unable to make the Bayesian estimate converge to the true
species tree. For four genes, the posterior probability of Tree 1 was
0.54 even though the sequence length had increased to 1000 bp.
The discrepancy of the branch lengths between the species tree
estimate and the true species tree was measured by the branch
score distance. Interestingly, increasing the number of genes can
only slightly improve the branch length estimation, but the branch
length estimation can be dramatically improved by lengthening
the sequences (Fig. 6).
There are two levels of errors in the species tree estimation
process: gene tree estimation error in the first MCMC algorithm
and species tree estimation error in the second MCMC algorithm.
Gene tree estimation error can be reduced by lengthening se-
quences whereas the second estimation error can be reduced by
increasing the number of genes and alleles. Obtaining an accu-
rate Bayesian estimate of the species tree (topology and branch
Figure 6. The branch score distance of the species tree estimate
and the true species tree. Three true species trees were specified
to simulate two sets of DNA sequences for 2, 4, and 6 genes. The
sequences in the first set were 300 bp and the sequences in the sec-
ond set were 1000 bp. The sequence data were analyzed by BEST to
estimate the species tree. The difference between the true species
tree and the species tree estimate obtained by BEST was measured
by the branch score distance. The solid lines represent the branch
score distance for sequences of length 300 bp and dashed lines
represent the branch score distance for sequences of length 1000
bp.
length) requires that both estimation errors be small. The simula-
tion results (Figs. 5 and 6) suggest that gene tree estimation plays
an important role in species tree estimation, especially when the
branch length (or divergence time) estimation is of major interest.
Reducing the gene tree estimation error is critical for accurately
estimating the species divergence times, which may not be effec-
tively achieved by increasing the number of genes.
Data AnalysisYEAST DATA
The yeast dataset (Liti et al. 2006) includes DNA sequences sam-
pled from four loci for six species of yeast: S. cerevisiae, S. para-
doxus, S. bayanus, S. cariocanus, S. mikatae, and S. kudriavzevii.
The original dataset included a total of 41 alleles (strains) and
six genes. To speed up computation, we removed two genes and
many identical or nearly identical sequences for a given gene, re-
ducing the dataset to 22 alleles across all species for four genes.
If estimating genetic diversity of extant populations is the goal,
we recommend sampling a moderate number of alleles per species
(n = 7 or 8; Felsenstein 2006). Whether increased sampling within
species leads to more confidence in the species tree is currently
unknown. In our case we reduced the yeast dataset to ease compu-
tation. In general we do not recommend deleting sequences from
datasets prior to analysis; rather we recommend collecting the
appropriate data and analyzing the full dataset. If dataset reduction
EVOLUTION AUGUST 2008 2085

LIANG LIU ET AL.
is required for some reason, we recommend deleting sequences at
random from species within which there is random mating, rather
than selectively deleting identical sequences, which would bias
estimates of genetic diversity upwards. Our method assumes that
there is random mating within each tip in the species tree; the
yeast dataset likely violated this assumption in so far as several
species appeared structured in their genetic variation. Although
our nonrandom dataset reduction could incur some ascertainment
bias, we believe the bias is not strong. As in the original study, we
used S. bayanus as the outgroup. Although hybridization among
yeast strains and species is detected with increasing frequency
as more species and genes are investigated (Nilson-Tillgren et al.
1980; De Barro Lopes et al. 2002; Sniegowski et al. 2002; Liti
et al. 2006), transfer of genes in the yeast strains investigated is
known only from subtelomeric regions, and is not known to affect
the genes analyzed here.
The optimal finite sites substitution model for each locus
was evaluated using approximate AIC statistics in the program
MrModeltest (Nylander 2004). The GTR + � model (Lanave
et al. 1984; Zwickl and Holder 2004) was the best fit for locus
1 (NEJ1 in original study), the HKY model for locus 2 (EST2),
the GTR model for locus 3 (HDF1), and the HKY + � model
(Hasegawa et al. 1985) for locus 4 (HDF2). Gene trees were esti-
mated independently for each locus by MrBayes with the model
specified above to investigate the variability at the gene tree level.
The MCMC algorithm ran for 1,000,000 generations, with every
100th tree saved. The first 100,000 generations were discarded as
the burnin. A consensus tree was constructed from the estimated
posterior distribution of the gene tree for each locus.
The dataset was then analyzed in the modified MrBayes pro-
gram (BEST step 1) using these locus-specific models. The prior
distribution of the population size was an inverse gamma distri-
bution with � = 3 and � = 0.03. The posterior distribution of the
gene trees was first estimated with the approximate joint prior of
gene trees across the four genes. In this MCMC, the chain ran
for 10 million generations, with every 1000th gene tree saved.
For each of the 10 million cycles we sampled 1000 species trees
to calculate f̃ (G). The first 1,000,000 gene trees were discarded
as burnin. The estimated joint posterior distribution of gene trees
was then employed to reconstruct the posterior distribution of the
species tree using the second MCMC as implemented in BEST,
followed by importance sampling to align the first and second pos-
terior distributions. The species tree estimation was conducted on
a 2× AMD Opteron AMD Opteron 248/4 GB computer. It took
80 h for the first MCMC algorithm and 3 h for the second MCMC
algorithm.
At the gene tree level, all species in the dataset were recip-
rocally monophyletic across loci (Fig. 7); in addition, there was
strong concordance among different genes for phylogenetic rela-
tionships at the species level (Liti et al. 2006). However, there was
substantial within-strain phylogenetic heterogeneity for all four
genes we examined (Fig. 7).
At the level of species, the majority rule consensus tree
for the estimated posterior distribution of species trees (Fig. 8)
matches the topology of the tree estimated by the concatenation
method performed in the original study (Liti et al. 2006), although
of course the tree in the original study had multiple tips per species
whereas our tree has a single tip representing each species. The tree
of these yeast species is also consistent with analyses of a 106-gene
single-allele dataset encompassing these species using concate-
nation (Rokas et al. 2003) or the single allele Bayesian method
(Edwards et al. 2007). However, the results of the BEST analysis
and the concatenation analysis of the multiple-allele dataset
differ in the posterior probability for the clade (S. paradoxus, S.
cariocanus, S. cerevisiae). For the BEST method, the clade had a
posterior probability of 0.57, whereas the concatenation method
estimated 1.0 for the posterior probability of the clade. Although
each gene tree recovered this clade in a traditional phylogenetic
analysis (Liti et al. 2006), and each species was reciprocally mono-
phyletic for all genes, analyzed singly or together, the gene trees
exhibited some heterogeneity in the internal phylogenetic struc-
ture of these three species. In such instances, concatenation may
overestimate the posterior probability. Additionally, estimating
confidence in species tree branches is quite different from estimat-
ing confidence in gene tree branches. Confidence in branches of
the estimated species tree—the tree containing the gene trees—is
likely to be a function of the number of genes as well as the confi-
dence in each of these genes. Thus, having just a few concordant
and well-supported gene trees may not be enough to guarantee
confidence in the species tree, although more research in this area
is needed. We are currently conducting simulations to compare
the posterior probabilities of gene trees and species trees analyzed
by traditional and species tree approaches to better understand
the relationships between these two measures of phylogenetic
confidence.
MANAKIN (MANACUS) DATA
Manakins (Pipridae) are a family of lekking Neotropical birds, and
the genus Manacus is composed of four allospecies distributed in
lowland forests from southern Mexico to Brazil. We analyzed
a dataset (Brumfield et al. in press), consisting of five nuclear
loci from a total of 40 Manacus chromosomes, plus one allele
from an outgroup, a related manakin genus Chiroxiphia pareola.
Brumfield et al. (in press) treated M. manacus populations that are
isolated east and west of the Andes as distinct, resulting in a total
of five ingroup species—M. candei (n = 8 alleles), M. vitellinus
(n = 6), M. aurantiacus (n = 4), M. manacus (west of Andes; n =8), and M. manacus (east of Andes; n = 14).
The gene trees for each locus were estimated independently
by MrBayes with the GTR + � model selected by Modeltest
2086 EVOLUTION AUGUST 2008

ESTIMATING SPECIES TREES
Figure 7. The gene tree estimate for each locus in the yeast dataset. The gene trees were estimated by MrBayes independently for locus
NEJ1 (A), EST2 (B), HDF1 (C), and HDF2 (D). Multiple alleles are present in each species. Each allele is named after the species it belongs
to using three letters, as follows: Sce = S. cervisciae, Spa = S. paradoxus, Sba = S. bayanus, Sca = S. cariocanus, Smi = S. mikatae, and
Sku = S. kudriavzevii. Posterior probabilities greater than or equal to 0.95 are presented.
(Posada and Crandall 1998; Posada and R. 2004). The MCMC
algorithm ran for 1,000,000 generations and we saved every 100th
tree. The first 100,000 generations were discarded as burnin. A
consensus tree was constructed from the estimated distribution
of the gene tree. The consensus tree was used as the gene tree
estimate. The estimated gene trees were not well resolved and
all five loci exhibited a lack of reciprocal monophyly for every
ingroup species (Fig. 9). Thus, compared to the yeast dataset, the
topology of the manakin species tree is not apparent upon casual
inspection of the five gene trees.
To estimate the species tree, the dataset was analyzed in the
modified MrBayes with the GTR + � model for each locus. The
prior distribution of the population size was inverse gamma with
� = 3 and � = 0.03. The posterior distribution of gene trees was
estimated with the approximate joint prior of gene trees across the
five genes. The first MCMC algorithm ran for 20 million genera-
tions and for each of these cycles we sampled 1000 species trees to
calculate f̃ (G). Because we generated more gene tree vectors (20
million) than were needed, the first 10 million trees were discarded
as burnin. The estimated joint posterior distribution of gene trees
was then employed to reconstruct the posterior distribution of the
species tree using the second MCMC algorithm as implemented
in BEST, followed by importance sampling. It took 330 h for the
first MCMC algorithm and 10 h for the second MCMC algorithm.
EVOLUTION AUGUST 2008 2087

LIANG LIU ET AL.
Figure 8. The species tree estimate for the yeast dataset.
The majority rule consensus tree of the estimated posterior
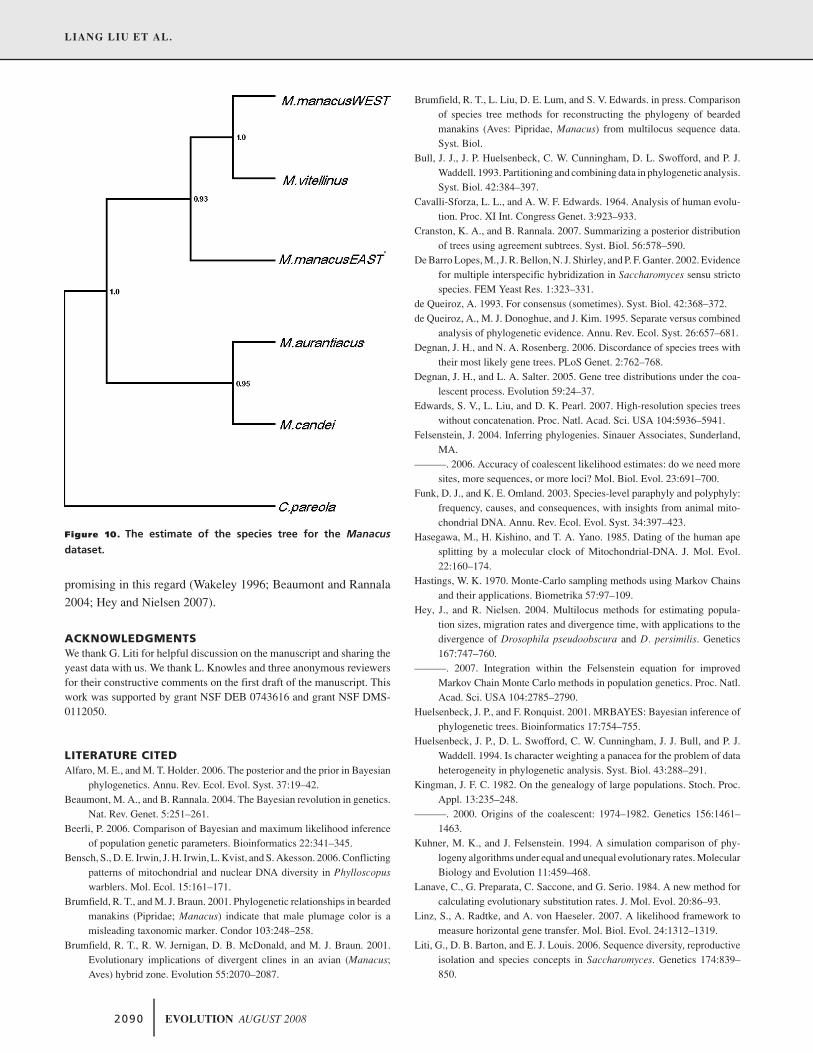
distribution (Fig. 10) was well resolved and consisted of two main
clades—(M. candei, M. aurantiacus) and (M. manacusWest, M.
manacusEast, M. vitellinus). This topology agrees with a species
tree for the genus estimated from isozymes (Brumfield and Braun
2001). This example is intriguing because the confidence in the
species tree is quite high despite the fact that all gene trees differed
from one another, and none of the ingroup species formed mono-
phyletic groups at the level of alleles (Brumfield et al. 2007). This
contrasts with the yeast example and shows that the relationship
between concordance of gene trees with respect to species and
confidence in the species tree may be complex.
DiscussionEstimation of species trees can be improved by the use of molec-
ular data with multiple alleles and multiple loci, yet in many sit-
uations (Maddison and Knowles 2006) the parameter of interest
is a phylogenetic tree with branch lengths in which each tip rep-
resents a single species. DNA sequence data containing multiple
alleles and multiple loci have multiple complex sources of ge-
netic variation and error that must be addressed by analytic tools
for estimating the phylogeny of the constituent species. Gene trees
themselves can be challenging to estimate when branch lengths
are short and sequence data are limited. In addition, it is now well
appreciated that gene tree heterogeneity is ubiquitous; because of
coalescent variance, virtually any speciation scenario, whether it
includes long or short branches in the species tree, will always
have some heterogeneity in gene trees, if not in gene tree topol-
ogy then in gene tree branch lengths. Finally, whereas branches
of gene trees are likely to vary within species, again due to the
coalescent, if the branches of the species tree are long, these same
gene trees will show substantial consistency in deeper branches
of the species tree.
Each of these sources of variance has associated errors in
estimation, but most current tree reconstruction methods lack the
capability to incorporate all these sources of variance. The con-
catenation method, the most popular approach for inferring phylo-
genetic relationships, is unable to accommodate variation among
loci because it assumes that all gene trees have the same topol-
ogy. A model that can explain these variations must involve both
gene trees and species trees as two correlated quantities. It could
be extremely difficult for nonmodel-based methods to construct a
reasonable function to estimate the species tree for multiple alleles
and multiple loci data. Furthermore, nonmodel-based methods are
often difficult to generalize themselves when more complexities
appear in the data.
As analytic tools, model-based approaches have substan-
tial promise for analyzing high-dimensional sequence data. The
Bayesian hierarchical model we propose, although still at an early
stage, shows promise in its ability to handle datasets with strong
interlocus concordance (the yeast dataset) as well as datasets with
substantial heterogeneity among genes and incomplete coales-
cence among species (manakin dataset). However, as with any
statistical model, it is important to develop an understanding of
how deviations from model assumptions affect the conclusions
drawn. Our Bayesian hierarchical model assumes that incomplete
lineage sorting is the sole source of incongruence among gene
trees and between gene trees and the species tree. However, con-
flicts among gene trees and between gene and species trees may
be caused by other factors such as horizontal gene transfer, hy-
bridization, and gene duplication/gene loss (Maddison 1997). A
more realistic model demands the incorporation of these factors
when estimating the species tree (Linz et al. 2007).
Previous studies suggest that introgression could have influ-
enced the Manacus dataset (Brumfield et al. 2001, in press), which
would violate BEST’s assumption that no gene flow occurred af-
ter speciation. Despite this possibility, BEST still delivered rea-
sonable species tree estimates congruent with other data. This
suggests the BEST method may be robust to potential assump-
tion violations. Some of the earliest phylogenetic studies analyzed
multilocus datasets from human populations, despite known in-
trogression among these populations (Cavalli-Sforza and Edwards
1964). Even today, phylogenetic trees of populations or species
2088 EVOLUTION AUGUST 2008

ESTIMATING SPECIES TREES
Figure 9. The gene tree estimates for the Manacus dataset. The posterior distribution of the gene trees was estimated using MrBayes
independently for each locus; �-actin intron 3 (A), �-fibrinogen intron 7 (B), ornithine decarboxylase introns 6 and 7 (C), rhodopsin intron
2 (D), and transforming growth factor �2 intron 2 (E). The consensus tree was constructed from the estimated posterior distribution of
the gene tree. Posterior probabilities greater than or equal to 0.95 were indicated by an asterisk next to the specific branch. Outgroups
were removed from the consensus trees. The first three or four letters of the species were used as the abbreviation of the species. The
following number represented the allele sampled from each species.
are sometimes constructed from population statistics such as FST,
even when hybridization is suspected. Hybridization may not be a
problem for estimating topologies of species trees when it occurs
between sister species; in such situations, the sister species will
still be resolved as such, albeit with shorter branch lengths than if
no hybridization occurred. If the introgressing gene regions only
reflect a small percentage of the entire genome (Rieseberg et al.
1999), then it may be unlikely that the gene trees were influenced
by hybridization. What is certain is that reticulate patterns of evo-
lution are quite prevalent and easily detectable once multiple loci
are examined (Bensch et al. 2006). Clearly, the effects of hy-
bridization, horizontal transfer, migration, gene duplication/loss
on the BEST model need to be further studied. Equally impor-
tant will be the development of methods for determining whether
hybridization or incomplete lineage sorting is the cause of gene
tree discordances as a means of choosing the appropriate model
for analysis. Several approaches, including method-of-moments,
maximum likelihood and approximate Bayesian approaches, seem
EVOLUTION AUGUST 2008 2089
LIANG LIU ET AL.
Figure 10. The estimate of the species tree for the Manacus
dataset.
promising in this regard (Wakeley 1996; Beaumont and Rannala
2004; Hey and Nielsen 2007).
ACKNOWLEDGMENTSWe thank G. Liti for helpful discussion on the manuscript and sharing theyeast data with us. We thank L. Knowles and three anonymous reviewersfor their constructive comments on the first draft of the manuscript. Thiswork was supported by grant NSF DEB 0743616 and grant NSF DMS-0112050.
LITERATURE CITEDAlfaro, M. E., and M. T. Holder. 2006. The posterior and the prior in Bayesian
phylogenetics. Annu. Rev. Ecol. Evol. Syst. 37:19–42.Beaumont, M. A., and B. Rannala. 2004. The Bayesian revolution in genetics.
Nat. Rev. Genet. 5:251–261.Beerli, P. 2006. Comparison of Bayesian and maximum likelihood inference
of population genetic parameters. Bioinformatics 22:341–345.Bensch, S., D. E. Irwin, J. H. Irwin, L. Kvist, and S. Akesson. 2006. Conflicting
patterns of mitochondrial and nuclear DNA diversity in Phylloscopuswarblers. Mol. Ecol. 15:161–171.
Brumfield, R. T., and M. J. Braun. 2001. Phylogenetic relationships in beardedmanakins (Pipridae; Manacus) indicate that male plumage color is amisleading taxonomic marker. Condor 103:248–258.
Brumfield, R. T., R. W. Jernigan, D. B. McDonald, and M. J. Braun. 2001.Evolutionary implications of divergent clines in an avian (Manacus;Aves) hybrid zone. Evolution 55:2070–2087.
Brumfield, R. T., L. Liu, D. E. Lum, and S. V. Edwards. in press. Comparisonof species tree methods for reconstructing the phylogeny of beardedmanakins (Aves: Pipridae, Manacus) from multilocus sequence data.Syst. Biol.
Bull, J. J., J. P. Huelsenbeck, C. W. Cunningham, D. L. Swofford, and P. J.Waddell. 1993. Partitioning and combining data in phylogenetic analysis.Syst. Biol. 42:384–397.
Cavalli-Sforza, L. L., and A. W. F. Edwards. 1964. Analysis of human evolu-tion. Proc. XI Int. Congress Genet. 3:923–933.
Cranston, K. A., and B. Rannala. 2007. Summarizing a posterior distributionof trees using agreement subtrees. Syst. Biol. 56:578–590.
De Barro Lopes, M., J. R. Bellon, N. J. Shirley, and P. F. Ganter. 2002. Evidencefor multiple interspecific hybridization in Saccharomyces sensu strictospecies. FEM Yeast Res. 1:323–331.
de Queiroz, A. 1993. For consensus (sometimes). Syst. Biol. 42:368–372.de Queiroz, A., M. J. Donoghue, and J. Kim. 1995. Separate versus combined
analysis of phylogenetic evidence. Annu. Rev. Ecol. Syst. 26:657–681.Degnan, J. H., and N. A. Rosenberg. 2006. Discordance of species trees with
their most likely gene trees. PLoS Genet. 2:762–768.Degnan, J. H., and L. A. Salter. 2005. Gene tree distributions under the coa-
lescent process. Evolution 59:24–37.Edwards, S. V., L. Liu, and D. K. Pearl. 2007. High-resolution species trees
without concatenation. Proc. Natl. Acad. Sci. USA 104:5936–5941.Felsenstein, J. 2004. Inferring phylogenies. Sinauer Associates, Sunderland,
MA.———. 2006. Accuracy of coalescent likelihood estimates: do we need more
sites, more sequences, or more loci? Mol. Biol. Evol. 23:691–700.Funk, D. J., and K. E. Omland. 2003. Species-level paraphyly and polyphyly:
frequency, causes, and consequences, with insights from animal mito-chondrial DNA. Annu. Rev. Ecol. Evol. Syst. 34:397–423.
Hasegawa, M., H. Kishino, and T. A. Yano. 1985. Dating of the human apesplitting by a molecular clock of Mitochondrial-DNA. J. Mol. Evol.22:160–174.
Hastings, W. K. 1970. Monte-Carlo sampling methods using Markov Chainsand their applications. Biometrika 57:97–109.
Hey, J., and R. Nielsen. 2004. Multilocus methods for estimating popula-tion sizes, migration rates and divergence time, with applications to thedivergence of Drosophila pseudoobscura and D. persimilis. Genetics167:747–760.
———. 2007. Integration within the Felsenstein equation for improvedMarkov Chain Monte Carlo methods in population genetics. Proc. Natl.Acad. Sci. USA 104:2785–2790.
Huelsenbeck, J. P., and F. Ronquist. 2001. MRBAYES: Bayesian inference ofphylogenetic trees. Bioinformatics 17:754–755.
Huelsenbeck, J. P., D. L. Swofford, C. W. Cunningham, J. J. Bull, and P. J.Waddell. 1994. Is character weighting a panacea for the problem of dataheterogeneity in phylogenetic analysis. Syst. Biol. 43:288–291.
Kingman, J. F. C. 1982. On the genealogy of large populations. Stoch. Proc.Appl. 13:235–248.
———. 2000. Origins of the coalescent: 1974–1982. Genetics 156:1461–1463.
Kuhner, M. K., and J. Felsenstein. 1994. A simulation comparison of phy-logeny algorithms under equal and unequal evolutionary rates. MolecularBiology and Evolution 11:459–468.
Lanave, C., G. Preparata, C. Saccone, and G. Serio. 1984. A new method forcalculating evolutionary substitution rates. J. Mol. Evol. 20:86–93.
Linz, S., A. Radtke, and A. von Haeseler. 2007. A likelihood framework tomeasure horizontal gene transfer. Mol. Biol. Evol. 24:1312–1319.
Liti, G., D. B. Barton, and E. J. Louis. 2006. Sequence diversity, reproductiveisolation and species concepts in Saccharomyces. Genetics 174:839–850.
2090 EVOLUTION AUGUST 2008

ESTIMATING SPECIES TREES
Liu, L. 2006. Reconstructing posterior distributions of a species phylogenyusing estimated gene tree distributions. Pp. 46–49. in Ph.D dissertation.Department of Statistics. The Ohio State Univ., Columbus.
Liu, L., and D. K. Pearl. 2007. Species trees from gene trees: reconstructingBayesian posterior distributions of a species phylogeny using estimatedgene tree distributions. Syst. Biol. 56:504–514.
Maddison, W. P. 1997. Gene trees in species trees. Syst. Biol. 46:523–536.Maddison, W. P., and L. L. Knowles. 2006. Inferring phylogeny despite in-
complete lineage sorting. Syst. Biol. 55:21–30.Maddison, W. P., and D. R. Maddison. 2006. Mesquite: a modular system for
evolutionary analysis. Version 1.12.Mossel, E., and S. Roch. 2007. Incomplete lineage sorting: consistent phy-
logeny estimation from multiple Loci. Available at http://arxiv.org/abs/0710.0262 [Accessed November 2, 2007].
Nee, S., R. M. May, and P. H. Harvey. 1994. The reconstructed evolutionaryprocess. Philos. Trans. R. Soc. Lond. B 344:305–311.
Newton, M. A., A. E. Raftery, A. C. Davison, M. Bacha, G. Celeux, B. P. Carlin,P. Clifford, C. Lu, M. Sherman, M. A. Tanner, et al. 1994. ApproximateBayesian-inference with the weighted likelihood bootstrap. J. R. Stat.Soc. B 56:3–48.
Nielsen, R., and M. Slatkin. 2000. Likelihood analysis of ongoing gene flowand historical association. Evolution 54:44–50.
Nilson-Tillgren, T., J. G. L. Petersen, S. Holmberg, and M. C. Kielland-Brandt.1980. Transfer of chromosome III during Kar mediated cytoduction inyeast Carlsberg. Res. Commun. 45:113–117.
Nylander, J. A. A. 2004. MrModeltest v2. Evolutionary Biology Centre, Up-psala Univ.
Nylander, J. A. A., F. Ronquist, J. P. Huelsenbeck, and J. L. Nieves-Aldrey.2004. Bayesian phylogenetic analysis of combined data. Syst. Biol.53:47–67.
Page, R. D. M. 1998. GeneTree: comparing gene and species phylogeniesusing reconciled trees. Bioinformatics 14:819–820.
Page, R. D. M., and M. A. Charleston. 1997. From gene to organismal phy-logeny: reconciled trees and the gene tree species tree problem. Mol.Phylogenet. Evol. 7:231–240.
Posada, D., and K. A. Crandall. 1998. MODELTEST: testing the model ofDNA substitution. Bioinformatics 14:817–818.
Posada, D., and T. R. Buckley. 2004. Model selection and model averagingin phylogenetics: advantages of the AIC and Bayesian approaches overlikelihood ratio tests. Syst. Biol. 53:793–808.
Rannala, B., and Z. H. Yang. 2003. Bayes estimation of species divergencetimes and ancestral population sizes using DNA sequences from multipleloci. Genetics 164:1645–1656.
Rieseberg, L. H., J. Whitton, and K. Gardner. 1999. Hybrid zones and thegenetic architecture of a barrier to gene flow between two sunflowerspecies. Genetics 152:713–727.
Rokas, A., B. L. Williams, N. King, and S. B. Carroll. 2003. Genome-scaleapproaches to resolving incongruence in molecular phylogenies. Nature425:798–804.
Ronquist, F., and J. P. Huelsenbeck. 2003. MrBayes 3: Bayesian phy-logenetic inference under mixed models. Bioinformatics 19:1572–1574.
Slowinski, J. B., A. Knight, and A. P. Rooney. 1997. Inferring species treesfrom gene trees: a phylogenetic analysis of the elapidae (Serpentes) basedon the amino acid sequences of venom proteins. Mol. Phylogenet. Evol.8:349–362.
Sniegowski, P. D., P. G. Dombrowski, and E. Fingerman. 2002. Saccha-romyces cerevisiae and Saccharomyces paradoxus coexist in a naturalwoodland site in North America and display different levels of repro-ductive isolation from European conspecifics. FEMS Yeast Res. 1:299–306.
Wakeley, J. 1996. The variance of pairwise nucleotide differences in two pop-ulations with migration. Theor. Popul. Biol. 49:39–57.
Whelan, S., and N. Goldman. 2001. A general empirical model of proteinevolution derived from multiple protein families using a maximum-likelihood approach. Mol. Biol. Evol. 18:691–699.
Wiens, J. J. 1998. Combining data sets with different phylogenetic histories.Syst. Biol. 47:568–581.
Zwickl, D. J., and M. T. Holder. 2004. Model parameterization, prior distribu-tions, and the general time-reversible model in Bayesian phylogenetics.Syst. Biol. 53:877–888.
Associate Editor: L. Knowles
EVOLUTION AUGUST 2008 2091