estimating runtime of a job in hadoop mapreduce
TRANSCRIPT

Estimating runtime of a job in Hadoop MapReduceNarges Peyravi1 and Ali Moeini2*
IntroductionNowadays, with the emergence and use of new systems, we face a massive amount of data. Due to the volume, velocity, and variety of these big data, managing, maintaining, and processing them require special infrastructures. One of the famous open-source frameworks is Apache Hadoop [1]. It is a scalable and reliable framework for storage and process big data. Hadoop divides the big input data into fixed-size pieces; stores and processes these split of data on a cluster of machines. By default, each split copies three times and transfer to different machines to manage errors and fault tolerance. Hadoop stores its data in a distributed file system called HDFS. MapReduce is designed to work with HDFS. MapReduce is the programming model that allows Hadoop to efficiently process large amounts of data in the cluster’s nodes. [1–5].
Since one of Hadoop’s most important tasks is managing jobs and resources, bet-ter management will be done if estimation and prediction the runtime of a job do pre-cisely. Also, because of limited critical resources like CPU, I/O, and memory, this issue is important in many aspects like efficient scheduling, better energy consumption, bot-tleneck detection, and resource management [3–5].
Abstract
Hadoop MapReduce is a framework to process vast amounts of data in the cluster of machines in a reliable and fault-tolerant manner. Since being aware of the runtime of a job is crucial to subsequent decisions of this platform and being better management, in this paper we propose a new method to estimate the runtime of a job. For this pur-pose, after analysis the anatomy of processing a job in Hadoop MapReduce precisely, we consider two cases: when a job runs for the first time or a job has run previously. In the first case, by considering essential and efficient parameters that higher impact on runtime we formulate each phase of the Hadoop execution pipeline and state them by mathematical expressions to calculate runtime of a job. In the second case, by refer-ring to the profile or history of a job in the database and use a weighting system the runtime is estimated. The results show the average error rate is less than 12% in the estimation of runtime for the first run and less than 8.5% when the profile or history of the job has existed.
Keywords: Hadoop, MapReduce, Runtime of a job, Estimating the runtime
Open Access
© The Author(s) 2020. This article is licensed under a Creative Commons Attribution 4.0 International License, which permits use, sharing, adaptation, distribution and reproduction in any medium or format, as long as you give appropriate credit to the original author(s) and the source, provide a link to the Creative Commons licence, and indicate if changes were made. The images or other third party material in this article are included in the article’s Creative Commons licence, unless indicated otherwise in a credit line to the material. If material is not included in the article’s Creative Commons licence and your intended use is not permitted by statutory regulation or exceeds the permitted use, you will need to obtain permission directly from the copyright holder. To view a copy of this licence, visit http://creat iveco mmons .org/licen ses/by/4.0/.
RESEARCH
Peyravi and Moeini J Big Data (2020) 7:44 https://doi.org/10.1186/s40537-020-00319-4
*Correspondence: [email protected] 2 Department of Algorithms and Computation, School of Engineering Science, College of Engineering, University of Tehran, Tehran, IranFull list of author information is available at the end of the article

Page 2 of 18Peyravi and Moeini J Big Data (2020) 7:44
Since being aware of the runtime of a job is crucial to subsequent decisions, the con-tribution of this paper is to propose a new method to estimate the runtime of a job in Hadoop MapReduce version 2. For this purpose, first, we investigate the anatomy of Hadoop and its performance precisely in each stage, then we consider two cases: when a job runs for the first time and there is not any history of it, or a job has run previously, and its profile or history is available. In the first case, by considering essential and effi-cient parameters that higher impact on runtime and the status of each node in the clus-ter, we try to formulate each phase of the Hadoop execution pipeline and state them by mathematical expressions to calculate runtime of a job. In the second case, by referring to the profile or history of a job in the database and use a weighting system (the recent runtime becomes more important, hence giving more weight) the runtime is estimated.
At last, for evaluating the proposed model, the error rate calculates and investigated by two common benchmarks: RMSE and MAPE.
The remainder of this paper is as follows: First, we explain the background and related works; second, describing our methodology to estimate runtime; then results and dis-cussion and finally, the conclusion and future works are explained.
Background and related workHadoop is a data storage and processing platform, based upon two main concepts: HDFS and MapReduce. HDFS (Hadoop Distributed File System) is a file system to provide high throughput access to data and MapReduce is a framework for the parallel processing of large data sets. Hadoop works based on the master/slave style. There is a master node in the Hadoop cluster and many Slave nodes. The Master Node manages, maintains, and controls the Slave nodes, while the Slave nodes are the actual components of the task. The master node only stores metadata while slaves are nodes that store data. Data stor-age is distributed among clusters. Hadoop framework executes a job in a well-defined sequence of processing phases [1–3].
Figure 1 illustrates the pipeline and process phases in Hadoop MapReduce.According to Fig. 1, The following steps are implemented. In brief, they are: [1–3].Read phase: The input data as a map task typically read a block with a fixed size
(128 MB) from HDFS.Map Phase: It applies the user-defined Map function to the data and generates a set of
(key, value) pairs.Collect Phase: The output of the Map phase is buffered and sorted.Spill Phase: The results of the Collect step are placed on the disk.
Fig. 1 MapReduce processing pipeline [2]

Page 3 of 18Peyravi and Moeini J Big Data (2020) 7:44
Merge Phase: The results of the Spill phase are merged and partitioned.Shuffle Phase: The partitions sort and the data with the same key is sorted.Reduce Phase: The user-defined Reduce function is applied to the previous step data to
obtain dense data.Write Phase: Finally, the output writes on HDFS.The execution time of a job depends on the above phases also some parameters affect
the speed of each phase. Figure 2 shows some parameters that impact each phase of the Hadoop execution pipeline. These parameters and their operations explain in Table 2.
Also, other parameters like the amount of data flowing through each phase, the per-formance of the underlying Hadoop cluster, the user-defined functions (Map, Reduce), the status of the network and so on affect the runtime.
The aim of this paper is to estimate the runtime of a job in Hadoop MapReduce ver-sion 2 by analyzing each phase and investigating the effect of some important param-eters. Since being aware of the runtime of a job is crucial to subsequent decisions, there was some researches in this field.
In [6], the authors propose ROUTE, a runtime workload prediction method for MapReduce. It samples the partition size of the early completed mappers and performs estimation at the runtime. In this method, a sampler is developed that determines the minimum number of samples automatically for satisfying the accuracy requirement specified by users. Furthermore, ROUTE requires no apriority knowledge of the map function and input datasets, nor making assumptions on the underlying distribution of the intermediate data.
In [7, 8], the proposed model based on the historical job execution records and uses Locally Weighted Linear Regression (LWLR) technique to estimate the runtime of a job. LWLR is an instance-based nonparametric function, which assigns a weight to each instance according to its Euclidean distance from the query instance. LWLR assigns high weight to an instance which is close to the query and low weight to the instances that are far away from the query.
Liu et al. [9] proposed a two-phase regression (TPR) method to predict the finishing time of each job precisely. Detailed data of each job had made with a detailed analysis
Fig. 2 Parameters that affect Hadoop pipeline [1, 11]

Page 4 of 18Peyravi and Moeini J Big Data (2020) 7:44
report. TPR divided into four steps: data preprocessing, data smoothing, data regression, and data prediction.
Ramanathan and Latha [10] proposed a regression-based performance model to pre-dict the MapReduce job completion time by using the Scale-Out strategy. The authors used this method for Optimizing resource provisioning. They propose five typical situa-tions by varying resources, data size, and time constraints.
Chen et al. [11] used Petri Net to estimate the execution time of MapReduce jobs. They analyzed each phase of MapReduce job execution and investigated the mean delay time of each phase of runtime and combined the delay times from all phase to estimate the execution time of a MapReduce job.
Kozyrev [12] presented a survey of the available techniques for estimating the estimation of the worst-case execution time. The author divided this issue into the overall three cat-egories: static, dynamic, and hybrid approaches. Each case can use this technique: control flow analysis, context analysis, estimate calculation, symbolic computation parameteriza-tion of estimates. The author investigated the advantages and disadvantages of each one.
Amannejad et al. [13] proposed a model to quick prediction runtime a job when lit-tle cluster resources are available. They used logs from two executions of an application with small sample data and different resource settings and explore the accuracy of the predictions for other resource allocation settings and input data sizes then expanded their model to the Spark waves.
Kecskemeti et al. [14] proposed a technique for predicting background workload in the cloud environment. They simulated a workflow according to the plan specified runtime properties, like job start time, completion time, and times for creating virtual machines. For simulation, they imitated the long-running workflows and investigated behavior dis-crepancies, then tried to replicate these in a simulated cloud.
Lu et al. [15] proposed and evaluated IoTDeM. IoTDeM was an extended IoT Big Data-oriented model for predicting MapReduce performance. It was able to predict MapReduce jobs’ total execution time in a general implementation scenario with varying cluster scales. This model works based on historical job execution and Locally Weighted Linear Regression (LWLR) techniques to predict the runtime of a job. The LWLR model assigns a weight coefficient to each sample of jobs.
Uvaneshwari and Senthil Kumar [16] explained a predictor of the possibility of job completion with the user-specified time. If the user-defined time is not available then a job’s runtime estimator is run. For a Map-reduce job that needs to be completed within a certain time, the job profile is built fro the past runtime of the jobs or by executing a smaller block of the job and thereby predicting the expected estimation time of the entire job.
MethodologyTo estimate the runtime of a job in Hadoop MapReduce, first, we investigated the anat-omy of Hadoop’s job and the stages of running a job precisely [1–5]. Since Hadoop works on the repetitive application on the same data type [17], we use the profiling method, which means that there is some separate table in the database for each application. After each job executed, its input data size and the runtime is stored in the database as a his-tory of a job. Tables are updated with new runs.

Page 5 of 18Peyravi and Moeini J Big Data (2020) 7:44
There may be two situations for estimating the runtime:
1 The job with the specified data size and application run for the first time, and no information is available since its execution in the database.
2 The job with this size and application has already run, and its results recorded in the database.
Each case explains below.
Estimating runtime for the first run
If a job had not already been executed and no information was available from its runt-ime, it should be estimated. Running a job in Hadoop can be divided into two general phases: Map and Reduce. So, the runtime of a job is the total execution time of the Map and Reduce steps (Eq. 1).
The Map stage includes the following steps [18]: read, map, collect, spill, and merge, so the execution time of the Map is equal to the total time of each step (Eq. (2)).
The Reduce step also includes [18] the shuffle, reduce, and write, so the run time of the Reduce step calculated from Eq. (3).
Therefore, the time of each stage must be calculated and summated.Since Hadoop run on a distributed system, many factors and parameters affect Tmap
and Treduce [1–5, 22]. So, we investigate the parameters with more impact on runtime.
Parameters affecting the runtime in Hadoop
There are many hardware and software parameters that affect the runtime in Hadoop. In general, three categories of influencing factors are: [11].
1. Hardware factors: Some factors such as the number of nodes in the network, proces-sor power, the core of the CPU, main and secondary memory size and speed, net-work bandwidth, and the number of Containers affect the speed of running the job. Table 1 shows these factors and the amount specified for testing.
2. The settings of each node: The configuration of each node in the cluster will affect the execution speed of the jobs. Some items such as the size of the data block, the number of Map and Reduce that can be run simultaneously on a node, the buffer size and the replication value have a significant impact on the execution time of a job. Table 2 shows these parameters and the default value for each one.
3. Application Properties: Some items such as complexity of Map and Reduce func-tions, the size of input and output data and the runtime of each split as a sample of
(1)TJob = TMap + TReduce
(2)TMap = Tread + Tmap + Tcollect + Tspill + Tmerge
(3)TReduce = Tshuffle + Treduce + Twrite

Page 6 of 18Peyravi and Moeini J Big Data (2020) 7:44
Table 1 Hardware specification of node i (i = 1,2,3,…,N)
Parameters Notation Test value
Number of nodes N 13
Number of containers Ncontainer 96
Processor power CPUi 3.40 GHz
The number of processor cores Ci 3
Network bandwidth BWi 100 Mb/s
Reading speed from RAM RMi 6000 MB/s
Writing speed to RAM WMi 5000 MB/s
Reading speed from Hard disk RHi 120 MB/s
Writing speed to Hard disk WHi 60 MB/s
Table 2 Node configurations [28]
Parameters Description Notation Default value
dfs.blocksize Size of the blocks or splits BS 128 MB
mapreduce.task.io.sort.mb The total amount of buffer memory to use while sorting files, in megabytes.
Sort.mb 100
mapreduce.task.io.sort.factor The number of streams to merge at once while sorting files. This determines the number of open file handles.
Sort.factor 10
mapreduce.map.sort.spill.percent A thread will begin to spill the con-tents to disk in the background.
Spill.percent 0.80
io.sort.record.percent This parameter determines the percentage of sort.mb used to store map output’s metadata.
Record.percent 0.05
mapreduce.reduce.shuffle.paral-lelcopies
The default number of parallel transfers run by reduce during the copy (shuffle) phase.
parallelcopies 5
mapreduce.reduce.shuffle.merge.percent
The usage threshold at which an in-memory merge will be initi-ated, expressed as a percentage of the total memory allocated to storing in-memory map outputs, as defined by mapreduce.reduce.shuffle.input.buffer.percent.
shuffle.merge.percent 0.66
mapreduce.reduce.shuffle.input.buffer.percent
The percentage of memory to be allocated from the maximum heap size to storing map outputs during the shuffle.
Shuffle. buffer.percent 0.70
Max Heap size of reduce task Max heap size that can be used byreduce task
Heapr 1024 MB
Table 3 Application parameters
Parameters Notation
Input data size Dinput
Sample data size Dsample
Map run time in sample data Tm-sample
Reduce run time in sample data Tr-sample
Output to input ratio in Map stage SelmOutput to input ratio in Reduce stage Selr
Page 7 of 18Peyravi and Moeini J Big Data (2020) 7:44
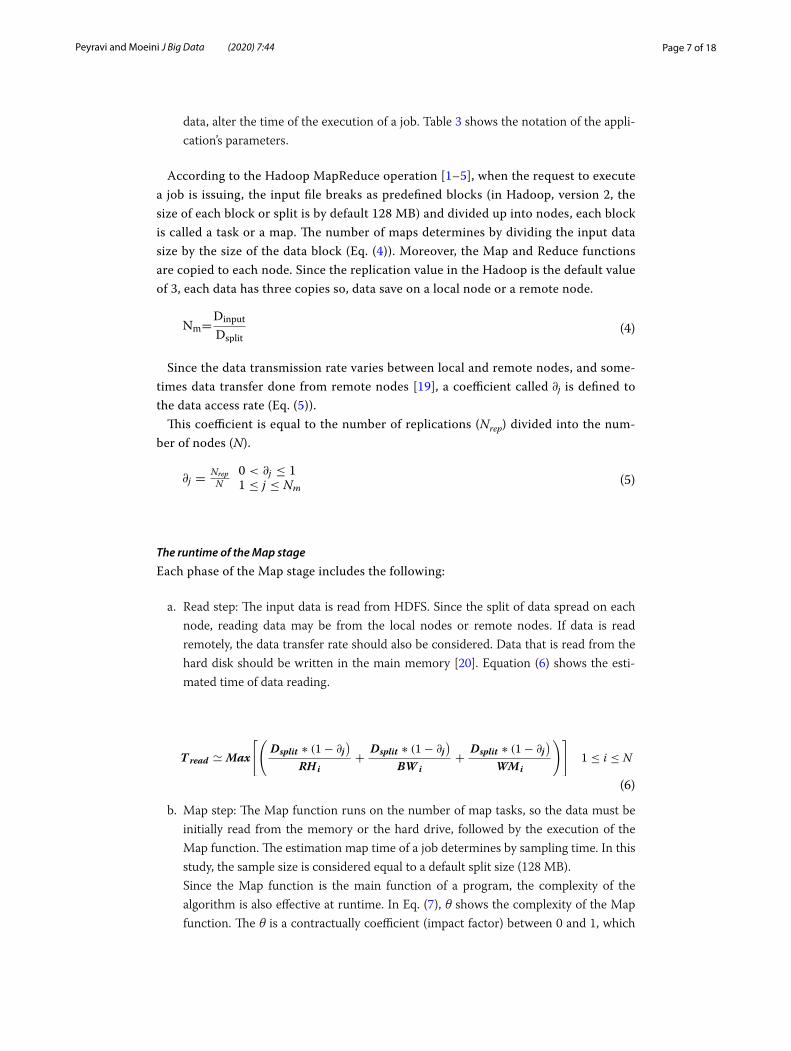
data, alter the time of the execution of a job. Table 3 shows the notation of the appli-cation’s parameters.
According to the Hadoop MapReduce operation [1–5], when the request to execute a job is issuing, the input file breaks as predefined blocks (in Hadoop, version 2, the size of each block or split is by default 128 MB) and divided up into nodes, each block is called a task or a map. The number of maps determines by dividing the input data size by the size of the data block (Eq. (4)). Moreover, the Map and Reduce functions are copied to each node. Since the replication value in the Hadoop is the default value of 3, each data has three copies so, data save on a local node or a remote node.
Since the data transmission rate varies between local and remote nodes, and some-times data transfer done from remote nodes [19], a coefficient called ∂j is defined to the data access rate (Eq. (5)).
This coefficient is equal to the number of replications (Nrep) divided into the num-ber of nodes (N).
The runtime of the Map stage
Each phase of the Map stage includes the following:
a. Read step: The input data is read from HDFS. Since the split of data spread on each node, reading data may be from the local nodes or remote nodes. If data is read remotely, the data transfer rate should also be considered. Data that is read from the hard disk should be written in the main memory [20]. Equation (6) shows the esti-mated time of data reading.
b. Map step: The Map function runs on the number of map tasks, so the data must be initially read from the memory or the hard drive, followed by the execution of the Map function. The estimation map time of a job determines by sampling time. In this study, the sample size is considered equal to a default split size (128 MB).
Since the Map function is the main function of a program, the complexity of the algorithm is also effective at runtime. In Eq. (7), θ shows the complexity of the Map function. The θ is a contractually coefficient (impact factor) between 0 and 1, which
(4)Nm=Dinput
Dsplit
(5)∂j =Nrep
N
0 < ∂j ≤ 11 ≤ j ≤ Nm
(6)
Tread ≃ Max
[(
Dsplit ∗ (1− ∂j)
RHi+
Dsplit ∗ (1− ∂j)
BW i+
Dsplit ∗ (1− ∂j)
WMi
)]
1 ≤ i ≤ N

Page 8 of 18Peyravi and Moeini J Big Data (2020) 7:44
in Table 4; its values determine based on the degree of complexity of each applica-tion’s algorithm.
Equation (7) shows the estimated time of the map phase.
c. The spill and merge step: In the spill stage, the output of the map phase where the records have a key-value is placed and sorted in the memory buffer [21]. The buffer size sets according to the value of the parameter sort.mb, where the default value of this parameter is 100 MB. When the memory buffer fills with the threshold value, the data transferred to the disk. The threshold value sets by the spill.percent parameter, which default value is 0.8, that is, 80% of the buffer that filled with the spill action. If more than one file spilled, the merge operation would start. At the same time, ten spill files can merge. This value is adjustable by the sort.factor parameter. The default value for this parameter is 10. In general, the output of the Map stage is constantly sorting and spilling, which also requires merge-operations.
The time spends doing the spill and merge stage depends on the number of times that the spill or merge action performed. The execution of the spill stage depends on the metadata and the buffer size that holds these metadata. By default, 16 bytes for each record is a key-value for storing metadata. Therefore, Eq. (8) shows metadata size, Eq. (9) metadata buffer size, Eq. (10) the data size, and Eq. (11) the data buffer size.
(7)
Tmap ≃Dsplit ∗ ∂j
RHi+
Dsplit(1− ∂j)
RMi+
Nm ∗ Tm−sample
N container∗ θ ∗
CPUsample ∗ Csample
CPUi ∗ Ci
(8)DMetaData = 16 ∗Dinput
Dsample ∗ Nm∗NSpilled Records
(9)DMetaBuffer = sort.mb ∗ record.percent ∗ spill.percent
(10)Ddata =
(
Dinput
Dsample∗Nm
)
− DMetaData
Table 4 θ values indicate the degree of complexity of each application’s algorithm
The degree of complexity of the algorithm(θ) The amount of impact factor
n! 0.9
2n 0.8
n2 log n 0.7
n2 0.6
n log n 0.5
n 0.4
log n 0.3
c 0.1

Page 9 of 18Peyravi and Moeini J Big Data (2020) 7:44
Concerning the above formulas, Eq. (12) shows the maximum number of spills.
And Eq. (13) shows the size of the spill.
Equation (14) shows the number of merges, and Eq. (15) shows the estimated time of the spill and merge stages.
The runtime of the Reduce stage
Reduce step involves the following sub-steps:
a. Shuffle stage: After completing the first map task of the job, the intermediate results sent to the reducers. The input of the Reduce step is the output of the Map stage. This transfer can be executed locally or remotely. In general, the transfer of data from mappers to reducers is called the shuffle stage.
The output size of the Map stage, which is given to each Reducer, estimates by Eq. (16).
In Eq. (16), selm is the ratio of the number of outputs of the map stage to its input (Eq. (17)), and Nr represents the number of reducers that obtain from Eq. (18).
(11)DDataBuffer = sort.mb ∗ (1− record.percent) ∗ spill.percent
(12)Nspill = max
([
DMetaData
DMetaBuffer
]
,
[
Ddata
DDataBuffer
])
(13)Dspill = DMetaData + Ddata
(14)Nmerge =
[
Nspill
sort.factor
]
(15)T spill + Tmerge ≃ Nspill ∗Dspill ∗
(
1
RMi+
1
WMi
)
+ Nmerge ∗Dspill ∗
(
1
RHi+
1
WHi+
1
RMi+
1
WMi
)
(16)Dshuffle =Dinput ∗ Selm ∗ Nm
Nr
(17)selm =MapOutputRecords
MapInputRecords

Page 10 of 18Peyravi and Moeini J Big Data (2020) 7:44
Data transfer performs in the Shuffle stage. Equation (19) calculates it based on the amount of data and its location. Also, in the shuffle step, the sort operation is per-formed, and the data transmitted, so the estimation time of the shuffle stage can be calculated from Eq. (20).
b. Reduce step: after transferring, sorting, and merging data, the Reduce function per-forms. The time of this step estimated based on the time spent on the tested sample. Equation (21) represents the estimated time at this stage.
c. Write step: At this point, the output of the write step is written to the disk and placed on the HDFS. Equation (22) shows the estimated time of this step.
Estimating runtime of a job that has executed previously
The status of each node affects the runtime of a job. If a node is engaged in a background job, every run may have different times. So, based on the input data size and the type of application, the different runtimes save in a database to use for later estimation.
According to the database, the Exponential Averaging method [23, 24] is used to esti-mate the runtime of a new job if the input data size and the kind of application were similar to previous ones.
In the Exponential Averaging method (Eq. (23)), the recent runtime becomes more important, hence giving more weight. This weight indicates by the coefficient α where 0 < α < 1. α is calculated from Eq. (24).
(18)Nr = 0.95 ∗ Ncontainer
(19)Ttransmit = Dshuffle ∗
(
∂j
RHi+
1− ∂j
BW i+
1− ∂j
WHi
)
(20)
Tsort + Tshuffle ≃ Dshuffle ∗
(
1RMi
+ 1WMi
)
+Dshuffle
Heapr∗shuffle.buffer.percent∗shuffle.merge.percent ∗
Dshuffle ∗
(
1RHi
+ 1WHi
+ 1RMi
+ 1WMi
)
(21)Treduce ≃ Dshuffle ∗1
RMi+
Dshuffle ∗ Tr−sample
Selm∗CPUsample ∗ Csample
CPUi ∗ Ci
(22)Twrite ≃Dshuffle ∗ Selr ∗ Nr
Nr−slot∗
(
1
WRi+
1
RMi
)

Page 11 of 18Peyravi and Moeini J Big Data (2020) 7:44
In this equation, n is the number of sentences sequence in Eq. (23) that calculated from Eq. (24).
In the tests carried out in this study, n = 5 is considered and is calculated up to the fifth sentence of the sequence.
Results and discussionIn this section, we evaluate the proposed method and discuss its error rate percentage.
To evaluate our claim, after estimating the job’s runtime by the proposed method explained above, we obtain the actual runtime of each job at the university lab, and finally, investigate the error rate between actual and estimated runtime.
RMSE and MAPE, described in Eqs. (25) and (26), respectively, are selected as our evaluation indicators [25–27]. RMSE (Root-Mean-Square Error) is a frequently used measure of the differences between values predicted or estimated by a model and the values observed. The MAPE (Mean Absolute Percent Error) measures the size of the error in percentage terms.
They are used as a standard statistical metric to compare the performance of the model for predicting the exchange rate values and to measure the model error.
In Eqs. (25) and (26), Tobs is the observation or actual value, Test is the estimated value, and n is the number of observations.
We use three standard benchmarks of Hadoop as different jobs or applications: [1–5, 22].
• WordCount—to count the number of words in a text.• Sort—to sort the input files.• Inverted index- to look up the set of documents that contains a given the word or
a term that is used often in text processing.
We generate different sizes of data by using TeraGen: 1, 2, 3, 5, 10 and 20 GB as input data.
All tests do in the university laboratory on 13 systems with the specifications in Table 5. Of the 13 systems, one system as Master, and twelve systems consider as Slaves. Hadoop 2.9.1 installed on the systems.
(23)Tn+1 = αTn + (1− α)αTn−1 + (1− α)2αTn−2 + (1− α)3αTn−3 + . . .
(24)α =2
(n+ 1)
(25)RMSE =
√
√
√
√
1
n
n∑
i=1
(Tobs − Test)2
(26)MAPE = 100×1
n
n∑
i=1
|Tobs − Test |
Tobs

Page 12 of 18Peyravi and Moeini J Big Data (2020) 7:44
Evaluation of estimating runtime for the first run
If a job runs for the first time and there is not any profile or history about it, we esti-mate its runtime by proposing a method that explained before.
Table 5 Test environment specifications
Motherboard Giga p85
CPU Intel®core i3-3240 2*2 cores 3.40 GHz
RAM 4 GB
HDD 500 GB
OS Ubuntu 17.04
Band Width 100 Mbps
Hadoop 2.9.1
JDK 1.8.1
Table 6 The runtime of sampling (128 MB) on WordCount, Sort and Inverted index
Information of sampling
Average maptime(s)
Average shuffle time(s)
Average merge time(s)
Average reduce time(s)
Average total time(s)
selm selr
WordCount 18 16.4 7.3 1.66 43.36 8.61 1
TeraSort 9.7 10.09 3.7 4.8 28.29 7.71 1.6
Inverted index 32.3 30.9 10.21 17.07 90.48 15.59 3.68
Table 7 The comparison between average actual and estimated runtime
Input data size (GB)
WordCountAvg.Actualruntime(s)
WordCountestimated runtime(s)
SortAvg.ActualRuntime(s)
Sortestimatedruntime(s)
Inverted indexAvg.Actualruntime(s)
Inverted indexestimatedruntime(s)
1 178.98 158.84 98.93 101.77 274.33 260.31
2 380.04 321 159.44 180.03 621.51 700.47
3 696.33 704.93 368.19 349.18 1310 1329.06
5 1184 1200.03 614.86 646 2849.93 3011
10 2289.07 2398.68 1327 1308.59 4830.37 4103.51
20 4865.11 4991 2502.31 2643.26 8380 8166
0306090
120150180210240
1 2 3 5 10 20
RMSE
(s)
Data Size(GB)
WordCount Sort Inverted index
Fig. 3 RMSE values

Page 13 of 18Peyravi and Moeini J Big Data (2020) 7:44
For evaluating this method, we need runtime of the sampling values. Table 6 show the runtime of sampling for three benchmarks. Each benchmark run five times, and the average values be considered.
Table 7 shows the actual average runtime of a job after five times run and the esti-mated values by the proposed method for different sizes of data.
According to Eqs. (25), (26) Figs. 3 and 4 show the values of RMSE and MAPE for three benchmarks, respectively. The number of observations for each size of data is five.
As Fig. 4 shows, the error percentage decreases with increasing data size, and this indicates that our proposed method is suitable for big data. The maximum error rate is less than 14%.
0
5
10
15
1 2 3 5 10 20M
APE
(%)
DataSize (GB)
WordCount Sort Inverted index
Fig. 4 MAPE values
-10
-5
0
5
10
1 2 3 5 10 20
ERRO
R RA
TE(%
)
DATA SIZE(GB)
WordCount TeraSort inverted index
Fig. 5 The percentage error rate on 13 nodes
-10
-5
0
5
10
1 2 3 5 10 20
Erro
r Rat
e(%
)
Data Size(GB)
wordcount TeraSort inverted index
Fig. 6 The percentage error rate on 10 nodes

Page 14 of 18Peyravi and Moeini J Big Data (2020) 7:44
For more confidence, we repeated the tests by varying the number of nodes and computed the error rate for each test separately by using Eq. (27) [11].
Figures 5, 6, 7, 8 show the percentage of runtime error in the WordCount, TeraSort, and Inverted index application. The results show that the average error rate is less than 10%.
(27)ErrorRange =EstimatedTime − ActualTime
ActualTime∗ 100%
-10
-5
0
5
10
1 2 3 5 10 20
Erro
r Rat
e(%
)Data Size(GB)
wordcount TeraSort inverted index
Fig. 7 The percentage error rate on 5 nodes
-10
-5
0
5
10
1 2 3 5 10 20
Erro
r rat
e(%
)
Data Size(GB)
wordcount sort inverted index
Fig. 8 The percentage error rate on 3 nodes
Table 8 Runtime history for WordCount on 13 nodes
Input data size (GB)
RunTime1 RunTime2 RunTime3 RunTime4 RunTime5 Estimated runtime by the exponential averaging method
1 177 173 182 169 178.04 169.52
2 360.04 381 369.91 382.05 391.07 376.91
3 695.92 690 679.66 704.02 704.41 701.94
5 1186.77 1139.61 1181.05 1166 1190.64 1158.07
10 2290.74 2280.58 2301 2297.89 2273 2297.68
20 4879.05 4783 4955.87 4693.61 4853 4856.84

Page 15 of 18Peyravi and Moeini J Big Data (2020) 7:44
0306090
120150180210
1 2 3 5 10 20RM
SE(s
)
Data Size
WordCount Sort Inverted index
Fig. 9 RMSE values
02468
101214
1 2 3 5 10 20
MAP
E(%
)
Data Size(GB)
WordCount Sort Inverted index
Fig. 10 MAPE values
-5
-3
-1
1
3
5
1 2 3 5 10 20
Erro
r Rat
e(%
)
DataSize(GB)
WordCount TeraSort inverted index
Fig. 11 The percentage error rate on 13 nodes
-5
-3
-1
1
3
5
1 2 3 5 10 20
Erro
rRat
e(%
)
DataSize(GB)
WordCount TeraSort inverted index
Fig. 12 The percentage error rate on 10 nodes

Page 16 of 18Peyravi and Moeini J Big Data (2020) 7:44
Evaluation of estimating runtime of a job that has already been run
After each job is executed, based on the type of application and the size of input data, its runtime stored in the database. Each table stores five runtimes. By using Eq. (23) and the information on the database, the runtime of a new job estimated.
For instance, Table 8 shows the runtime history for WordCount on 13 nodes. (There is the same table for each application in the database.)
Figures 9 and 10 show the RMSE and MAPE, respectively for three benchmarks.According to Fig. 10, the error percentage decreases with increasing data size, and
this shows that our proposed method is suitable for big data. The maximum error rate is less than 12%.
According to Eq. (27), Figs. 11, 12, 13, 14 shows the error rate of the estimated runt-ime by the Exponential Averaging method and actual runtime in WordCount, Tera-Sort, and Inverted index in the different number of nodes. The results show that the error rate is less than 5%.
Conclusions and future worksOne of the popular open-source frameworks for processing big data is Apache Hadoop. To better management of this framework, estimating the runtime of a job is a critical issue.
In this paper, after studying and analyzing the anatomy of processing a job in Hadoop MapReduce precisely to estimate the runtime of a job, we considered two cases: when a job runs for the first time and there is not any history about it or a job has run previously and its profile is available.
-5
-3
-1
1
3
5
1 2 3 5 10 20
Erro
rRat
e(%
)DataSize(GB)
WordCount TeraSort inverted index
Fig. 13 The percentage error rate on 5 nodes
-5
-3
-1
1
3
5
1 2 3 5 10 20
Erro
rRat
e(%
)
DataSize(GB)
WordCount TeraSort inverted index
Fig. 14 The percentage error rate on 3 nodes
Page 17 of 18Peyravi and Moeini J Big Data (2020) 7:44
In the first case, by considering essential and efficient parameters that higher impact on runtime we formulate each phase of the Hadoop execution pipeline and state them by mathematical expressions to calculate runtime of a job. In the second case, by refer-ring to the profile or history of a job in the database and use a weighting system the runtime is estimated. RMSE and MAPE are selected as evaluation indicators. The results show the average error rate is less than 12% in the estimation of runtime for the first run and less than 8.5% when the profile or history of the job has existed.
For future work, we plan to extend the proposed scheme by using machine learning techniques and optimize Hadoop parameter values by using metaheuristic algorithms. Also, we intend to work on estimating Spark job runtime for processing stream data.
AbbreviationsHDFS: Hadoop Distributed File System; RMSE: Root-Mean-Square Error; MAPE: Mean Absolute Percent Error.
AcknowledgementsNot applicable.
Authors’ contributionsAll authors read and approved the final manuscript.
Authors’ informationNarges Peyravi is a Ph.D. student in Information Technology at the University of Qom, Iran. She is a faculty member of Islamic Azad University, Zarghan branch in Iran. Her research mainly focuses on big data processing. Other of her interests are Data Bases, Cloud computing, and scheduling algorithms. She received her Master’s degree at the University of Shiraz, Iran in 2010. Ali Moeini received his Ph.D. in Nonlinear Systems at the University of Sussex, UK, in 1997. He is a full Professor of Department of Algorithms and Computation, Faculty of Engineering Science, College of Engineering, University of Tehran in Iran. His research interests include Mining of Massive Datasets, Big Data, Randomized Algorithms, and Bioinformatics.
FundingNo funding has been received for the conduct of this work and preparation of this manuscript.
Availability of data and materialsIf anyone is interested in our work, we are ready to provide more details and dataset.
Competing interestsThe authors declare that they have no competing interests.
Author details1 Department of Computer Engineering and Information Technology, Faculty of Engineering, University of Qom, Qom, Iran. 2 Department of Algorithms and Computation, School of Engineering Science, College of Engineering, University of Tehran, Tehran, Iran.
Received: 8 January 2020 Accepted: 21 June 2020
References 1. White T. Hadoop: the definitive guide. 4th ed. Newton: O’Reilly Media, Inc; 2015. 2. Perera S. Hadoop MapReduce Cookbook. Birmingham: Packt Publishing Ltd; 2013. 3. Alapati SR. Expert Hadoop administration: managing, tuning, and securing spark, YARN, and HDFS. Boston: Addison-
Wesley Professional; 2016. 4. Heidari S, Alborzi M, Radfar R, Afsharkazemi MA, Ghatari AR. Big data clustering with varied density based on MapRe-
duce. J Big Data. 2019;6(1):77. 5. Singh R, Kaur PJ. Analyzing performance of Apache Tez and MapReduce with hadoop multinode cluster on Amazon
cloud. J Big Data. 2016;3(1):19. 6. Liu Z, Zhang Q, Boutaba R, Liu Y, Gong Z. ROUTE: run-time robust reducer workload estimation for MapReduce. Int J
Network Manage. 2016;26(3):224–44. 7. Khan M, Jin Y, Li M, Xiang Y, Jiang C. Hadoop performance modeling for job estimation and resource provisioning.
IEEE Trans Parallel Distrib Syst. 2015;27(2):441–54. 8. Khan M. Hadoop performance modeling and job optimization for big data analytics. Doctoral dissertation, Brunel
University London. 9. Liu Q, Cai W, Jin D, Shen J, Fu Z, Liu X, Linge N. Estimation accuracy on execution time of run-time tasks in a hetero-
geneous distributed environment. Sensors. 2016;16(9):1386.

Page 18 of 18Peyravi and Moeini J Big Data (2020) 7:44
10. Ramanathan R, Latha B. Towards optimal resource provisioning for Hadoop-MapReduce jobs using scale-out strat-egy and its performance analysis in private cloud environment. Cluster Comput. 2019;22(6):14061–71.
11. Chen YJ, Horng GJ, Cheng ST, Wang HC. Forming spn-MapReduce model for estimation job execution time in cloud computing. Wireless Pers Commun. 2017;94(4):3465–93.
12. Kozyrev VP. Estimation of the execution time in real-time systems. Program Comput Softw. 2016;42(1):41–8. 13. Amannejad Y, Shah S, Krishnamurthy D, Wang M. Fast and lightweight execution time predictions for spark applica-
tions. In: 2019 IEEE 12th international conference on cloud computing (CLOUD). IEEE; 2019, p. 493–5. 14. Kecskemeti G, Nemeth Z, Kertesz A, Ranjan R. Cloud workload prediction based on workflow execution time dis-
crepancies. Cluster Comput. 2019;22(3):737–55. 15. Lu Z, Wang N, Wu J, Qiu M. IoTDeM: an IoT Big Data-oriented MapReduce performance prediction extended model
in multiple edge clouds. J Parallel Distrib Comput. 2018;1(118):316–27. 16. Uvaneshwari M, Kumar NS. Load Balancing and Runtime Prediction using Map Reduce Framework. International
Journal of Civil Engineering & Technology (IJCIET); 2017, p. 834–42. 17. Song G, Meng Z, Huet F, Magoules F, Yu L, Lin X. A hadoop mapreduce performance prediction method. In: 2013
IEEE 10th international conference on high performance computing and communications & 2013 IEEE international conference on embedded and ubiquitous computing. IEEE; 2013, p. 820–5.
18. Chirkin AM, Kovalchuk SV. Towards better workflow execution time estimation. IERI Procedia. 2014;1(10):216–23. 19. Verma A, Cherkasova L, Campbell RH. Resource provisioning framework for mapreduce jobs with performance
goals. In: ACM/IFIP/USENIX international conference on distributed systems platforms and open distributed pro-cessing. Springer, Berlin, Heidelberg; 2011, p. 165–86
20. Li J. Time estimation for large scale of data processing in Hadoop MapReduce scenario. Master’s thesis, Universitetet i Agder/University of Agder.
21. Wang G. Evaluating mapreduce system performance: a simulation approach. Doctoral dissertation, Virginia Tech. 22. Tannir K. Optimizing Hadoop for MapReduce. Birmingham: Packt Publishing Ltd; 2014. 23. Lattyak WJ, Stokes HH. Exponential smoothing forecasting using SCAB34S and SCA WorkBench. 24. https ://en.wikip edia.org/wiki/Movin g_avera ge; This page was last edited on 19 November 2018. 25. Chai T, Draxler RR. Root mean square error (RMSE) or mean absolute error (MAE)?—arguments against avoiding
RMSE in the literature. Geosci Model Dev. 2014;7(3):1247–50. 26. https ://www.stati stics howto .datas cienc ecent ral.com/mean-absol ute-perce ntage -error -mape/; This page was last
edited on 2019. 27. https ://www.forec astpr o.com/Trend s/forec astin g101A ugust 2011.html; This page was last edited on 2019. 28. http://hadoo p.apach e.org/docs/r2.9.1/hadoo p-proje ct-dist/hadoo p-commo n/Depre cated Prope rties .html;Last.
Published: 2018-04-16.
Publisher’s NoteSpringer Nature remains neutral with regard to jurisdictional claims in published maps and institutional affiliations.