estimating reflectivity values from wind turbines for ... · pdf file2184 i. angulo et al.:...
TRANSCRIPT
Atmos. Meas. Tech., 8, 2183–2193, 2015
www.atmos-meas-tech.net/8/2183/2015/
doi:10.5194/amt-8-2183-2015
© Author(s) 2015. CC Attribution 3.0 License.
Estimating reflectivity values from wind turbines for analyzing
the potential impact on weather radar services
I. Angulo1, O. Grande1, D. Jenn2, D. Guerra1, and D. de la Vega1
1University of the Basque Country (UPV/EHU), Bilbao, Spain2Naval Postgraduate School, Monterey, USA
Correspondence to: D. de la Vega ([email protected])
Received: 16 January 2015 – Published in Atmos. Meas. Tech. Discuss.: 3 February 2015
Revised: 28 April 2015 – Accepted: 30 April 2015 – Published: 27 May 2015
Abstract. The World Meteorological Organization (WMO)
has repeatedly expressed concern over the increasing num-
ber of impact cases of wind turbine farms on weather radars.
Current signal processing techniques to mitigate wind tur-
bine clutter (WTC) are scarce, so the most practical approach
to this issue is the assessment of the potential interference
from a wind farm before it is installed. To do so, and in or-
der to obtain a WTC reflectivity model, it is crucial to esti-
mate the radar cross section (RCS) of the wind turbines to
be built, which represents the power percentage of the radar
signal that is backscattered to the radar receiver.
For the proposed model, a representative scenario has been
chosen in which both the weather radar and the wind farm are
placed on clear areas; i.e., wind turbines are supposed to be
illuminated only by the lowest elevation angles of the radar
beam.
This paper first characterizes the RCS of wind turbines
in the weather radar frequency bands by means of computer
simulations based on the physical optics theory and then pro-
poses a simplified model to estimate wind turbine RCS val-
ues. This model is of great help in the evaluation of the po-
tential impact of a certain wind farm on the weather radar
operation.
1 Introduction
The potential impact of wind turbines on weather radar
performance has been extensively studied in the last few
years, with several evidences of wind turbine clutter observa-
tions in meteorological radar applications (Isom et al., 2008;
Gallardo-Hernando et al., 2011; Norin and Haase, 2012; Vogt
et al., 2011; WMO, 2005, 2010). The main objective of these
studies is to characterize and try to mitigate the so-called
wind turbine clutter (WTC), mainly by means of digital sig-
nal processing such as clutter-filtering techniques.
Unfortunately, these solutions are not widely available yet.
Meanwhile, the most practical approach to this issue is the
prediction of the potential impact on a certain weather radar
service before installing a wind farm. In most cases, the iden-
tification of a potential impact allows the planning of alterna-
tive solutions in order to guarantee the coexistence of wind
energy and meteorological radar services.
Wind turbine clutter reflectivity depends on many factors
including wind turbine dimensions, wind direction and ve-
locity, angle of incidence and radar frequency (Gallardo-
Hernando et al., 2011; Norin and Haase, 2012; Norin, 2015).
In order to measure how efficiently radar pulses are backscat-
tered by wind turbines, existing models of wind turbine clut-
ter and weather radar recommendations rely on the turbines’
radar cross section (RCS) (Tristant, 2006; ITU-R, 2009;
Norin and Haase, 2012). The RCS is the projected area re-
quired to intercept and isotropically radiate the same power
as the target scatters toward the receiver, and thus it is nor-
mally expressed in decibels with respect to a square meter
(dBsm) (Skolnik, 2008; Rinehart, 1997).
In this context, the goal of this paper is to propose sim-
plified formulae for the estimation of reflectivity values from
wind turbines at frequencies used by weather radars. These
formulae aim at being easily implementable in software tools
for estimating the potential impact of wind farms on weather
radars.
Published by Copernicus Publications on behalf of the European Geosciences Union.
2184 I. Angulo et al.: Reflectivity values from wind turbines for weather radar services
For this purpose, first RCS patterns for different work-
ing conditions of the wind turbines are obtained by means
of physical optics (PO) simulations and subsequently ana-
lyzed. Additionally, separate RCS patterns of the parts of the
turbine are also calculated in order to compare the relative
contribution of each component. Based on these simulations,
a simple algorithm to evaluate the potential impact of a wind
farm on a nearby weather radar is proposed.
It should be mentioned that similar studies for characteriz-
ing RCS of wind turbines have been carried out for evaluat-
ing the impact on different services such as maritime radars
(Grande et al., 2014) or television (Angulo et al., 2011).
However, as scattering is very dependent on working fre-
quency and illumination conditions, results cannot be ex-
trapolated. Moreover, preliminary results of the analysis pre-
sented in this paper are included in a previous communica-
tion from the authors (Grande et al., 2015). Those results cor-
respond to a single wind turbine model and a single working
frequency. In the present paper, results are extended to three
wind turbine models of different size and the three frequency
bands assigned to weather radar services; besides, based on
the obtained results, a novel formulation for estimating the
WTC reflectivity values for weather radar applications is pro-
posed. This work aims at making studies for the prediction of
potential impacts between weather radar services and wind
farm deployments easier to conduct.
2 Impact of wind farms on weather radars
In weather radars, wind turbines may lead to misidentifica-
tion of precipitation features and to erroneous characteriza-
tion of meteorological phenomena. These errors may be due
to clutter caused by signal echoes from the wind turbines;
signal blockage, as the physical size of the wind turbine cre-
ates a shadow zone behind them of diminished detection ca-
pacity; and interference to the Doppler mode of the radar, on
account of frequency shifted echoes from the rotating blades
(Angulo et al., 2014; Norin and Haase, 2012; Belmonte and
Fabregas, 2010).
The clutter from wind turbines is due to radar echoes
coming from a turbine and reaching the radar with a power
level higher than the radar detection threshold, preventing the
radar from correctly detecting the precipitation level in the
affected area. Although most of current radars include sig-
nal processing techniques that remove static scattering from
turbine masts, the scattered energy will increase the effec-
tive noise floor of the radar receiver, which degrades the de-
tection capacity and therefore the data quality obtained by
the radar. Detection of precipitation requires a signal that ex-
ceeds the noise floor by at least the signal-to-noise ratio. En-
ergy scattered from wind turbines results in the occurrence of
increased noise that might cause desired targets to be unde-
tected. Although the signal processing techniques may mit-
igate the display of false targets generated by the stationary
clutter from a wind farm, it will not eliminate effects that
raise the noise floor of the radar (Tristant, 2006; Lemmon et
al., 2008).
Regarding the Doppler mode of the radar, as it is aimed at
detecting moving targets, only the scattering from the blades
should be considered in order to determine the influence of a
wind turbine on this operation mode.
Therefore, both the clutter phenomenon and the interfer-
ence to the Doppler mode depend on the scattering charac-
teristics of wind turbines. By contrast, as the blocking of the
radar beam is due to the physical obstruction of the radar
beam by the wind turbine, the methodology to estimate a po-
tential impact of a wind farm due to signal blockage is not re-
lated to the RCS of wind turbines but to the percentage of the
beam section blocked by the wind turbine structure (Tristant,
2006; Belmonte and Fabregas, 2010). Consequently, this pa-
per does not focus on addressing the signal blockage esti-
mates.
As the RCS of a wind turbine depends both on fixed pa-
rameters, such as the dimensions and materials of each com-
ponent of the wind turbine, and on variable parameters, such
as position of the rotating blades and rotor orientation with
respect to the radar, RCS values may vary drastically accord-
ing to wind turbine working regimes and illumination condi-
tions (Angulo et al., 2011; Grande et al., 2014).
The calculation of RCS values by conventional prediction
methods, such as the method of moments (MoM) or the finite
difference time domain (FDTD) method, provides accurate
results but relies upon extremely detailed representations of
the turbine, which requires significant modeling and complex
calculations with great computational effort. Consequently,
these RCS prediction methods cannot be easily implemented
in computer simulation tools for analyzing the potential im-
pact of a specific wind farm.
On the contrary, and due to the absence of simplified for-
mulation, some published guidelines for analyzing the im-
pact of wind turbines on radar services use typical fixed RCS
values, disregarding the particular features of each installa-
tion (ITU-R, 2009; Tristant, 2006). This is a very simple
way to deal with wind turbine scattering, but its main dis-
advantage is that the proposed RCS values do not take into
account the characteristics of the real scenario under analy-
sis: wind turbine dimensions, angle of incidence and working
frequency, amongst others. As a result, these proposed typ-
ical constant RCS values may lead to important estimation
errors.
In this paper, a simplified formulation for determining ac-
curate WTC reflectivity values is proposed. The presented
method requires neither complex calculations nor the use of
a simulation tool, whereas it provides RCS values adapted
to the particular features of the case under analysis: dimen-
sions of the wind turbine models, illumination conditions and
working frequency.
Atmos. Meas. Tech., 8, 2183–2193, 2015 www.atmos-meas-tech.net/8/2183/2015/

I. Angulo et al.: Reflectivity values from wind turbines for weather radar services 2185
25
1
Figure 1. Spherical coordinate system used in the RCS calculations. R represents radar 2
location. 3
4
xy
z
R
Figure 1. Spherical coordinate system used in the RCS calculations.
R represents radar location.
3 Methodology
The main objective of this paper is to develop an estimation
model of wind turbine reflectivity values for weather radars
that consists in a simplified formulation, is easy to apply in
the development of the impact studies, and does not require
a complex software tool or a high amount of resources.
The estimation model should fulfill the following condi-
tions.
– Despite being a simplified formulation, the model
should provide accurate radar cross-section values,
which are directly translated into reflectivity values.
– The model should consider the variability of the RCS
values generated by the rotor orientation and the blades
rotation, because the RCS values are very dependent on
the specific relative positions of the different compo-
nents of the turbine with respect to the radar.
– The model should be applicable to turbine models of
different size, different working frequencies and differ-
ent radar illumination conditions.
3.1 Simulation conditions
3.1.1 Simulation tool and wind turbine models
The present study is based on the accurate assessment of RCS
values of wind turbines by applying the PO theory. The PO
theory is a high-frequency approximation method that pro-
vides accurate results for electrically large objects (L≥ 10λ)
and for observation points near the specular direction. More
precisely, the software tool POfacets (Jenn, 2005) has been
used to calculate RCS patterns of three different wind tur-
bine models. To do so, detailed facet-based representations
of these wind turbine models have been prepared for the ap-
plication of numerical solutions of the PO method for RCS
estimations. The software tool does not include the effect of
Table 1. Wind turbine models selected for the simulations.
Model 1 Model 2 Model 3
Mast height 78 m 100 m 119 m
Mast upper radius 1.15 m 1.80 m 2.40 m
Mast lower radius 1.75 m 2.70 m 3.60 m
Rotor diameter 87 m 90 m 112 m
Blade length 42.50 m 44.00 m 54.65 m
Rated power 2.0 MW 2.0 MW 3.3 MW
multiple reflections, diffraction or surface waves. More in
depth descriptions of the physical optics method and the sim-
ulation tool can be found in Jenn (2005), Grande et al. (2014,
2015).
It should be noted that this tool provides accurate RCS val-
ues for a specific rotor orientation and blade position but at
the expense of having to design rigorous representations of
the wind turbine models. Hence, estimations of RCS values
for each specific position of the blades must be conducted
and therefore hundreds of RCS simulations are required in
order to obtain a detailed characterization of the RCS pat-
terns for different working conditions. The analysis of this
huge set of RCS values is the basis of the proposed simplified
model to be integrated in the prediction tools for potential in-
terference from a wind farm. In fact, the main motivation of
the proposed simplified model is precisely avoiding the need
of such a simulation effort in future cases under study.
As mentioned in Sect. 1, three commercial wind turbine
models were chosen for the analysis, which constitutes a rep-
resentative selection of the wind turbines that are usually in-
stalled. Typical horizontal-axis wind turbines are composed
of a mast or supporting tower, commonly made from tubu-
lar steel; a nacelle that holds all the turbine machinery and
rotates to follow the wind direction; and a rotor with three
blades of complex aerodynamic surface, being the rotor shaft
tilted above the horizontal to enable greater clearance be-
tween the blades and the mast. Characteristics of the selected
models are summarized in Table 1. It should be noted that
upper and lower radii of the masts are different because the
geometry of the supporting tower of the wind turbines is not
a perfect right circular cylinder but a tapered cylinder.
Figure 1 shows the reference coordinate system for the
analysis. The wind turbine rotor is supposed to be oriented
towards the x axis and R refers to the radar position. As
shown in the figure, θ is the angle from the zenith that de-
fines the radar position in the vertical plane, and φ specifies
the horizontal position of the radar with respect to the rotor
orientation, i.e., with respect to the rotor shaft axis.
3.1.2 Simulation precision
The analysis is based on the assessment of backscattering
patterns for a set of elevation angles (variation in θ), as de-
tailed in Sect. 3.2, and different conditions of rotor orienta-
www.atmos-meas-tech.net/8/2183/2015/ Atmos. Meas. Tech., 8, 2183–2193, 2015
2186 I. Angulo et al.: Reflectivity values from wind turbines for weather radar services
1
Figure 2. Vertical sections of RCS patterns (Ф = 5º) for wind turbine models 1 to 3 at 2
frequency 2.80 GHz. Rotor position is indicated in the lowest right corner. 3
4
-15 0 15 30 45 60 7588
89
90
91
92
93
94
RCS (dBsm)
θ (°)
23
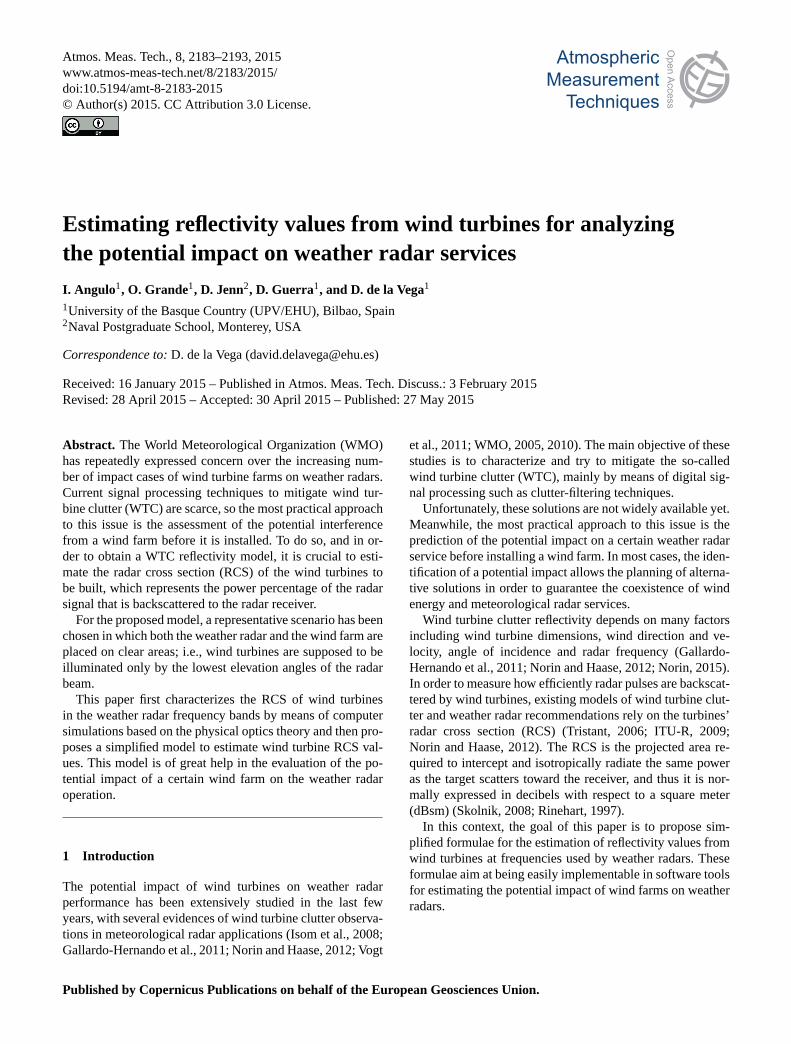
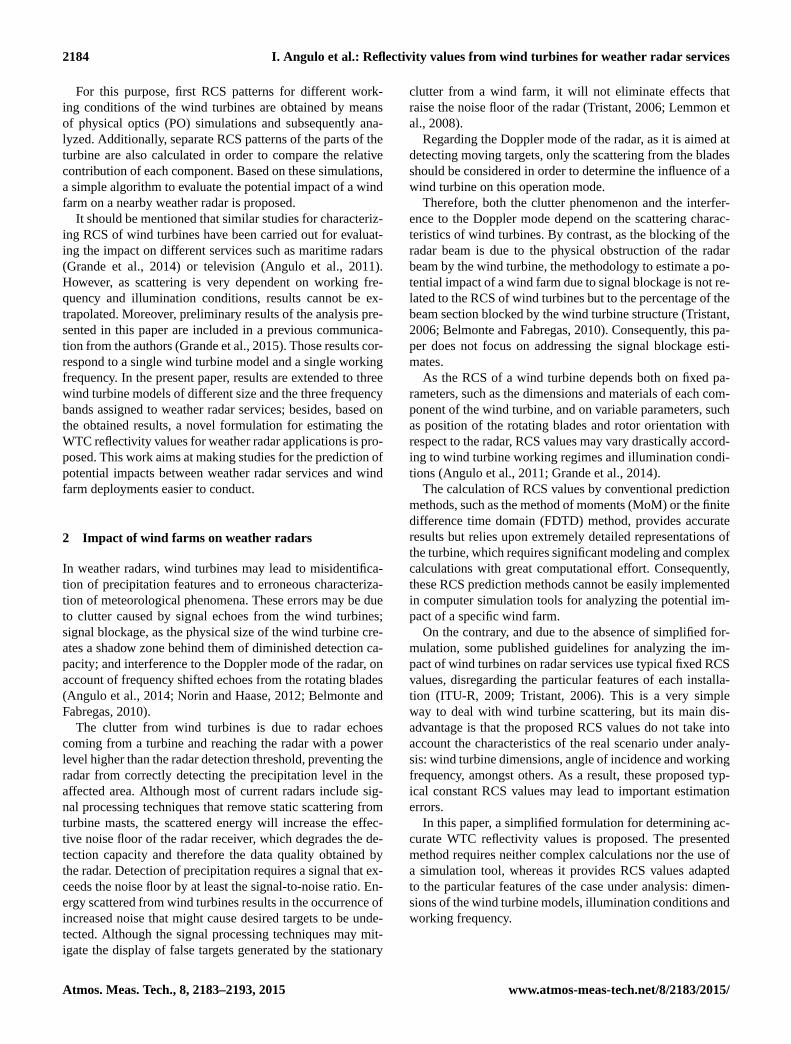
Figure 2. Vertical sections of RCS patterns (φ = 5◦) for wind tur-
bine models 1 to 3 at frequency 2.80 GHz. Rotor position is indi-
cated in the lowest right corner.
tion with respect to the radar (variation in φ from 0 to 185◦)
and blades position (rotating blades).
Calculations with particularly high resolution have been
conducted for RCS vertical patterns (resolution of 0.001◦ in
θ), as great variability is expected in this plane. The effect of
the rotating blades has been analyzed by simulations with a
difference of 15◦ in the rotation angle of the blades. In ad-
dition, these estimated RCS values have been obtained for
different positions of the rotor with respect to the incident
signal in the horizontal plane (aspect angles separated 1◦ in
φ).
In order to evaluate the relative significance of the signal
backscattered by the different parts of the wind turbine, sep-
arated RCS patterns of the mast, nacelle and single blades
have been obtained and compared with the RCS pattern of
the whole wind turbine, as described in Sect. 4 and shown in
Figs. 2 to 7.
3.2 Considerations of the analysis
The case under analysis is a wind farm located within the
detection volume of a weather radar. When this situation oc-
curs, some specific conditions are applicable. The thorough
outline of these conditions allows the clear delimitation of
the scenario under analysis:
– Monostatic backscattering. Weather radars only receive
monostatic backscattered signals, so monostatic RCS
values are analyzed in this paper.
– Frequency bands. The analysis is conducted for the
frequency bands assigned to weather radar operation:
2700–2900 MHz in S band, 5250–5725 MHz (mainly
5600–5650 MHz) in C band and 9300–9500 GHz in X
band (ITU-R, 2008). In weather radars, S band is well
suited for detecting heavy rain at very long ranges, up to
300 km; C band represents a good compromise between
range and reflectivity and cost, and they can provide rain
detection up to 200 km; and X band weather radars are
used only for short range weather observations up to a
range of 50 km (ITU-R and WMO, 2008).
– Materials. The metallic mast can be considered as per-
fect electric conductor. Although modern blades are
made of composite materials which are difficult to char-
acterize, blades in the simulations are supposed to be
metallic in order to consider the worst-case assumption
for this component of the turbine.
– Relative location of weather radar and wind turbine,
and corresponding elevation angles. As a proof of con-
cept for the proposed model, a representative scenario
has been chosen. This scenario considers that weather
radars are usually located in open places that allow un-
obstructed scanning of a wide area, up to 300 km. Wind
farms are also placed on clear areas, where potential
wind energy is higher. As weather radar beams use quite
directive lobes (usually 1◦ beam width), wind turbines
are illuminated only when radar transmission is point-
ing to the wind farm. Therefore, the scenario that must
be analyzed is the potential incidence of the lowest el-
evation angles of the radar beam on the wind turbines.
Lowest elevation angles of the scanning routine are usu-
ally transmitted just above horizon for radar located in
flat areas or slightly below the horizon for radars located
on top of the hills. Accordingly, a reasonable range of
the lowest elevation angles where the radar beam can il-
luminate a wind turbine is−2 to+4◦ with respect to the
horizon (WMO, 2014) (Grande et al., 2015). The previ-
ous assumption leads to incidence angles on the wind
turbine nearly perpendicular to the vertical axis of the
mast, in particular within the range 88◦<θ<94◦.
– Reflectivity model. The calculation of the reflectivity
value from a wind turbine is based on considering line
of sight (LoS) propagation. In real scenarios, interac-
tions from the ground and terrain should be taken into
account, e.g., potential shadowing effects (Norin and
Haase, 2012). Moreover, it is assumed that the wind tur-
bine is being illuminated by the main lobe of the radia-
tion pattern of the radar.
4 Simulation results and analysis
As mentioned in Sect. 3.2, simulations have been carried out
for three frequencies representative of the different weather
radar frequency bands (2.80, 5.65 and 9.40 GHz) and three
wind turbine models based on actual commercial turbines.
As an example, Figs. 2 to 4 show the vertical variation of
the RCS patterns of wind turbine models 1 to 3 for a specific
rotor orientation for the three frequencies under analysis. It
can be observed that the RCS patterns show great variability
and a very directive main lobe is noticeable in all cases.
Atmos. Meas. Tech., 8, 2183–2193, 2015 www.atmos-meas-tech.net/8/2183/2015/

I. Angulo et al.: Reflectivity values from wind turbines for weather radar services 2187
1
Figure 3. Vertical sections of RCS patterns (Ф = 5º) for wind turbine models 1 to 3 at 2
frequency 5.65 GHz. Rotor position is indicated in the lowest right corner. 3
4
-15 0 15 30 45 60 7588
89
90
91
92
93
94
RCS (dBsm)
θ (°)
24
Figure 3. Vertical sections of RCS patterns (φ = 5◦) for wind tur-
bine models 1 to 3 at frequency 5.65 GHz. Rotor position is indi-
cated in the lowest right corner.
1
Figure 4. Vertical sections of RCS patterns (Ф = 5º) for wind turbine models 1 to 3 at 2
frequency 9.40 GHz. Rotor position is indicated in the lowest right corner. 3
4
-15 0 15 30 45 60 7588
89
90
91
92
93
94
RCS (dBsm)
θ (°)
25
Figure 4. Vertical sections of RCS patterns (φ = 5◦) for wind tur-
bine models 1 to 3 at frequency 9.40 GHz. Rotor position is indi-
cated in the lowest right corner.
This maximum value of the RCS corresponds to an illu-
mination direction of θ = 89.56◦ with respect to the zenith
in case of WT model 1, θ = 89.48◦ in case of WT model
2, and θ = 89.42◦ for WT model 3. Taking into account the
slant surface of the masts, these directions correspond to the
direction normal to the mast surface of each wind turbine
model. As expected, the maximum RCS value is larger for
the tallest wind turbine. Moreover, when comparing Fig. 2
to Fig. 4, it is clearly observed that the main lobe is both
higher and narrower as the frequency increases. This maxi-
mum value of the RCS in the vertical pattern is maintained
for all the azimuth values due to the symmetry of the mast in
the horizontal plane.
In order to identify the contribution of the blades and na-
celle, for the highest frequency and a specific rotor orienta-
tion, the RCS of WT model 3 is depicted in Fig. 5 for differ-
ent positions of the blades (every 30◦ in the rotation move-
ment). The RCS pattern of the isolated mast is also depicted
in Fig. 5. As observed in the figure, whereas the contribution
Figure 5. Vertical sections of RCS patterns (φ = 5◦) for wind tur-
bine model 3 at frequency 9.40 GHz. Legend entries starting with
PXXX indicate the position of the upper blade (being P000 vertical
right position and P090 horizontal position).
Figure 6. Vertical sections of RCS patterns (φ =
5◦,6,80,176,177,184,185◦) for wind turbine model 2 at
frequency 5.65 GHz and rotor position P000.
from the blades varies in amplitude and position with the ro-
tation movement, the maximum RCS of the wind turbine is
constant and it is clearly generated by the mast. Figure 5 also
shows that the main contribution from the rotor is due to a
blade being in vertical position (see curves related to P000
and P060 in Fig. 5).
As it can be expected, the contribution from the blades
is strongly dependent on the rotor orientation with respect
to the incident radar signal, whereas the contribution from
the mast remains invariable in the horizontal plane due to its
symmetry with respect to the vertical axis of the mast. This
statement is confirmed by Fig. 6, in which the vertical RCS
patterns of WT model 2 are compared for different illumina-
tion directions in the horizontal plane (different φ values).
A first important conclusion obtained from the extensive
set of simulations carried out is that the main scatterer of
the wind turbine for the different frequency bands used for
weather radar is the supporting mast. Moreover, the main
feature of the scattering pattern of the mast is a main lobe
www.atmos-meas-tech.net/8/2183/2015/ Atmos. Meas. Tech., 8, 2183–2193, 2015
2188 I. Angulo et al.: Reflectivity values from wind turbines for weather radar services
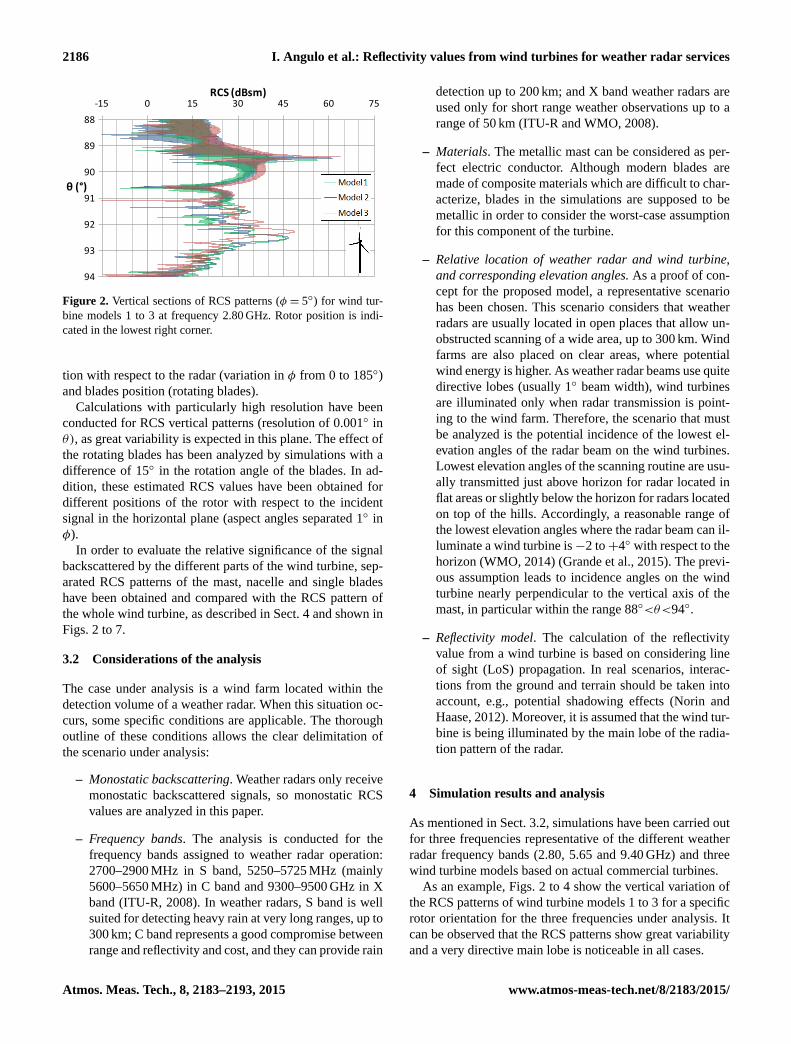
Figure 7. Geometry for the RCS calculation of the mast.
normal to the slant surface, extremely directive in the ver-
tical plane and omnidirectional in the horizontal plane. The
scattering from the mast can be approximated by the RCS of
a right circular cylinder, which will be the basis of the pro-
posed model for calculating the wind turbine RCS values, as
later described in Sect. 5.1.
The blades, by contrast, provide variable levels of signal
scattering depending on the rotor orientation and blade posi-
tions. Despite the variability of the scattering from the blades,
their contribution to the total RCS of the wind turbine is al-
ways significantly lower than the amplitude of the main lobe
due to the mast. Therefore, in order to provide a worst-case
assumption with respect to the signal scattered by the blades,
the proposed scattering model will provide an upper limit to
the RCS values from the blades, as will be shown in Sect. 5.2.
5 Proposed model
5.1 Scattering from the mast
As demonstrated in the previous section, the mast is the main
scatterer of the wind turbine due to its large dimensions, as it
generates the maximum value of the RCS pattern.
The geometry of the mast can be approximated by a right
cylinder because for commercial wind turbine models the
half cone angle α that defines the slant surface of the mast
is small (see Fig. 7):
α = tan−1
(r2− r1
H
). (1)
For example, for the three models under analysis, the half
cone angle is smaller than 0.6◦. Therefore, a perfectly con-
1
Figure 8. RCS pattern obtained by simulation vs RCS values obtained by the proposed 2
simplified model for the mast of wind turbine model 1 and frequency 5.65 GHz. 3
4
15 30 45 6089,49
89,51
89,53
89,55
89,57
89,59
89,61
89,63
RCS (dBsm)
θ (°)
29
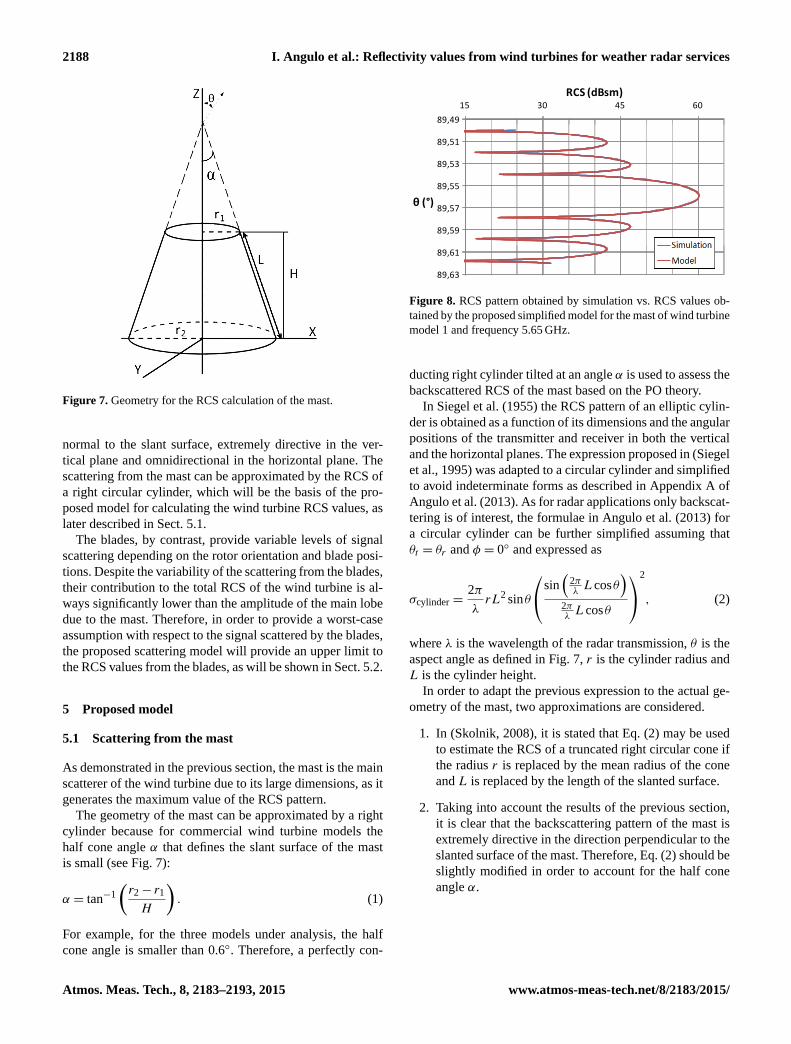
Figure 8. RCS pattern obtained by simulation vs. RCS values ob-
tained by the proposed simplified model for the mast of wind turbine
model 1 and frequency 5.65 GHz.
ducting right cylinder tilted at an angle α is used to assess the
backscattered RCS of the mast based on the PO theory.
In Siegel et al. (1955) the RCS pattern of an elliptic cylin-
der is obtained as a function of its dimensions and the angular
positions of the transmitter and receiver in both the vertical
and the horizontal planes. The expression proposed in (Siegel
et al., 1995) was adapted to a circular cylinder and simplified
to avoid indeterminate forms as described in Appendix A of
Angulo et al. (2013). As for radar applications only backscat-
tering is of interest, the formulae in Angulo et al. (2013) for
a circular cylinder can be further simplified assuming that
θt = θr and φ = 0◦ and expressed as
σcylinder =2π
λrL2 sinθ
sin(
2πλLcosθ
)2πλLcosθ
2
, (2)
where λ is the wavelength of the radar transmission, θ is the
aspect angle as defined in Fig. 7, r is the cylinder radius and
L is the cylinder height.
In order to adapt the previous expression to the actual ge-
ometry of the mast, two approximations are considered.
1. In (Skolnik, 2008), it is stated that Eq. (2) may be used
to estimate the RCS of a truncated right circular cone if
the radius r is replaced by the mean radius of the cone
and L is replaced by the length of the slanted surface.
2. Taking into account the results of the previous section,
it is clear that the backscattering pattern of the mast is
extremely directive in the direction perpendicular to the
slanted surface of the mast. Therefore, Eq. (2) should be
slightly modified in order to account for the half cone
angle α.
Atmos. Meas. Tech., 8, 2183–2193, 2015 www.atmos-meas-tech.net/8/2183/2015/

I. Angulo et al.: Reflectivity values from wind turbines for weather radar services 2189
According to the above-mentioned considerations, the
proposed model to calculate the RCS of the wind turbine
mast is given by
σmast =2π
λrL2 sin(θ +α)
sin(
2πλLcos(θ +α)
)2πλLcos(θ +α)
2
, (3)
where λ is the wavelength of the radar transmission, θ is the
aspect angle as defined in Fig. 7, α is the half cone angle as
given by Eq. (1), r is the mean radius of the truncated cone
r =r1+ r2
2, (4)
and L is the length of the slanted surface of the mast
L=H
cosα. (5)
In order to prove the validity of the proposed model, the
obtained results are compared to the simulation values pre-
sented in the previous section. For all the analyzed cases, i.e.,
for the three wind turbine models and three working frequen-
cies under consideration, the mean error between the simu-
lation values and the values obtained according to Eq. (3) is
lower than 0.85 dB. An example to demonstrate that simula-
tion and modeling values are very well aligned is shown in
Fig. 8.
5.2 Scattering from the blades
From the results of simulations of the RCS patterns, it is
clearly shown that the scattering from the blades is signif-
icantly lower than the scattering from the mast. Moreover,
it should be considered that, as shown in Figs. 5 and 6, the
scattering from the blades is strongly dependent on the posi-
tion of the rotor with respect to the radar. In order to analyze
a potential impact situation, therefore, a detailed representa-
tion of the blades and all the possible movements of the wind
turbine should be needed. However, obtaining detailed repre-
sentations of actual wind turbine blades is quite difficult, as
the blade design is property of the wind turbine manufacturer,
and the analysis of hundreds of different combinations of ro-
tor orientation and blades position requires a huge amount of
time and effort.
Therefore, instead of obtaining a complete scattering
model for the blades, a simpler approach to this issue is
characterizing the maximum value of the scattering from the
blades. To do so, the maximum RCS value due to the blades
for each wind turbine model will be obtained. In fact, as com-
mented before and shown in Fig. 5, the maximum RCS due
to the blades corresponds to the contribution of a single blade
in vertical position.
From the set of simulations carried out in this analysis, the
maximum RCS values from the mast and blades are shown
in Table 2. As shown in Sect. 4 when comparing Figs. 2, 3
and 4, these maximum RCS values are frequency dependent.
However, if the relation between the maximum RCS from the
mast and the maximum RCS from the blades is obtained, it
can be observed that this relation remains almost constant for
the different frequency bands.
Although their complex geometry prevents us from obtain-
ing simple RCS models to characterize the scattering from
the blades, the relation between the maximum RCS from the
mast and the maximum RCS from the blades must be pro-
portional to their corresponding dimensions, as the RCS of
an object generally depends upon its physical size when its
orientation relative to the LoS to the radar is such that a sig-
nificant area of the object is illuminated (Knott, 2006; Skol-
nik, 2008).
As a very simple approach, the blade can be represented
by a triangle. However, in real blade designs, the profile of
the blade rotates from hub toward to the blade tip in order to
maintain the angle of attack (Gipe, 2004). Considering this
twist angle of the blades, the area of the triangle will be never
completely facing the radar. In Spera and Sengupta (1994) it
is empirically obtained that the signal scattering efficiency of
a blade η is dependent on the blade twist according to
η = exp(−2.301β), (6)
where 1β is the total blade twist from root to tip (rad). This
total twist depends on the blade length and design. In com-
mercial wind turbines, total blade twist is typically about 20◦.
For example, a Vestas V27 model has a total blade twist of
13◦ (Gipe, 2004), which provides scattering efficiency values
around 0.45–0.60.
As a rough approach, we will consider a scattering effi-
ciency of 50 % for the wind turbine blade. As later shown
in Tables 2 and 3, this assumption leads to a good approxi-
mation of the signal scattered by the blades. Therefore, the
relative scattering area from the blades Ablades is calculated
as
Ablades = 0.5w · l
2, (7)
where w is the maximum blade width and l is the blade
length.
The mast, by contrast, will be constantly facing the radar
with an area that can be approximated by a trapezoid:
Amast = (r1+ r2)H, (8)
where r1 and r2 are the upper and lower radii of the mast, and
H is the mast height.
Thus, the relation 1 in dB between the relative scattering
area of the mast and blades can be obtained as
1= 10log10
(4H(r1+ r2)
w · l
). (9)
According to the wind turbine characteristics gathered in Ta-
ble 1, these relations are calculated and shown in Table 3. If
www.atmos-meas-tech.net/8/2183/2015/ Atmos. Meas. Tech., 8, 2183–2193, 2015

2190 I. Angulo et al.: Reflectivity values from wind turbines for weather radar services
Table 2. Maximum RCS values from the mast and blades for the wind turbine models selected for the simulations.
WT model 1 WT model 2 WT model 3
Mast Blade Difference Mast Blade Difference Mast Blade Difference
(dBsm) (dBsm) (dB) (dBsm) (dBsm) (dB) (dBsm) (dBsm) (dB)
2.80 GHz 55.97 45.92 10.05 61.38 46.81 14.57 64.00 48.81 15.19
5.65 GHz 59.95 49.42 10.53 64.32 49.74 14.58 67.03 52.10 14.93
9.4 GHz 62.42 51.61 10.81 66.45 52.00 14.45 69.14 54.22 14.92
Table 3. Relation1 between the relative scattering area of the mast
and blades for the wind turbine models selected for the simulations.
WT model 1 WT model 2 WT model 3
9.90 dB 12.65 dB 13.38 dB
1
Figure 9. Vertical sections of RCS patterns (Ф = 5º, 6º, 80º, 176º, 177º, 184º, 185º) for wind 2
turbine model 1 (Frequency 5.65 GHz, Rotor position P000) and result of the proposed model 3
(black line). 4
30
Figure 9. Vertical sections of RCS patterns (φ = 5◦, 6, 80, 176,
177, 184 and 185◦) for wind turbine model 1 (Frequency 5.65 GHz,
Rotor position P000) and result of the proposed model (black line).
values in Tables 2 and 3 are compared, it can be stated that
the relation in dB between the relative scattering area of the
mast and blades can be considered a good approximation of
the difference in dB between the maximum RCS from the
mast and the maximum RCS from the blades. Taking this
into account, the maximum RCS from the blades (dBsm) can
be obtained as
σblades =max{σmast}−1= 10log10
(2π
λrL2
)(10)
− 10log10
(4H(r1+ r2)
w · l
).
A comparison of the maximum RCS of the blades from PO
simulations and the maximum RCS values calculated accord-
ing to Eq. (10) is shown in Table 4. As shown in the table, the
difference between the values provided by the simulations
and the values calculated according to the proposed model
are lower than 2 dB for all the analyzed cases.
5.3 Converting RCS values to WTC reflectivity values
In order to model wind turbine clutter, the RCS of a wind
turbine must be converted to the equivalent radar reflectivity
factor.
The weather radar equation, for distributed targets such as
rain, is given by
Pr =PtG
2θ0φ0cτπ3|K|2z
1024ln(2)λ2R2, (11)
where Pr is the power received back by radar, Pt is the power
transmitted by radar, θ0 and φ0 are the elevation and az-
imuth beamwidths, c is the speed of light, τ is the radar
pulse length, |K|2 is the complex index of refraction of the
hydrometeor, λ is the wavelength of the radar pulse, R is
the distance to the target and z is the radar reflectivity factor
(ITU-R, 2009; Rinehart, 1997; Norin and Haase, 2012). The
radar reflectivity factor z, normally expressed in decibels of
reflectivity (dBZ), is the quantity that is used to obtain the
rain rate:
z=Pr1024ln(2)λ2R2
PtG2θ0φ0cτπ3|K|2. (12)
The radar equation for a point target, such as distant wind
turbine contained within a range resolution cell, is given by
Pr =PtG
2λ2σ
64π3R4, (13)
where σ is the RCS of the wind turbine (Knott, 2006).
Assuming that the wind turbine is entirely included within
the beam cell resolution of the weather radar, we can com-
pare Eqs. (11) and (13) and then obtain the radar reflectivity
factor as
z= C1
σ
R2, (14)
where C1 is a constant that depends on the parameters of the
radar system:
C1 =16ln(2)
π6c·λ4
θ0φ0τ·
1
|K|2. (15)
Atmos. Meas. Tech., 8, 2183–2193, 2015 www.atmos-meas-tech.net/8/2183/2015/

I. Angulo et al.: Reflectivity values from wind turbines for weather radar services 2191
Table 4. Comparison of the maximum RCS of the blades from PO simulations and the maximum RCS values calculated according to the
proposed model. The third column shows the difference in dB between the values obtained in the simulations and the values calculated
according to the proposed model.
WT model 1 WT model 2 WT model 3
Simulation Model Difference Simulation Model Difference Simulation Model Difference
(dBsm) (dBsm) (dB) (dBsm) (dBsm) (dB) (dBsm) (dBsm) (dB)
2.80 GHz 45.92 46.08 0.16 46.81 48.72 1.91 48.81 50.62 1.82
5.65 GHz 49.42 50.05 0.63 49.74 51.67 1.93 52.10 53.65 1.55
9.4 GHz 51.61 52.52 0.91 52.00 53.80 1.79 54.22 55.77 1.55
5.4 Complete model for estimating WTC reflectivity in
weather radar bands
Results obtained in the previous subsections are the basis of
the complete model to characterize the signal scattering from
wind turbines in the weather radar bands proposed in this
paper. The proposed simplified model for estimating WTC
reflectivity in weather radar bands is summarized in Table 5.
First, based on the specific characteristics of the wind tur-
bine and the working frequency, the RCS pattern of the mast
near the direction normal to the slant surface is obtained. The
RCS from the mast is used to determine the main lobe of the
RCS pattern of the whole wind turbine.
Then, the maximum RCS value from the blades is calcu-
lated, as the maximum RCS value of the mast minus the re-
lation in dB between the relative scattering areas of the mast
and blades. This maximum RCS value from the blades es-
tablishes an upper bound, in such a way that all the possible
orientations of the nacelle and blades are considered.
In order to combine both patterns and obtain the simpli-
fied RCS pattern of the whole wind turbine, the RCS values
from the mast are used for angles θ near the incidence normal
to the slanted surface of the mast, i.e., for θvalues such that
σmast ≥ σblades. This way, the main lobe of the RCS pattern of
the whole wind turbine is estimated. For incidence angles off
the main lobe due to the mast, and up to the limiting angles θ
due to the illumination characteristics of weather radars, the
maximum RCS value from the blades is applied.
An example of the results of this proposed RCS model is
shown in Fig. 9, together with the simulated results of the
RCS pattern for different rotor orientations. In the figure, it
can be seen that the maximum RCS of the mast is well ap-
proximated by the model, and the mask established off the
main lobe covers the scattering from the blades for different
rotor orientations.
Once the RCS pattern is completed for a specific illumina-
tion condition and configuration of the radar, the estimation
of the RCS of the wind turbine is obtained.
Finally, assuming that the whole wind turbine is included
within the beam cell resolution of the radar, the correspond-
ing reflectivity value is calculated as described in Table 5.
6 Conclusions
In order to estimate the potential impact of a wind farm on a
weather radar service, one of the main issues to be analyzed
is wind turbine clutter reflectivity, which is directly related to
the radar cross section of wind turbines.
A preliminary study about possible interference problems
is the most appropriate way to proceed in order to make the
coexistence of wind energy and meteorological services pos-
sible. To do so, an estimation of the RCS of the wind tur-
bines to be installed is a must. Although it is possible to ob-
tain RCS values by conventional methods such as MoM and
FDTD, they require detailed representations of the wind tur-
bines’ design and complex calculations, which are too time
consuming and difficult to obtain. On the contrary, typical
values that do not take into account the particular features of
the case under analysis may lead to significant errors in the
impact analysis.
In this paper, the RCS patterns of wind turbines for
the weather radar working frequencies have been analyzed.
From the obtained results, it can be concluded that the mast is
the main scatterer of the wind turbine, featuring a very direc-
tive lobe in the direction perpendicular to the slanted surface
of the mast. The blades, by contrast, contribute to the total
RCS of the wind turbine with secondary lobes that depend
on the rotor orientation with respect to the illumination di-
rection and the blades’ position.
Based on the above-mentioned conclusions, a simple RCS
model to characterize backscattering from wind turbines in
the weather radar bands has been proposed. This model takes
the RCS from the mast as a reference to estimate the maxi-
mum value of the RCS pattern of the whole wind turbine
and then calculates the maximum RCS from the blades tak-
ing into account the actual dimensions of the wind turbine
model. Finally, and assuming that the whole wind turbine
is included within the beam cell resolution of the radar, the
WTC reflectivity can be directly obtained.
The proposed RCS model can be used to estimate the max-
imum clutter due to the presence of a wind turbine, estimat-
ing the scattered power from the mast. However, even if the
Doppler radar under study uses a clutter filter that suppresses
stationary objects, the rotating blades of a wind turbine might
www.atmos-meas-tech.net/8/2183/2015/ Atmos. Meas. Tech., 8, 2183–2193, 2015

2192 I. Angulo et al.: Reflectivity values from wind turbines for weather radar services
Table 5. Simplified model for estimating WTC reflectivity in weather radar bands.
Model for calculating wind turbine clutter reflectivity
1. Wind turbine RCS
σmast = 10log10
2πλ rL
2 sin(θ +α)
(sin(
2πλLcos(θ+α)
)2πλLcos(θ+α)
)2 (dBsm) for θ |σmast≥σblades
σblades = 10log10
(2πλ rL
2)− 10log10
(4H(r1+r2)
w·l
)(dBsm) for θ |σmast<σblades
Where: α = arctan(r2−r1H
)and L= H
cosα
2. Wind turbine clutter reflectivity
z=16ln(2)
π6c·
λ4
θ0φ0τ·
σ|K|2R2 , where σ is the RCS in linear values (m2)
still be detected. As proved in Norin (2015), weather infor-
mation from radar cells affected by a wind turbine is not al-
ways lost. In fact, when precipitation gives rise to reflectivity
values stronger than those due to wind turbines, radar data
could still be used. Therefore, the reflectivity model proposed
in this paper is of interest not only to assess a potential detri-
mental impact on the performance of a weather radar but also
to evaluate to which extent this degradation might exist if re-
flectivity values from precipitation and wind turbine blades
are compared.
This simple WTC reflectivity model aims at being imple-
mented in software planning tools and is expected to make
the preliminary impact studies of wind farms on weather
radar services easier.
Acknowledgements. A special note of thanks to José Miguel
Gutiérrez (AEMet, Spanish Weather Agency) and Lars Norin
(SMHI, Swedish Weather Agency), who provided insight and ex-
pertise from the perspective of a weather operator.
This work has been partially supported by the Spanish Ministry
of Economy and Competitiveness (Ministerio de Economía y
Competitividad, project TEC2012-32370) and the University of the
Basque Country (Euskal Herriko Unibertsitatea, program for the
specialization of the postdoctoral researcher staff).
Edited by: G. Vulpiani
References
Angulo, I., de La Vega, D., Rodríguez, O., Grande, O., Guerra, D.,
and Angueira, P.: Analysis of the Mast Contribution to the Scat-
tering Pattern of Wind Turbines in the UHF Band, 5th European
Conference on Antennas and Propagation (EuCAP), 2011.
Angulo, I., Montalban, J., Canizo, J., Wu, Y., de la Vega, D.,
Guerra, D., Angueira, P., and Arrinda, A.: A measurement-based
multipath channel model for signal propagation in presence of
wind farms in the UHF band, IEEE T. Commun., 61, 4788–4798,
2013.
Angulo, I., de la Vega, D., Cascón, I., Cañizo, J., Wu, Y., Guerra, D.,
and Angueira, P.: Impact analysis of wind farms on telecommu-
nication services. Renewable and Sustainable Energy Reviews,
Volume 32, April 2014, Pages 84-99, ISSN 1364-0321, 2014.
Belmonte, A. and Fabregas, X.: Analysis of Wind Turbines Block-
age on Doppler Weather Radar Beams, IEEE Antennas and Wire-
less Propagation Letters, 9, 670–673, 2010.
Gallardo-Hernando, B., Muñoz-Ferreras, J. M., Pérez-Martínez, F.,
and Aguado-Encabo, F.: Wind Turbine Clutter Observations and
Theoretical Validation for Meteorological Radar Applications,
Radar, Sonar & Navigation, IET, 5, 111–117, Feb. 2011.
Gipe, P.: Wind Power: Renewable Energy for Home, Farm, and
Business, 2nd edition, Chelsea Green Publishing, April 1, 2004.
Grande, O., Cañizo, J., Angulo, I., Jenn, D., Danoon, L. R.,
Guerra, D., and de la Vega, D.: Simplified formulae for the es-
timation of offshore wind turbines clutter on marine radars, The
Scientific World Journal, 982508, doi:10.1155/2014/982508,
2014.
Grande, O., Angulo, I., Jenn, D., Aguado, F., Guerra, D., and de
la Vega, D.: Analysis of Wind Turbines Radar Cross Section for
Analyzing the Potential Impact on Weather Radars, 2015 9th Eu-
ropean Conference on Antennas and Propagation (EUCAP), 12–
17 April 2015.
IEEE Std 211-1997: IEEE Standard Definitions of Terms For Radio
Wave Propagation, 1997.
Isom, B. M., Palmer, R. D., Secrest, G. S., Rhoton, R. D., Saxion,
D., Allmon, T. L. , Reed, J., Crum, T., Vogt, R., Detailed Obser-
vations of Wind Turbine Clutter with Scanning Weather Radars,
J. Atmos. Ocean. Techn., 26, 894–910, 2008.
ITU-R (International Telecommunication Union): Technical and
Operational Aspects of Ground-Based Meteorological Radars,
Recommendation ITU-RM.1849; International Telecommunica-
tion Union, Geneva, Switzerland, 2009.
ITU-R and WMO (International Telecommunication Union and
World Meteorological Organization): Handbook, Use of Radio
Spectrum for Meteorology: Weather, Water and Climate Moni-
toring and Prediction, 2008.
Atmos. Meas. Tech., 8, 2183–2193, 2015 www.atmos-meas-tech.net/8/2183/2015/

I. Angulo et al.: Reflectivity values from wind turbines for weather radar services 2193
Jenn, D. C.: Radar and Laser Cross Section Engineering, 2nd Edn.,
Education Series, American Institute of Aeronautics and Astro-
nautics, USA, 2005.
Knott, E. F.: Radar Cross Section Measurements, SciTech Publish-
ing, 2006.
Lemmon, J. J, Carroll, J. E., Sanders, F. H., and Turner, D.: As-
sessment of the Effects of Wind Turbines on Air Traffic Control
radars, NTIA Technical Report TR-08-454, 2008.
Norin, L. and Haase, G.: Doppler Weather Radars and Wind
Turbines, Doppler Radar Observations – Weather Radar,
Wind Profiler, Ionospheric Radar, and Other Advanced Ap-
plications, edited by: Bech, J., InTech, doi:10.5772/39029,
available at: http://www.intechopen.com/books/doppler-radar-
observations-weather-radar-wind-profiler-ionospheric-radar-
and-other-advanced-applications/doppler-weather-radars-and-
wind-turbines (last access: 2 February 2015), 2012.
Norin, L.: A quantitative analysis of the impact of wind turbines on
operational Doppler weather radar data, Atmos. Meas. Tech., 8,
593–609, doi:10.5194/amt-8-593-2015, 2015.
Rinehart, R. E.: RADAR for Meteorologists, 3rd edn., Rinehart Pub,
1997.
Siegel, K. M., Alperin, H. A., Bonkowski, R. R., Crispin, J. W.,
Maffett, A. L., Schensted, C. E., and Schensted, I. V.: Bistatic
radar cross sections of surfaces of revolution, J. Appl. Phys., 26,
297 pp., 1955.
Skolnik, M.: Radar Handbook, 3rd Edn., Mc-Graw-Hill, New York,
2008.
Spera, D. A. and Sengupta, D. L.: Equations for Estimating the
Strength of TV Signals Scattered by Wind Turbines, NASA Con-
tractor Report 194468, May 1994.
Tristant, P.: Impact of Wind Turbines on Weather Radars Band,
World Meteorological Organization, CBS/SG-RFC 2006/Doc.
3.1, 2006.
Van Lil, E., Trappeniers, D., De Bleser, J., and Van de Capelle, A.:
Computations of radar returns of wind turbines, in: Proceed-
ings of the 3rd European Conference on Antennas and Propa-
gation (EUCAP), Berlin, Germany, 23–27 March 2009, 3852–
3856, 2009.
Van Lil, E., Trappeniers, D., De Bleser, J., and Van de Capelle, A.:
Computation of false echo zones and shadowing for aeronautical
and weather radars, in: Proceedings of the 4th European Confer-
ence on Antennas and Propagation (EUCAP), Barcelona, Spain,
12 April 2010, 1–5, 2010.
Vogt, R. J., Crum, T. D., Greenwood, W., Ciardi, E. J., and Guen-
ther, R. G.: Recent Efforts to Improve Estimates of and Mit-
igation of Wind Turbine Clutter Impacts on the WSR-88D,
Preprints, 27th Int. Conf. on Interactive Information Processing
Systems (IIPS) for Meteorology, Oceanography, and Hydrology,
Seattle, WA, Amer. Meteor. Soc., Paper 3A.1, 2011.
WMO (World Meteorological Organization): Impact of Wind Tur-
bines on Weather Radars Band, CBS/SG-RFC 2006/Doc. 3.1(6),
2005.
WMO (World Meteorological Organization): Commission for In-
struments and Methods of Observation – Fifteenth Session,
WMO-No. 1064, Helsinki, 2–8 September, 2010.
WMO Radar Database: WMO Radar Database, available at: http:
//wrd.mgm.gov.tr/ (last access: 15 December 2014), 2014.
www.atmos-meas-tech.net/8/2183/2015/ Atmos. Meas. Tech., 8, 2183–2193, 2015