estimating emissions of 20 vocs. i: surface aeration · estimating emissions of 20 vocs. i: surface...
TRANSCRIPT

ESTIMATING EMISSIONS OF 20 VOCs.I: SURFACE AERATION
By Chu-Chin Hsieh,1 Kyoung S. RO,2and Michael K. Stenstrom,3 Member, ASCE
ABSTRACT: The emission rates of semivolatile organic compounds during surfaceaeration can be estimated from the oxygen mass-transfer coefficient KLao, and amodified coefficient \)1M, which incorporates the fraction of liquid-phase mass-transferresistance to total resistance. In order to verify this method, the mass-transfer coefficientsfor oxygen and 20 volatile organic compounds (VOCs) were simultaneously measuredin a laboratory-scale surface-aerated reactor. Using these measurements, the ratios ofgas-phase and liquid-phase mass-transfer coefficients were determined by nonlinearregression. These ratios then were used to estimate the fraction of liquid-phase resistanceto total resistance. The method was validated by excellent agreement between observationand theory. The correlation between the ratios of gas· and liquid.phase transfer coeffi·cients and specific power input was also studied.
INTRODUCTION
The 1990 Clean Air Act Amendments identified volatile organic compounds (VOC) emissions from publicly owned treatment works (POTWs)as a major source category. Indirect estimation of VOC emissions from theaeration basin using oxygen as a surrogate is a valuable and cost-effectiveapproach for engineering applications. Based upon the proportionality ofmass-transfer coefficients, previous researchers (Smith et al. 1980; MatterMueller et al. 1981; Roberts et al. 1983, 1984) have defined the ratio ofmass-transfer coefficients for a VOC to oxygen as '1'. This ratio, along withthe oxygen-transfer coefficient KLaoz, is now widely used to estimate VOCemissions from quiescent and aerated water surfaces. The approach is popular because of its ease of use and the availability of oxygen-transfer information.
The development of the 'I' concept is based upon the two-resistance masstransfer model and the assumption that gas-phase resistance is negligible.Neglecting gas-phase resistance restricts the concept's use to highly volatilecompounds such as oxygen, carbon tetrachloride, and l,1,l-trichloroethane.The concept, if applied to semivolatile compounds, overestimates the masstransfer rate because gas-phase resistance is no longer negligible. The objectof this research project was to develop an improved method that includesthe impact of gas-phase resistance and can be used to estimate transfer ratesof compounds with a wide range of volatilities or Henry's coefficients. Thisis the first paper in a three-part series, and reports the theoretical development of 'I'M and results for surface-aeration systems. (Subsequent papers
ISl. Engl., Montgomery Watson, Inc., P.O. Box 7009, Pasadena, CA 91109-7009.2Asst. Prof., Civ. Engrg. Dept., Louisiana State Vniv., Baton Rouge, LA 70803
6405.3Prof., Civ. Engrg. Dept., 4173 Engrg. I, Vniv. of California, Los Angeles, CA
90024-1600.Note. Discussion open until May 1, 1994. Separate discussions should be submitted
for the individual papers in this symposium. To extend the closing date one month,a written request must be filed with the ASCE Manager of Journals. The manuscriptfor this paper was submitted for review and possible publication on May 15, 1992.This paper is part of the Journal of Environmental Engineering, Vol. 119, No.6,November/December, 1993. ©ASCE, ISSN 0733-9372/93/0006-1077/$1.00 + $.15per page. Paper No. 4059.
1077

will report on diffused aeration, turbine aeration, the impact of surfactants,and scale-up.)
BACKGROUND
Henry's CoefficientHenry's law describes the equilibrium between air and water phases at
dilute concentration, as follows:
Ci]He = C
L
••..•.•.••..••••••.••••....••.•.•....•.•••.•....... (1)
where He = dimensionless Henry's coefficient; CJ = gas-phase concentration in equilibrium with the liquid-phase concentration, CL (expressedin same units). Henry's coefficients can also be estimated from the puresolute vapor pressure and its solubility, as follows:
PMH = S (2)
where H = Henry's coefficient [(atm m3/mol)]; P == vapor pressure of thepure solute (atm); M = gram molecular weight of the solute (g/mol); andS = solubility of the solute in water (g/m3).
The larger the Henry's coefficient, the greater the equilibrium concentration of solute in air and the more easily it is stripped during aeration. Itis difficult to experimentally determine Henry's coefficients, and there arelarge differences between published values by various investigators. Mackayand Shiu (1981) reviewed Henry's coefficients for environmentally relevantchemicals and found that considerable discrepancies exist in the literature,even for common chemicals. The coefficients used in this study were determined experimentally, and are listed in Table 1. Several vary from published values.
Relationship of Mass-Transfer Coefficient to DiffusivityThe major resistance to mass transfer at the gas-liquid interface is the
diffusional resistance in each phase. Various models have been proposedto describe mass transfer to the phase boundary. The best known modelsare based on Fick's law, and predict that the mass-transfer coefficient k isproportional to some power of the molecular diffusivity, D
k rx Dn (3)
where k = mass-transfer coefficient; D = molecular-diffusion coefficient;and n = 1.0 for the two-film theory (Lewis and Whitman 1924); and 0.5for the penetration theory (Higbie 1935) and surface-renewal theory(Danckwerts 1951).
Postulating that the film and surface-renewal equations are limiting casesof a more-general equation, Dobbins (1956) proposed a combined filmsurface renewal theory, with n varying from 0.5 to 1.0 depending on theturbulence in the system. Under sufficiently turbulent conditions, n approaches 0.5 (surface renewal or penetration theory); under laminar, or lessturbulent, conditions n approaches 1.0 (film theory).
The resistance to mass transfer across an interface is the sum of theresistances in each phase. This concept was proposed by Lewis and Whitmanin 1924 as the two-film theory; as Treybal (1968) pointed out, their two-
1078

o-..J<.0
TABLE 1. Properties of 20 VOCs Studied (at 760 mmHg; 20·C)
Molecularweight D L x 106 Dc X 102 Retention time
Compound Formula Abbreviation (g/mole) He (cm2 /s) (cm2 /s) (min)(1 ) (2) (3) (4) (5) (6) (7) (8)
Oxygen O2 O2 32.0 30.2 2.11 21.32 -Benzene C6H6 BZ 78.1 0.230 0.96 8.95 6.2Bromobenzene C6HsBr BBZ 157.0 0.100 0.83 7.28 17.7Bromoform CHBr3 BF 252.8 0.041 0.93 7.65 16.4Carbon tetrachloride CCl4 CT 153.8 1.316 0.92 8.16 5.8Chlorobenzene C6Hs-CI CBZ 112.6 0.150 0.86 7.75 14.1Chloroform CHCl3 CLF 119.4 0.160 1.01 8.93 5.21,2-Dichlorobenzene C6H4Clz 12DCB 147.0 0.087 0.78 6.91 21.81,3-Dichlorobenzene C6H4 Clz 13DCB 147.0 0.120 0.78 6.94 20.5l,4-Dichlorobenzene C6H4Clz 14DCB 147.0 0.110 0.76 6.83 20.81,2-Dichloroethene (cis) CHCI=CHCI 12DCE 96.9 0.170 1.05 9.45 21.8Ethylbenzene C6Hs-CHzCH3 EBZ 106.2 0.260 0.76 7.15 14.6Ethylenebromide CH2BrCHzBr EDB 187.9 0.041 0.97 8.11 12.8Naphthalene ClQHg NAPH 128.2 0.038 0.72 6.48 27.3Perchlorothylene CC!:,--CClz PCE 165.8 0.570 0.89 7.77 11.91,1,1-Trichloroethane CCl3CH3 11lTCA 133.4 0.530 0.90 8.18 5.51,1,2,2-Tetrachloroethane CHCl2CHClz 1122TCA 167.9 0.042 0.82 7.21 18Toluene C6Hs-CH3 TLN 92.1 0.230 0.84 7.92 10.6Trichloroethylene CCI2=CHCl TCE 131.4 0.250 0.96 8.48 7.61,2-Xylene (0) C6H4-(CH3)2 OXY 106.2 0.180 0.77 7.16 15.91,3-Xylene (m) C6H4-(CH3h MXY 106.2 0.240 0.76 7.12 14.9

film theory does not depend on the validity of the film theory. Therefore,the "two-resistance" theory would be a more-appropriate name. In thispaper we use the term two-resistance model instead of the two-film theoryto denote that n can be different from 1.0. A common convention used hereand in engineering applications is to combine the mass-transfer coefficientsand the interfacial area into a single parameter KLa.
'I'M Concept DevelopmentUnder the assumption of dominant liquid-phase resistance to mass trans
fer, the proportionality of liquid-phase mass-transfer coefficients betweena VOC and oxygen is denoted as 'I'
'I' = KLayoc = kLayoC = (DLYOC)n (4)KLao z k La02 D L02
where 'I' = ratio of the mass-transfer coefficients of the VOC to oxygen(dimensionless); kLayoO kLa02 = liquid-phase mass-transfer coefficients ofthe VOC and oxygen (lit); D LyOO D L02 = liquid diffusivities for the VOCand oxygen (L 2It); and KLa yOC' KLa02 = overall mass-transfer coefficientsfor the VOC and oxygen (lit).
The general mathematical expression for the two-resistance model is asfollows:
1 1 1KLayo
C= kLayoc + IlckGayoc (5)
where kGayoc, kLayoC = gas- and liquid-phase mass-transfer coefficientsof the VOC (lit). The fraction of liquid-film resistance (R L ) to total resistance (R T ) can be expressed as follows:
1 1...................... (6)
where RL , R T = liquid- and gas-phase resistances, respectively (dimensionless). Rearranging (5) and multiplying both sides by lI(kLaYod gives
1....................................... (7)
The proportionality of overall VOC and oxygen mass-transfer coefficientscan be expressed as 'I'M
KLayoc'I'M = (8)
KLao z
In the case of oxygen, a highly volatile compound (Ilc = 30.2 at 20°C),we see that 99% of the resistance is in the liquid phase for kGalkLa > 3[from (6)], therefore, kLaoz = KLao" and
1080
KLayoc'PM = k (9)
L a0 2
Multiplying the numerator and denominator of (9) by kLayOC gives
kLayoc KLayoc'PM = k
La0
2kLayoc (10)
Substituting (4) and (7) into (10) results in
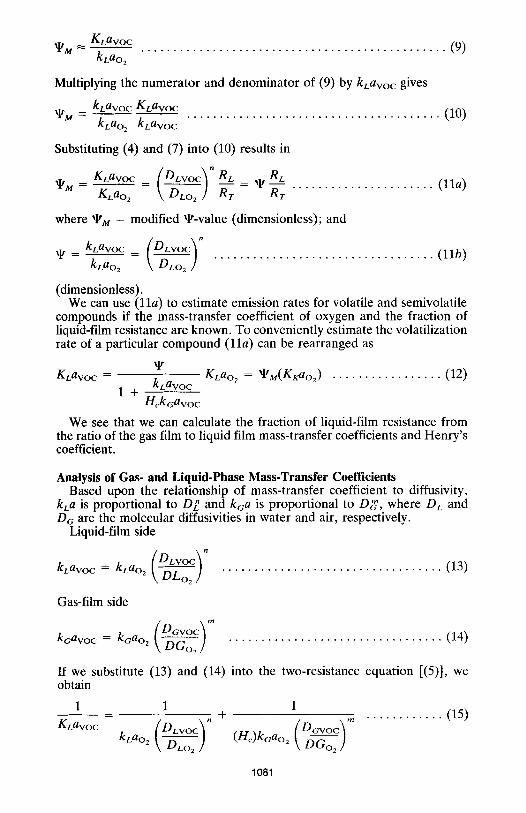
'PM = i ayoc = (DLYOC)n RL = 'P RL (lla)La02 DL02 R T R T
where 'PM = modified 'P-value (dimensionless); and
'P = kkLayOC = (DLYOC)n (llb)La02 DL02
(dimensionless) .We can use (lla) to estimate emission rates for volatile and semivolatile
compounds if the mass-transfer coefficient of oxygen and the fraction ofliquid-film resistance are known. To conveniently estimate the volatilizationrate of a particular compound (lla) can be rearranged as
'PKLayOC = k KLa02 = 'PM(KJJZo z) •••.•.•••.•.••••• (12)
1 + LayOCHckGayoc
We see that we can calculate the fraction of liquid-film resistance fromthe ratio of the gas film to liquid film mass-transfer coefficients and Henry'scoefficient.
Analysis of Gas- and Liquid-Phase Mass-Transfer CoefficientsBased upon the relationship of mass-transfer coefficient to diffusivity,
kLa is proportional to DE and kGa is proportional to D(J, where DL andDG are the molecular diffusivities in water and air, respectively.
Liquid-film side
kLayoC = k La02 (~LZ:~r (13)
Gas-film side
................................. (14)
If we substitute (13) and (14) into the two-resistance equation [(5)), weobtain
1
1081
............ (15)
The validity of (15) was confirmed by Goodgame and Sherwood (1954),who measured mass-transfer coefficients for vaporization of water into air,and the absorption of carbon dioxide, ammonia, and acetone from air intowater. They assumed both exponents m and n to be equal to 0.5, and foundthat the observed and calculated values of KLa agreed well. Their datasupport the concept of adding individual phase resistances, and suggest thatoverall coefficients may be reliably calculated from the individual coefficients. Munz and Roberts (1984) used this approach.
Best-Fit ParametersTo use nonlinear regression to estimate parameters from experimental
results, (15) was rearranged as follows:
X = AY" + WBZm (16)
where X = (KLaVOC>-l; Y = (DLvocIDLO,)-l; Z = (DGvocIDGo,)-l;W = lIHe;A = lI(kLaoz ); B = lI(kGao ,); n = exponent of liquid diffusivity;m = exponent of gas diffusivity; and AlB = (kGao,)/(kLao,).
Eq. (16) has four knowns (X, Y, Z, and W) and four unknowns (A, B,m, and n). The exponents m and n were assumed to be equal and arereferred to as mn. The reason for this assumption was discussed by Munzand Roberts (1984). Applying this assumption leaves three parametersA, B, and mn-which need to be estimated by regression.
The nonlinear regression (NUN) procedure with a statistical analysissystem (SAS 1982) was used to determine A, B, and mn using the leastsquares fit. After a grid of values was specified, NUN evaluates the residualsum of squares at each combination of values to determine the best set ofvalues to start the iterative algorithm. The algorithm uses the residuals ofthe partial derivatives with respect to the parameters to estimate new parameter values in an iterative fashion until no further reduction in the sumof squares is possible. The procedure was initially tested using data fromRoberts and Dandliker (1983). The additional degrees of freedom (20 compounds used in this study compared to six compounds used by Roberts andDandliker) provided greater confidence and precision in the parameter estimates.
EXPERIMENTAL METHODS
Table 1 shows the properties of the organic compounds chosen for thisstudy. The 20 organic compounds span a wide range of volatility with liquidand gas-phase controlled conditions. The value of Henry's coefficient (He)is the single most important factor for determining the transfer rate, andreported values for VOCs can differ by more than 50% (Baillod et al. 1990).Therefore, values of He were chosen on the basis of either agreement amongvarious sources (Mackay and Shiu 1981; Verschueren 1977) or the best fitfrom our results, when our results fell within the range of literature estimates. In addition, Henry's law coefficients for selected compounds wereconfirmed experimentally (Hsieh 1991) using EPICS (equilibrium partitioning in closed systems) procedure (Gossett 1987).
Methanol was present in the systems, since it was used as a solvent inpreparation of the stock mixtures that were introduced into the reactor. Theuse of solute mixtures and the presence of methanol may change Henry'scoefficients and oxygen-transfer coefficient. Munz and Roberts (1986, 1987)found no effects of organic mixtures on the Henry's coefficients for PCE,
1082
TCE, 1,1,1-TCA, chloroform, and dichloromethane in an aqueous mixtureof the five compounds with a total mixture concentrations of up to 375 mg/L. Gossett (1987) verified that measurements of Henry's coefficients indilute, aqueous mixtures of solutes agree well with values obtained for singlesolutes. In this study, the maximum total organic mixture concentration wasbetween 20 and 40 mg/L, which is below the experimental conditions usedby Munz and Roberts (1986). The cosolvent concentration of methanol inwater (0.26 giL) used in this study was also far below the effective concentration reported by Munz and Roberts (1987). They demonstrated that inexcess of 10 gIL of cosolvent is required to reduce the solute's Henry'scoefficient. They also determined that the cosolvent and VOCs mixture didnot change the oxygen transfer coefficient.
All volatile compounds were obtained from Aldrich Chemical Co. (St.Louis, Mo.) and Fisher Scientific Co. (Pittsburgh, Pa.). Methanol was highperformance liquid-chromatography grade from Fisher Scientific Co. Freshtap water with a conductivity between 450 and 500 S/cm was used for allgas-transfer experiments. The addition of sodium sulfite used in determiningthe oxygen-transfer coefficients increased the conductivity to about 650 to700 S/cm (equivalent to 0.005 N KCl). Conductivity measurements weremade with a YSI glass probe, model 3403, with a cell constant of 1.0 cm- I .
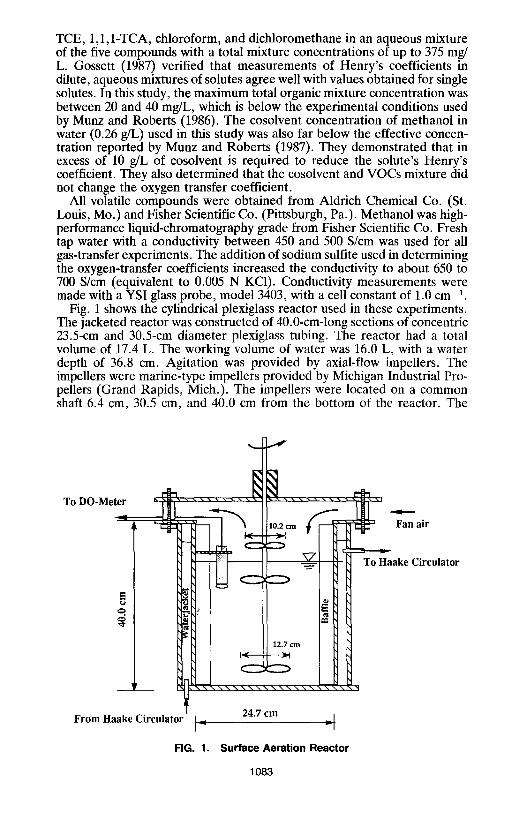
Fig. 1 shows the cylindrical plexiglass reactor used in these experiments.The jacketed reactor was constructed of 40.0-cm-Iong sections of concentric23.5-cm and 30.5-cm diameter plexiglass tubing. The reactor had a totalvolume of 17.4 L. The working volume of water was 16.0 L, with a waterdepth of 36.8 cm. Agitation was provided by axial-flow impellers. Theimpellers were marine-type impellers provided by Michigan Industrial Propellers (Grand Rapids, Mich.). The impellers were located on a commonshaft 6.4 cm, 30.5 cm, and 40.0 cm from the bottom of the reactor. The
ake Circulator
Fan air
"-~
I'" ~ ~ ...ter
I rrl=J ~-~~
110.2 em
- "\7 ToHa-
~ '"'e ~ ..OJ
C! ~ :' ecoQ
~ =<"""
~12.7 em
-~
To DO-Me
24.7 emFrom Haake Circulator 1.......1-----------<..--11
FIG. 1. Surface Aeration Reactor
1083

upper impeller, located 3.8 cm above the water surface with a diameter of10.2 cm and a width of 2.5 cm, served as a gas agitator to maintain completemixing in the head space. The impellers mounted below the water surfacehad a diameter of 12.7 cm and a width of 3.8 cm. The middle and bottomimpellers, located 7.6 and 31.7 cm below the water surface, provided liquidmixing. The reactor's cover contained a bearing to support the shaft tomaintain precise impeller positions throughout the tests. The reactor hadfour 2.2-cm stainless-steel baffles (9.0% of the tank diameter) arranged at90° around the circumference.
A 40.6-cm-diameter fan (Dayton, model 4C508D) was used to provideair flow across the reactor's head space. The air velocity above the watersurface ranged between 1.8 and 2.4 m/s. A Haake KT 33 circulating waterbath circulated water through the water jacket at a rate of up to 77.5 Libto maintain the temperature in the reactor to within ± 0.3°C of the set point(20°C). The impeller rotational speed was monitored by a General RadioCompany stroboscope, type 1531-A. The Reynolds number (R), the ratioof inertia force in the impeller to viscous forces in the fluid, was used torepresent the degree of turbulence in an impeller-stirred tank as follows:
R = Da2
Np (17)f.L
where N = rotational speed (RPM); Da = impeller diameter (m or ft);p = fluid density (kg/m3 or lb/cu ft); and f.L = viscosity [Pa·s or lb/(ft-s)].
Each experiment was begun by adjusting the impeller speed to the desiredvalue using the stroboscope. After the water had been equilibrated to aconstant temperature of 20°C, dissolved oxygen (DO) was removed usingsodium sulfite with a cobalt chloride catalyst. The cobalt chloride dose wasless than 0.5 mg/L. Theoretically, 7.9 mg/L of sodium sulfite is required foreach milligram per liter of DO present. Since it is common practice to add1.5-2.0 times of this amount to ensure complete deoxygenation, approximately 14 mg/L per mg of DO was added.
After the DO concentration was reduced to almost zero, approximately5 mL of the VOCs dissolved in methanol was introduced with a pipette,providing approximately 1.0-2.0 mg/L initial concentrations of each VOC.After 1 min of mixing the first sample was collected and a total of 15-20samples were taken. The sampling intervals were shorter at the beginningof a test due to the larger driving force. Samples were taken from the reactorwith a 25-mL pipette and then transferred into two 9-mL hypovials andsealed with Teflon-faced rubber septa. The vials were chilled to 4°C on theday of collection and maintained at that temperature until analyzed. Sampleswere allowed to warm to ambient temperature before analysis. Analysiswas usually completed within one day after sampling.
The oxygen concentration in the reactor was measured continuously witha DO probe (Yellow Springs Instruments, Model 58) and a standard membrane (1.0 mil) and plotted on a strip chart recorder. At the end of eachtest, three water samples were taken and analyzed for DO by the Winklermethod (Standard 1985). The ASCE (1984) procedure was used to estimateoxygen-transfer coefficients.
Organic Analysis TechniquesThe VOCs were analyzed by capillary gas chromatography using a purge
and-trap device and a flame-ionization detector (FlO). The FlO was chosenover an electron-capture detector (ECO) for its wider dynamic range. The
1084

purge-and-trap device was a Tekmar model 00-996367-00 set with the following program: 11 min purge, 4 min desorb, and 12 min bake time. Thepurge-and-trap device was attached to a Hewlett-Packard model 5890 Gc.Before initial use, the trap was conditioned overnight at 180°C by backflushing with an inert gas (He) flow of at least 20 mLimin. During purging,the trap was vented to the room, and not to the analytical column. Priorto beginning analysis each day, the trap was backflushed for 10 min at 180°C.
The capillary column was a J&W Scientific (Folsom, Calif.) DB-624 witha 1.8 fLm film thickness and the dimensions of 30 m by 0.32 mm diameter.The gas chromatograph (GC) time and temperature program was as follows:35°C initial temperature, 150°C final temperature, 5 min initial hold, 1 minfinal hold time, and a 5°C/min temperature program. The GC and purgeand-trap gas-flow rates were controlled as follows: helium carrier gas at 20.0mLimin, hydrogen combustion gas at 47.2 mLimin, and dry-air purge gasat 314.8 mLimin. A Hewlett-Packard model 3396A integrator used to recordGC output had the following settings: attenuation of 4, chart speed of 0.5em/min, peak width of 0.04, area rejection of 3,000, and threshold of -1.These conditions separated all 20 peaks to allow easy identification. Theretention times of all compounds are shown in Table 1. Naphthalene carryover in the purge and trap was initially a problem but was reduced to 3%by heating the purge sampler at 150°C for 15 min, followed by flushing withair for 10 min between each analysis.
Liquid and Gas DitTusivitiesDiffusivity was estimated as opposed to using measured literature values
as suggested by Smith et al. (1980). Table 1 shows the estimated values.Liquid diffusivities were calculated with the modified Wilke-Chang estimation method [Reid et al. (1987), page 598, (11-9.1)] with parameter<I> = 2.26 for water. The solute molar volume at the normal boiling point,VA' was estimated with the Tyn and Calus correlation (T&C) increments(Reid et al. 1987). The T&C increments were used because they providedmolar volumes for the compounds studied between the predictions of theLe Bas additive method and the predictions of the Schroeder incrementsmethod. The Wilke and Lee correction [Reid et al. (1987), page 587, (114.1)] was used to estimate gas diffusivities. The solute molar volume at thenormal boiling point (VA) estimated in the liquid diffusivities was used. TheLennard-Jones potential procedure [Reid et al. (1987), page 582] was usedto estimate (J"AS and 0d'
RESULTS AND COMMENT
The dependence of (P/V) on the impeller speed (N) is shown in Fig. 2.The correlation is given by
~ = 2.05 X 10⁻⁶ (NYU (18)
where P/V = specific power input (W/m3); and N = rotational speed (RPM).
This correlation agrees with the (19-4) in Perry's Chemical Engineer'sHandbook (Perry 1984) and Nagata (1975), indicating that the specific powerinput is proportional to the third power of the impeller speed. The powerinput ranged between 0.13 and 8.0 W, which is equivalent to a specificpower input ranging from 8 to 500 W/m3, which generally corresponds to
1085

500
~ .....o~
.~~
.~~
y............
1
100 150 200 250 300 350 400 450Rotational speed (RPM)
FIG. 2. Correlation between Power Input and Rotational Speed
~100
:;::,n;,!>~
10
1000
10 -r , ,
o
1000
0.1 -+---~-~~~~~+---~~~~---'-~---'---l
10 100PIV (wattlm3
)
FIG. 3. Oxygen-Transfer Coefficient versus Specific Power Input
the specific power inputs found in wastewater-treatment plants (Paulson1979; Libra 1991).
Fig. 3 shows the oxygen-transfer rate as a function of power input. TheKLa-value of oxygen increased from 0.23 to 7.2 (lIh) as the impeller speedwas increased from 150 to 500 RPM. Below a specific power input of 30W/m3, the turbulence was in the transition range. With very high powerinput (250 W/m3 < P/V < 500 W/m3), the aerator created a continuoussheet of spray and entrained air bubbles, which increased the rate of oxygentransfer dramatically. Eckenfelder et al. (1967) reported that 60% of oxygentransfer came from liquid spray and 40% from turbulence entrainment. Withhigh air-bubble entrainment, the mass-transfer model converts from puresurface aeration to a combination of bubble and surface aeration. Currently
1086

2.4 -0- Naphthalene- 1,1,2,HCA
---0- Bromoform2.0 - EOB- 1,2-0CB
1.6 - BromoBZ
;3 - 1,4-0CBbeE 1,3-0CB
1.2 ---c- BenzeneI::Q
M-Xylene'J:
'"b 0.8 D-XyleneI::OJ ChloroformvI::Q Toluene
U0.4 Cis1,2-0CE
---c- ChJoro-BZ- Ethyl·BZ- TCE60 120 180 240 300 360
PCE
Time (min) -0- CCL4
- I,I,I-TCA
FIG. 4. Example Plot: Stripping of 20 VOCs (Impeller Speed 275 RPM)
no relationship exists to quantitatively describe this phenomenon. Therefore, this high power-density region was excluded from further analysis. Forsurface aeration at an unbroken water surface, Kozinski and King (1966)predicted that the mass-transfer coefficient (KLa) should be proportional to(PIV)O.33. They summarized 12 studies and reported KLa = (P/V)n with, nfrom 0.2 to 0.4 at an unbroken air-water interface. Correlating the oxygentransfer results from this investigation for the completely turbulent region,30 W/m3 < (PIV) < 250 W/m3 , with an unbroken water surface and no airbubble entrainment, we found
(p)0.48
KLaoz = 0.17 V ....................................... (19)
The exponent found in this experiment, 0.48, is in approximate agreementwith the observation reported by Kozinski and King (1966).
Fig. 4 shows an example result of the concentrations of 20 VOCs versustime during a surface-aeration experiment. In surface aeration of open vessels, sufficient air volume is provided to avoid significant gas-phase saturation above the liquid surface, which allows us to assume CG = O. Therefore, the liquid-concentration change over time was used to estimate themass-transfer rate of each VOC as follows:
In (~:J = - KLa(t - to) (20)
Using (20), the slope of a semilog plot of CdCLo versus (t - to) gives usKLa. Using this technique, an estimate of the initial concentration is critical
1087
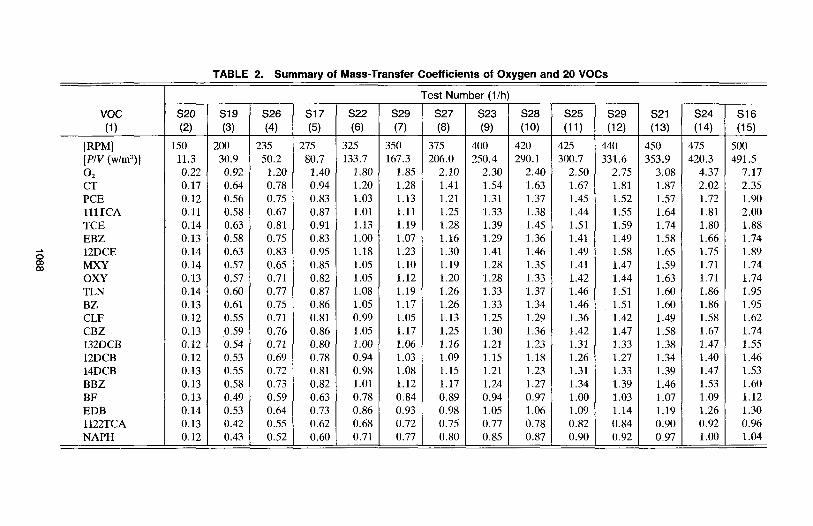
TABLE 2. Summary of Mass-Transfer Coefficients of Oxygen and 20 VOCs
Test Number (1/h)
VaG 820 819 826 817 822 829 827 823 828 825 829 821 824 816(1) (2) (3) (4) (5) (6) (7) (8) (9) (10) (11 ) (12) (13) (14) (15)
[RPM] 150 200 235 275 325 350 375 400 420 425 440 450 475 500[PIV (w/m3
)] 11.3 30.9 50.2 80.7 133.7 167.3 206.0 250.4 290.1 300.7 331.6 353.9 420.3 491.5O2 0.22 0.92 1.20 1.40 1.80 1.85 2.10 2.30 2.40 2.50 2.75 3.08 4.37 7.17CT 0.17 0.64 0.78 0.94 1.20 1.28 1.41 1.54 1.63 1.67 1.81 1.87 2.02 2.35PCE 0.12 0.56 0.75 0.83 1.03 1.13 1.21 1.31 1.37 1.45 1.52 1.57 1.72 1.90111TCA 0.11 0.58 0.67 0.87 1.01 1.11 1.25 1.33 1.38 1.44 1.55 1.64 1.81 2.00TCE 0.14 0.63 0.81 0.91 1.13 1.19 1.28 1.39 1.45 1.51 1.59 1.74 1.80 1.88EBZ 0.13 0.58 0.75 0.83 1.00 1.07 1.16 1.29 1.36 1.41 1.49 1.58 1.66 1.7412DCE 0.14 0.63 0.83 0.95 1.18 1.23 1.30 1.41 1.46 1.49 1.58 1.65 1.75 1.89MXY 0.14 0.57 0.65 0.85 1.05 1.10 1.19 1.28 1.35 1.41 1.47 1.59 1.71 1.74OXY 0.13 0.57 0.71 0.82 1.05 1.12 1.20 1.28 1.33 1.42 1.44 1.63 1.71 1.74TLN 0.14 0.60 0.77 0.87 1.08 1.19 1.26 1.33 1.37 1.46 1.51 1.60 1.86 1.95BZ 0.13 0.61 0.75 0.86 1.05 1.17 1.26 1.33 1.34 1.46 1.51 1.60 1.86 1.95CLF 0.12 0.55 0.71 0.81 0.99 1.05 1.13 1.25 1.29 1.36 1.42 1.49 1.58 1.62CBZ 0.13 0.59 0.76 0.86 1.05 1.17 1.25 1.30 1.36 1.42 1.47 1.58 1.67 1.74132DCB 0.12 0.54 0.71 0.80 1.00 1.06 1.16 1.21 1.23 1.31 1.33 1.38 1.47 1.5512DCB 0.12 0.53 0.69 0.78 0.94 1.03 1.09 1.15 1.18 1.26 1.27 1.34 1.40 1.4614DCB 0.13 0.55 0.72 0.81 0.98 1.08 1.15 1.21 1.23 1.31 1.33 1.39 1.47 1.53BBZ 0.13 0.58 0.73 0.82 1.01 1.12 1.17 1.24 1.27 1.34 1.39 1.46 1.53 1.60BF 0.13 0.49 0.59 0.63 0.78 0.84 0.89 0.94 0.97 1.00 1.03 1.07 1.09 1.12EDB 0.14 0.53 0.64 0.73 0.86 0.93 0.98 1.05 1.06 1.09 1.14 1.19 1.26 1.301122TCA 0.13 0.42 0.55 0.62 0.68 0.72 0.75 0.77 0.78 0.82 0.84 0.90 0.92 0.96NAPH 0.12 0.43 0.52 0.60 0.71 0.77 0.80 0.85 0.87 0.90 0.92 0.97 1.00 1.04

3
2
1
0.5
0.3
002(301)
~' • PCE (0.57)
~o TCE (0.25)
.... "'" :~ • 120CE (0.17)
..)Y *- 'E! lSI 12-XYLENE (0.18)..-::; ..J..4~~ --- f::,. Benzene (0.23)
,,,:;::nr -r ~
'r j.;:: ,'::<1"- ~ IE CBZ (0.15)
"'~ - ........Ee 12DCB (0.087).............-
r- ~........
• BBZ (0.10)~ + EDB (0.041)
>IE NAPH (0.038)
30 50 70 100 200 300
PI V(walt I m3)
FIG. 5. Dependence of Mass-Transfer Coefficient on Specific Power Input
TABLE 3. Ratios of Gas-Phase to Liquid-Phase Mass-Transfer Coefficient
Rotationalspeed PIV kca(RPM) (W/m3
) R kca/kLa (m/h)(1 ) (2) (3) (4) (5)
200 30.8 5.16E + 04 110.0 117.0235 50.2 6.08E + 04 101.6 121.9275 80.7 7.14E + 04 88.6 137.0325 133.7 8.45E + 04 70.8 126.4350 137.6 9.11E + 04 69.2 136.5375 206.0 9.77E + 04 62.3 135.2400 250.4 1.04E + 05 54.8 125.4420 290.1 1.10E + 05 50.8 116.8450 357.3 1.17E + 05 46.7 135.0475 420.7 1.24E + 05 39.2 119.0500 492.0 1.31E + 05 38.5 133.7
for the accuracy of the KLa-value. Eq. (20) can be transformed from logarithmic to the following exponential form:
CL = CLo exp[KLa(t - to)] (21)
Using a two-parameter nonlinear regression, the concentration changeover time can be used to determine the mass-transfer coefficient (KLa) andinitial concentration (CLo) directly. This technique should provide greaterprecision since the entire data set is used to estimate CLo , as opposed to asingle data point.
Table 2 shows the mass-transfer coefficients of 20 VOCs and oxygen forvarious impeller speeds (150-500 RPM). The specific power input (W/m3)
is also shown. Fig. 5 shows the dependency of the mass-transfer coefficients(KLa) on specific power input (only 10 compounds are plotted for clarity).
1089
k aG
(l/hr)
20
60
40
80
100
140
120
soo400
,0,
300200
o-----bII : "
100
OJ" i'"
....0 .. ;<...··..I····· 1--0.k~. f ·····>o,t..~·......··............+q..:· ···
.......................:..1 1... 1............... I .
'--!--I--i 1 1 f
····:·····1--·· kG'lL. ,·········t-······················r~ I
120
100
kGa 80
kta60
40
20
0
PI V(wattlm3)
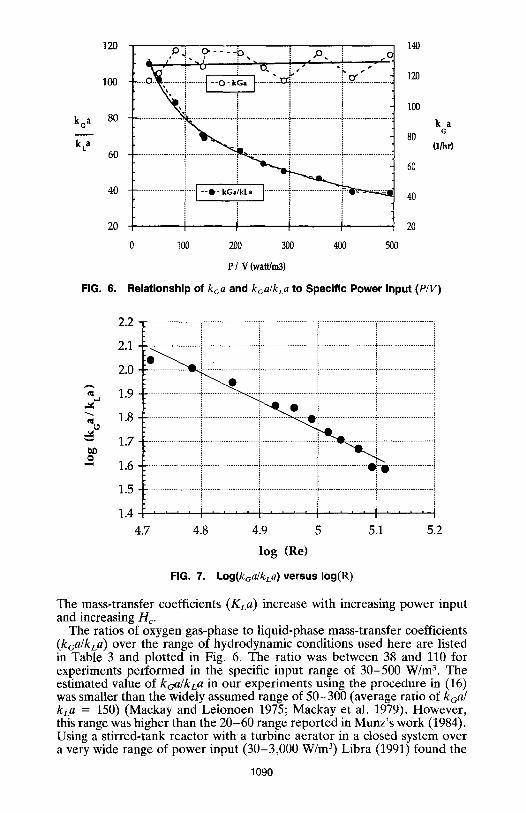
FIG. 6. Relationship of kGa and kGalkLa to Specific Power Input (PIV)
2.2
2.1
2.0
<ll 1.9..J~-- 1.8<ll"
0 1.7l)I)0
1.6-1.5
~~
.........~.~
----~ r--••
1.44.7 4.8 4.9 5
log (Re)
5.1 5.2
FIG. 7. Log(kGalkLa) versus 10g(R)
The mass-transfer coefficients (KLa) increase with increasing power inputand increasing He.
The ratios of oxygen gas-phase to liquid-phase mass-transfer coefficients(kGa/kLa) over the range of hydrodynamic conditions used here are listedin Table 3 and plotted in Fig. 6. The ratio was between 38 and 110 forexperiments performed in the specific input range of 30-500 W/m3• Theestimated value of kGa/kLa in our experiments using the procedure in (16)was smaller than the widely assumed range of 50-300 (average ratio of kGa/kLa = 150) (Mackay and Leionoen 1975; Mackay et al. 1979). However,this range was higher than the 20-60 range reported in Munz's work (1984).Using a stirred-tank reactor with a turbine aerator in a closed system overa very wide range of power input (30-3,000 W/m3) Libra (1991) found the
1090
.. ~""~~~
"""~~!)
~
~~
va
2.1
2
III 1.9,:;t.'""
--Ill~ 1.8~00 1.70....
1.6
1.5
1.4 1.6 1.8 2 2.2
log (P/V)
2.4 2.6 2.8
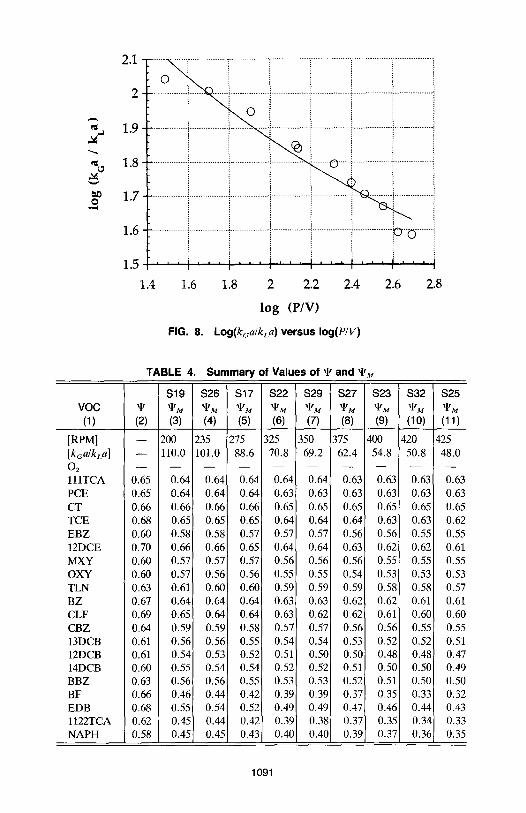
FIG. 8. Log(kGalkLa) versus 10g(PIV)
TABLE 4. Summary of Values of 'I' and 'I'M
519 526 517 522 829 827 823 832 825voe 'I' 'I'M 'I'M 'I'M 'I'M 'I'M 'I'M 'I'M 'I'M 'I'M
(1 ) (2) (3) (4) (5) (6) (7) (8) (9) (10) (11 )
[RPM) - 200 235 275 325 350 375 400 420 425[kGalkLa) - 110.0 101.0 88.6 70.8 69.2 62.4 54.8 50.8 48.0O2 - - - - - - - - - -lllTCA 0.65 0.64 0.64 0.64 0.64 0.64 0.63 0.63 0.63 0.63PCE 0.65 0.64 0.64 0.64 0.63 0.63 0.63 0.63 0.63 0.63CT 0.66 0.66 0.66 0.66 0.65 0.65 0.65 0.65 0.65 0.65TCE 0.68 0.65 0.65 0.65 0.64 0.64 0.64 0.63 0.63 0.62EBZ 0.60 0.58 0.58 0.57 0.57 0.57 0.56 0.56 0.55 0.5512DCE 0.70 0.66 0.66 0.65 0.64 0.64 0.63 0.62 0.62 0.61MXY 0.60 0.57 0.57 0.57 0.56 0.56 0.56 0.55 0.55 0.55OXY 0.60 0.57 0.56 0.56 0.55 0.55 0.54 0.53 0.53 0.53TLN 0.63 0.61 0.60 0.60 0.59 0.59 0.59 0.58 0.58 0.57BZ 0.67 0.64 0.64 0.64 0.63 0.63 0.62 0.62 0.61 0.61CLF 0.69 0.65 0.64 0.64 0.63 0.62 0.62 0.61 0.60 0.60CBZ 0.64 0.59 0.59 0.58 0.57 0.57 0.56 0.56 0.55 0.5513DCB 0.61 0.56 0.56 0.55 0.54 0.54 0.53 0.52 0.52 0.5112DCB 0.61 0.54 0.53 0.52 0.51 0.50 0.50 0.48 0.48 0.4714DCB 0.60 0.55 0.54 0.54 0.52 0.52 0.51 0.50 0.50 0.49BBZ 0.63 0.56 0.56 0.55 0.53 0.53 0.52 0.51 0.50 0.50BF 0.66 0.46 0.44 0.42 0.39 0.39 0.37 0.35 0.33 0.32EDB 0.68 0.55 0.54 0.52 0.49 0.49 0.47 0.46 0.44 0.431122TCA 0.62 0.45 0.44 0.42 0.39 0.38 0.37 0.35 0.34 0.33NAPH 0.58 0.45 0.45 0.43 0.40 0.40 0.39 0.37 0.36 0.35
1091

/}, 02
• CCI4Q I,I,I-TCA
• Ethylbenzene
+ Toluene
IJ 1,2-xylene
Ell Chloroform
• Bromobenzene
IS1 1,4-DCB
• EDBx 1,1,2,2-TCA
.....--0 + .,,. .
-:~~±~L;i:-:X:-i.H.~ ! ~ ':x~..:t.2:;l
50 100 150 200 250 300P/V (wattlm3
)
FIG. 9. Effect of Power Input on Liquid-Phase Resistance
100
95
90
85R
L80
R75T
(%)
70
65
60
0
1.21.10.7
~ b~A'-' '-' V~
~v '2;~
y vo
0/V
Qr 0
0.60.6
1.2e
l3-- 1.1bI)c...."";:l 1.0
-;:;r:e.:0 0.9«l....~
"'0 0.8ClJ-«l-;
0.7'-'-«lU
0.8 0.9 1.0Measured K
La (lIhr)
FIG. 10. Calculated and Measured Mass-Transfer Coefficient of 20 VOCs (325RPM)
kdllkLa ratio to be as low as 0.1. These new results along with previouswork suggest that the ratio is highly dependent upon experimental conditions. The ratio is not fixed. Fig. 6 also shows the relatively constant gasphase mass-transfer coefficient (kca) because experiments performed withconstant windspeeds of 1.8-2.4 (m/s) above the water surface. The averagegas-phase mass-transfer coefficient (kca) obtained in this work is 126 ± 7(lIh).
1092
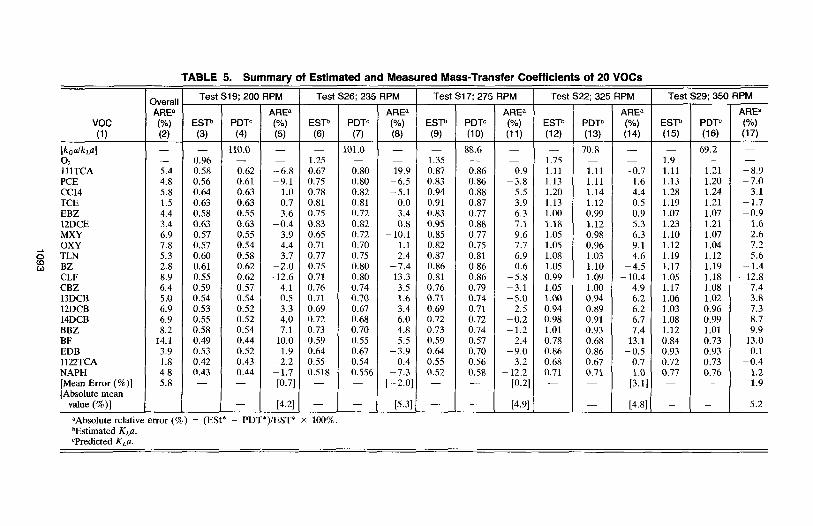
TABLE 5. Summary of Estimated and Measured Mass-Transfer Coefficients of 20 VOCs
OverallTest S19; 200 RPM Test S26; 235 RPM Test S17; 275 RPM Test S22; 325 RPM Test S29; 350 RPM
ARE> ARE> AREa AREa ARE> ARE>voe (%) EST!' PDP (%) EST!' PDP (%) EST!' PDTc (%) EST!' PDP (%) EST!' PDP (%)(1) (2) (3) (4) (5) (6) (7) (8) (9) (10) (11) (12) (13) (14) (15) (16) (17)
[kGalkLa] - - 110.0 - - 101.0 - - 88.6 - - 70.8 - - 69.2 -
0, - 0.96 - - 1.25 - - 1.35 - - 1.75 - - 1.9 - -
IIlTCA 5.4 0.58 0.62 -6.8 0.67 0.80 -19.9 0.87 0.86 0.9 1.11 1.11 -0.7 1.11 1.21 -8.9PCE 4.8 0.56 0.61 -9.1 0.75 0.80 -6.5 0.83 0.86 -3.8 1.13 1.11 1.6 1.13 1.20 -7.0CC14 5.8 0.64 0.63 1.0 0.78 0.82 -5.1 0.94 0.88 5.5 1.20 1.14 4.4 1.28 1.24 3.1TCE 1.5 0.63 0.63 0.7 0.81 0.81 0.0 0.91 0.87 3.9 1.13 1.12 0.5 1.19 1.21 -1.7EBZ 4.4 0.58 0.55 3.6 0.75 0.72 3.4 0.83 0.77 6.3 1.00 0.99 0.9 1.07 1.07 -0.912DCE 3.4 0.63 0.63 -0.4 0.83 0.82 0.8 0.95 0.88 7.1 1.18 1.12 5.3 1.23 1.21 1.6MXY 6.9 0.57 0.55 3.9 0.65 0.72 -10.1 0.85 0.77 9.6 1.05 0.98 6.3 1.10 1.07 2.6OXY 7.8 0.57 0.54 4.4 0.71 0.70 1.1 0.82 0.75 7.7 1.05 0.96 9.1 1.12 1.04 7.2TLN 5.3 0.60 0.58 3.7 0.77 0.75 2.4 0.87 0.81 6.9 1.08 1.03 4.6 1.19 1.12 5.6BZ 2.8 0.61 0.62 -2.0 0.75 0.80 -7.4 0.86 0.86 0.6 1.05 1.10 -4.5 1.17 1.19 -1.4CLF 8.9 0.55 0.62 -12.6 0.71 0.80 -13.3 0.81 0.86 -5.8 0.99 1.09 -10.4 1.05 1.18 -12.8CBZ 6.4 0.59 0.57 4.1 0.76 0.74 3.5 0.76 0.79 -3.1 1.05 1.00 4.9 1.17 1.08 7.413DCB 5.0 0.54 0.54 0.5 0.71 0.70 1.6 0.71 0.74 -5.0 1.00 0.94 6.2 1.06 1.02 3.812DCB 6.9 0.53 0.52 3.3 0.69 0.67 3.4 0.69 0.71 -2.5 0.94 0.89 6.2 1.03 0.96 7.314DCB 6.9 0.55 0.52 4.0 0.72 0.68 6.0 0.72 0.72 -0.2 0.98 0.91 6.7 1.08 0.99 8.7BBZ 8.2 0.58 0.54 7.1 0.73 0.70 4.8 0.73 0.74 -1.2 1.01 0.93 7.4 1.12 1.01 9.9BF 14.1 0.49 0.44 10.0 0.59 0.55 5.5 0.59 0.57 2.4 0.78 0.68 13.1 0.84 0.73 13.0EDB 3.9 0.53 0.52 1.9 0.64 0.67 -3.9 0.64 0.70 -9.0 0.86 0.86 -0.5 0.93 0.93 0.11122TCA 1.8 0.42 0.43 -2.2 0.55 0.54 0.4 0.55 0.56 -3.2 0.68 0.67 0.7 0.72 0.73 -0.4NAPH 4.8 0.43 0.44 -1.7 0.518 0.556 -7.3 0.52 0.58 -12.2 0.71 0.71 1.0 0.77 0.76 1.2[Mean Error (%)] 5.8 - - [0.7] - - [-2.0] - - [0.2] - - [3.1] - - 1.9[Absolute mean
value (%)] - - - [4.2] - - [5.3] - - [4.9] - - [4.8] - - 5.2
'Absolute relatIve error (%) = (ESt* - PDT*)!EST* x 100%.bEstimated KLa.'Predicted KLa.

TABLE 6. Summary of Estimated and Measured Mass-Transfer Coefficients of 20 VOCs
Test S27; 375 RPM Test S23; 400 RPM Test S32; 420 RPM Test S25; 425 RPM
vac EST" PDP AREc EST" PDTb ARE< EST" PDTb AREc EST' PDP ARE<(1) (2) (3) (4) (5) (6) (7) (8) (9) (10) (11 ) (12) (13)
[kGalkLa] - 62.4 - - 54.8 - - 50.8 - - 48 -a, 2 - - 2.15 - - 2.30 - - 2.35 - -lIlTCA 1.25 1.27 -1.7 1.33 1.36 -2.1 1.38 1.45 -5.0 1.44 1.48 -2.3PCE 1.21 1.26 -4.4 1.31 1.35 -3.6 1.37 1.44 -5.6 1.45 1.47 -1.8CC14 1.41 1.30 7.4 1.54 1.40 9.2 1.63 1.49 8.3 1.67 1.53 8.5TCE 1.28 1.27 0.9 1.39 1.35 2.9 1.45 1.44 0.5 1.51 1.47 2.8EBZ 1.16 1.12 3.3 1.29 1.20 7.1 1.36 1.27 6.3 1.41 1.30 7.912DCE 1.30 1.26 3.0 1.41 1.34 5.5 1.46 1.42 2.7 1.49 1.44 3.7MXY 1.19 1.11 6.6 1.28 1.19 7.5 1.35 1.26 6.7 1.41 1.28 9.0axY 1.20 1.08 9.8 1.28 1.15 10.2 1.33 1.22 8.0- 1.42 1.24 12.8TLN 1.26 1.17 7.2 1.33 1.25 6.3 1.37 1.33 3.5 1.46 1.35 7.7BZ 1.26 1.24 1.5 1.33 1.32 0.9 1.34 1.41 -4.6 1.46 1.43 2.4CLF 1.13 1.23 -9.6 1.25 1.31 -4.5 1.29 1.38 -7.8 1.36 lAO -304CBZ 1.25 1.13 9.5 1.30 1.19 8.2 1.36 1.26 7.2 1.42 1.28 10.013DCB 1.16 1.06 8.6 1.21 1.12 7.1 1.23 1.18 3.7 1.31 1.20 8.512DCB 1.09 0.99 9.5 1.15 1.04 10.0 1.18 1.09 7.3 1.26 1.10 12.314DCB 1.10 1.02 6.8 1.21 1.08 10.5 1.23 1.14 7.4 1.31 1.15 12.2BBZ 1.17 1.04 10.7 1.24 1.10 11.5 1.27 1.16 8.9 1.34 1.17 12.6BF 0.89 0.74 17.6 0.94 0.74 20.7 0.97 0.77 20.4 1.00 0.76 23.7EDB 0.98 0.95 3.2 1.05 0.98 6.8 1.06 1.02 3.7 1.09 1.02 5.91I22TCA 0.73 0.73 -0.3 0.77 0.75 2.5 0.78 0.77 0.9 0.82 0.77 5.9NAPH 0.79 0.78 1.5 0.85 0.80 6.0 0.87 0.83 4.4 0.90 0.83 7.8[Mean error (%)] - - 4.6 - - 6.1 - - 3.8 - - 7.3[Absolute mean
value (%)] - - 6.2 - - 7.2 - - 6.1 - - 8.1
'Estimated KLa.bpredicted KLa.'Absolute relative error (%) = (ESt' - PDT*)/EST* x 100%.
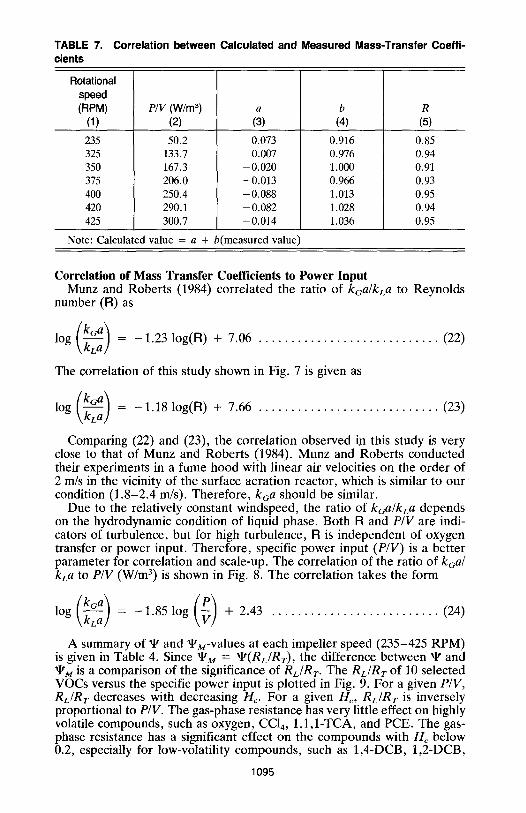
TABLE 7. Correlation between Calculated and Measured Mass-Transfer Coefficients
Rotationalspeed(RPM) PIV (W/m3
) a b R(1 ) (2) (3) (4) (5)
235 50.2 0.073 0.916 0.85325 133.7 0.007 0.976 0.94350 167.3 -0.020 1.000 0.91375 206.0 -0.013 0.966 0.93400 250.4 -0.088 1.013 0.95420 290.1 -0.082 1.028 0.94425 300.7 -0.014 1.036 0.95
Note: Calculated value = a + b(measured value)
Correlation of Mass Transfer Coefficients to Power InputMunz and Roberts (1984) correlated the ratio of kGalkLa to Reynolds
number (R) as
(kGa)log kLa = -1.23 10g(R) + 7.06 (22)
The correlation of this study shown in Fig. 7 is given as
(kGa)log kLa = -1.1810g(R) + 7.66 (23)
Comparing (22) and (23), the correlation observed in this study is veryclose to that of Munz and Roberts (1984). Munz and Roberts conductedtheir experiments in a fume hood with linear air velocities on the order of2 m/s in the vicinity of the surface aeration reactor, which is similar to our'condition (1.8-2.4 m/s). Therefore, kGa should be similar.
Due to the relatively constant windspeed, the ratio of kGalkLa dependson the hydrodynamic condition of liquid phase. Both Rand PIV are indicators of turbulence, but for high turbulence, R is independent of oxygentransfer or power input. Therefore, specific power input (PIV) is a betterparameter for correlation and scale-up. The correlation of the ratio of kGalkLa to PIV (W/m3) is shown in Fig. 8. The correlation takes the form
log (~::) = -1.85 log (f) + 2.43 (24)
A summary of 'I' and 'I'M-values at each impeller speed (235-425 RPM)is given in Table 4. Since 'I'M = 'I'(RdR T), the difference between 'I' and'I'M is a comparison of the significance of RLIRT • The RdR T of 10 selectedVOCs versus the specific power input is plotted in Fig. 9. For a given PIV,RLIRT decreases with decreasing He. For a given He, RdRT is inverselyproportional to PIV. The gas-phase resistance has very little effect on highlyvolatile compounds, such as oxygen, CCI4 , 1,1,I-TCA, and PCE. The gasphase resistance has a significant effect on the compounds with He below0.2, especially for low-volatility compounds, such as 1,4-DCB, 1,2-DCB,
1095
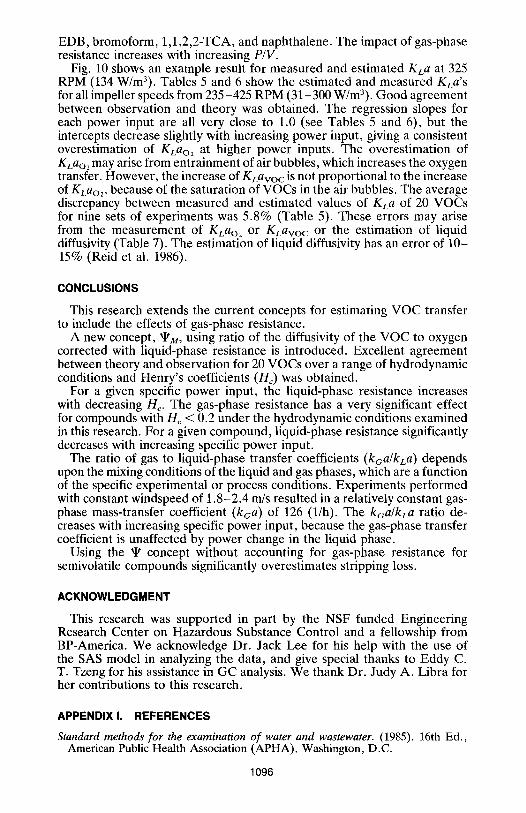
EDB, bromoform, 1,1,2,2-TCA, and naphthalene. The impact of gas-phaseresistance increases with increasing PIV.
Fig. 10 shows an example result for measured and estimated KLa at 325RPM (134 W/m3). Tables 5 and 6 show the estimated and measured KLa'sfor all impeller speeds from 235-425 RPM (31-300 W1m3). Good agreementbetween observation and theory was obtained. The regression slopes foreach power input are all very close to 1.0 (see Tables 5 and 6), but theintercepts decrease slightly with increasing power input, giving a consistentoverestimation of KLaO' at higher power inputs. The overestimation ofKLa02 may arise from entrainment of air bubbles, which increases the oxygentransfer. However, the increase of KLayOC is not proportional to the increaseof KLao" because of the saturation of VOCs in the air bubbles. The averagediscrepancy between measured and estimated values of KLa of 20 VOCsfor nine sets of experiments was 5.8% (Table 5). These errors may arisefrom the measurement of KLa02 or KLayoc or the estimation of liquiddiffusivity (Table 7). The estimation of liquid diffusivity has an error of 1015% (Reid et al. 1986).
CONCLUSIONS
This research extends the current concepts for estimating VOC transferto include the effects of gas-phase resistance.
A new concept, 'I'M, using ratio of the diffusivity of the VOC to oxygencorrected with liquid-phase resistance is introduced. Excellent agreementbetween theory and observation for 20 VOCs over a range of hydrodynamicconditions and Henry's coefficients (He) was obtained.
For a given specific power input, the liquid-phase resistance increaseswith decreasing He- The gas-phase resistance has a very significant effectfor compounds with He < 0.2 under the hydrodynamic conditions examinedin this research. For a given compound, liquid-phase resistance significantlydecreases with increasing specific power input.
The ratio of gas to liquid-phase transfer coefficients (kGalkLa) dependsupon the mixing conditions of the liquid and gas phases, which are a functionof the specific experimental or process conditions. Experiments performedwith constant windspeed of 1.8-2.4 m/s resulted in a relatively constant gasphase mass-transfer coefficient (kGa) of 126 (lIh). The kGalkLa ratio decreases with increasing specific power input, because the gas-phase transfercoefficient is unaffected by power change in the liquid phase.
Using the 'I' concept without accounting for gas-phase resistance forsemivolatile compounds significantly overestimates stripping loss.
ACKNOWLEDGMENT
This research was supported in part by the NSF funded EngineeringResearch Center on Hazardous Substance Control and a fellowship fromBP-America. We acknowledge Dr. Jack Lee for his help with the use ofthe SAS model in analyzing the data, and give special thanks to Eddy C.T. Tzeng for his assistance in GC analysis. We thank Dr. Judy A. Libra forher contributions to this research.
APPENDIX I. REFERENCES
Standard methods for the examination of water and wastewater. (1985). 16th Ed.,American Public Health Association (APHA), Washington, D.C.
1096
ASCE Oxygen Transfer Standards Committee. (1984). A standard for the measurement of oxygen transfer in clean water. ASCE, New York, N.Y.
Baillod, C. R., Crittenden, J. C., Mihelcic, J. R., Rogers, T. N., and Grady, L.(1990). "Transport and fate of toxics in wastewater treatment facilities." Res.Found. Proj. 90-1, Water Environment Federation (WEF), Alexandria, Va.
Danckwerts, P. V. (1951). "Significance of liquid-film coefficient in gas absorption."Ind. Engrg. Chern., 43(6),1460-1467.
Dobbins, W. E. (1964). "Mechanism of gas absorption by turbulent liquids." Proc.,Int. Conf. Water Pollution Res., Pergamon Press, London, England, 61-76.
Eckenfelder, W. W., and Ford, D. L. (1967). "Engineering aspects of surface aeration design." Proc., 22nd Purdue Industrial Waste Conf., Purdue University,Lafayette, Ind., 279-291.
Goodgame, T. H., and Sherwood, T. K. (1954). "The additivity of resistances between phases." Chern. Engrg. Sci., 3(2), 37-42.
Gossett, J. M. (1987). "Measurement of Henry's law constants for Cl and C2 chlorinated hydrocarbons." Envir. Sci. and Tech., 21(2), 202-208.
Higbie, R. (1935). "The rate of absorption of a pure gas into a still liquid duringshort periods of exposure." Trans. AIChE, 31, 365-388.
Hsieh, c.-C. (1991). "Estimating volatilization rates and gas/liquid mass transfercoefficients in aeration systems," PhD thesis, University of California, Los Angeles, Calif.
Kozinski, A. A., and King, C. J. (1966). "The influence of diffusivity on liquid phasemass transfer to the free surface in a stirred vessel." AIChE J., 12, 109-116.
Lewis, W. K., and Whitman, W. G. (1924). "Principles of gas absorption." Ind.Engrg. Chern., 16, 1215-1220.
Libra, J. A. (1991). "Volatilization of organic compounds in an aerated stirred tankreactor," PhD thesis, University of California, Los Angeles, Calif.
Mackay, D., and Leinonen, P. J. (1975). "Rate of evaporation of low-solubilitycontaminants from water bodies to atmosphere." Envir. Sci. and Tech., 9(13),1178-1180.
Mackay, D., Shiu, W. Y., and Sutherland, R. P. (1979). "Determination of airwater Henry's law constants for hydrophobic pollutants." Envir. Sci. and Tech.,13(9), 333-337.
Mackay, D., and Shiu, W. Y. (1981). "A critical review of Henry's law coefficientsfor chemicals of environmental interest." J. Phys. Chern. Ref Data, 10(4), 11751199.
Mackay, D., and Yeun, A. T. K. (1983). "Mass transfer coefficient correlations forvolatilization of organic solutes from water." Envir. Sci. and Tech., 17(4),211217.
Matter-Mueller, c., Gujer, W., and Giger, W. (1981). "Transfer of volatile substances from water to the atmosphere." Water Res., 15, 1271-1279.
Munz, C., and Roberts, P. V. (1984). "The ratio of gas phase to liquid phase masstransfer coefficients in gas-liquid contacting processes." Gas transfer at water surfaces, W. Brutsaert and G. H. Jirka, eds., D. Reidel Publishing Co., Hingham,Mass., 35-45.
Munz, c., and Roberts, P. V. (1986). "Effects of solute concentration and cosolventson the aqueous activity coefficient of halogenated hydrocarbons." Envir. Sci. andTech., 20, 830-836.
Munz, c., and Roberts, P. V. (1987). "Air-water phase equilibria of volatile organicsolutes." J. AWWA, 79(1), 62-69.
Paulson, W. C. (1979). "Review of test procedures." Proc., Workshop Towards andOxygen Transfer Standard; EPA-600/9-78-021, W. C. Boyle, ed., Municipal Environmental Research Laboratory, U.S. Environmental Protection Agency, Cincinnati, Ohio, 41-49.
Perry, and Green. (1984). Perry's chemical engineer's handbook, 6th Ed., McGrawHill Book Co., Inc., New York, N.Y.
Reid, R. C., Prausnitz, J. M., and Sherwood, T. K. (1987). The properties ofgasesand liquids, 4th Ed., McGraw-Hill Book Co., Inc., New York, N.Y.
Roberts, P. V., and Dandliker, P. G. (1983). "Mass transfer of volatile organic
1097
contaminants from aqueous solution to the atmosphere during surface aeration."Envir. Sci. and Tech., 17(8),484-489.
Roberts, P. V., Munz, c., and Dandliker, P. (1984). "Modeling volatile organicsolute removal by surface and bubble aeration." J. WPCF, 56(2), 157-163.
SAS user's guide; statistical analysis system. (1982). SAS Institute Inc., Raleigh, N.C.Nagata, S. (1975). Mixing principles and applications. John Wiley and Sons, New
York, N.Y.Smith, J. H., Bomberger, D. C., and Haynes, D. L. (1980). "Prediction of the
volatilization rates of high-volatility chemicals from natural water bodies." Envir.Sci. and Tech., 14(11), 1332-1337.
Treybal, R. E. (1968). Mass transfer operations, 2nd Ed., McGraw-Hill Book Co.,Inc., New York, N.Y.
Verschueren, K. (1977). Handbook ofenvironmental data on organic chemicals. VanNostrand Reinhold Co., New York, N.Y.
APPENDIX II. NOTATION
The following symbols are used in this paper:
a interfacial area;C concentration;
D G gas diffusivity;DL liquid diffusivity;H Henry's coefficient;
He dimensionless Henry's coefficient;K overall mass-transfer coefficient;k mass-transfer coefficient;
M gram molecular weight;m exponent of gas diffusivity;N rotational speed;n exponent of liquid diffusivity;P power input;p vapor pressure;R film resistance;S solubility;t time;
V volume;'I' ratio of mass-transfer coefficients of VOC to oxygen; and
'I'M modified '1'.
SubscriptsG denotes gas phaseL denotes liquid phase
O2 denotes oxygeno denotes initialT denotes total; and
VOC denotes volatile organic compound.
Superscript* = denotes saturation.
1098