estimating blue whale skin isotopic incorporation rates … [email protected] abstract...
TRANSCRIPT
RESEARCH ARTICLE
Estimating blue whale skin isotopic
incorporation rates and baleen growth rates:
Implications for assessing diet and movement
patterns in mysticetes
Geraldine Busquets-Vass1, Seth D. Newsome2, John Calambokidis3, Gabriela Serra-
Valente4, Jeff K. Jacobsen5, Sergio Aguıñiga-Garcıa1, Diane Gendron1*
1 Instituto Politecnico Nacional, Centro Interdisciplinario de Ciencias Marinas, La Paz, Baja California Sur,
Mexico, 2 Biology Department, University of New Mexico, Albuquerque, New Mexico, United States of
America, 3 Cascadia Research Collective, Olympia, Washington, United States of America, 4 Marine
Mammal and Turtle Division, Southwest Fisheries Science Center, National Marine Fisheries Service,
National Oceanic and Atmospheric Administration, La Jolla, California, United States of America,
5 Vertebrate Museum, Department of Biological Sciences, Humboldt State University, Arcata, California,
United States of America
Abstract
Stable isotope analysis in mysticete skin and baleen plates has been repeatedly used to
assess diet and movement patterns. Accurate interpretation of isotope data depends on
understanding isotopic incorporation rates for metabolically active tissues and growth rates
for metabolically inert tissues. The aim of this research was to estimate isotopic incorpo-
ration rates in blue whale skin and baleen growth rates by using natural gradients in baseline
isotope values between oceanic regions. Nitrogen (δ15N) and carbon (δ13C) isotope values
of blue whale skin and potential prey were analyzed from three foraging zones (Gulf of Cali-
fornia, California Current System, and Costa Rica Dome) in the northeast Pacific from
1996–2015. We also measured δ15N and δ13C values along the lengths of baleen plates col-
lected from six blue whales stranded in the 1980s and 2000s. Skin was separated into three
strata: basale, externum, and sloughed skin. A mean (±SD) skin isotopic incorporation rate
of 163±91 days was estimated by fitting a generalized additive model of the seasonal trend
in δ15N values of skin strata collected in the Gulf of California and the California Current Sys-
tem. A mean (±SD) baleen growth rate of 15.5±2.2 cm y-1 was estimated by using seasonal
oscillations in δ15N values from three whales. These oscillations also showed that individual
whales have a high fidelity to distinct foraging zones in the northeast Pacific across years.
The absence of oscillations in δ15N values of baleen sub-samples from three male whales
suggests these individuals remained within a specific zone for several years prior to death.
δ13C values of both whale tissues (skin and baleen) and potential prey were not distinct
among foraging zones. Our results highlight the importance of considering tissue isotopic
incorporation and growth rates when studying migratory mysticetes and provide new
insights into the individual movement strategies of blue whales.
PLOS ONE | https://doi.org/10.1371/journal.pone.0177880 May 31, 2017 1 / 25
a1111111111
a1111111111
a1111111111
a1111111111
a1111111111
OPENACCESS
Citation: Busquets-Vass G, Newsome SD,
Calambokidis J, Serra-Valente G, Jacobsen JK,
Aguıñiga-Garcıa S, et al. (2017) Estimating blue
whale skin isotopic incorporation rates and baleen
growth rates: Implications for assessing diet and
movement patterns in mysticetes. PLoS ONE 12
(5): e0177880. https://doi.org/10.1371/journal.
pone.0177880
Editor: Mark S. Boyce, University of Alberta,
CANADA
Received: January 16, 2017
Accepted: May 4, 2017
Published: May 31, 2017
Copyright: This is an open access article, free of all
copyright, and may be freely reproduced,
distributed, transmitted, modified, built upon, or
otherwise used by anyone for any lawful purpose.
The work is made available under the Creative
Commons CC0 public domain dedication.
Data Availability Statement: All relevant data are
within the paper and its Supporting Information
files.
Funding: The authors received financial support
from Instituto Politecnico Nacional:SIP: 20130223;
20140495; 20150115; 20160496 (http://www.ipn.
mx/Paginas/inicio.aspx) and the University of New
Mexico Center for Stable Isotopes (Albuquerque,
NM; http://csi.unm.edu/). GBV received a PhD

Introduction
The blue whale (Balenoptera musculus) in the northeast Pacific is an endangered migratory
mysticete [1]. In summer and fall, blue whales are distributed as far north as the Gulf of Alaska
[2,3], but the highest aggregations have been observed off southern California [4]. By mid-fall
(~October), they usually migrate south to the west coast of the Baja California Peninsula [2,4–
8] and then continue migrating to one of two regions that are recognized as overwintering
zones: a calving ground in the Gulf of California [2,9–12], or the Costa Rica Dome in the east-
ern tropical Pacific [2,7,8]. Calves have also been observed in the Costa Rica Dome, but little is
known about the population dynamics in this zone [13].
Blue whales forage throughout their annual migratory cycle mainly on aggregations of krill
(Order: Euphausiacea) [14–18] and occasionally on other crustaceans (i.e. copepods, Calanusspp.) [16,19] or small fish (i.e. lanternfish: Family Myctophidae) [20]. The observation that
blue whales forage year-round suggests this species has high energetic demands relative to
other migratory mysticetes like the humpback whale (Megaptera novaeangliae) and the gray
whale (Eschrichtius robustus), that typically fast for months during their breeding season in
low latitudes [21,22]. The general migratory patterns of blue whales in the northeast Pacific
have been described [2,3,5,7,10,11,23], specifically for the California feeding population [3];
however, there are still many gaps in our understanding of their feeding ecology and plasticity
in individual movement patterns across multi-year timescales.
Stable isotope analysis (SIA) is a proven tool for studying the diet and movement patterns
of marine mammals [24]. The isotopic composition of animal tissues are influenced by diet
[25–27] and the isotopic composition of the base of the food web, which can vary in time and
space within and among oceanic ecosystems [24,28–31]. Physiological processes produce pre-
dictable offsets in isotope values between consumers and their diet, which is often called tro-
phic discrimination [24,32]. In general, consumer tissues have carbon (δ13C) and nitrogen
(δ15N) isotope values that are 0.5–3.0‰ and 2–5‰ higher than that of their prey respectively,
depending on the species, diet quality, and type of tissue analyzed [24–26,33,34].
Tissues assimilate dietary inputs at different temporal scales. Most metabolically active
tissues reflect recent dietary inputs, consumed within days to months (e.g. plasma, muscle),
depending on their isotopic incorporation rates that typically scale with body mass such that
larger animals have slower incorporation rates [35]. In contrast, metabolically inert tissues
(e.g. whiskers, nails) deposit at distinct intervals, and each deposition of tissue retains the isoto-
pic composition of dietary sources incorporated when anabolized, thus reflecting dietary input
over several years depending on tissue growth rate [24,36]. Consequently, to make accurate
inferences on ecological aspects of free ranging animals by using SIA it is essential to have infor-
mation on the isotopic incorporation rate of metabolically active tissues and the growth rates of
metabolically inert tissues; otherwise, the interpretation of the data can be highly misleading.
SIA of mysticete skin and baleen plates has frequently been used to infer diet and seasonal
movements of this difficult to study group of cetaceans [37–44]. Cetacean skin (epidermis) is a
metabolically active tissue, subdivided into cellular strata: the stratum basale, the stratum spi-
nosum, and the stratum externum [45,46]. Skin growth begins in the stratum basale a single
row of cells that replicate actively. Newly formed cells constantly displace the older cells up-
ward, first to the stratum spinosum, and subsequently to the stratum externum, the outermost
layer of skin. Finally, the stratum externum is sloughed off to the environment as sloughed
skin [45]. Variation in the isotopic composition among these strata has never been described
for any cetacean species. The isotopic incorporation rates of cetacean skin have only been mea-
sured in controlled “diet switch” feeding experiments on captive odontocetes [47,48]. These
studies used exponential fit models because theoretically, after diet switch, changes in the
Blue whale skin isotopic incorporation rates and baleen growth rates
PLOS ONE | https://doi.org/10.1371/journal.pone.0177880 May 31, 2017 2 / 25
grant from the Consejo Nacional de Ciencia y
Tecnologıa (CONACyT; http://www.conacyt.mx/), a
research grant from Cetacean Society International
(http://www.csiwhalesalive.org/index.php)
specifically for processing the baleen plates, and a
grant from American Cetacean Society - Monterey
Bay (http://acsonline.org/) to process skin
samples. The funders had no role in study design,
data collection and analysis, decision to publish, or
preparation of the manuscript.
Competing interests: The authors have declared
that no competing interests exist.

isotopic composition of tissues will follow an exponential curve over time [49–52]. Estimates
of the isotopic incorporation for carbon (δ13C) and nitrogen (δ15N) in odontocete skin slightly
differ; incorporation for δ13C is 2 to 3 months, while that for δ15N is longer and more variable
at 2 to 6 months [47,48]. The increasing use of SIA in mysticetes to characterize diet and move-
ment patterns requires the development of a method to estimate skin isotopic incorporation
rates for free-ranging populations.
Baleen consists of a series of keratin plates inserted in the upper gum of mysticetes that
functions as a filter-feeding apparatus [53]. In contrast to skin, baleen is a metabolically inert
tissue that grows continuously from the gums and abrades at the terminal end [54]. The oscil-
lations in isotope values along the length of baleen plates can be used to estimate growth rates
and generate multi-year records of individual movement strategies, habitat use, and diet
[38,42–44,55–57]. Baleen growth rates have been estimated in several species of mysticetes
[37,42–44,55,57], but currently there are no published estimates for blue whale baleen.
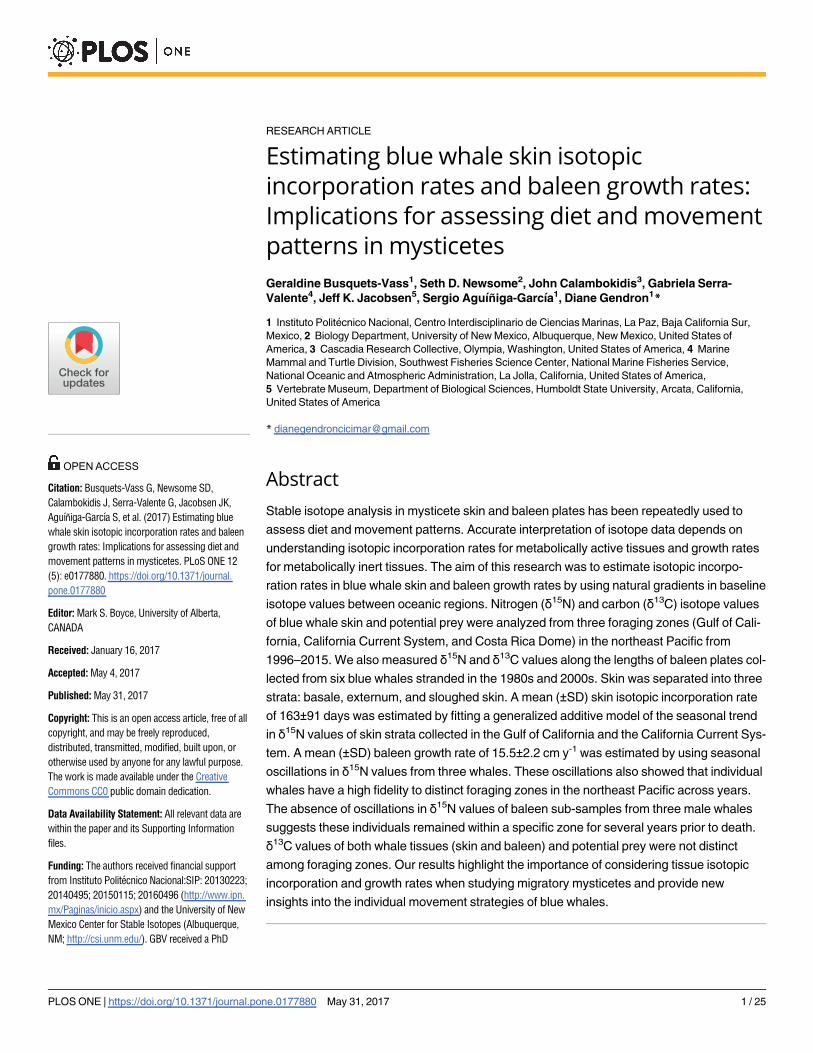
Potential prey of blue whales in their distinct summer–fall (California Current System: west
coast of U.S. and Baja California Peninsula; Fig 1) and winter–spring (Gulf of California and
Costa Rica Dome; Fig 1) foraging zones have contrasting isotope values [58–64] due to differ-
ences in oceanographic and biogeochemical processes that influence baseline isotope values in
these zones [31,58,62,65]. Specifically, δ15N values of prey (e.g. krill) are higher in the Gulf of
California, intermediate in the California Current System, and lowest in the Costa Rica Dome
[58–64]. We assumed that blue whale skin strata (stratum basale, stratum externum, and
sloughed skin) and baleen plates record these isotopic differences. Then, we evaluated if the
seasonal patterns of tissue isotope values could be used to estimate the isotopic incorporation
rates and baleen growth rates of blue whale skin and baleen, respectively. We also assessed if
carbon isotopes were useful for examining blue whale diet and movement patterns in the
northeast Pacific, however, we expected little variation in δ13C values of prey among foraging
zones based on previous studies [58–64]. Overall, our results highlight the importance of care-
fully considering the temporal window represented by metabolically active and inert tissues
when studying migratory mysticetes.
Materials and methods
Ethic statement
All whale tissues used in this study were collected and processed under special permits issued
by the Secretarıa de Medio Ambiente y Recursos Naturales (SEMARNAT) in Mexico (codes:
180796-213-03, 071197–213–03, DOO 750-00444/99, DOO.0-0095, DOO 02.-8318, SGPA/
DGVS-7000, 00624, 01641, 00560, 12057, 08021, 00506, 08796, 09760, 10646, 00251, 00807,
05036, 01110; 00987; CITES export permit: MX 71395), and the National Oceanic and Atmo-
spheric Administration–National Marine Fisheries Service (NOAA/NMFS) (NMFS MMPA/
Research permits codes: NMFS-873; 1026; 774–1427; 774–1714; 14097; 16111; CITES import
permit: 14US774223/9) in the United States of America. All tissues were collected using non-
lethal sampling techniques.
Sample collection
Blue whale skin biopsies (n = 255) and sloughed skin (n = 174) were selected from tissue banks
at NOAA Southwest Fisheries Science Center (NOAA-SWFSC), Cascadia Research Collective
(CRC), and Centro Interdisciplinario de Ciencias Marinas-Instituto Politecnico Nacional
(CICIMAR-IPN). These samples were collected from 1996–2015 in the Gulf of California
(GC) (Jan–Apr; n = 115 biopsies, n = 81 sloughed skin; Fig 1), California Current System
(CCS) (Jun–Dec; n = 129 biopsies, n = 93 sloughed skin; Fig 1) and the Costa Rica Dome
Blue whale skin isotopic incorporation rates and baleen growth rates
PLOS ONE | https://doi.org/10.1371/journal.pone.0177880 May 31, 2017 3 / 25
(CRD) (Oct–Nov; n = 11 biopsies; Fig 1). Skin samples were collected during marine mammal
surveys conducted by NOAA-SWFSC, CRC, and CICIMAR-IPN. Skin biopsies were collected
via dart sampling methods [66], and sloughed skin was directly collected from the water with a
net [67] or from suction cups of satellite-tagged whales.
Krill (n = 34) and lanternfish (n = 7) samples were opportunistically collected during
marine mammal surveys conducted by CICIMAR-IPN within the GC (2005–2015). Krill sam-
ples were collected by towing a conical net (diameter 50 cm., mesh size 200 μm) when blue
Fig 1. Northeast Pacific sampling zones. Dots represent blue whale skin samples collected in the California Current System (CCS), Gulf of California
(GC) and Costa Rica Dome (CRD). Dots with a cross represent blue whale baleen plates collected from dead stranded whales.
https://doi.org/10.1371/journal.pone.0177880.g001
Blue whale skin isotopic incorporation rates and baleen growth rates
PLOS ONE | https://doi.org/10.1371/journal.pone.0177880 May 31, 2017 4 / 25

whales were observed feeding near the surface. Lanternfish samples were collected with a fish-
ing net (mesh size 5 mm), when aggregations were found near the surface. Prey samples were
preserved frozen in liquid nitrogen (-195˚C). The assignment of lanternfish to the Family
Myctophidae and classification of krill species was made using identification guides [68,69];
Nyctiphanes simplex was the only krill species present in all samples.
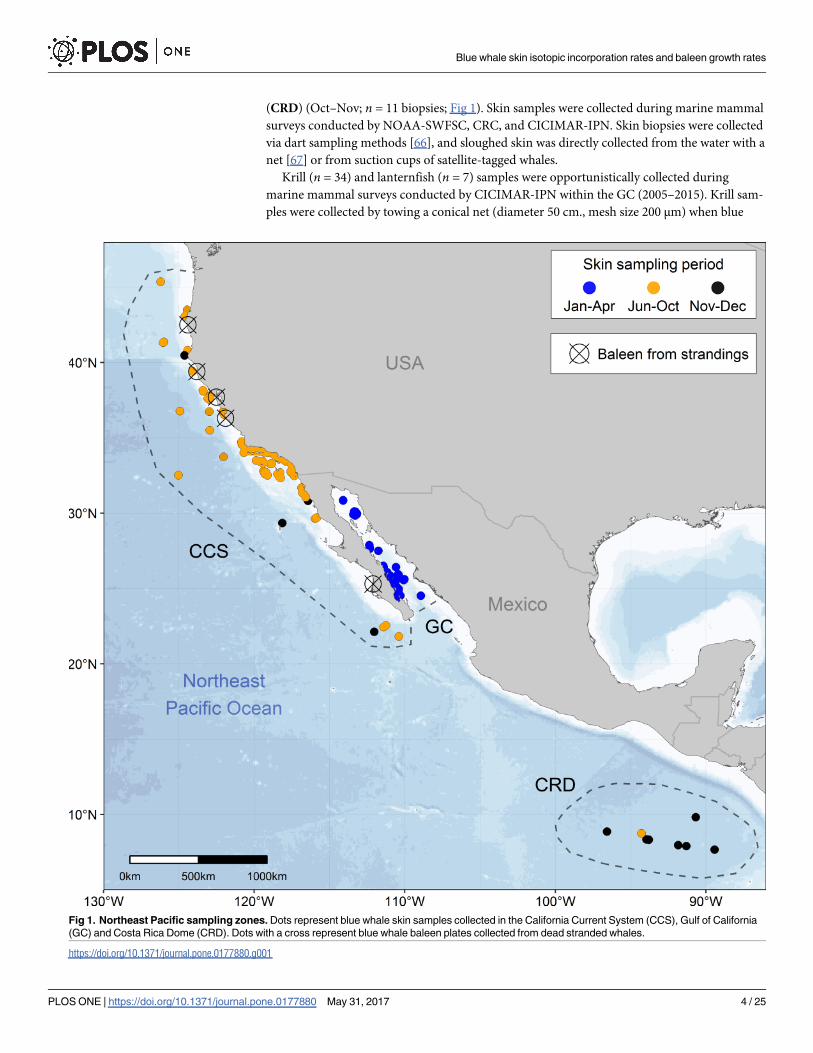
To assess the isotope variability between blue whale skin strata it was necessary to identify
tissue structure. Histological preparations of five skin biopsies were stained with hematoxylin
& eosin following the protocol of Sheehan and Hrapchak [70]. Based on these preparations the
skin biopsy was divided into two strata: (1) stratum basale, closest to the blubber, and (2) stra-
tum externum, the outermost layer that easily separated from the stratum spinosum (Fig 2A).
We did not include stratum spinosum in our analysis because we assumed it would exhibit
intermediate isotope values between the stratum basale and the stratum externum. Some skin
biopsy samples were incomplete as they had been used for previous studies, and only one of
the two strata were available. Sloughed skin samples were also included in the analysis, but
were only available for some years (S1 Dataset).
Baleen plates collected from six dead stranded blue whales were obtained from Humboldt
State University Vertebrate Museum (HSU-VM), CICIMAR-IPN, the California Department
of Parks and Recreation-Prairie Creek Redwoods State Park (CDPR-PCRSP), and the Oregon
Marine Mammal Stranding Network (OMMSN) (S1 Table). Stranding reports including sex
identification were available for all but one individual, which was determined at NOAA-
SWFSC using genetic methods [71,72].
Standardizing blue whale skin sample preparation
Numerous studies show that two factors that are unrelated to ecology can alter isotope values
of metabolically active tissues. The first factor is tissue lipid content. Lipids have lower δ13C
values than associated carbohydrates and proteins [24,73,74]. Thus, the potential influence of
lipid content on bulk tissue δ13C values must be considered when using SIA to make ecological
inferences [24,75,76]. Chemical lipid-extraction removes the influence of lipids on bulk tissues,
but a side effect of this procedure is that it may affect δ15N values of tissues [75,76]. To evaluate
the effect of lipid-extraction on the isotope values of blue whale skin, five skin samples were
divided into two subsamples, one subsample was lipid-extracted with three ~24 hour soaks in
a 2:1 chloroform:methanol solvent solution, rinsed with ionized water and lyophilized. The
second subsample was simply lyophilized, and analyzed as bulk tissue.
The second factor that can alter tissue isotopic composition is how samples are preserved
prior to isotopic analysis. Ideally, all tissues would be stored frozen since freezing does not
alter isotope values [24,77–79]. Most of the skin samples selected for this study were stored fro-
zen prior to isotope analysis, but some (n = 100) were stored in a 20% salt saturated solution of
dimethyl sulfoxide (DMSO). Previous studies have shown that the effect of DMSO on the iso-
tope values of tissues can be removed via lipid-extraction [76,80,81]. To determine if this strat-
egy would work for blue whale skin samples preserved in DMSO, we selected 25 sloughed skin
samples from the GC (2005–2007). During field collection, each of these skin samples were
divided into two sections and preserved one of two ways for one year before they were pre-
pared for isotope analysis: the first set was preserved in DMSO and the second (control) set
was frozen in liquid nitrogen (-195˚C).
Stable isotope analysis
All skin and prey samples were lipid-extracted, lyophilized, and homogenized by grinding
them into a fine powder; as noted above the small set of subsamples that were analyzed to test
Blue whale skin isotopic incorporation rates and baleen growth rates
PLOS ONE | https://doi.org/10.1371/journal.pone.0177880 May 31, 2017 5 / 25
the effects of lipid-extraction were not lipid-extracted (bulk tissue). Baleen plates were cleaned
with a solution of 2:1 chloroform:methanol to remove surface contaminants. Sub-samples of
keratin powder were collected with a Dremel rotatory drill fitted to a flexible engraving shaft at
1 cm intervals along the outer edge of each baleen, starting at the proximal section inserted in
the gum (which represents the newest tissue) (Fig 2B). Baleen grows uniformly on the trans-
verse perspective at a constant (but unknown) rate; thus our sampling strategy would yield
equal time intervals between adjacent sub-samples [37,42–44,55,57,82]. Previous studies have
confirmed the consistency of isotope values along the length of two adjacent baleen plates of a
gray whale (Eschrichtius robusutu) [82] and two plates from opposing sides of the mouth of a
Fig 2. Methods for blue whale skin and baleen plate preparation. (A) Biopsy skin separation into strata: Stratum Basale (SB),
Stratum Spinosum (SS) Stratum Externum (SE). The dermal papillae (DP) can be observed embedded in the skin. Dashed lines show
were the cuts were made to separate the skin into stratums. (B) Blue whale baleen plate sampling: baleen powder was sub-sampled in
1 cm intervals along the outer edge of the plate starting from the proximal section of the plate nearest the gum.
https://doi.org/10.1371/journal.pone.0177880.g002
Blue whale skin isotopic incorporation rates and baleen growth rates
PLOS ONE | https://doi.org/10.1371/journal.pone.0177880 May 31, 2017 6 / 25

bowhead whale (Balaena mysticetus) [43]. Consequently, we assumed that each baleen pro-
vides a consistent record of the past foraging history for each blue whale. Lastly, we compiled
δ13C and δ15N data from the literature of blue whale prey from foraging zones in the northeast
Pacific (S2 Table).
Approximately 0.5–0.6 mg of each tissue sample (dried skin, baleen, and prey) was weighed
into a tin capsule. Carbon (δ13C) and nitrogen (δ15N) isotope values were measured with a Cost-
ech 4010 elemental analyzer coupled to Thermo Scientific Delta V isotope ratio mass spectrom-
eter at the Center for Stable Isotopes at the University of New Mexico (Albuquerque, NM).
Isotope data are reported as delta δ values, δ13C or δ15N = 1000 [(Rsample / Rstandard)—1],
where R = 13C/12C or 15N/14N ratio of sample and standard [83]. Values are in units of parts per
thousand or per mil (‰) and the internationally accepted standards are atmospheric N2 for
δ15N and Vienna-Pee Dee Belemnite limestone (V-PDB) for δ13C [83]. Within-run analytical
precision was estimated via analysis of two proteinaceous internal reference materials, which
was ±0.2‰ for both δ13C and δ15N values. We also measured the weight percent carbon and
nitrogen concentration of each sample and used the C/N ratio as a proxy of lipid content [84].
Statistical analysis
All statistical analyses were performed using R [85]. The effects of preservation (DMSO-lipid
extracted vs frozen-lipid extracted) and the different treatments (lipid-removal vs bulk tissue)
on skin δ13C, δ15N and C/N ratios were evaluated with a max-t test for multiple comparisons
of means. This procedure was chosen because it is designed to work in scenarios of unbalanced
group sizes, non-normality and heteroscedasticity [86]. The isotopic variability between skin
strata (basale, externum, sloughed skin) was also evaluated by using the max-t test, which has a
higher power to detect differences between group means compared to other methods [86].
These analyses were performed separately for each zone (GC and CCS) and isotope (δ13C or
δ15N). The CRD skin isotope values were excluded from this analysis as sloughed skin samples
were not available for this zone.
The prey data were used to establish the reference mean (±SD) baseline isotope values
within each zone, hereafter called the prey zone mean, which was estimated by pooling the
means and variances of all the data. The pooled prey zone mean for the GC included lantern-
fish and the krill species Nyctiphanes simplex, because molecular analysis of fecal samples has
shown that blue whales forage only on combined aggregations of both taxonomic groups in
this zone [14,20]. Lanternfish was the only teleost fish present in blue whale fecal samples [20].
In the CCS, we included isotope values of its main prey, the krill species Thysanoessa spiniferaand Euphausia pacifica [15,18]. In the CRD, diving behavior and the presence of whale fecal
samples confirmed that blue whales forage on patches of krill [17], however, the species of krill
was not identified, so we used previously reported data for krill in this zone [62].
Our approach to estimate the blue whale skin isotopic incorporation rate was to mimic a
diet switch in controlled feeding experiments, but at population level (sampling the same indi-
vidual whale across its annual migratory cycle is logistically impossible). Blue whales in the
northeast Pacific are ideal for this approach because they feed year-round and seasonally
migrate between zones that have distinct baseline isotope values [28,31,58,62,64,87]. To
achieve this, first we evaluated if blue whale skin δ13C and δ15N values exhibited seasonal
trends in the GC (Jan-Apr) and the CCS (Jun-Dec). Sampling effort within each zone was not
homogeneous for all years, thus blue whale skin samples collected in different years were inte-
grated into a single analysis. We assessed the seasonal trend by fitting a generalized additive
model (GAM) of the skin δ15N and δ13C values as functions of time (Julian day, which ranges
from 1 to 365). This was done separately for each skin stratum (basale, externum, and sloughed
Blue whale skin isotopic incorporation rates and baleen growth rates
PLOS ONE | https://doi.org/10.1371/journal.pone.0177880 May 31, 2017 7 / 25

skin) in both foraging zones (GC and CCS). We used GAMs because they are especially useful
when the functional form of the relationship between the response (e.g. δ15N and δ13C values)
and explanatory variables (e.g. time) is unknown [88]. GAMs were fitted using the “mgcv”
package in R [85,89]. To model the main trend of the data, the smoothing parameters (degrees
of freedom) were set to three. This conservative approach can be applied when sample size is
low [90]. Blue whale skin strata δ13C did not show seasonal trends (see Results and S1 Fig),
therefore, the isotopic incorporation rate was only estimated for skin δ15N.
To compare the δ15N values of the three skin strata to potential prey, we assumed a trophic
discrimination factor (Δ15N) of 1.6‰, based on controlled feeding experiments on captive bot-
tlenose dolphins (Tursiops truncatus) [47,48], and calculated the trophic-corrected mean blue
whale skin values for each zone by adding this trophic discrimination factor to the prey zone
mean values. These trophic-corrected skin values would represent the expected mean δ15N val-
ues if blue whale skin had fully equilibrated with that of local prey (or reached steady-state iso-
topic equilibrium), and we assumed that this method would allow us to assign any given blue
whale skin isotope value to a specific foraging zone.
Based on the gradient in the prey mean isotope values for each foraging zone (GC>CCS>
CRD; S2 Table), and the trophic-corrected blue whale skin values (see Results), our hypothesis
was that blue whales would arrive to the GC with lower skin δ15N values due to consumption
of prey in the CCS and CRD. Skin isotope values would then increase throughout the winter
season as they equilibrate with local prey (see Results). In contrast, most whales would arrive
in the CCS with higher skin isotope values, except for individuals that migrated from the CRD.
Thus, we predicted that skin isotope values would decrease throughout the summer season as
skin isotopically equilibrated with the local prey in the CCS. Therefore, we used the GAMs sea-
sonal predictions to estimate the isotopic incorporation rate for each skin stratum, as the days
that it would take for the skin δ15N to increase (GC) or decrease (CCS) by the assumed trophic
discrimination factor (Δ15N = 1.6‰) to reach isotopic equilibrium with the local diet. This
period was derived by extrapolating from the distance between the predicted extremes in δ15N
for each stratum, from the lowest to the highest in the GC and vice versa for the CCS (S3
Table, S2 Fig). In this case, we assumed that the equivalent to the diet switch stage would be
the lowest initial δ15N value within the GC and the highest initial δ15N value in the CCS (S2
Fig). We used the same method with the 95% upper and lower confidence intervals to assess
uncertainty (S3 Table, S2 Fig). Unfortunately, the uncertainty associated to individual variabil-
ity in isotopic incorporation rates given the potential variation in individual arrival and depar-
ture times to/from the GC and CCS, could not be considered in the model.
Due to sample size limitations, we had to integrate all the skin data collected in different
years into a single seasonal model to estimate blue whale δ15N isotopic incorporation rate.
This assumes that the relative difference in prey δ15N values between foraging zones is consis-
tent across years, which has been suggested in previous studies [58,91]. We evaluated this
assumption by fitting a generalized linear model (GLM) of skin δ15N values as a function of
time (Julian Date, or date of sample collection). Julian Dates are a continuous count of days
based on a standard starting point, which we chose as January 1, 1970 (Universal Time, Coor-
dinated). This analysis was made separately for each foraging zone (GC, CCS and CRD) by
using all skin strata, which allowed us to evaluate the trends in skin δ15N across years in each
zone. The GLMs were fitted by using the “glm” function in R [92].
Oscillations in δ13C and δ15N values of baleen plates were also evaluated with a GAM
model and smoothing parameters were selected by standard data-driven methods for time
series using Akaike Information Criteria [93,94]. Similar to skin, baleen δ13C values were not
distinct among foraging zones (see Results and S3 Fig), consequently growth rates were esti-
mated using δ15N values. Blue whale baleen growth rate was determined by assuming that the
Blue whale skin isotopic incorporation rates and baleen growth rates
PLOS ONE | https://doi.org/10.1371/journal.pone.0177880 May 31, 2017 8 / 25

oscillation in δ15N values along the total length of the outer edge of the baleen plates represent
the annual movement between winter/spring and summer/fall foraging grounds. Thus, the
distance between two sequential δ15N minimums represents the growth of the baleen plate
during a single year [37,42–44,55]. Additionally, to characterize the movement of whales
among isotopically distinct foraging zones, we compared baleen δ15N values with the trophic-
corrected δ15N values for each foraging zone based on the same Δ15N used in the skin analysis
[47,48].
Results
Blue whale skin isotope values are available in S1 Dataset. The max-t test results comparing the
effect of different treatments (bulk tissue vs lipid-extracted; frozen vs DMSO) on skin δ15N,
δ13C and C/N ratios are presented in S4 Table. Lipid-extracted skin (-16.5±0.1) had mean δ13C
values that were significantly higher (1.9‰) than bulk skin samples (-18.4±0.4; t = -10.4, p =<
0.001), and the weight percent C/N ratios of bulk skin were significantly higher (4.2±0.1)
than lipid extracted samples (3.2±0.0; t = 12.9, p =<0.001). In contrast, skin δ15N values did
not differ significantly between lipid-extracted (14.6±0.3) and bulk skin (14.5±0.3; t = -0.4,
p = 0.7). Lastly, δ15N, δ13C, and C/N ratios of skin samples stored in DMSO (δ15N: 13.9±0.9;
δ13C: -16.9±0.5; C/N: 3.0±0.2) did no differ significantly from skin stored frozen (δ15N: 14.0±0.9; δ13C: -16.9±0.6; C/N: 3.0±0.2); δ15N: t = 0.2, p = 0.8; δ13C: t = 0.2, p = 0.8; C/N: t = -0.4,
p = 0.7.
The max-t test results comparing the δ15N and δ13C values among skin strata (basale, exter-
num and sloughed skin) in each zone (GC and CCS) are shown in S5 Table. Skin δ15N and
δ13C did not differ significantly between different skin strata within the GC (S5 Table). In the
CCS, mean δ15N values of sloughed skin (13.6±0.7‰) and stratum externum (13.4±1.1‰) did
not differ significantly (t = -0.4, p = 0.7), and both of these strata had slightly but significantly
higher δ15N (stratum externum: t = 2.6, p =<0.001; sloughed skin: t = -4.9, p =<0.001) than
the stratum basale (13.0±0.8‰). δ13C values did not differ significantly among strata in the
CCS (S5 Table).
The GLM model of blue whale skin δ15N values as a function of time (Julian Date) was not
significant in the CRD (1999–2003; S6 Table, S4 Fig). Conversely, the relationship between
these variables was significant and positive in the GC and the CCS (S6 Table, S4 Fig). The
GLM model predicts an overall increase of 1.2‰ over 15 years (1996–2011) in the CCS, and
an increase of 0.8‰ over 13 years (2002–2015) in the GC (S6 Table, S4 Fig); overall, these shifts
results in a 0.1‰ increase per year in each zone. Thus, skin δ15N values showed a slight and
consistent trend in both zones, therefore the gradient in δ15N values between zones would also
remain constant. This result would validate the integration of blue whale skin δ15N values in a
single seasonal GAM model to infer skin δ15N isotopic incorporation rate for each zone.
Skin isotopic incorporation and baleen growth rates
Prey from the three zones had distinct δ15N values (S2 Table), with values decreasing from the
GC to the CCS and CRD. The trophic-corrected blue whale skin δ15N values for each foraging
zone are presented in Table 1. The magnitude of differences in prey between these zones ran-
ged from 1.9‰ to 6.1‰ (S2 Table), which allowed us to assign the origin of measured δ15N
values of the different blue whale skin strata, independently of the zone where whales were
sampled (Table 1, Fig 3).
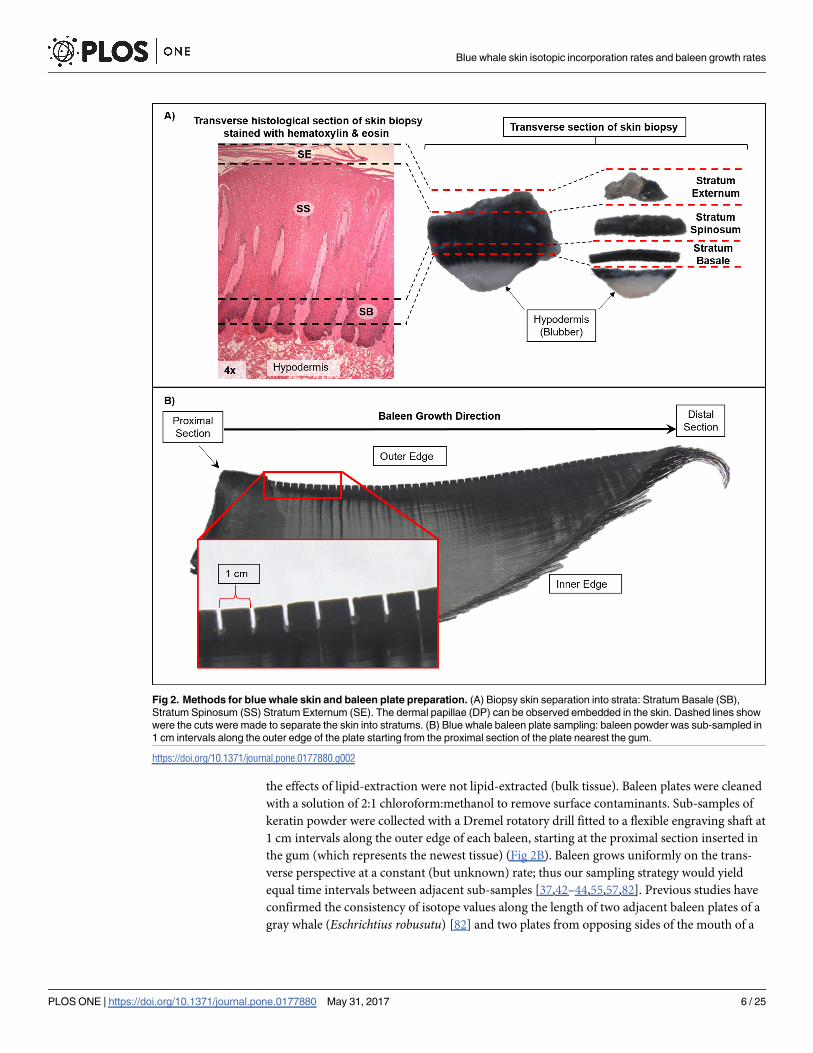
The GAM results of the relationship between blue whale skin δ15N values and time (sea-
sonal trend) are shown in Table 2. The GAM that used δ15N values in blue whale skin stratum
basale and externum in relation to time indicated a weak, but slightly significant positive
Blue whale skin isotopic incorporation rates and baleen growth rates
PLOS ONE | https://doi.org/10.1371/journal.pone.0177880 May 31, 2017 9 / 25

relationship in the GC, and a weak, but slightly significant negative relationship for the CCS
(Table 2, Fig 3). These relationships were anticipated based on the observed pattern in prey
δ15N values among zones and the trophic-corrected blue whale skin values for each foraging
zone (Table 1, S2 Table). For samples collected in the GC, δ15N values increased to ~17‰ by
April (Fig 3), which likely reflected isotopic equilibration with the δ15N of local prey (Table 1).
The opposite pattern was observed in the CCS, were the δ15N values decreased with time to a
low of ~13‰ by December (Fig 3), which also suggests gradual equilibration of the tissue to
the local prey. In contrast, the relation between sloughed skin δ15N values and time was not
significant in the GC or CCS (Table 2). The GAM model for sloughed skin showed a parabolic
relationship with time, with a slight tendency of the δ15N values to increase and subsequently
decrease with time in both zones (Fig 3). Therefore, we used the same method than that for the
stratum basale and externum within each zone to estimate the isotopic incorporation rate of
sloughed skin (S2 Fig).
The CRD skin δ15N values were used as a reference to determine if the isotopic signal of
this foraging zone was present in the skin sampled in the GC and the CCS. Some of the
observed δ15N values in the stratum basale and stratum externum from skin sampled in the
CCS could represent transitional values between the CRD isotopic signal and the CCS signal.
One of the values observed in the stratum externum sampled in August was assigned to the
CRD (Fig 3).
The deviance explained in the relationship between skin δ15N values and time for all six
GAM models was low (6.7 to 21.1%; Table 2) due to the high degree of dispersion observed in
skin data. This degree of variation was expected since the duration of time individual whales
had spent in the zone where skin was collected was unknown at the time of sampling. As such,
this variation is likely driven by a combination of recently arrived whales that had isotope val-
ues reflective of other foraging zones, individuals in the equilibration period with intermediate
isotope values that represent a mixture of prey consumed in two foraging zones, or individuals
that had reached skin steady-state isotopic equilibrium with the isotopic composition of local
prey (Fig 3).
Estimates of δ15N isotopic incorporation rate of blue whale skin strata in each foraging
zone are shown in Table 3 and S3 Table. In the GC, the stratum basale (81 d), stratum exter-
num (81 d), and sloughed skin (90 d) had similar incorporation rates (Table 3). In the CCS,
the stratum basale had longer incorporation rates (262 d) than the stratum externum (192 d).
Sloughed skin (272 d) had the lowest isotopic incorporation rate in CCS, although the later
estimate had a high degree of uncertainty (Table 3). The average skin strata isotopic incorpo-
ration rate in the CCS (242 d) was 158 days lower than the GC (84 d) (Table 3). The overall
mean of the δ15N isotopic incorporation rate of blue whale skin was estimated, integrating all
strata in both zones (163 d, Table 3).
Blue whale baleen isotope values are available in S1 Dataset and S7 Table. Stranding infor-
mation of baleen plates collected from six blue whales (A to F), is presented in S1 Table and
Table 1. Trophic-corrected blue whale skin δ15N values for each foraging zone.
Zone Prey zone mean (±SD) δ15N Δ15N Trophic-corrected blue whale skin δ15N
Gulf of California 14.6±1.0 1.6 16.2±1.0
California Current
System
10.4±0.3 1.6 12.0±0.3
Costa Rica Dome 8.5±1.1 1.6 10.1±1.1
Values were estimated by using the prey zone mean±SD (S2 Table) and assuming Δ15N of 1.6‰.
https://doi.org/10.1371/journal.pone.0177880.t001
Blue whale skin isotopic incorporation rates and baleen growth rates
PLOS ONE | https://doi.org/10.1371/journal.pone.0177880 May 31, 2017 10 / 25
Fig 3. GAM analysis of the seasonal trend of skin strata δ15N values in two foraging zones. The points represent the
actual δ15N values of skin collected from whales within the Gulf of California (open circles) and the California Current
System (open triangles). The colored lines represent the GAM model fit (predictions) and the fringe around the lines show
the 95% confidence intervals. The gray shaded area represents the mean±SD of the trophic-corrected blue whale skin
values for each foraging zone: Gulf of California (GC), the California Current System (CCS) and the Costa Rica Dome
(CRS).
https://doi.org/10.1371/journal.pone.0177880.g003
Blue whale skin isotopic incorporation rates and baleen growth rates
PLOS ONE | https://doi.org/10.1371/journal.pone.0177880 May 31, 2017 11 / 25

Fig 1. The results of the GAM models to assess the fluctuations in δ15N values along baleen
plates, and of baleen growth rates estimations are shown in Tables 4 and 5, respectively. The
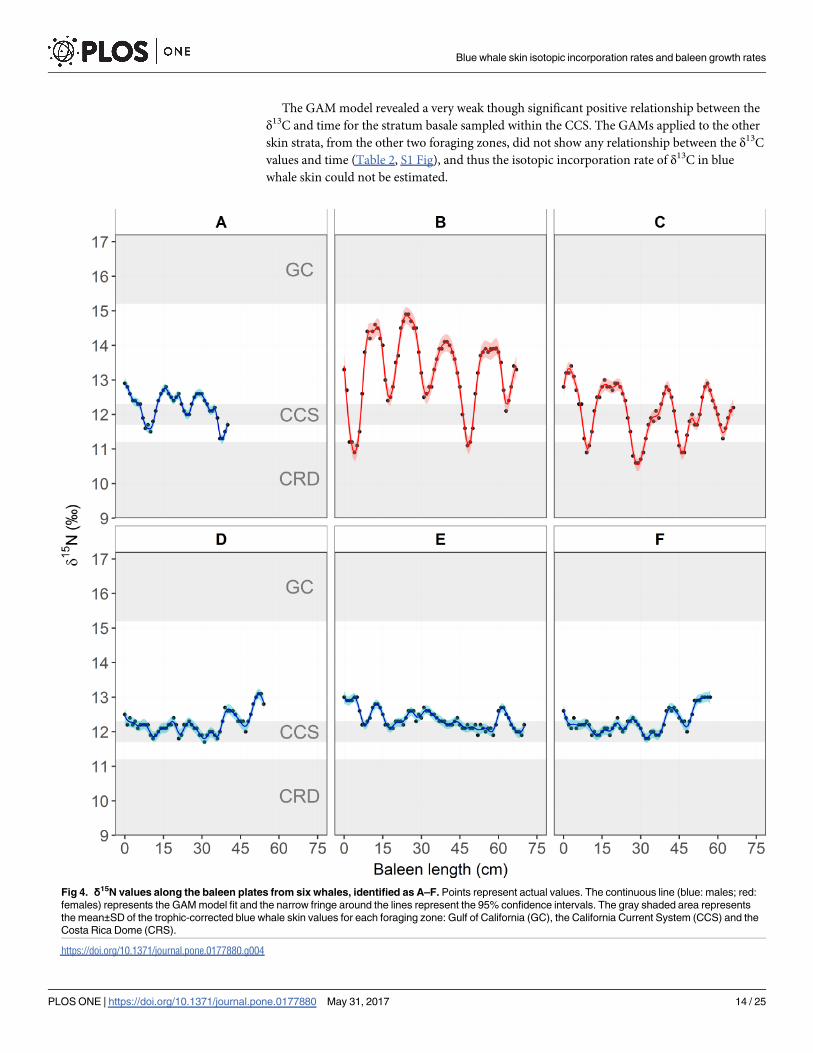
GAM fit showed that the amplitude of the oscillations differed among individuals (Tables 4
and 5, Fig 4). Three baleen plates (A–C, one male and two females; S1 Table) exhibited the
expected fluctuations in δ15N ranging from 10.6‰ to 14.9‰ (Fig 4A–4C), and the length of
baleen between these fluctuations ranged between 13 and 19 cm (Table 5). The other three
baleen plates (D–F, all males; S1 Table) maintained relatively constant δ15N values, ranging
between 11.7‰ and 13.1‰ along the plate (Fig 4D–4F). Inter-individual differences in the
amplitude of the oscillations are likely related to the individual migratory strategies and resi-
dency time within each foraging zone [37,38,43,55]. By using the trophic-corrected skin δ15N
values based on that of prey (Table 1), it was possible to associate these oscillations with the
potential foraging zone that each individual whale visited. From these data, it could be inferred
that whale B moved between all three zones, showing relatively regular cycles (Fig 4B), whereas
whale C did not enter the GC, but moved constantly between the CCS and the CRD, in less
Table 2. GAM results for the seasonal trends of δ15N and δ13C values in different skin strata sampled in the Gulf of California (GC) and California
Current System CCS).
Isotope Skin stratum Zone n E.df. F Adjusted R2 P Deviance explained (%)
δ15N Basale GC 101 1.9 13.4 0.2 < 0.001 21.1
Basale CCS 120 1.0 8.4 0.6 < 0.01 6.7
Externum GC 85 1.9 7.4 0.1 < 0.01 14.7
Externum CCS 63 1.0 5.5 0.1 < 0.1 8.3
Sloughed skin GC 81 1.8 3.3 0.1 0.7 7.7
Sloughed skin CCS 93 1.8 2.6 0.0 0.7 6.7
δ13C Basale GC 101 1.0 0.2 -0.0 0.7 0.2
Basale CCS 120 1.9 3.6 0.1 < 0.1 6.2
Externum GC 85 1.5 1.3 0.1 0.4 2.8
Externum CCS 63 1.5 0.6 0.0 0.6 2.8
Sloughed skin GC 81 1.0 1.3 0.0 0.3 1.6
Sloughed skin CCS 93 1.0 0.1 -0.0 0.8 0.1
E.df., Estimated degrees of freedom; F, test of whether the smoothed function significantly reduces model deviance; P, p-values in bold were considered
statistically significant (<0.05).
https://doi.org/10.1371/journal.pone.0177880.t002
Table 3. δ15N isotopic incorporation rates of blue whale skin strata in the Gulf of California and California Current System. The number of days
were estimated by extrapolating from the GAM predictions (model fit and the upper and lower 95% confidence limits) for skin δ15N values to change by 1.6‰
to isotopically equilibrate with local prey in each zone.
Zone Skin Stratum δ15N isotopic incorporation rate of blue whale skin
Model fit Lower limit Upper limit
Gulf of California Basale 81 90 69
Externum 81 112 69
Sloughed Skin 90 60 149
Mean±SD 84±5
California Current System Basale 262 222 360
Externum 192 160 240
Sloughed Skin 272 163 816
Mean±SD 242±44
Overall Mean±SD 163±91
https://doi.org/10.1371/journal.pone.0177880.t003
Blue whale skin isotopic incorporation rates and baleen growth rates
PLOS ONE | https://doi.org/10.1371/journal.pone.0177880 May 31, 2017 12 / 25

regular cycles (Fig 4C). Whale A remained mainly within the CCS, potentially only migrating
twice to the CRD (Fig 4A). In the case of whales D, E and F, the data suggests that these indi-
viduals remained within the CCS, throughout several years (Fig 4D–4F). Only whales A, B,
and C were used to estimate the baleen growth rates (Fig 4A–4C). The mean (±SD) growth per
year of baleen plates was estimated for each whale (A = 13.5±2.2; B = 14.8±1.7; C = 17.5±1.5
cm y-1; Table 5), and also integrated in an overall mean (±SD) (15.5±2.2 cm y-1; Table 5).
δ13C values of skin and baleen plates
The mean δ13C value of the prey in the GC was 0.7‰ and 2.9‰ higher than the CCS and the
CRD, respectively (S2 Table). However, the standard deviation of the CRD overlapped with all
the zones and it was not possible to accurately assign the origin of measured δ13C from skin
nor baleen plates.
Table 4. GAM results to assess the fluctuations of δ15N and δ13C in baleen plates.
Isotope Baleen code n E.df. F Adjusted R2 P Deviance explained (%)
δ15N A 41 23.8 61.4 1 < 0.001 99.0
B 68 27.2 108.0 1 < 0.001 98.7
C 67 27.3 95.9 1 < 0.001 98.6
D 55 23.3 25.2 0.9 < 0.001 95.7
E 71 26.5 27.2 0.9 < 0.001 94.8
F 58 23.8 31.3 0.9 < 0.001 96.3
δ13C A 41 21.9 55.8 1 < 0.001 98.8
B 68 20.3 15.6 0.9 < 0.001 89.3
C 67 27.7 64.9 1 < 0.001 98.0
D 55 24.9 68.4 1 < 0.001 98.5
E 71 27.5 65.1 1 < 0.001 97.8
F 58 25.0 25.1 0.9 < 0.001 95.7
E.df., Estimated degrees of freedom; F, test of whether the smoothed function significantly reduces model deviance; P, p-values in bold were considered
statistically significant (<0.05).
https://doi.org/10.1371/journal.pone.0177880.t004
Table 5. Blue whale baleen growth rate: Estimated by using the distance between sequential δ15N
minimums along the baleen plates from whales A to C.
Baleen code Sex Intervals between δ15N minimums (cm) Growth rate (cm y-1)
A Male 10–24 14.0
24–37 13.0
Mean±SD 13.5±0.7
B Female 4–17 13.0
17–31 14.0
31–48 17.0
48–63 15.0
Mean±SD 14.8±1.7
C Female 9–27 18.0
27–46 19.0
46–62 16.0
Mean±SD 17.5±1.5
Overall Mean±SD 15.5±2.2
https://doi.org/10.1371/journal.pone.0177880.t005
Blue whale skin isotopic incorporation rates and baleen growth rates
PLOS ONE | https://doi.org/10.1371/journal.pone.0177880 May 31, 2017 13 / 25
The GAM model revealed a very weak though significant positive relationship between the
δ13C and time for the stratum basale sampled within the CCS. The GAMs applied to the other
skin strata, from the other two foraging zones, did not show any relationship between the δ13C
values and time (Table 2, S1 Fig), and thus the isotopic incorporation rate of δ13C in blue
whale skin could not be estimated.
Fig 4. δ15N values along the baleen plates from six whales, identified as A–F. Points represent actual values. The continuous line (blue: males; red:
females) represents the GAM model fit and the narrow fringe around the lines represent the 95% confidence intervals. The gray shaded area represents
the mean±SD of the trophic-corrected blue whale skin values for each foraging zone: Gulf of California (GC), the California Current System (CCS) and the
Costa Rica Dome (CRS).
https://doi.org/10.1371/journal.pone.0177880.g004
Blue whale skin isotopic incorporation rates and baleen growth rates
PLOS ONE | https://doi.org/10.1371/journal.pone.0177880 May 31, 2017 14 / 25

Mean (±SD) δ13C values of six baleen plates (A–F) are presented in S7 Table. The GAM fits
(Table 4, S3 Fig) showed that all individuals presented small oscillations in the δ13C values
along the baleen that ranged between -18.3 to -16.1. These oscillations could not be linked to
the foraging zones because of the overlap in prey δ13C among zones (S2 Table). Therefore,
baleen growth rates were inferred only using baleen δ15N values.
Discussion
Influence of lipid-extraction and DMSO preservation on skin δ13C and
δ15N values
Our results suggest that lipid-extraction is necessary to remove biases in skin δ13C values asso-
ciated with lipid content (S4 Table), which agrees with previous studies on mysticetes [75,76].
In regard to the effects of lipid-extraction on δ15N values of cetacean skin, some authors
[48,75,76] recommend analyzing bulk tissues because lipid-extraction can influence δ15N val-
ues, although this effect varied between species [75,76] and tissues [75]. In our study, we only
compared the δ15N of five biopsy samples from which we analyzed paired bulk and lipid-
extracted subsamples; however, δ15N values between these treatments did not differ signifi-
cantly, which would be in accordance with the results reported for other marine organisms
[95]. With regard to preservation in DMSO (S4 Table), after lipid-extraction, blue whale skin
δ13C, δ15N and C/N ratios of samples preserved in DMSO were similar to those of samples pre-
served frozen. Our results concur with previous studies that show lipid-extraction via a 2:1
chloroform:methanol solvent solution was a sound method for removing the combined effect
that DMSO and tissue lipid content have on skin δ13C values [76,81].
Skin δ15N isotopic incorporation rates
Only two studies have estimated isotopic incorporation rates of cetacean skin, and both uti-
lized controlled feeding experiments on captive bottlenose dolphins [47,48]. Our approach
was to use gradients in baseline δ15N values between the GC and CCS as a natural diet switch
experiment (Fig 3). Our mean estimate of δ15N isotopic incorporation rates (163±91 d;
Table 3) for blue whale skin is similar to that observed in the longest experiment on captive
bottlenose dolphins (180±71 d) [48]. The similarity in incorporation rate estimates for these
two distantly related cetacean species that differ in weight by over two orders of magnitude is
striking, but suggests that these estimates can be applied to other odontocetes and mysticetes.
We found that isotopic incorporation rates varied among skin strata and foraging zones
(Table 3); however, all of these estimates fell within the range of those observed for bottlenose
dolphins in previous studies (106–275 d and ~60–90 d)[47,48]. It is possible that the observed
variation in skin incorporation rates among zones could be influenced by water temperature
[10,96–100], with higher rates in the warmer waters of GC in comparison to the CCS (Table 3).
In cold waters, marine mammals reduce peripheral blood flow to maintain a constant internal
body temperature, which results in a decrease of epidermal metabolism [101–103]. In contrast,
incursion into warmer waters accelerates the turnover of superficial skin cells and increase the
proliferation rate of cells by intensifying blood flow to the skin stratum basale [104]. Observa-
tions suggest that odontocetes, such as belugas (Delphinapterus leucas) [104] and killer whales
(Orcinus orca) [105], move from colder to warmer waters to molt or promote skin regeneration.
A study on blue whales in the GC and CCS found that at sites with lower water temperatures,
sloughed skin was observed less often in comparison to warmer sites [67].
A novel aproach in this study was to analyze different skin strata: basale, externum, and
sloughed skin (Figs 2A and 3). We hypothesised that the different skin strata could provide
Blue whale skin isotopic incorporation rates and baleen growth rates
PLOS ONE | https://doi.org/10.1371/journal.pone.0177880 May 31, 2017 15 / 25

information about temporal shifts in diet. The stratum basale, where cells are constantly
produced, would most likely reflect the most recent dietary information, while the isotopic
composition of stratum externum and sloughed skin would record information of the diet
consumed in the past, perhaps when individuals were in a different foraging zone than the one
where skin samples were collected. The isotopic comparison of strata in the CCS supports this
hypothesis since the stratum basale had significantly lower δ15N values than the stratum exter-
num and sloughed skin (S5 Table), suggesting that the stratum basale was equilibrating with
local prey, characterized by lower δ15N values than those which occur in the GC (Table 1,
S2 Table). In the GC, skin strata did not have significantly different δ15N values; however,
sloughed skin had δ15N values that were similar to those expected if the skin was grown in the
CCS (Table 1, Fig 3), suggesting that sloughed skin samples have a higher probability of pro-
viding information about past diets. Thus, skin samples collected from migratory mysticetes
can reflect information about past diets independent of where sampling occurs, demonstrating
that skin is a valuable tissue to estimate relative contributions of food consumed in different
foraging zones utilized during the annual life cycle. Since collecting skin from free ranging
cetaceans is cost- and time-intensive, we recommend dividing skin biopsies into strata and col-
lecting sloughed skin when available to increase the amount of information that can be gleaned
from isotope analysis of this tissue.
Baleen growth rates
Our estimate of baleen growth rates for blue whales (~15.5±2.2 cm y-1; Table 5) are consistent
with previous estimates for other balaenopterids, such as the fin whale (Balaenoptera physalus,20±2.6 cm y-1) [37,55], and minke whale (Balenoptera acutorostrata, 12.9 cm y-1) [57], as well
as for other mysticetes such as bowhead whales (16–25 cm y-1 in adults) [42,43]. In contrast,
baleen growth rate estimates were lower than those for southern right whales (Eubalaena aus-tralis, ~27 cm y-1) [44]. Variation in baleen growth rates among blue whales sampled in this
study (Table 4) could be influenced by differences in individual movement strategies (Fig 4A–
4C), a hypothesis proposed in previous studies of other mysticete species [37,38,43,55]. For
example, variation in the period of time spent within a specific foraging zone or in migration
between zones would produce wider or narrower oscillations in baleen δ15N, which would
influence growth rate estimates (Table 5, Fig 4).
Three of the six baleen plates we analyzed did not show marked oscilations in the δ15N val-
ues (Fig 4D–4F). These individuals were males: two adults, and one of unknown age class (S1
Table). A potential explanation for a lack of inter-annual variation in δ15N is that these whales
remained close or within the CCS foraging zone for several years prior to their death. By apply-
ing the mean annual growth rate of ~15.5 cm y-1 to the baleen records of these three males,
they remained within the CCS ecosystems for ~3.5 (Fig 4D), ~4.5 (Fig 4E) and ~3.7 (Fig 4F)
years. In contrast, the other three baleen plates, collected from one male and two females,
exhibited oscillations in the δ15N values along their outer edge that indicate cyclical migrations
between foraging zones during ~2.5 (Fig 4A), ~4.3 (Fig 4B) and ~4.2 (Fig 4C) years.
The observed differences in movement strategies of blue whale individuals may be influ-
enced by a combination of the following factors. One general explanation is related to changes
in the availability of prey in different foraging zones because it is known that blue whale distri-
bution is influenced by variations in the abundance of their primary prey [2,3]. A more specific
explanation is that females are more likely to migrate to warmer waters in winter/spring to
nurse their calves, a hypothesis that has been proposed for other mysticetes, although other
mysticetes generally do not feed while on their winter/spring breeding grounds [106]. More-
over, the patterns in the baleen of whale C (Fig 4C) suggest a high fidelity of females to
Blue whale skin isotopic incorporation rates and baleen growth rates
PLOS ONE | https://doi.org/10.1371/journal.pone.0177880 May 31, 2017 16 / 25

returning to specific winter/spring foraging grounds year after year. This would be in accor-
dance with the high site fidelity observed in GC of some well-identified females obtained via
photo-identification and genetic analysis [9,11,107]. In the case of males, our data indicate
three males remained in the CCS and one migrated twice to the CRD (Fig 4). The female:male
sex ratio (1.4:1) in the GC is biased towards females [9,107], suggesting that only a portion of
the males in the northeast Pacific are using this zone in winter/spring. Photo-identification
data has also shown that some males have a high site fidelity to the GC [9] or possibly other
winter/spring foraging grounds. Baleen isotope data from one male in our study also indicates
that it had a high fidelity to the CRD, since it migrated only to this zone (Fig 4A). Blue whales
are not frequently sighted in the CCS during winter and spring [108,109], although this could
be attributed to low search effort during this season. However, vocalizations specific to male
blue whales have been recorded year round in the CCS [110–113]. The baleen data of males D,
E, F (Fig 4D–4F) is in agreement with this observation. Therefore, we hypothesize that there
are two migratory strategies for blue whale males in the northeast Pacific. Some individuals
migrate to winter/breeding grounds in the GC or CRD, while others remain within the CCS.
How these two migratory strategies influence mating success for males is not known.
δ15N trophic discrimination factors
δ15N trophic discrimination factors have not been estimated for blue whale tissues, therefore
our approach was to assume a 1.6‰ (Table 1) discrimination factor between whales and their
prey based on the controlled feeding experiments on bottlenose dolphins [47,48]. Borrell et al.[114] suggested using a trophic discrimination factor of 2.8‰ for balaenopterid skin and
baleen plates. However, the mean (±SD) baleen δ15N value of the three male blue whales (D:
12.2±0.3; E: 12.4±0.3; F: 12.3±0.4; S7 Table, Fig 4D–4F) that presumably remained within the
CCS for ~2–3 years prior to death, and by extension were isotopically equilibrated with local
food sources, were enriched by only 1.7–1.9‰ relative to local prey sources (10.5±0.2; S2
Table), and is similar to estimates for skin of captive bottlenose dolphins (1.6±0.5‰) [47,48].
Temporal consistency of baseline δ15N values among foraging zones
The observed seasonal trend in skin δ15N values within each zone and the oscillations along
baleen plates support our hypothesis that these tissues record baseline shifts in nitrogen iso-
tope values across the northeast Pacific. Our approach assumes that such baseline gradients
are temporarily consistent at a decadal scale. To test this assumption, it would be ideal to have
prey δ15N data from each foraging zone for each year blue whales were sampled; however,
such sampling resolution is logistically impossible. Our approach was to use a GLM to evaluate
inter-annual trends in skin δ15N values, which showed that they slightly increased in the GC
and CCS (see Results); no evident trend was observed in the CRD (S6 Table, S4 Fig).
Published datasets show that isotope values of blue whale prey and zooplankton collected
from the CCS were consistent over decadal timescales (1994, 2000–2001, 2013) and between
sites (Monterey Bay and British Columbia) [60,61,63,64,115]. Moreover, the δ15N values in
blue whale baleen plates that were assigned to the CCS show a remarkably consistent pattern
regardless of when the baleen was collected (1980s vs. 2000s; S1 Table, Fig 4). These patterns
suggest that a relatively stable δ15N baseline existed in the CCS for nearly three decades. Fur-
thermore, these data suggest that the slight inter-annual increase in skin δ15N values of blue
whales in the CCS is likely the result of uneven seasonal sampling rather than a shift in the
baseline.
δ15N values of the dominant krill species (Nyctiphanes simplex) in the GC are variable, likely
due to their omnivorous feeding behavior [116], but are consistently higher than krill in the
Blue whale skin isotopic incorporation rates and baleen growth rates
PLOS ONE | https://doi.org/10.1371/journal.pone.0177880 May 31, 2017 17 / 25

CCS and the CRD (S2 Table) [58–62,64,117,118]. Isotope data for potential blue whale prey
from the CRD were only available from one study (S2 Table) [62], but zooplankton data also
suggest that this zone has lower δ15N values in comparison to the CCS and GC [65]. Addition-
ally, baleen δ15N patterns from whales that likely visited the CRD (Fig 4A–4C) indicate that
baseline δ15N values may be consistently lower than those of the other zones. Another factor
that may contribute to the observed differences in δ15N values among foraging zones is that
blue whales in the GC forage on combined aggregations of krill and higher trophic level lan-
ternfish [20]. Thus, blue whale tissues synthetized in the GC will have higher δ15N values that
result from a combination of baseline and diet factors relative to tissues grown in other forag-
ing zones in the northeast Pacific (Table 1, S3 Table, Figs 3 and 4).
δ13C values in blue whale skin and baleen plates
δ13C incorporation rates for skin could not be estimated because of the similarity in δ13C val-
ues among prey from different foraging zones (S2 Table), and by extension δ13C values were
not useful to estimate baleen growth rates. Another variable that could contribute to the lack
of spatial signal in δ13C is movement of blue whales between coastal 13C-enriched and 13C-
depleted oceanic ecosystems [24] within a specific foraging zone [2]. Thus, any latitudinal
variation in blue whale skin and baleen δ13C values between the CCS, GC, and CRD may be
obscured by longitudinal movement between coastal and offshore areas within foraging zones.
Conclusions
Blue whale skin isotopic incorporation rates and baleen growth rates are similar to other odonto-
cetes and mysticetes, respectively. We recommend collecting skin samples throughout the sea-
sonal residency of migratory mysticetes within specific foraging zones, and dividing skin biopsies
into strata. This approach allows for an assessment of seasonal variation in isotope values that
could provide insights into movement and/or shifts in seasonal foraging strategies. Furthermore,
analyzing both skin and baleen can provide information on the inter-annual variation in prey iso-
tope values within and among foraging zones, as well as provide information about the migratory
strategies of individual whales over several years of life, that currently cannot be obtained from
satellite telemetry tags that (at best) collect a single year of movement information [2].
Supporting information
S1 Fig. GAM analysis relating skin δ13C values to Julian day (presented in months). The points
represent the actual δ13C values of skin collected from whales within the Gulf of California (open
circles) and the California Current System (open triangles). Lines represent the fit (projections) of
the GAM model and the fringe around the lines show the 95% confidence intervals.
(TIF)
S2 Fig. Sections used from the GAM model predictions to infer δ15N isotopic incorpo-
ration rates of blue whale skin strata in each foraging zone. The lines represent the GAM
model fit (predictions) in the Gulf of California (green) and the California Current System
(blue). The fringe around the lines show the 95% confidence intervals. The black dot repre-
sents the initial point (i.e. diet switch) and the red dot the final point of the sections from the
predictions that were used from the fit and the lower and upper confidence intervals. Per mil
(‰) differences and days passed between points were estimated and then used to extrapolated
to a 1.6‰ increase in the Gulf of California, or decrease in California Current System, for skin
to reach steady-state isotopic equilibrium with the local prey isotopic signal.
(TIF)
Blue whale skin isotopic incorporation rates and baleen growth rates
PLOS ONE | https://doi.org/10.1371/journal.pone.0177880 May 31, 2017 18 / 25
S3 Fig. δ13C values along the baleen plates from six whales, identified as A-F. Points repre-
sent actual values, the continuous line (blue: males; red: females) represents the GAM model
fit and the fringe around the lines show the narrow 95% confidence intervals.
(TIF)
S4 Fig. GLM analysis relating skin δ15N values to time (Julian date, presented in years).
Points represent the actual δ15N values of blue whale skin collected in different zones of the
northeast Pacific. Lines represent the fit of the GLM model and the fringe around the lines
show the 95% confidence intervals. The gray shaded area represents the meand±SD of the tro-
phic-corrected blue whale skin values for each foraging zone; Gulf of California (GC), Califor-
nia Current System (CCS), and Costa Rica Dome (CRD).
(TIF)
S1 Table. Information of baleen plates collected from six blue whales.
(DOCX)
S2 Table. Mean (±SD) δ13C, δ15N, and weight percent C/N ratios of potential blue whale
prey from each of the three foraging zones in the northeast Pacific.
(DOCX)
S3 Table. Results from the GAM model sections used to infer δ15N isotopic incorporation
rates of blue whale skin strata in Gulf of California (GC) and California Current System
(CCS).
(DOCX)
S4 Table. Max-t test results comparing the effect of different treatments on skin δ15N, δ13C
and weight percent C/N ratios.
(DOCX)
S5 Table. Max-t test results for the comparison of δ13C and δ15N values among different
skin strata in the Gulf of California (GC) and California Current System (CCS).
(DOCX)
S6 Table. GLM results relating blue whale skin δ15N values to time (Julian date) in the Gulf
of California (GC), California Current System (CCS) and Costa Rica Dome (CRD).
(DOCX)
S7 Table. Mean (±SD) δ13C, δ15N and weight percent C/N ratios of blue whale baleen plates
collected from stranded whales.
(DOCX)
S1 Dataset. δ13C, δ15N and weight percent C/N ratios of blue whale skin and baleen plates
used in this study.
(XLSX)
Acknowledgments
We would like to thank the institutions that facilitated the use of tissues samples and issued the
permits to collect and process these samples: NOAA-SWFSC, CRC, CICIMAR-IPN, HSU-
Vertebrate Museum, Museo de la Ballena y Ciencias del Mar (La Paz, BCS), the California
Department of Parks and Recreation-Prairie Creek Redwoods State Park, NOAA/NMFS and
SEMARNAT. We are also very grateful to all the personnel from the former institutions, the
Stranding Network of California, and the Center for Stable Isotopes of the University of New
Mexico who participated in the collection and processing of the tissue samples. We would also
Blue whale skin isotopic incorporation rates and baleen growth rates
PLOS ONE | https://doi.org/10.1371/journal.pone.0177880 May 31, 2017 19 / 25

like to thank the John H. Prescott Marine Mammal Rescue Assistance Grant Program that has
provided grants to the stranding networks. J. Rice, J. Loomis, T. Holmes, and F.J. Gomez-Dıaz
collaborated during the process of locating potential baleen plates for this study and we are
very beholden for their support. We would also like to give special recognition to K. Robertson
who helped with the logistics of sample selection and the sex identification of an important
baleen sample at the genetics lab in SWFSC. M.A. Pardo, H. Villalobos-Ortiz, C. Arnold, and
two anonymous reviewers made some valuable comments to improve the manuscript.
Author Contributions
Conceptualization: GBV SDN DG.
Formal analysis: GBV.
Funding acquisition: GBV SDN DG SAG.
Investigation: GBV SDN GSV JKJ.
Methodology: GBV DG.
Project administration: GBV.
Resources: GBV SDN JC GSV JKJ SAG DG.
Visualization: GBV SDN.
Writing – original draft: GBV SDN DG.
Writing – review & editing: GBV SDN JC GSV JKJ SAG DG.
References1. Reilly SB, Bannister JL, Best PB, Brown M, Brownell RL Jr., Butterworth DS, et al. Balaenoptera mus-
culus. IUCN Red List Threat Species. 2008; e.T2477A9447146.
2. Bailey H, Mate BR, Palacios DM, Irvine L, Bograd SJ, Costa DP. Behavioural estimation of blue whale
movements in the Northeast Pacific from state-space model analysis of satellite tracks. Endanger
Species Res. 2009; 10: 93–106.
3. Calambokidis J, Barlow J, Ford JKB, Chandler TE, Douglas AB. Insights into the population structure
of blue whales in the Eastern North Pacific from recent sightings and photographic identification. Mar
Mammal Sci. 2009; 25: 816–832.
4. Calambokidis J, Barlow J. Abundance of blue and humpback whales in the eastern North Pacific esti-
mated by capture-recapture and line-transect methods. Mar Mammal Sci. 2004; 20: 63–85.
5. Etnoyer P, Canny D, Mate BR, Morgan LE, Ortega-Ortiz JG, Nichols WJ. Sea-surface temperature
gradients across blue whale and sea turtle foraging trajectories off the Baja California Peninsula,
Mexico. Deep Sea Res Part II Top Stud Oceanogr. 2006; 53: 340–358.
6. Etnoyer P, Canny D, Mate BR, Morgan L. Persistent pelagic habitats in the Baja California to Bering
Sea (B2B) Ecoregion. Oceanography. 2004; 17: 90–101.
7. Mate BR, Lagerquist BA, Calambokidis J. Movements of North Pacific blue whales during the feeding
season off southern California and their southern fall migration. Mar Mammal Sci. 1999; 15: 1246–
1257.
8. Reilly SB, Thayer VG. Blue whale (Balaenoptera musculus) distribution in the eastern tropical Pacific.
Mar Mammal Sci. 1990; 6: 265–277.
9. Gendron D. Ecologıa poblacional de la ballena azul, Balaenoptera musculus, de la Peninsula de Baja
California. Ph.D. Thesis, Centro de Investigacion Cientıfica y de Educacion Superior de Ensenada.
2002.
10. Pardo MA, Silverberg N, Gendron D, Beier E, Palacios DM. Role of environmental seasonality in the
turnover of a cetacean community in the southwestern Gulf of California. Mar Ecol Prog Ser. 2013;
487: 245–260.
Blue whale skin isotopic incorporation rates and baleen growth rates
PLOS ONE | https://doi.org/10.1371/journal.pone.0177880 May 31, 2017 20 / 25

11. Sears R, Ramp C, Douglas AB, Calambodikis J. Reproductive parameters of eastern North Pacific
blue whales Balaenoptera musculus. Endanger Species Res. 2013; 22: 23–31.
12. Tershy BR, Breese D, Strong CS. Abundace, seasonal distribution and popultion composition of bale-
nopterid whales in the Canal de Ballenas, Gulf of California, Mexico. Reports Int Whal Comm. 1990;
369–375.
13. Hoyt E. The blue whale, Balaenoptera Musculus: An endangered species thriving on the Costa Rica
Dome. Rep WDC. 2009; 1–11. Available: www.cbd.int/cms/ui/forums/attachment.aspx?id=73
14. Del Angel-Rodrıguez JA. Habitos alimentarios y distribucion espacio-temporal de los rorcuales comun
(Balaenoptera physalus) y azul (Balaenoptera musculus) en la Bahıa de La Paz, B.C.S., Mexico. M.
Sc. Thesis, Centro Interdisciplinario de Ciencias Marinas-Instituto Politecnico Nacional. 1997. Avail-
able: http://tesis.ipn.mx/handle/123456789/3026
15. Croll DA, Marinovic B, Benson S, Chavez FP, Black N, Ternullo R, et al. From wind to whales: trophic
links in a coastal upwelling system. Mar Ecol Prog Ser. 2005; 289: 117–130.
16. Nemoto T, Kawamura A. Characteristics of food habits and distribution of baleen whales with special
reference to the abundance of North Pacific sei and bryde’s whales. Rep Int Whal Com Spec Issue.
1977; 80–87.
17. Matteson RS. The Costa Rica Dome: A study of physics, zooplankton and blue whales. M.Sc. Thesis,
Oregon State University. 2009. Available: http://scholar.google.com/scholar?hl=en&btnG=Search&q=
intitle:No+Title#0
18. Fiedler PC, Reilly SB, Hewitt RP, Demer D, Philbrick VA, Smith S, et al. Blue whale habitat and prey in
the California Channel Islands. Deep Sea Res Part II Top Stud Oceanogr. 1998; 45: 1781–1801.
19. Calambokidis J, Steiger G. Blue whales. Stillwater, Minnesota: Worldlife Series Library, Voyager
Press; 1997.
20. Jimenez-Pinedo NC. Habitos alimentarios y relacion interespecıfica entre la ballena azul (Balaenop-
tera musculus) y la ballena de aleta (B. physalus) en el suroeste del Golfo de California. M.Sc. Thesis,
Centro Interdisciplinario de Ciencias Marinas-Instituto Politecnico Nacional. 2010. Available: http://
www.repositoriodigital.ipn.mx/bitstream/handle/123456789/13508/jimenezp1.pdf?sequence=1
21. Oliver JS, Slattery PN, Silberstein MA, O’Connor EF. A comparison of gray whale, Eschrichtius robus-
tus, feeding in the Bering Sea and Baja California. Fish Bull. 1983; 81: 513–522.
22. Baraff LS, Clapham PJ, Mattila DK. Feeding behavior of a humpback whale in low-latitude waters. Mar
Mammal Sci. 1991; 7: 197–202.
23. Hazen EL, Palacios DM, Forney KA, Howell EA, Becker E, Hoover AL, et al. WhaleWatch: a dynamic
management tool for predicting blue whale density in the California Current. J Appl Ecol. 2016;
24. Newsome SD, Clementz MT, Koch PL. Using stable isotope biogeochemistry to study marine mammal
ecology. Mar Mammal Sci. 2010; 26: 509–572.
25. DeNiro MJ, Epstein S. Influence of diet on the distribution of nitrogen isotopes in animals. Geochim
Cosmochim Acta. 1981; 45: 341–351.
26. DeNiro MJ, Epstein S. Influence of diet on the distribution of carbon isotopes in animals. Geochim Cos-
mochim Acta. 1978; 42: 495–506.
27. Gannes LZ, Martınez del Rio C, Koch P. Natural abundance variations in stable isotopes and their use
in animal physiological ecology. Comp Biochem Physiol. 1998; 119: 725–737.
28. Altabet MA., Pilskaln C, Thunell R, Pride C, Sigman D, Chavez F, et al. The nitrogen isotope biogeo-
chemistry of sinking particles from the margin of the Eastern North Pacific. Deep Sea Res Part I Ocea-
nogr Res Pap. 1999; 46: 655–679.
29. Graham BS, Koch PL, Newsome SD, Mcmahon KW, Aurioles D. Using isoscapes to trace the move-
ments and foraging behavior of top predators in oceanic ecosystems. 2010; 299–318.
30. McMahon KW, Hamady LL, Thorrold SR. A review of ecogeochemistry approaches to estimating
movements of marine animals. Limnol Oceanogr. 2013; 58: 697–714.
31. Williams RL, Wakeham S, McKinney R, Wishner KF. Trophic ecology and vertical patterns of carbon
and nitrogen stable isotopes in zooplankton from oxygen minimum zone regions. Deep Res Part I
Oceanogr Res Pap. Elsevier; 2014; 90: 36–47.
32. Mcmahon KW, Thorrold SR, Elsdon TS, Mccarthy MD. Trophic discrimination of nitrogen stable iso-
topes in amino acids varies with diet quality in a marine fish. Limnol Oceanogr. 2015; 60: 1076–1087.
33. Vander Zanden MJ, Rasmussen JB. Variation in δ15N and δ13C trophic fractionation: Implications for
aquatic food web studies. Limnol Oceanogr. 2001; 46: 2061–2066.
34. McCutchan JH, Lewis WM, Kendall C, McGrath CC. Variation in trophic shift for stable isotope ratios
of carbon, nitrogen, and sulfur. Oikos. 2003; 102: 378–390.
Blue whale skin isotopic incorporation rates and baleen growth rates
PLOS ONE | https://doi.org/10.1371/journal.pone.0177880 May 31, 2017 21 / 25

35. Thomas SM, Crowther TW. Predicting rates of isotopic turnover across the animal kingdom: A synthe-
sis of existing data. J Anim Ecol. 2015; 84: 861–870. https://doi.org/10.1111/1365-2656.12326 PMID:
25482029
36. Martınez Del Rio C, Wolf N, Carleton SA, Gannes LZ. Isotopic ecology ten years after a call for more
laboratory experiments. Biological Reviews. 2009. pp. 91–111. https://doi.org/10.1111/j.1469-185X.
2008.00064.x PMID: 19046398
37. Aguilar A, Gimenez J, Gomez-Campos E, Cardona L, Borrell A. δ15N value does not reflect fasting in
mysticetes. PLoS One. 2014; 9: e92288. https://doi.org/10.1371/journal.pone.0092288 PMID:
24651388
38. Matthews CJD, Ferguson SH. Seasonal foraging behaviour of eastern Canada-West Greenland bow-
head whales: An assessment of isotopic cycles along baleen. Mar Ecol Prog Ser. 2015; 522: 269–286.
39. Matthews CJD, Ferguson SH. Spatial segregation and similar trophic-level diet among eastern Cana-
dian Arctic/north-west Atlantic killer whales inferred from bulk and compound specific isotopic analysis.
J Mar Biol Assoc United Kingdom. 2013; 94: 1343–1355.
40. Gendron D, Aguıñiga S, Carriquiry JD. δ15N and δ13C in skin biopsy samples: a note on their applica-
bility for examining the relative trophic level in three rorqual species. J Cetacean Res Manag. 2001; 3:
41–44.
41. Witteveen BH, Worthy GAJ, Foy RJ, Wynne KM. Modeling the diet of humpback whales: An approach
using stable carbon and nitrogen isotopes in a Bayesian mixing model. Mar Mammal Sci. 2012; 28: 1–18.
42. Schell DM, Saupe SM, Haubenstock N. Natural isotope abundances in bowhead whale (Balaena mys-
ticetus) baleen: markers of aging and habitat usage. In: Rundel PW, Ehleringer JR, Nagy KA, editors.
Stable isotopes in ecological research. Springer-Verlag, New York; 1989. pp. 260–269.
43. Schell DM, Saupe SM, Haubenstock N. Bowhead whale (Balaena mysticetus) growth and feeding as
estimated by δ13C techniques. Mar Biol. 1989; 103: 433–443.
44. Best PB, Schell DM. Stable isotopes in southern right whale (Eubalaena australis) baleen as indicators
of seasonal movements, feeding and growth. Mar Biol. 1996; 124: 483–494.
45. Geraci J, St. Aubin DJ, Hicks B. The epidermis of odontocetes: a view from within. In: Bryden MM, Har-
rison R, editors. Research on Dolphins, Part I. Oxford: Clarendon Press; 1986. pp. 3–21.
46. Harrison R, Thurley KW. Structure of the epidermis in Tursiops, Delphinus, Orcinus and Phocoena. In:
Harrison RJ, editor. Functional Anatomy of Marine Mammals, Vol. 2. London: Academic Press;
1974. pp. 45–71.
47. Browning NE, Dold C, I-Fan J, Worthy GAJ. Isotope turnover rates and diet-tissue discrimination in
skin of ex situ bottlenose dolphins (Tursiops truncatus). Clin Cancer Res. 2014; 217: 214–221.
48. Gimenez J, Ramırez F, Almunia J, Forero MG, de Stephanis R. From the pool to the sea: Applicable
isotope turnover rates and diet to skin discrimination factors for bottlenose dolphins (Tursiops trunca-
tus). J Exp Mar Bio Ecol. 2016; 475: 54–61.
49. Podlesak DW, McWilliams SR, Hatch KA. Stable isotopes in breath, blood, feces and feathers can
indicate intra-individual changes in the diet of migratory songbirds. Oecologia. 2005; 142: 501–510.
https://doi.org/10.1007/s00442-004-1737-6 PMID: 15586297
50. Tieszen LL, Boutton TW, Tesdahl KG, Slade NA. Fractionation and turnover of stable carbon isotopes
in animal tissues: Implications for δ13C analysis of diet. Oecologia. 1983; 57: 32–37. https://doi.org/10.
1007/BF00379558 PMID: 28310153
51. Evans Ogden LJ, Hobson KA, Lank DB. Blood isotopic (δ13C and δ15N) turnover and diet-tissue frac-
tionation factors in captive dunlin (Calidris alpina pacifica). Auk. 2004; 121: 170–177.
52. Voigt CC. Low turnover rates of carbon isotopes in tissues of two nectar-feeding bat species. J Exp
Biol. 2003; 206: 1419–1427. PMID: 12624176
53. Berta A, Sumich J, Kovacs K. Marine mammals: Evolutionary biology. 2nd ed. San Diego, California:
Academic Press; 2006.
54. Fudge DS, Szewciw LJ, Schwalb AN. Morphology and development of blue whale baleen: An anno-
tated translation of Tycho Tullberg’s classic 1883 paper. Aquat Mamm. 2009; 35: 226–252.
55. Bentaleb I, Martin C, Vrac M, Mate B, Mayzaud P, Siret D, et al. Foraging ecology of mediterranean fin
whales in a changing environment elucidated by satellitetracking and baleen plate stable isotopes.
Mar Ecol Prog Ser. 2011; 438: 285–302.
56. Lee SH, Schell DM, McDonald TL, Richardson WJ. Regional and seasonal feeding by bowhead
whales Balaena mysticetus as indicated by stable isotope ratios. Mar Ecol Prog Ser. 2005; 285: 271–
287.
Blue whale skin isotopic incorporation rates and baleen growth rates
PLOS ONE | https://doi.org/10.1371/journal.pone.0177880 May 31, 2017 22 / 25

57. Mitani Y, Bando T, Takai N, Sakamoto W. Patterns of stable carbon and nitrogen isotopes in the
baleen of common minke whale Balaenoptera acutorostrata from the western North Pacific. Fish Sci.
2006; 72: 69–76.
58. Aurioles-Gamboa D, Rodrıguez-Perez M, Sanchez-Velasco L, Lavın M. Habitat, trophic level, and res-
idence of marine mammals in the Gulf of California assessed by stable isotope analysis. Mar Ecol
Prog Ser. 2013; 488: 275–290.
59. Becker BH, Peery MZ, Beissinger SR. Ocean climate and prey availability the trophic level and repro-
ductive success of the marbled murrelet, an endangered seabird. Mar Ecol Prog Ser. 2007; 329: 267–
279.
60. Hipfner JM, Dale J, McGraw KJ. Yolk carotenoids and stable isotopes reveal links among environ-
ment, foraging behavior and seabird breeding success. Oecologia. 2010; 163: 351–360. https://doi.
org/10.1007/s00442-010-1618-0 PMID: 20397031
61. Carle RD. Seasonal and sex-specific diet in rhinoceros auklets. M.Sc. Thesis, The Faculty of Moss
Landing Marine Laboratories. 2014. Available: http://scholarworks.sjsu.edu/etd_theses/4454/
62. Williams R. Trophic ecology of Oxygen Minimum Zone zooplankton revealed by carbon and nitrogen
stable isotopes. Ph.D. Thesis, University of Rhode Island. 2013. Available: http://digitalcommons.uri.
edu/cgi/viewcontent.cgi?article=1148&context=oa_diss
63. Sydeman WJ, Hobson KA, Pyle P, McLaren EB. Trophic relationships among seabirds in central Cali-
fornia: Combined stable isotope and conventional dietary approach. Condor. 1997; 99: 327–336.
64. Miller TW. Trophic dynamics of marine nekton and zooplankton in the northern California Current
pelagic ecosystem. Ph.D. Thesis, Oregon State University. 2006. Available: http://ir.library.
oregonstate.edu/xmlui/bitstream/handle/1957/2589/TMiller_Dissertation_FINAL.pdf?sequence=1
65. Popp BN, Graham BS, Olson RJ, Hannides CCS, Lott MJ, Lopez-Ibarra G a, et al. Insight into the tro-
phic ecology of yellowfin tuna, Thunnus albacares, from compound-specific nitrogen isotope analysis
of protenaceous amino acids. In: Dawson T, Siegwolf R, editors. Stable isotopes as indicators of eco-
logical changes. Amsterdam, Netherlands: Elsevier Academic Press; 2007; pp 173–190.
66. Barrett-Lennard LG, Smith TG, Ellis GM. A cetacean biopsy system using lightweight pneumatic
darts, and its effect on the behavior of killer whales. Mar Mammal Sci. 1996; 12: 14–27.
67. Gendron D, Mesnick SL. Sloughed skin: A method for the systematic collection of tissue samples from
Baja California blue whales. J Cetacean Res Manag. 2001; 3: 77–79.
68. Brinton E, Ohman MD, Townsend AW, Knight MD, Bridgeman AL. Euphausiids of the World Ocean
(cd-room Expert System). Springer-Verlag, Heildeberg; 2000.
69. Wisner RL. The taxonomy and distribution of lanternfishes (family Myctophidae) of the eastern Pacific
Ocean. Bay St. Louis, Miss.: Navy Ocean Research and Development Activity; 1974.
70. Sheehan D, Hrapchak BB. Theory and Practice of Histotechnology. 2nd Edition. St. Louis, MO: C.V.
Mosby Co.; 1980.
71. Morin PA, LeDuc RG, Robertson KM, Hedrick NM, Perrin WF, Etnier M, et al. Genetic analysis of killer
whale (Orcinus orca) historical bone and tooth samples to identify western U.S. ecotypes. Mar Mam-
mal Sci. 2006; 22: 897–909.
72. Morin PA, Nestler A, Rubio-Cisneros NT, Robertson KM, Mesnick SL. Interfamilial characterization of
a region of the ZFX and ZFY genes facilitates sex determination in cetaceans and other mammals.
Mol Ecol. 2005; 14: 3275–3286. https://doi.org/10.1111/j.1365-294X.2005.02651.x PMID: 16101791
73. DeNiro M, Epstein S. Mechanism of carbon isotope fractionation associated with lipid synthesis. Sci-
ence. 1977; 197: 261–263. PMID: 327543
74. McConnaughey T, McRoy CP. Food-web structure and the fractionation of carbon isotopes in the
Bering sea. Mar Biol. 1979; 53: 257–262.
75. Ryan C, McHugh B, Trueman CN, Harrod C, Berrow SD, O’Connor I. Accounting for the effects of lip-
ids in stable isotope (δ13C and δ15N values) analysis of skin and blubber of balaenopterid whales.
Rapid Commun Mass Spectrom. 2012; 26: 2745–2754. https://doi.org/10.1002/rcm.6394 PMID:
23124665
76. Lesage V, Morin Y, Rioux E, Pomerleau C, Ferguson S, Pelletier E. Stable isotopes and trace ele-
ments as indicators of diet and habitat use in cetaceans: predicting errors related to preservation, lipid
extraction, and lipid normalization. Mar Ecol Prog Ser. 2010; 419: 249–265.
77. Kaehler S, Pakhomov EA. Effects of storage and preservation on the δ13C and δ15N signatures of
selected marine organisms. Mar Ecol Prog Ser. 2001; 219: 299–304.
78. Sarakinos HCH, Johnson ML, Vander Zanden M. A synthesis of tissue-preservation effects on carbon
and nitrogen stable isotope signatures. Can J Zool. 2002; 80: 381–387.
Blue whale skin isotopic incorporation rates and baleen growth rates
PLOS ONE | https://doi.org/10.1371/journal.pone.0177880 May 31, 2017 23 / 25

79. Barrow LM, Bjorndal KA, Reich KJ. Effects of preservation method on stable carbon and nitrogen iso-
tope values. Physiol Biochem Zool. 2008; 81: 688–693. https://doi.org/10.1086/588172 PMID:
18752417
80. Todd S, Ostrom P, Lien J, Abrajano J. Use of biopsy samples of humpback whale (Megaptera
novaeangliae) skin for stable isotope (δ13C) determination. J Northwest Atl Fish Sci. 1997; 22: 71–76.
81. Burrows DG, Reichert WL, Bradley Hanson M. Effects of decomposition and storage conditions on the
δ13C and δ15N isotope values of killer whale (Orcinus orca) skin and blubber tissues. Mar Mammal
Sci. 2014; 30: 747–762.
82. Caraveo-Patiño J, Soto LA. Stable carbon isotope ratios for the gray whale (Eschrichtius robustus) in
the breeding grounds of Baja California Sur, Mexico. Hydrobiologia. 2005; 539: 99–107.
83. Fry B. Stable Isotope Ecology. New York, NY: Springer New York; 2006.
84. Logan JM, Jardine TD, Miller TJ, Bunn SE, Cunjak RA, Lutcavage ME. Lipid corrections in carbon and
nitrogen stable isotope analyses: comparison of chemical extraction and modelling methods. J Anim
Ecol. 2008; 77: 838–46. https://doi.org/10.1111/j.1365-2656.2008.01394.x PMID: 18489570
85. R Development Core T. R: A language and environment for statistical computing. Vienna, Austria: R
Foundation for Statistical Computing; 2011. Available: http://www.r?project.org/
86. Herberich E, Sikorski J, Hothorn T. A robust procedure for comparing multiple means under heterosce-
dasticity in unbalanced designs. PLoS One. 2010; 5: 1–8.
87. Miller TW, Brodeur RD, Rau GH. Carbon stable isotopes reveal relative contribution of shelf-slope pro-
duction to the Northern California Current pelagic community. Limnol Oceanogr. 2008; 53: 1493–
1503.
88. Yee TW, Mitchell ND. Generalized additive models in plant ecology. Pond DW, editor. J Veg Sci.
1991; 2: 587–602.
89. Wood SN. Generalized additive models: an introduction with R. Wiley Interdisciplinary Reviews. 2006.
90. Xiang D. Fitting generalized additive models with the GAM procedure. SAS Institute, Cary, NC. 2001;
256–26. Available: http://www2.sas.com/proceedings/sugi26/p256-26.pdf
91. Fleming AH, Clark CT, Calambokidis J, Barlow J. Humpback whale diets respond to variance in ocean
climate and ecosystem conditions in the California Current. Glob Chang Biol. 2016; 22: 1214–1224.
https://doi.org/10.1111/gcb.13171 PMID: 26599719
92. Mangiafico SS. Summary and analysis of extension education program evaluation in R. Rutgers
Cooperative Extension, New Brunswick, NJ; 2016. Available: http://rcompanion.org/documents/
RHandbookProgramEvaluation.pdf
93. Peng RD, Dominici F, Louis TA. Model choice in time series studies of air pollution and mortality. J R
Stat Soc Ser A. 2006; 169: 179–203.
94. Chuang Y, Mazumdar S, Park T, Tang G, Arena VC, Nicolich MJ. Generalized linear mixed models in
time series studies of air pollution. Atmos Pollut Res. Elsevier; 2011; 3: 148.
95. Ingram T, Matthews B, Harrod C, Stephens T, Grey J, Markel R, et al. Lipid extraction has little effect
on the δ15N of aquatic consumers. Limnol Oceanogr Methods. 2007; 5: 338–342.
96. Chelton DB, Schlax MG, Samelson RM. Summertime coupling between sea surface temperature and
wind stress in the California Current System. J Phys Oceanogr. 2007; 37: 495–517.
97. Escalante F, Valdez-Holguın JE, Alvarez-Borrego S, Lara-Lara JR. Temporal and spatial variation of
sea surface temperature, chlorophyll a, and primary productivity in the Gulf of California. Cienc Mar.
2013; 39: 203–215.
98. Lluch-Cota SE, Aragon-Noriega EA, Arreguın-Sanchez F, Aurioles-Gamboa D, Jesus Bautista-
Romero J, Brusca RC, et al. The Gulf of California: Review of ecosystem status and sustainability chal-
lenges. Prog Oceanogr. 2007; 73: 1–26.
99. McClatchie S, Goericke R, Schwing FB, Bograd SJ, Peterson WT, Emmett R, et al. The state of the
California Current, spring 2008–2009: Cold conditions drive regional differences in coastal production.
Calif Coop Ocean Fish Investig Reports. 2009; 50: 43–68.
100. Schneider N, Di Lorenzo E, Niiler PP. Salinity variations in the Southern California Current. J Phys
Oceanogr. 2005; 35: 1421–1436.
101. Irving L, Hart JS. The metabolism and insulation of seals as bare-skinned mammals in cold water. Can
J Zool. 1957; 35: 497–511.
102. Silva RG. Assessment of body surface temperature in cetaceans: an iterative approach. Braz J Biol.
2004; 64: 719–24. Available: http://www.ncbi.nlm.nih.gov/pubmed/15620012 PMID: 15620012
103. Boily P. Theoretical heat flux in water and habitat selection of phocid seals and beluga whales during
the annual molt. J Theor Biol. 1995; 172: 235–244.
Blue whale skin isotopic incorporation rates and baleen growth rates
PLOS ONE | https://doi.org/10.1371/journal.pone.0177880 May 31, 2017 24 / 25

104. St Aubin DJ, Smith TG, Geraci JR. Seasonal epidermal molt in beluga whales, Delphinapterus leucas.
Can J Zool. 1990; 68: 359–364.
105. Durban JW, Pitman RL. Antarctic killer whales make rapid, round-trip movements to subtropical
waters: evidence for physiological maintenance migrations? Biol Lett. 2012; 8: 274–7. https://doi.org/
10.1098/rsbl.2011.0875 PMID: 22031725
106. Corkeron J, Connor C. Why do baleen whales migrate? Mar Mammal Sci. 1999; 15: 1228–1245.
107. Costa-Urrutia P, Sanvito S, Victoria-Cota N, Enrıquez-Paredes L, Gendron D. Fine-scale population
structure of blue whale wintering aggregations in the Gulf of California. PLoS One. 2013; 8: e58315.
https://doi.org/10.1371/journal.pone.0058315 PMID: 23505485
108. Forney KA, Barlow J. Seasonal patterns in the abundance and distribution of California cetaceans,
1991–1992. Mar Mammal Sci. 1998; 14: 460–489.
109. Carretta JV, Lowry MS, Stinchcomb CE, Lynn MS, Cosgrove RE. Distribution and abundance of
marine mammals at San Clemente Island and surrounding offshore waters: results from aerial and
ground surveys in 1998 and 1999. La Jolla, California: Southwest Fisheries Science Center Report.
2000.
110. Oleson EM, Wiggins SM, Hildebrand JA. Temporal separation of blue whale call types on a southern
California feeding ground. Anim Behav. 2007; 74: 881–894.
111. Oleson EM, Calambokidis J, Burgess WC, McDonald MA, LeDuc CA, Hildebrand JA. Behavioral con-
text of call production by eastern North Pacific blue whales. Mar Ecol Prog Ser. 2007; 330: 269–284.
112. Oleson EM, Calambokidis J, Barlow J, Hildebrand JA. Blue whale visual and acoustic encounter rates
in the southern California bight. Mar Mammal Sci. 2007; 23: 574–597.
113. Stafford KM, Nieukirk SL, Fox CG. Geographic and seasonal variation of blue whale calls in the North
Pacific. J Cetacean Res Manag. 2001; 3: 65–76.
114. Borrell A, Gimenez J, Aguilar A. Discrimination of stable isotopes in fin whale tissues and application
to diet assessment in cetaceans. 2012; 1596–1602. https://doi.org/10.1002/rcm.6267 PMID:
22693115
115. Rau GH, Ohman MD, Pierrot-Bults A. Linking nitrogen dynamics to climate variability off central Cali-
fornia: a 51 year record based on 15N/14N in CalCOFI zooplankton. 2003; 50: 2431–2447.
116. Mauchline J. The biology of mysids and euphausiids. Advances in marine biology. London and New
York: Academic Press; 1980.
117. Jaume-Schinkel SM. Habitos alimentarios del rorcual comun Balaenoptera physalus en el Golfo de
California mediante el uso de isotopos estables de nitrogeno y carbono. M.Sc. Thesis, Centro Interdis-
ciplinario de Ciencias Marinas-Instituto Politecnico Nacional. 2004. Available: http://www.
repositoriodigital.ipn.mx/bitstream/handle/123456789/14439/jaume1.pdf?sequence=1
118. Sampson L, Galvan-Magaña F, De Silva-Davila R, Aguiniga-Garcia S, O’Sullivan JB. Diet and trophic
position of the devil rays Mobula thurstoni and Mobula japanica as inferred from stable isotope analy-
sis. Mar Biol Assoc United Kingdom. 2010; 90: 969–976.
Blue whale skin isotopic incorporation rates and baleen growth rates
PLOS ONE | https://doi.org/10.1371/journal.pone.0177880 May 31, 2017 25 / 25