estimated use of water in the tennessee river watershed in ... · lect and analyze water-use...
TRANSCRIPT
Estimated Use of Water in the Tennessee River Watershed in 2000 and Projections of Water Use to 2030
By Susan S. Hutson1, M. Carolyn Koroa2, and C. Michael Murphree3
ABSTRACT industrial, 1,205 Mgal/d; public supply,
Estimates indicate that after increases in water withdrawals from 1965 to 1980 in the Ten-nessee River watershed, withdrawals declined from 1980 to 1985 and remained steady from 1985 to 1995. Water withdrawals in the Tennessee River watershed during 2000 averaged about 12,211 million gallons per day (Mgal/d) of fresh-water for offstream uses—22 percent more than the 1995 estimate. The 2000 estimate is nearly the same as the estimate for 1980, the highest year of record, with 12,260 Mgal/d. The reuse potential of water from the Tennessee River is high because most of the water withdrawn for offstream use is returned to the river system. Besides water quality, reuse potential reflects the quantity of water avail-able for subsequent uses and is gaged by consump-tive use, which is the difference between water withdrawals and return flow. For the Tennessee River watershed, return flow was estimated to be 11,562 Mgal/d, or 95 percent of the water with-drawn during 2000. Total consumptive use accounts for the remaining 5 percent, or 649 Mgal/d.
Estimates of water withdrawals by source indicate that during 2000, withdrawals from sur-face water accounted for 98 percent of the total withdrawals, or 11,996 Mgal/d, 23 percent more than during 1995. Total ground-water withdrawals during 2000 were 215 Mgal/d, or 17 percent less than during 1995.
During 2000, thermoelectric power with-drawals were estimated to be 10,276 Mgal/d;
662 Mgal/d; and irrigation, 68.9 Mgal/d. Return flows were estimated to be: thermoelectric power, 10,244 Mgal/d; industrial, 942 Mgal/d; and public supply, 377 Mgal/d. Consumptive use was esti-mated to be: thermoelectric power, 32.2 Mgal/d; industrial, 263 Mgal/d; public supply, 285 Mgal/d; and irrigation, 68.9 Mgal/d. Each category of use affects the reuse potential of the return flows differ-ently. The consumptive use in the river is compara-tively small because most of the water withdrawn from the Tennessee River watershed is used for once-through cooling for the thermoelectric power and industrial sectors.
Average per capita use for all offstream uses was 2,710 gallons per day per person in 2000, com-pared to the record high of 3,200 in 1975 and 1980. The intensity of use for the Tennessee River water-shed as measured as a function of area was 298,489 gallons per day per square mile in 2000.
In 2030, water withdrawals are projected to increase by about 15 percent to 13,990 Mgal/d. By category, water withdrawals are projected to increase as follows: thermoelectric power, 11 percent or 1,152 Mgal/d; industry, 31 percent or 368 Mgal/d; public supply, 35 percent or 232 Mgal/d; and irrigation, 37 percent or 25.2 Mgal/d. Total consumptive use is projected to increase about 51 percent or 334 Mgal/d to 980 Mgal/d. Per capita use in 2030 is calculated to be about 2,370 gallons per day, about 26 percent less than in 1980. Water transfers to the Tennessee-Tombigbee waterway for navigation lockages were estimated as 200 Mgal/d for 2000 and 800 Mgal/d for 2030. Water transfers for hydropower commit-ments through Barkley Canal averaged 3,361 Mgal/d for 2000 and are estimated to be an average of 4,524 Mgal/d in 2030.
1Hydrologist, U.S. Geological Survey, Memphis, Tennessee.2Senior Geographic Analyst, Tennessee Valley Authority,
Knoxville, Tennessee.3Data Analyst, Systems Information, Tennessee Valley Authority,
Knoxville, Tennessee.
Abstract 1
INTRODUCTION
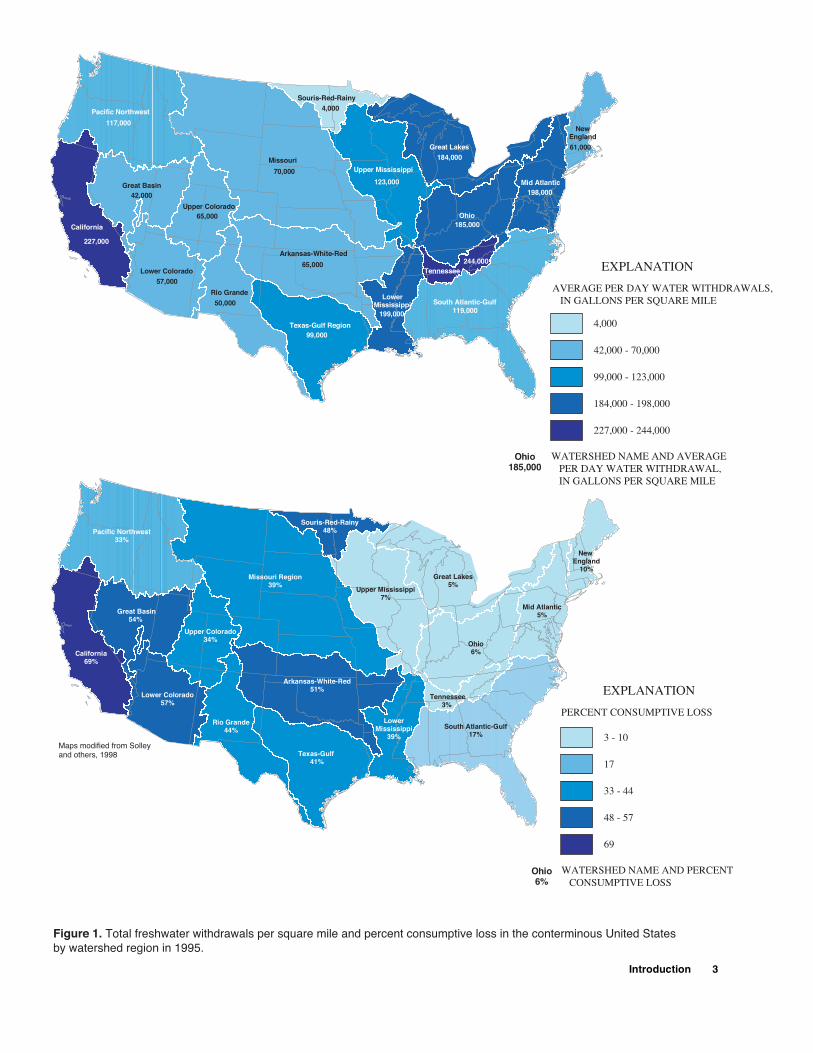
The Tennessee River system is the Nation’s fifth largest river system with a 40,910 mi2 drainage area. The Tennessee water-resources region (WRR), which corresponds to the Tennessee River watershed, ranked tenth among the 21 nationally designated WRRs in the United States in the volume of average daily with-drawals of freshwater in 1995. These withdrawals account for less than 3 percent, or 10,000 Mgal/d, of the overall total freshwater use of 341,000 Mgal/d in 1995. Of the 10,000 Mgal/d, about 80 percent was used for once-through cooling in the generation of electricity. In 1995, the Tennessee WRR produced 8 percent of the Nation’s total power from thermoelec-tric and hydroelectric plants and ranked fourth in over-all power production. The Tennessee WRR ranked twelfth in thermoelectric-power production and fifth in hydroelectric-power production (Solley and others, 1998).
As measured by intensity of freshwater with-drawals in gallons per day per square mile (gal/d/mi2), the Tennessee WRR was the most intensively used watershed among the 18 WRRs in the conterminous United States, averaging 244,439 gal/d/mi2 in 1995. Measured as a ratio of consumptive use to water with-drawals, the reuse potential of the Tennessee WRR is high. The consumptive use in 1995 was about 3 percent of the water withdrawals (289 of the 10,000 Mgal/d) (fig. 1). The California WRR was the second most intensively used watershed averaging 226,978 gal/d/mi2. The reuse potential of the Tennes-see River watershed is high compared to the California WRR. In the California WRR, nearly 80 percent of the 36,500 Mgal/d of water withdrawals was for irrigation and about 70 percent of the applied irrigation water was consumptively used. In 1995, the California WRR had the greatest consumptive use, and the Tennessee WRR ranked eighteenth (or fourth lowest). As a per-centage of the total water withdrawals, consumptive use in the Tennessee WRR was the smallest at 3 per-cent in 1995 (fig. 1).
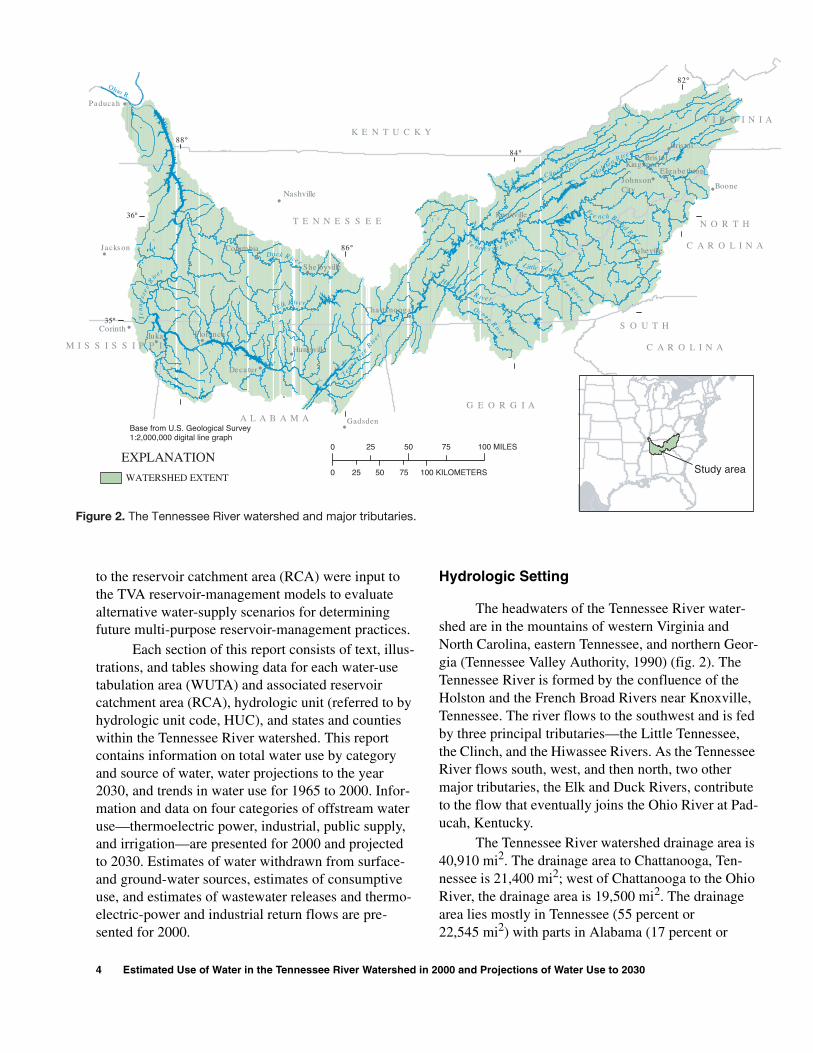
About 4.5 million people resided in the Tennes-see River watershed in 2000, an increase of about 15 percent since 1990. The watershed includes parts of Alabama, Georgia, Kentucky, Mississippi, North Carolina, Tennessee, and Virginia (fig. 2). A series of 49 dams and reservoirs regulates flow on the Tennes-see River system. Reservoirs in the watershed devel-oped by the Tennessee Valley Authority (TVA) and the United States Army Corps of Engineers (USACE) add
more than 643,749 surface acres to the water resources of the area and contribute substantially to public sup-plies, navigation, flood damage reduction, power pro-duction, water quality, and fisheries and wildlife management. The reservoirs also provide recreational and aesthetic benefits. The reservoirs offer a broad range of water-resource benefits on which much of the economic progress in the watershed has been built. The abundance of water in the watershed supports the sport and commercial fisheries and the tourist industry and helps attract industry and commercial activity to the region (Hutson and others, 1990). The TVA has federal responsibility for operating the reservoirs in the Tennessee River watershed.
Wisely managing the water resources in the Tennessee River watershed and preserving and enhancing the diverse and rich aquatic ecosystems are dependent on accurate and complete information on the availability and use of the water resources. Reli-able water-use information about where water is used, how water is used, how much water is used, and how that use has changed over time is required by regula-tory and resource agencies.
The U.S. Geological Survey (USGS), in cooper-ation with the TVA, conducted an investigation to col-lect and analyze water-use information for 2000 and to project water demand to 2030 for the Tennessee River watershed. These data will be used by TVA as part of the water-supply analysis for the TVA reservoir opera-tions study. Reservoir system operating policies affect reservoir levels, when changes in reservoir levels occur, and the amount of water flowing through the reservoir system at different times of the year. The res-ervoir operations study being conducted by TVA is a formal evaluation of TVA policies for operating the reservoirs in the Tennessee River system. The purpose of the study is to determine if changes in the TVA res-ervoir operating policies would produce greater over-all public value. Water supply, of which water use is a component, is one of the criteria being used to evalu-ate reservoir policy.
Purpose and Scope
This report presents water-use estimates for 2000 and water-use projections to 2030 for the Tennessee River watershed. The TVA uses a number of computer-based mathematical models to coordinate and optimize reservoir operation in the Tennessee River watershed. The data from this report aggregated
2 Estimated Use of Water in the Tennessee River Watershed in 2000 and Projections of Water Use to 2030
Introduction 3
to the reservoir catchment area (RCA) were input to the TVA reservoir-management models to evaluate alternative water-supply scenarios for determining future multi-purpose reservoir-management practices.
Each section of this report consists of text, illus-trations, and tables showing data for each water-use tabulation area (WUTA) and associated reservoir catchment area (RCA), hydrologic unit (referred to by hydrologic unit code, HUC), and states and counties within the Tennessee River watershed. This report contains information on total water use by category and source of water, water projections to the year 2030, and trends in water use for 1965 to 2000. Infor-mation and data on four categories of offstream water use—thermoelectric power, industrial, public supply, and irrigation—are presented for 2000 and projected to 2030. Estimates of water withdrawn from surface- and ground-water sources, estimates of consumptive use, and estimates of wastewater releases and thermo-electric-power and industrial return flows are pre-sented for 2000.
Hydrologic Setting
The headwaters of the Tennessee River water-shed are in the mountains of western Virginia and North Carolina, eastern Tennessee, and northern Geor-gia (Tennessee Valley Authority, 1990) (fig. 2). The Tennessee River is formed by the confluence of the Holston and the French Broad Rivers near Knoxville, Tennessee. The river flows to the southwest and is fed by three principal tributaries—the Little Tennessee, the Clinch, and the Hiwassee Rivers. As the Tennessee River flows south, west, and then north, two other major tributaries, the Elk and Duck Rivers, contribute to the flow that eventually joins the Ohio River at Pad-ucah, Kentucky.
The Tennessee River watershed drainage area is 40,910 mi2. The drainage area to Chattanooga, Ten-nessee is 21,400 mi2; west of Chattanooga to the Ohio River, the drainage area is 19,500 mi2. The drainage area lies mostly in Tennessee (55 percent or 22,545 mi2) with parts in Alabama (17 percent or
4 Estimated Use of Water in the Tennessee River Watershed in 2000 and Projections of Water Use to 2030
6,780 mi2), Georgia (4 percent or 1,475 mi2), Ken-tucky (2 percent or 966 mi2), Mississippi (1 percent or 414 mi2), North Carolina (13 percent or 5,480 mi2), and Virginia (8 percent or 3,250 mi2). Forty-nine dams constitute the Tennessee River water-control system. The reservoirs are operated year round for the pur-poses of navigation, flood damage reduction, power generation, water supply, water quality, and recreation. The operation of the reservoirs is linked to rainfall and runoff patterns in the watershed.
The rainfall varies seasonally, annually, and geographically. The mean-annual rainfall in the drain-age area is about 52 inches, ranging from a low of 36 inches in 1985 to a high of 65 inches in 1973 (Ten-nessee Valley Authority, 1990). The heaviest concen-trations of rainfall occur in mountainous areas along the headwaters of the tributaries where mean-annual rainfall is more than 90 inches. In parts of the French Broad, Clinch, and Holston River watersheds, the mean-annual rainfall is as low as 40 inches.
The mean-annual runoff is about 22 inches, about 42 percent of the mean-annual rainfall over the drainage area. Considerable natural storage, provided by the deep soils and extensive underground storage in many tributary areas, stabilizes runoff to some extent. During most of the year, dense ground cover on the steep slopes also limits rapid runoff from intense rain-fall. In winter, however, when plants are dormant, run-off increases and the ground becomes wetter, reducing natural storage and thereby increasing runoff.
Sources of Data and Methods of Analysis
The data for this report are stored in the Tennes-see Valley Authority Water-Use Data System (TVA-WUDS), which is a site-specific relational database. Each record in the database is labeled as a withdrawal or return flow water-use transaction. A water-use site may have either a withdrawal transaction or a return-flow transaction, or both. Each water-use transaction for a site in the database is assigned to a WUTA, RCA, HUC, State, and county. For some water-use sites, the intake for the water withdrawal is located in one RCA, and the outfall for the return flow is downstream of the dam in the next RCA. In such a case, the data records for the site indicate the different locations of the intake and outfall.
The database contains preliminary water-withdrawal data for 2000 collected by the States of Alabama, Georgia, Kentucky, Mississippi, North
Carolina, Tennessee, and Virginia and the USGS National Water-Use Information Program (NWUIP) as of December 2001 (appendix A). A supplementary inventory by TVA and USGS of industrial and thermo-electric power facilities in the watershed provided additional water-withdrawal and return-flow data. The U.S. Department of Energy, Energy Information Administration (DOE, EIA) electricity database was a secondary source of information on water withdrawal, return flow, and power generation for the thermoelec-tric plants in the watershed (U.S. Department of Energy, Energy Information Administration, 2000a and 2000b). The municipal wastewater, the industrial sanitary, process, and cooling water, and the mining return-flow data are from the U.S. Environmental Pro-tection Agency, National Pollutant Discharge Elimina-tion System program, Permit Compliance System (USEPA, NPDES, PCS). Stormwater-runoff discharge was excluded from the return-flow totals. The USGS NWUIP provided estimates of population data for the HUCs based on the U.S. Bureau of the Census data for 2000 (U.S. Bureau of the Census, 2001). The popula-tion estimates were generated by applying geographic information system (GIS) computer techniques to the population and associated boundary and centroid of each census tract in the watershed (Kristin S. Linsey, USGS, written commun., 2001).
To assure the quality of the data, the preliminary 2000 water-withdrawal and municipal wastewater return-flow site data were aggregated to the county level and compared to the 1995 USGS county water-use data (U.S. Geological Survey, 2002). Gaps in the 2000 county water-withdrawal data by category were adjusted using a projection factor based on the Woods and Poole economic data (Woods and Poole Econom-ics, Inc., 2001). Missing record for wastewater releases and industrial return flows was estimated using ratios derived from the collected site-specific data for 2000 from TVA-WUDS. For wastewater releases, a coefficient of 0.57 was applied to public-supply withdrawals. For industrial return flows, a coefficient of 0.79 was applied to industrial withdrawals.
Water-use numerical data are the average daily quantities used. Irrigation water is applied during only a part of the year and at variable rates; therefore, the actual rate of application is greater than the average rate given in the tables in this report. Numerical data in the text generally are rounded to three significant fig-ures for values less than 100 and presented as integers
Introduction 5

for values of 100 and greater. The tables show these values to two decimal places in million gallons per day. Per capita use data in gallons per day are shown as an integer. In the illustrations, values are generally expressed as integers or to 1-decimal place if the value is less than 1.0. All numbers were rounded indepen-dently; thus the sums of independently rounded num-bers may not equal the totals in the report. The percentage changes discussed in the text were calcu-lated from the unrounded data and appear as integers. Cumulative consumptive-use values are expressed as integers.
Water-use data are aggregated to one of the 30 RCA units in the watershed because the data in this report were input to the TVA reservoir-management models that use similar units. The water-use data are aggregated by HUCs because these units are often used as a geographical framework for detailed water-resources planning and for evaluating interbasin trans-fer of water or wastewater. Because the HUCs are widely recognized and used, a spatial analysis of the
water use is included by HUC. The type and availabil-ity of the water-use data varies by State and is deter-mined by State law, the presence of a water-permitting or water-use program, and funding. The State and county data are important data-analysis units used in formulating policy and making water-management decisions; therefore, these data are included in the report.
Fourteen WUTAs and 30 RCAs constitute the Tennessee River watershed. The WUTA groups RCAs to account for the complete site-specific water-use transactions between adjoining RCAs and is used to determine consumptive use at a large scale. An RCA (fig. 3) is a natural drainage area truncated by a dam. Within this topographically distinct area, precipitation, runoff, evapotranspiration, shallow and deep infiltra-tion to and discharge from the soil, and subsurface storage contribute to the water impounded in the reser-voir by the dam. The reservoir is a functional unit operated to meet specific objectives ranging from power generation to recreation. The guidelines under
6 Estimated Use of Water in the Tennessee River Watershed in 2000 and Projections of Water Use to 2030

which a reservoir is operated are part of an integrated management plan of the entire reservoir system, thus linking water availability throughout the watershed.
Net water demand was calculated by subtracting return flow from withdrawals and was determined for each RCA. The net water demand is accumulated at the downstream boundary of the WUTA to calculate a consumptive use. Cumulative consumptive use was calculated at key junctures of the WUTAs (Fort Loud-oun, Watts Bar-Chickamauga, Nickajack, Gunters-ville, Wheeler-Wilson, Pickwick, and Kentucky) in the river system and indicates a sum of consumptive use in the watershed to that juncture. Cumulative con-sumptive use for the Tennessee River watershed was calculated at Kentucky Dam. The diversion of water to the Tennessee-Tombigbee waterway for lockages for navigation and the diversion of flow from Kentucky Reservoir to Barkley Reservoir for generating hydro-electric power also are losses to the river system.
The Kentucky and Normandy RCAs function with a unique operational water-supply requirement
for Normandy Reservoir. The other RCAs exclude areas downstream of the reservoir; however, Nor-mandy Dam is operated to meet downstream flow requirements mandated by the Tennessee Department of Environment and Conservation, Division of Water Pollution Control, at Shelbyville, Tennessee. Net water demand for Normandy was calculated using the withdrawals and return flows in the Normandy Reser-voir and in the area downstream of the dam to the City of Columbia, Tennessee.
Thirty-two watershed areas designated by HUC constitute the Tennessee River watershed (Seaber and others, 1984) (appendix B) (fig. 4). Several counties in the Tennessee River watershed are only partially located within the basin (fig. 5). For each of these counties, only the water-use transactions occurring within the basin were compiled for this study. In Vir-ginia, the water-use data for an embedded political unit such as Bristol City were aggregated to the neigh-boring county unit.
Introduction 7

Acknowledgments
The authors thank the personnel from the many State and local agencies in Alabama, Georgia, Ken-tucky, Mississippi, North Carolina, Tennessee, and Virginia who assisted with the compilation of data for 2000, and the USGS water-use specialists from Ala-bama, Georgia, Kentucky, Mississippi, North Caro-
lina, and Virginia who assisted with the collection and compilation of the data for this report. The authors also appreciate the assistance provided by George E. Welch, TVA, in coordinating the industrial and ther-moelectric power water-use survey and by Melissa Alverson, TVA, in producing the cover and several graphics for the report.
8 Estimated Use of Water in the Tennessee River Watershed in 2000 and Projections of Water Use to 2030