establishing the measurement equivalence of online
TRANSCRIPT

ESTABLISHING THE MEASUREMENT EQUIVALENCE OF ONLINE SELECTION
ASSESSMENTS DELIVERED ON MOBILE VERSUS NON-MOBILE DEVICES
by
NEIL ALEXANDER MORELLI
(Under the Direction of Robert P. Mahan)
ABSTRACT
Recent usage data suggest job applicants are completing online selection assessments
using mobile devices (e.g., Smartphones) in greater numbers. Advancements in mobile
technology’s functionality, affordability, and mobility have quickly made mobile devices the
medium of choice for accessing the Internet. Thus, these devices offer logistical advantages for
organizations looking to extend their recruiting and selection efforts to a demographically and
geographically wider range of potential job applicants. However, organizations must determine
that the constructs predictive of future job performance are being measured similarly when
applicants complete assessments using mobile devices. In an effort to replicate and extend
previous findings on the utility of this new technology in a selection context, this study used two
large, applied samples of job applicants in a hospitality organization to examine the measurement
equivalence of selection assessments delivered on mobile and non-mobile devices (e.g., personal
computers). Measurement invariance tests conducted with multi-group confirmatory factor
analysis suggest that mobile versions of a cognitive ability-type assessment, two biodata
assessments, a multimedia work simulation, and a text-based situational judgment test are
equivalent to non-mobile versions at the configural, scalar, and residual variance level. The
results also found that mobile device user latent means are approximately half a standard
deviation lower than their non-mobile counterparts for the situational judgment test. Implications
for technology-enhanced selection assessment at the practitioner and organizational levels are
discussed.
INDEX WORDS: Measurement equivalence, Measurement invariance, Mobile devices,
Selection and assessment, Internet-based testing, Technology-enhanced
assessment, Cognitive ability, Biodata, Work simulations, Situational
judgment test, Computerized testing
ESTABLISHING THE MEASUREMENT EQUIVALENCE OF ONLINE SELECTION
ASSESSMENTS DELIVERED ON MOBILE VERSUS NON-MOBILE DEVICES
by
NEIL ALEXANDER MORELLI
B.S., Kennesaw State University, 2007
M.S., The University of Tennessee at Chattanooga, 2010
A Dissertation Submitted to the Graduate Faculty of The University of Georgia in Partial
Fulfillment of the Requirements for the Degree
DOCTOR OF PHILOSOPHY
ATHENS, GA
2013

© 2013
Neil Alexander Morelli
All Rights Reserved.
ESTABLISHING THE MEASUREMENT EQUIVALENCE OF ONLINE SELECTION
ASSESSMENTS DELIVERED ON MOBILE VERSUS NON-MOBILE DEVICES
by
NEIL ALEXANDER MORELLI
Major Professor: Robert P. Mahan
Committee: Charles E. Lance
Robert J. Vandenberg
Electronic Version Approved:
Maureen Grasso
Dean of the Graduate School
The University of Georgia
May 2013
iv
ACKNOWLEDGEMENTS
I would first like to extend my sincerest gratitude and thanks to my major professor, Rob
Mahan, for his encouragement, time and energy spent, and support in completing this project. It
has been a pleasure learning from you and working with you, I hope I can continue to do both for
years to come. I would also like to thank my committee members, Chuck Lance and Bob
Vandenberg, for helping me refine and complete this project. I could not be more thrilled to have
the authors I have cited so often be personal advisors to me, thank you so much. I also want to
thank my friend and mentor, James Illingworth, for helping me throughout the entire process.
From brainstorming, to gathering the resources, to reviewing the manuscript, to being a person I
could always count on to be in my corner, I owe James so much for how he’s helped me develop
as a professional and as a person. I could not have accomplished this without each of you, thank
you all.
I would also like to thank to my family and friends who have supported, encouraged, and
believed in me throughout my graduate career. Completing this project and the degree are a
testament to your love and support, thank you. Last and most importantly, I would like to thank
my wife Sierra for her wisdom, kind words, patience, and love that sustained me through this
process. I’m also thankful for the work she did behind the scenes on a daily basis to help me. I
will always cherish this time working towards our degrees together and I can’t wait to start a new
season with you.

v
TABLE OF CONTENTS
Page
ACKNOWLEDGEMENTS ........................................................................................................... iv
LIST OF TABLES ........................................................................................................................ vii
CHAPTER
1 INTRODUCTION ...................................................................................................1
Purpose of the Current Study .......................................................................3
2 LITERATURE REVIEW AND HYPOTHESES ....................................................7
Overview of Selection Assessments ............................................................7
Equivalence of Computerized Cognitive Assessments ..............................10
Equivalence of Computerized Non-Cognitive Assessments .....................16
Equivalence of Computerized Work Simulations ......................................19
The Current Study ......................................................................................22
3 METHOD ..............................................................................................................25
Procedure ...................................................................................................25
Sample........................................................................................................26
Assessments ...............................................................................................27
Data Analysis .............................................................................................30
4 RESULTS ..............................................................................................................36
Assessment Dimensionality and Descriptive Statistics .............................36
Measurement Equivalence/Invariance .......................................................41
vi
Summary ....................................................................................................47
5 DISCUSSION ........................................................................................................49
Major Contributions ...................................................................................49
Practical Implications.................................................................................55
Limitations and Future Research ...............................................................58
Additional Areas for Future Research and Conclusion .............................59
REFERENCES ..............................................................................................................................62
APPENDICES ...............................................................................................................................79
A Standardized Factor Loadings for ISM Assessments ............................................80
B Standardized Factor Loadings for CF Assessment ................................................81
C Inter-Item Tetrachoric Correlations for Learning Assessment ..............................81
D Inter-Item Polychoric Correlations for Conscientiousness Assessment ................81
E Inter-Item Polychoric Correlations for CSO Assessment ......................................82
F Inter-Item Polychoric Correlations for Neatness Assessment ...............................82
G Inter-Item Polychoric Correlations for Customer Service SJT ..............................82

vii
LIST OF TABLES
Page
Table 1: Description of assessments ..............................................................................................28
Table 2: Measurement models of reduced item assessments.........................................................39
Table 3: Descriptive statistics for reduced item assessments ........................................................40
Table 4: ME/I model tests for ISM job family ..............................................................................43
Table 5: Equal factor variance model fit indices and factor mean
differences between devices ..............................................................................................46
Table 6: ME/I model tests for CF job family .................................................................................46
1
CHAPTER 1
INTRODUCTION
Two growing trends surrounding technology-enhanced assessment have resulted in the
delivery of online selection assessments via mobile devices. First, computerized versions of
selection assessments have been found to be psychometrically equivalent to traditional paper-
and-pencil versions (Arthur, Glaze, Villado, & Taylor, 2010; Meade, Michels, & Lautenschlager,
2007; Noyes & Garland, 2008; Potosky & Bobko, 2004), and as such, many modern selection
assessments are configured for computerized delivery by default. Second, the widespread
adoption and use of unproctored Internet-based testing (UIT) as a cost-effective alternative to
computerized, proctored testing has made many selection assessments accessible online through
standard web browsers (Ployhart, 2006; Reynolds & Rupp, 2010; Tippins, 2009). Although the
universal appropriateness of UIT is still being debated (Tippins, 2009), many agree that this
process has the psychometric and logistic advantages of increased consistency (e.g., standardized
delivery of items) and improved efficiency (i.e., lowered costs, increased response and scoring
times, increased access for a greater number of applicants) in delivering selection assessments
(Naglieri et al., 2004, Ployhart, 2006, Tippins et al., 2006).
As a result, the past decade has seen an increasing number of organizations use UIT to
build online selection systems that are affordable, scalable, and meet their talent management
needs (Tippins, 2011). Specifically, a recent survey of HR professionals from a diverse spectrum
of industries responded that 70% of organizations currently use online assessments for external
hiring, and 60% of organizations deliver these assessments remotely (Fallaw, Kantrowitz, &

2
Dawson, 2012). The overarching trend for organizations is to provide access to online,
unproctored selection assessments to meet dynamic business and applicant demands (SIS
International Research, 2012).
As online versions of selection assessments currently enjoy unprecedented levels of
ubiquity (Frauenheim, 2011), mobile device technology, such as Smartphones and tablet
computers, are now being used to access assessments due to its affordability and convenience in
accessing the Internet. Initial reports on mobile device adoption expect that mobile Internet
traffic will grow faster than the desktop Internet usage rate, and that there will be more users
connecting to the Internet via mobile devices versus desktop personal computers (PCs) over the
next 5 years (Morgan Stanley, 2009). Specifically, a recent domestic technology trend review
predicted that mobile data traffic in the U.S. will increase by a factor of 20 between 2010 and
2015 (Cisco, 2012). This source also reports that in 2011 the number of Internet-connected tablet
computers increased by 34 million units. This is especially meaningful as each tablet computer
generates 3.4 times the data traffic as the average Smartphone.
To facilitate the discussion on mobile devices in a selection context, a definition and
description of the features and characteristics of mobile devices must be established. In the
current study, mobile devices in general, and Smartphones in particular, as opposed to the
standard “non-mobile” PC desktop computer, are defined as portable, handheld devices that have
multi-functional computing capability and Internet accessibility. Laptops are considered non-
mobile devices in the current study; although portable, laptops are not handheld and function
more closely to a standard desktop computer.
Aside from basic functionality differences between mobile and non-mobile devices (e.g.,
keyboard and mouse manipulation versus touch screen manipulation), another prominent
3
difference worth noting is screen size. Desktop and laptop computer monitors can have a wide
variety of full screen resolutions, but the size most commonly accepted as “standard” is a
1024x768 pixel density, which generally equates to a viewable screen size of at least 13.3 inches
for PCs and 17.8 inches for Macintosh computers (measured diagonally). Typical Smartphones
such as Androids™ or iPhones™ have 480 x 300 full screen pixel resolutions in the landscape
orientation and 320 x 460 full screen resolutions in the portrait orientation. Phones from different
manufacturers often vary in screen size from 3.5 inches to 5 inches, although a recent trend has
seen Smartphones growing in size to screen sizes greater than 5 inches (Crook, 2011).
Functionally, Smartphones are able to access Internet websites, such as those that host online
selection systems, using native mobile browsers, such as the Android™ mobile Internet browser
or Apple Mobile Safari™. Due to these potential functional differences, and the recent trend of
job applicants turning to mobile devices as the medium of choice for accessing online selection
instruments, examining the psychometric comparability of selection assessments delivered on
mobile and non-mobile devices is necessary.
Purpose of the Current Study
Although many organizations find themselves caught in the mobile technology current,
no published studies have examined the potential psychometric or practical differences between
the new mobile device deliveries of online selection assessments and their now more
“traditional” computer-based, non-mobile deliveries. This is troubling, as empirical, practical,
and legal standards demand that potential differences be identified before new delivery mediums
are fully implemented (Naglieri et al., 2004; Scott & Mead, 2011). Specifically, domestic and
international testing guidelines that often inform legal requirements call for differing assessment
delivery mediums to be tested for equivalence (e.g., American Educational Research

4
Association, American Psychological Association, & National Council on Measurement in
Education, 1999; American Psychological Association, 1986, 2010; Society for Industrial &
Organizational Psychology, 2003; International Test Commission, 2005). Although equivalency
studies of mobile and non-mobile devices exist in the education and learning literatures (e.g.,
Churchill, 2011; Clough, Jones, McAndrew, & Scanlon, 2007; Echeverria et al., 2012; Masri,
2012; Triantafillou, Georgiadou, & Economides, 2008), no published research concerning
mobile device equivalency in a selection context currently exists. Therefore, establishing
equivalence between these devices at both the latent construct and observed levels is critical for
organizations seeking to implement selection assessments that are reliable, valid, and legally
defensible (Reynolds & Rupp, 2010; Potosky & Bobko, 2004).
An important first step in determining the utility of new technology-enhanced selection
assessments is demonstrating the equivalence between new and traditional media. In other
words, the selection assessment delivered on the new technological medium must be shown to
accurately identify and capture the same psychological constructs (e.g., conscientiousness,
emotional intelligence, procedural knowledge) as the traditional medium and not introduce
method-related, construct-irrelevant variance (Arthur & Villado, 2008). However, all too often it
is assumed that a selection measure maintains its construct-validity regardless of its delivery
medium. This can result in interpretational confounding (Anderson & Gerbing, 1988), or the
assigned meaning of an a priori hypothesized construct being different than the measured
construct. Because interpretational confounding can change the inferences made from selection
assessments, the assumption that the construct validity is generalizable between two delivery
mediums must be supported before meaningful structural relationships can be deciphered (Scott
& Mead, 2011).
5
Establishing the psychometric or measurement equivalence/invariance (ME/I) of two
measurement methods is a critical prerequisite before making between-group observed score
comparisons (Anderson & Gerbing, 1988; Horn & McArdle, 1992; Steenkamp & Baumgartner,
1998; Vandenberg & Lance, 2000). This statistical assumption feeds into an important practical
assumption: when the equivalence between mobile and non-mobile devices can be determined,
organizations can have greater confidence in the selection decisions made from using the
inferences provided by an assessment. In the future, organizations may also be able to identify
ways mobile devices can benefit the selection process. For instance, mobile devices may allow
new accessibility to previously untapped applicant pools, or they may allow for the development
of new selection tools that can leverage computing features novel to a mobile device’s platform
(e.g., touch screen capabilities).
Initial research efforts have discovered that mobile device-based deliveries of
assessments intended to measure non-cognitive predictors of job performance are equivalent to
non-mobile device-based deliveries (e.g., Doverspike, Arthur, Taylor, & Carr, 2012; Morelli,
Illingworth, Scott, & Lance, 2012), but as these findings represent a narrow view of potential
assessments, this research needs to expand to include other types of predictors. Therefore, a
purpose of the current study was to not only replicate past ME/I findings for non-cognitive
assessments, but also expand these findings by testing the ME/I assumption between mobile and
non-mobile devices for cognitive ability assessments.
Due to the functional differences (e.g., screen resolution and user manipulation) between
mobile and non-mobile devices, a lack of invariance could also be possible for other previously
untested performance predictors, such as those that simulate work environments that are typical
for a given job (Adler, 2011; Christian, Edwards, & Bradley, 2010; Morelli et al., 2012; Scott &
6
Mead, 2011). Specifically, hardware characteristics, presentation characteristics, response
requirements, and technological issues that differ between devices could introduce construct-
irrelevant variance for similarly capable applicants who complete work simulation-type
assessments. Consequently, another purpose of the current study was to expand the assessment
types that are evaluated for equivalence to include multimedia work simulations and situational
judgment tests.
In summary, job candidates are accessing organizational web portals with mobile devices
at an increasing rate and in some cases, requesting access to online selection assessments via
mobile devices. Reynolds and Rupp (2010) predicted the importance of this issue by stating that,
“…the demand for the delivery of assessments on mobile platforms may become the most
significant opportunity and challenge to assessment over the next decade” (p. 612). Therefore,
the overall purpose of the current study was to establish the measurement equivalence of these
selection assessments across mobile and non-mobile devices. The following sections give a brief
overview of the relevant selection assessments, summarize the cognitive, non-cognitive, and
computerized work simulation equivalency literatures, and provide testable hypotheses regarding
mobile and non-mobile device equivalence.

7
CHAPTER 2
LITERATURE REVIEW AND HYPOTHESES
Overview of Selection Assessments
Selection assessment can be broadly defined as “evaluating an individual’s fitness for
hire, promotion, or similar personnel action,” and “…has been recognized for centuries”
(Thomas, 2004, p. 1). Undoubtedly, assessing the knowledge, skills, abilities, and individual
characteristics that are essential to successful job performance has been a primary concern for
organizational researchers and practitioners since the early days of industrial-organizational
psychology (e.g., Otis, 1920). In essence, when certain criteria are met (e.g., reliable, valid,
defensible, efficient) these assessments are acting as meaningful predictors of job performance
(Cascio & Aguinis, 2005). However, when the term predictor is used, an important distinction
should be made between the predictor construct and the predictor method (Arthur & Villado,
2008). The predictor construct is defined as the explicit behavioral domain that is thought to be
predictive of the job-specific, performance-related behavioral domain (Binning & Barrett, 1989).
Whereas the predictor method is the means by which the targeted construct is sampled (Arthur &
Villado). Due to the common interchangeability and the definitional importance of these terms,
and for purpose of discussion regarding the equivalence of mobile device delivered selection
assessments, the following is a brief overview of the selection assessments relevant to the current
study with each distinguished as either a predictor construct or method.
Three broad categories of selection assessments that tap a variety of constructs are
cognitive ability tests, non-cognitive assessments, and work simulations. The first, cognitive
8
ability tests are self-explanatory in that they are intended to measure the general mental ability
construct. To summarize the rich and varied literature on general mental ability, the construct has
multiple sub-facets (e.g., fluid intelligence, crystallized intelligence, general memory and
learning, etc.; Carroll, 1993), but the general measure of intelligence, g, is considered to be one
of the best predictors of future job performance in that it predicts a candidate’s ability to learn
and apply critical job knowledge (Neisser et al., 1996; Schmidt & Hunter, 1998). Predictor
methods for this construct exist in multiple off-the-shelf versions such as the Wonderlic
Personnel Test (Wonderlic, 2000) or the Test of Learning Ability (TLA; ePredix, 2001), but
many practitioners and organizations may create customized measures of g within their own
organizational contexts. Although the use of this construct is not without its limitations or
criticisms due to potential systematic sub-group differences and low face validity with applicants
(e.g., Chan, Schmitt, DeShon, Clause, & Delbridge, 1997; Murphy, Cronin, & Tam, 2003), this
predictor construct’s high predictive validity and utility have incentivized the ubiquitous
development and delivery of computerized versions of its various predictor methods.
Next, the group of non-cognitive selection predictors can be described as interviews,
personality assessments or inventories, and biodata measures. This wide variety of predictor
methods are designed to tap an equally diverse number of predictor constructs. For instance,
biodata measures, which are described as tools that use previous life experiences, attitudes,
preferences, values, or self-assessed skills to predict future job-related behaviors (Breaugh, 2009;
Mumford & Owens, 1987; Mumford & Stokes, 1992), can be designed to measure a number of
different individual difference domains, such as personality or vocational interests (Stokes &
Cooper, 2004). For this reason, biodata should be considered a predictor method that can be used
to sample one or many predictor constructs (Arthur & Villado, 2008). Biodata has also been a

9
useful choice for selection professionals due to a relatively high predictive validity coefficient
and its incremental validity over more traditional personality measures (Mount, Witt, & Barrick,
2000; Schmidt & Hunter, 1998). Biodata has also demonstrated low adverse impact among
protected sub-groups and thus is often included with larger, computerized selection assessment
batteries delivered online.
The final selection assessment category consists of work simulations. As Thornton and
Rupp (2004) summarized, work simulations have a long history in selection assessment and
“…are a type of situational test (Anastasi & Urbina, 1997) in which the stimulus material
presented to the examinee is moderately similar to actual organizational settings and problems”
(p. 319). These are predictor methods that can measure a host of predictor constructs, which tap
job-related performance dimensions. Simulations, such as the situational judgment test (SJT),
can vary in their fidelity to organizational settings. The text-based version of the SJT has been
typically called “low-fidelity” (Motowidlo, Dunnette, & Carter, 1990) in that it only provides a
description of a hypothetical scenario set in an organizational setting and asks respondents to
choose the most viable behavioral response. SJTs are also a special case for a simulation in that
they measure a variety of predictor constructs. For instance, empirical findings have
demonstrated that SJTs tap “SJT-dominant constructs”, which have been described as a type of
practical intelligence or judgment (Schmitt & Chan, 2006). Research has also shown that SJTs
provide incremental validity over other selection predictors, such as cognitive ability or
personality; however, due to their common multidimensionality (i.e., intended constructs
measured in addition to the SJT-dominant constructs), defining interpretable factors for SJTs can
be more difficult (Schmitt & Chan). Nonetheless, SJTs have been a popular choice for online
selection assessment batteries in that they are useful performance predictors, have face validity

10
and applicability to the targeted job, and are easy to computerize and deliver via online platforms
(e.g., Hense & Janovics, 2011).
In sum, the selection assessments that make up today’s online selection batteries
generally fall into one of three categories: cognitive ability, non-cognitive assessment, and work
simulation. Although researchers commonly refer to these assessments and the constructs they
are intended to measure synonymously, examples of each assessment category and the constructs
they are intended to measure were briefly described to distinguish the predictor constructs from
the predictor measures (Arthur & Villado, 2008). Focusing on this distinction helps develop a
contextual framework for the sections below, which use evidence from each selection assessment
category’s literature to generate testable hypotheses concerning equivalence between mobile and
non-mobile deliveries.
Equivalence of Computerized Cognitive Assessments
Although little research exists regarding the equivalency of mobile and non-mobile
delivered cognitive assessments, two closely related literatures can help inform the current
research: the literature comparing traditional paper-and-pencil versions to computerized versions,
and the educational literature, which has examined equivalence of learning assessments on
mobile devices. An initial study examining performance group differences between mobile and
non-mobile versions of a cognitive ability test administered in a selection context is also
discussed.
As the computerization of assessments became more popular in the late 1970s and early
1980s, the initial equivalence literature comparing paper-pencil and computerized versions
focused on the adaption of existing cognitive tests (e.g. Sacher & Fletcher, 1978; Greaud &
Green, 1986). Mead and Drasgow’s (1993) meta-analysis of 159 correlations between traditional

11
paper-and-pencil versions and computerized versions (123 from timed power tests, 36 for
speeded tests) provides a helpful synopsis of the research conducted at that time. They
discovered that a .95 correlation existed between the mediums for the timed power tests, and a
.72 correlation between the mediums for the speeded tests. This finding suggested that cognitive
assessments delivered on a computer were largely equivalent to the traditional paper-and-pencil
medium, but speed was found to be a meaningful moderator of medium equivalence.
Since these early studies were published, technological advances in computerized
assessments have forced researchers to revisit these initial findings. For instance, computerized
versions have been examined for potential differences created by interface characteristics, such
as screen legibility (e.g., screen size, screen resolution, font size, line length and spacing, white
space) and device functionality (e.g., scrolling requirements, item presentation). Also, user
characteristics, such as race and ethnicity, memory capability, and computer familiarity and
computer anxiety, have also been examined for their potential effect on performance differences
(See Leeson, 2006 for a review of these issues). Overall, recent evidence suggests that user
characteristics have small or inconclusive effects on performance differences between computer
and paper-pencil versions, and technological advancements in computer hardware have
eliminated noticeable differences caused by interface characteristics (e.g., legibility and
functionality; Lesson, 2006). Other summaries of the available research suggest that on the
occasions where these interface or context differences are discoverable, they do not have a
meaningful impact on performance or equivalence (e.g., Waters & Pommerich, 2007).
Specifically, a majority of post-1992 studies have found that modern computer displays allow for
most cognitive tasks (e.g., reading speed, accuracy, and comprehension, and memory processing)
12
designed for a paper-and-pencil medium to be transferable to a computer-based medium (Noyes
& Garland, 2008; Scott & Mead, 2011).
For a contemporary example, Whiting and Kline (2006) examined the equivalence
between paper-and-pencil and computerized versions of the Test of Workplace Essential Skills
(TOWES). Although this study matched two independent student groups for each device, the
TOWES measures adult worker proficiency in reading, document use, and numeracy using job-
related workplace documents designed to recreate the working environment. A simple
comparison of the observed means and variances between each device group revealed that there
were no significant performance differences and the rank order correlations were largely
equivalent. In addition, results from a general reaction survey administered to each group
discovered that respondents felt the computerized version was easy to use.
Along with the potential legibility and functionality differences across computer
hardware types, another potential source of non-equivalence for mobile device-delivered
cognitive assessments involves the mobility and variability of their administration context. This
issue has largely been studied within the unproctored, Internet-based testing (UIT) literature
(e.g., Arthur et al., 2010). Organizations have quickly implemented UIT after recognizing its
cost-savings, efficiency, and logistical advantages for testing applicants, especially when the
organization’s goal is to attract and efficiently and equitably screen a more demographically and
geographically diverse workforce. However, the increased usage of UIT quickly created an
academic debate surrounding its integrity, reliability, and validity (Tippins, 2009). Although this
debate continues, a bulk of the UIT-related literature suggests that in general, cognitive ability
tests are not adversely affected by their completion by applicants in an unproctored setting (e.g.,
Arthur et al., 2010; Huff, 2006; Nye, Do, Drasgow, & Fine, 2008).
13
Because organizational researchers have yet to specifically examine the implications of
delivering unproctored, Internet-based selection tests on mobile devices, other disciplines must
be sampled to help predict their equivalency in a selection context. Specifically, the educational
and technology literatures have shown how mobile devices offer new ways to facilitate and
assess student learning (Cochrane, 2010; Echeverria, et al., 2012; Keskin & Metcalf, 2011;
Masri, 2012). Some examples include mobile devices effectively delivering content via
multimedia design components (Churchill, 2011), acting as an efficient method for quizzing
students (Segall, Doolen, & Porter, 2005), and being a viable medium for computer-adaptive
testing (Triantafillou et al., 2008). Although not a perfect proxy for determining the equivalency
of mobile devices in a selection context, the findings from the educational literature suggest that
mobile devices may be equivalent to paper-and-pencil formats when delivering text-based or
multimedia content that measures cognitive ability.
Perhaps the best example of mobile device measurement equivalency for cognitive ability
tests from the educational literature is a study conducted by Schroeders and Wilhelm (2010).
Their study compared handheld computer, notebook (i.e., laptop computer), and paper-and-
pencil versions of verbal, numerical, and figural reasoning ability tests among a student sample.
The authors used an experimental design and confirmatory factor analysis to determine if the
test’s delivery medium introduced construct-irrelevant variance to the measurement of the test
constructs. Specifically, the authors had participants complete the cognitive ability measures on
each device and then compared the notebook and handheld computer versions to the
conventional paper-and-pencil version by setting the paper-and-pencil as the referent in a
correlated-trait-correlated-method-minus-one model. This procedure decomposes the variance
into three distinct factors: trait, method, and error. Five competing nested models were then
14
compared to see if method factors accounted for unexplained variance and significantly
improved the CFA model fit. Interestingly, the model that best fit the data included three
correlated test content factors (e.g., verbal, numerical, combined) and two uncorrelated, nested
media factors for notebook and handheld computers. When considered alone, this result suggests
nonequivalence between these two device types in that unique medium-related latent factors
could be attributing to observed individual differences across devices. Schroeders and Wilhelm
later postulated that these method effects could be produced by perceptual demand differences
between devices; namely, processing and manipulating test content using smaller screens and a
stylus could introduce construct irrelevant variance for the handheld computer version of the test.
However, Schroeders and Wilhelm also noted that these method factors had low reliabilities
(notebook binary reliability = .33; binary handheld computer reliability = .34), and reasoned this
could be an indication that these factors do not make meaningful contributions to the prediction
of individual differences for cognitive ability tests delivered on devices with smaller screens.
Although method factors were modeled, and this is the only known study that has examined
measurement equivalence of cognitive tests on a mobile device, the results leave open the
possibility that handheld computers (i.e., mobile devices) are a viable option for delivering
computerized cognitive ability tests.
Because no published research exists on the measurement equivalence for unproctored
cognitive selection assessments delivered on mobile and non-mobile devices, a preliminary,
unpublished study by Doverspike et al. (2012) must be reviewed. Specifically, this study
provides initial findings comparing observed performance means between job applicant groups.
To compare these device types, the authors sampled approximately 20,000 applicants who
completed a general mental ability test on mobile devices and standard computers in a selection

15
context. Effect sizes comparing mobile and non-mobile test scores for verbal, numerical, and
combined verbal and numerical observed means suggested that applicants performed worse in all
three sections when completing the test on a mobile device. This finding suggests that
performance differences may exist between device types, but it is important to note that the
general mental ability test used in this study was timed, and that speededness is a previously
identified moderator of performance (Mead & Drasgow, 1993). Therefore, it is difficult to
determine if the observed performance decrements were a function of the test format, the device,
or an interaction between the two. In addition to this limitation, this study did not establish the
measurement invariance of each administration medium before making across device group
comparisons. Again, this is important because not establishing measurement invariance opens
the possibility of interpretational confounding (Anderson & Gerbing, 1988) or incorrectly stating
that meaningful group differences exist between devices when there are no differences between
latent factor means. Although these limitations restrict the generalizability of the findings, this
study provides a useful first glimpse into the projected group differences between applicants who
use these devices to complete a timed cognitive ability test in a high-stakes testing scenario and
those who do not.
Summary. Computerized versions of cognitive ability tests have evolved tremendously
since their development in the mid 1970s and 80s. These early studies found that computerized
versions were generally equivalent to paper-and-pencil versions, but that speededness was a
significant moderator. Since these studies, advancements in computer technology and online
testing have minimized or erased previously observed medium-related differences and have
opened up new avenues for online assessment delivery via mobile devices. Although
experimental findings generated from educational student samples suggest that these devices
16
most likely do not introduce medium-related error into the assessment process, no research exists
on the possible latent measurement differences for cognitive-ability selection tests in an
unproctored context.
Equivalence of Computerized Non-Cognitive Assessments
With the successful adaptation of computerized cognitive assessments from conventional
paper-and-pencil versions, test developers modified online selection systems to include non-
cognitive constructs, such as attitudes, personality, and work orientation. Typically, when the
assessment of any construct is computerized researchers debate the appropriateness and merits of
using either proctored, unproctored, offline, or online versions. Although some findings favor the
psychometric properties of computerized versions over paper-and-pencil versions (i.e., better
distributional properties, more variance, higher internal consistency reliabilities, stronger item
intercorrelations; Ployhart, Weekley, Holtz, & Kemp, 2003), existing comparison studies have
shown that computerization, proctoring, or using an online version of a non-cognitive assessment
has little impact on the equivalence between cross-medium versions (e.g., Coyne, Warszta,
Beadle, & Sheehan, 2005; Mead & Blitz, 2003; Meade et al., 2007; Richman, Kiesler, Wesiband,
& Drasgow, 1999).
For example, Chuah, Drasgow, and Roberts (2006) compared the measurement
equivalence of a paper-and-pencil version, a proctored computerized version, and an unproctored
online version of a personality assessment measuring neuroticism, extroversion, agreeableness,
and conscientiousness. Using 728 student participants in a traditional lab study setting, Chuah et
al. randomly assigned each participant to one of the three conditions and analyzed the
measurement properties of the responses using Item Response Theory (IRT). They discovered
17
no significant differences between the three medium types—a follow-up equivalence test using
multiple group confirmatory factor analysis (MGCFA) also supported the IRT findings.
Meade et al. (2007) also examined whether paper-pencil and Internet administrations of a
personality test are psychometrically equivalent. In a randomized-experimental design,
participants were assigned to either a Choice or No-Choice condition (in the Choice condition
participants were allowed to choose a medium whereas in the No-Choice condition they were
randomly assigned to a medium). Participants then completed 11 personality scales taken from
the Occupational Personality Questionnaire; the 11 scales were chosen for their relatedness to
organizationally relevant outcomes. The authors controlled for choice and compared the fit of
each personality scale’s measurement model separately using a means and covariance structure
analysis. They discovered that for each of the 11 personality scales, metric invariance (i.e., the
relationships of the items to the latent factor, and a fundamental type of invariance needed to be
considered equivalent) was supported across formats. However, when the equivalence between
people allowed to choose their device and those not allowed to choose was examined, 3 of the 11
scales did not show metric forms of measurement invariance. This result indicated that when
choosing a medium is held constant, Internet versions of non-cognitive assessments can be
equivalent to paper-and-pencil formats.
Though these findings suggest that transferring a non-cognitive assessment to an
alternative medium may not adversely affect the equivalence of that assessment, there is almost
no available research on the equivalency of non-cognitive assessments delivered via mobile
devices. However, a recent unpublished study conducted by Morelli et al. (2012) has
demonstrated that mobile and non-mobile devices display measurement equivalence for a non-
cognitive assessment delivered to an applicant sample. In their study, Morelli et al. (2012)
18
sampled 1 million individuals who applied for a sales job at a large national retail chain. Out of
this larger sample, 5,000 individuals, or less than 1% of the total sample, used a mobile phone or
tablet computer to complete the online assessment. Biodata items delivered in an unproctored,
online test were used to assess six non-cognitive constructs related to successful performance of
the job (e.g., conscientiousness, customer service orientation, integrity, interpersonal skills, stress
tolerance, and teamwork). The authors compared the psychometric equivalence of non-mobile
devices (i.e., PCs, Macintosh computers, gaming consoles) to mobile devices (i.e., Smartphones,
tablet computers) for each construct independently using MGCFA, in addition to observed mean
comparisons. They discovered that the cross-device comparisons demonstrated the fundamental
types of measurement invariance (i.e., configural and metric invariance) as well as the more
restricted types of measurement invariance (e.g., scalar invariance and invariance of
uniquenesses). The authors also found no practically significant observed mean differences
between the five device groups, except for the gaming console device group, which had a lower
overall mean than all other device types that was practically meaningful.
Summary. The studies sampled in this section have shown evidence that suggests the
same non-cognitive construct is measured whether the test is delivered via paper-and-pencil or
via a computer. An initial study also suggests that there are may be no medium-related
differences at the latent measurement level between mobile and non-mobile devices (Morelli et
al., 2012). Although this study provides a useful starting point for understanding mobile and non-
mobile device equivalence, the Morelli et al. study was limited to a text-based, non-cognitive
assessment. As more organizations implement other types of selection tools for job applicants,
sources of construct-irrelevant variance related to a lack of standardization across device
mediums could be introduced (Scott & Mead, 2011).

19
Equivalence of Computerized Work Simulations
To this point, the literature relevant to mobile device-delivered measures for specific
constructs such as cognitive ability (Schroeders & Wilhelm, 2010) and conscientiousness
(Chuah, Drasgow, & Roberts, 2006) has been discussed. However, in many currently
implemented selection batteries, other computerized measures are now included to predict job
performance by assessing non-construct-specific work-related knowledge, skills, abilities, and
other characteristics. These measures are often described as “methods” in that they predict future
performance by measuring applicants reactions to simulated work activities or scenarios most
likely encountered on the job (Christian, Edwards, & Bradley, 2010; Roth, Bobko, McFarland, &
Buster, 2008). In increasing numbers, computerized assessments that recreate work-related tasks
are being delivered using multimedia content and online platforms (e.g., McNelly, Ruggeberg, &
Hall, 2011). Multimedia assessments typically include images such as video or photographs
sometimes accompanied by sound or verbal interactivity, such as recorded messages or webcam
responses.
Early comparison studies of computerized work simulation tasks, including multimedia
versions, explored the equivalency of respondent perceptions and attitudes for paper-and-pencil
versions (Richman-Hirsch, Drasgow, & Olson-Buchanan, 2000; Weichmann & Ryan, 2003).
Interestingly, these studies discovered that computerized versions of these work simulations were
perceived by respondents as more face valid and engaging. Also, more contemporary studies
have examined performance differences in educational testing scenarios and have found that
converting static, text-based information into multimedia formats increases student test
performance as individual item difficulty increases (Hao, 2010; Lai, Chen, & Chen, 2008). This
result is most likely due to multimedia testing formats decreasing the reliance on more
20
cognitively difficult tasks, such as reading comprehension, and increasing the amount of
information that is supplied to the test taker.
Although informative, these studies have not yet examined how delivering similar
multimedia content across devices with varying hardware and software capabilities may impact
the reception and processing of that content. Using Leeson’s (2006) “mode effect” dimensions, a
reasonable expectation is that smaller screen sizes and lower screen resolutions would inhibit a
respondent’s ability to fully use the extra information delivered via multimedia images. In other
words, Leeson summarized that smaller screen sizes and resolutions would negatively impact
performance by requiring more scrolling and manipulation of a computerized image. Clearly,
accessing multimedia content via a smaller and more difficult to manipulate screen on a mobile
device may negatively impact applicant performance, but it is not clear that this increased
difficulty will translate to latent measurement differences in the job-related skill being tested.
Another work simulation example is the SJT, which has been described as a series of job-
related scenarios where respondents are asked to either rate or choose the most effective action to
take in response to each scenario (Motowidlo et al., 1990). SJTs have gained increased
popularity in that they tend to have moderate incremental validity over other selection predictors
and demonstrate lower sub-group differences than other selection predictors (Clevenger, Pereira,
Harvey, Wiechmann, & Schmitt, 2001; Lievens & Sackett, 2006). Undoubtedly, applicants are
also accessing these types of assessments on mobile devices if SJTs are included as part of a
larger, unproctored, online selection battery. Thus, as with any other format change, testing best
practice dictates that equivalency should also be determined for this testing method (Joinson,
1999; Ployhart et al., 2003; American Educational Research Association et al., 1999).

21
Existing SJT comparison studies have primarily focused on three areas regarding
equivalence: 1) contextual effects, such as the differences between applicant versus incumbent
responses or behavioral versus knowledge-related response instructions (Mackenzie, Ployhart,
Weekley, & Ehlers, 2010; McDaniel, Hartman, Whetzel, & Grubb, 2007), 2) differences in
predictive validities between video versus paper-and-pencil versions (Chan & Schmitt, 1997;
Lievens & Sackett, 2006; Olson-Buchanan & Drasgow, 2006), and 3) the impact of
administration medium on applicant reactions (Richman-Hirsch, Drasgow, & Olson-Buchanan,
2000). These separate research streams have found differences in incremental validities, sub-
group differences, and applicant reactions suggesting that significant version changes for SJTs
have often implied a lack of equivalence.
For instance, Lievens and Sackett (2006) examined if the predictive validity of a video-
based SJT that was intended to measure interpersonal and communication skills would transfer if
converted to a written format. The SJT was administered as part of an admissions exam for a
Belgian medical school. The scores from two applicant pools, one administered the video-based
version and one administered the same content in a written version, were compared. Lievens and
Sackett discovered that the predictive validity of the video-based version was not comparable to
the written version, and the written version was more highly correlated with a cognitive ability
measure. The authors determined that the higher fidelity of the video-based SJT to the
performance criterion contributed to the higher validity coefficient. Although this finding did not
focus on the interrelationships of the items in the measure, it is important as it suggests
dramatically converting the delivery format of the SJT could produce performance differences
between groups. However, it remains unclear if this finding applies when the basic format is
22
unchanged but the delivery device held constant (e.g., video-based items displayed on a
computer versus video-displayed items displayed on a television).
Unfortunately, little research has been conducted comparing SJTs across delivery
mediums when the SJT format stays constant (Olson-Buchanan & Drasgow, 2006). This makes
postulating expected sources of invariance difficult to pinpoint, but given the instance where the
content type stays constant (i.e., text-based content delivered on different media), a reasonable
expectation would be that the SJT would function similarly to other cognitive and non-cognitive
measures. The main difference between these versions is the increased cognitive load put on the
applicant by the longer and more involved item scenarios and responses associated with SJTs.
Summary. Computerized work simulations such as online, multimedia work simulations
and situational judgment tests have seen an increase in popularity and application due to their
relatively high fidelity to workplace tasks, incremental validity over other more traditional
performance predictors, low sub-group differences, and positive reactions by job applicants.
However, the number of studies comparing the equivalency of these tests across delivery
mediums has been low and what studies do exist suggest that changing formats for these
assessments may introduce medium-related effects on performance scores. Thus, it is imperative
that new research be conducted to determine how applicants may perform differently for
assessments using simulated images or scenarios when accessed on untested hardware types.
The Current Study
In review, new advances in computer and online technology have created the next
iteration of assessment delivery mediums, particularly mobile devices (e.g., Smartphones). The
existing equivalency literature comparing computerized or online versions of cognitive and non-
cognitive assessments reveal that these mediums are generally equivalent to paper-and-pencil
23
versions (e.g. Schroeders & Wilhelm, 2011). Also, mobile device-related findings from the
closely-related educational literature and an initial, unpublished study demonstrate that cognitive
and non-cognitive assessments delivered via mobile devices to job applicants may be equivalent
to standard computers. However, the latent level comparisons for cognitive constructs must be
examined and the initial results on non-cognitive construct equivalence must be replicated using
a different sample of job applicants and job families. Therefore, the following hypotheses have
been developed by leveraging the initial findings on mobile device equivalence and the
inferences that can be made from the existing literature:
H1: Mobile and non-mobile devices will have equivalent measurement models for the
cognitive ability assessment.
H2: Mobile and non-mobile devices will have equivalent measurement models for the
assessment of non-cognitive constructs.
In contrast to the previously described measures of cognitive ability and non-cognitive
constructs, which assume that the applicant’s test-taking experience will stay reasonably
consistent across mobile and non-mobile devices, computerized work-simulations do not share
the same assumption by default. Although accessing a test using two different devices does not
necessarily make them non-equivalent, differences between devices such as screen size may
affect the standardization of the testing experience, which is a prerequisite for equivalence (Scott
& Mead, 2011). Because a multimedia assessment may be impacted by mobile device-related
changes in interface characteristics (e.g., smaller screen size or poorer screen resolution) and
device functionality (e.g., increased scrolling requirements), the following hypothesis is
predicted:
24
Hypothesis 3: The measurement models for mobile and non-mobile devices will not
exhibit full factorial invariance when displaying assessments with multimedia
components (e.g., images), but may exhibit partial factorial invariance.
In comparison, when a SJT is primarily text-based, a reasonable expectation is that it will
function similarly to a cognitive or non-cognitive assessment across devices. Therefore, the
following hypothesis is predicted:
Hypothesis 4: Mobile and non-mobile devices will have equivalent measurement models
for a text-based situational judgment test.

25
CHAPTER 3
METHOD
Procedure
This research was conducted by gathering archival response data from an unproctored,
online selection battery (assessment titles and job family names have been changed to maintain
the host organization’s confidentiality). The selection battery was developed by a team of
external consultants tasked with measuring the cognitive and non-cognitive predictors of future
job performance for positions in a large, multi-national organization in the hospitality industry.
To examine the widest array of selection measures, two job families from the overall battery
were selected for the current study: Internal Service and Maintenance (ISM) and Customer
Facing (CF). The positions in the ISM job family can be best described as skilled and semi-
skilled hourly positions such as food preparation, housekeeping, and building and grounds
maintenance. Positions in the CF job family are hourly positions that typically interact with
customers on a daily basis, such as bell hops or front desk receptionists. The consulting team
conducted concurrent criterion-related validation studies for each job family as part of the
original development process to establish that the assessments were psychometrically sound and
predicted job performance. The final assessments were integrated into the organization’s web
portal and made available to applicants in January 2010. The data made available for this study
included all applicant responses from April 2011 to September 2012.
All of the assessments were designed to be administered online in an unproctored testing
environment and were accessed via the participating organization’s website. To enhance
assessment security, alternate forms of each assessment were developed and the presentation of
the items was randomized within each test form across applicants. There was no limitation as to
26
what device, browser, or operating system applicants were allowed to use. When the applicant
accessed the web portal, their selected language, form of assessment, all response data, browser,
operating system and device type (e.g., PC, Android™ phone) were recorded. Therefore,
applicants for both job families were not randomly assigned to the different device types (i.e.,
mobile, non-mobile), instead, applicants self-selected into each experimental condition or group
by choosing to complete the Internet-based assessment battery using a particular device.
Sample
Two samples were used in this study, each representing individuals based domestically in
the United States and who were applying for a particular job family within the hospitality
organization. The first job family sample represented applicants to the Internal Service and
Maintenance jobs. Of these applicants, a total of 11,169 completed the online selection battery
using a mobile device (i.e., Smartphone; for example iPhone™, Android™ phone, Blackberry™)
and 209,272 completed the online selection battery using a non-mobile (i.e., PC) device.
The second job family represented applicants to the Customer Facing jobs. Of these
applicants, a total of 13,023 applicants completed the selection assessment battery using a mobile
device and 375,054 applicants completed the selection battery using a non-mobile device.
Demographic data were not available for either sample.
These sample sizes represent the applicants from both job family samples who met the
following criteria: applicants must have (a) completed the online assessment through the
organization’s web portal, (b) had device data available, (c) completed the assessment only once
and with only one device type, (d) completed the same form (Form A) and language (English)
version of a particular assessment, and (e) had responses that were complete for all items and
demonstrated variability that was greater than zero.
27
Assessments
The selected assessments in the ISM job family selection battery included a cognitive
ability-type assessment labeled Learning, a biodata assessment of a competency labeled
Conscientiousness, a biodata assessment of a competency labeled Customer Service Orientation,
and a multimedia (i.e., images) work environment simulation that measured a competency
labeled Neatness. The examined assessment from the CF job family selection battery included a
SJT that measured the Customer Service competency. Each assessment was developed by an
external team of organizational testing experts tasked with measuring the essential competencies
for the organizational positions as defined by a job analysis. Although alternate forms were
created for each assessment, the current study focused on a consistent form within a particular
job family. Table 1 provides a summary description of the assessment type, the item type,
scoring, number of items, and associated job family for each assessment.
Cognitive ability assessment. The cognitive ability Learning assessment consisted of 11
items measuring an applicant’s ability to learn and follow instructions. The assessment presented
applicants with written instructions for how a guest room or facility area should be arranged or
maintained. The applicants were then shown a series of pictures that represented varying degrees
of adherence to these rules; job experts created and scored these pictured scenes. Applicants
were asked to determine how well each picture followed the written instructions by indicating
how many “mistakes” were made in the photograph. Audio narration of the written instructions
and questions were provided to reduce the reliance on literary skills and no time limit was
imposed. The items were dichotomously scored as either 1 (correct) or 0 (incorrect).

28
Table 1
Description of Assessments
Title Type Item Type Scoring
Number of
Itemsa
Job
Family
1. Learning Cognitive ability Multiple Choice Dichotomous 11 ISM
2. Conscientiousness Competency Biodata Polytomous 12 ISM
3. Customer Service Orientation Competency Biodata Polytomous 8 ISM
4. Neatness Competency Multimedia/Simulation Polytomous 10 ISM
5. Customer Service Competency SJT Polytomous 10 CF
Note: a = Number of items for the chosen form of the operationally delivered assessment; ISM = Internal Service and
Maintenance; CF = Customer Facing; SJT = Situational Judgment Test.
29
During the original assessment development, the final item list was retained based on
identifying items that had moderate point-biserial correlations (i.e., greater than .30 and less than
.80) and no sub-group mean differences. The reported internal consistency coefficient, based on
a composite reliability coefficient (Nunnally & Bernstein, 1994), generated from a validation
sample (n = 372) was α = .81.
Biodata assessments. The biodata assessments measured the competencies
Conscientiousness (n = 12) and Customer Service (n = 15), by evaluating life and work
experiences from a historical perspective (e.g., Mumford & Owens, 1987; Mumford & Stokes,
1992; Nickels, 1994). This involved asking applicants about their values, opinions, and attitudes
as related to their past experiences specific to the constructs measured in the assessment battery.
Biodata items were text-based and rationally keyed by the assessment developers on a +1, 0, and
-1 scale. A response of +1 represents being high on the attribute measured, a response keyed 0
indicates being neither high nor low on the attribute, and -1 represents being low on the
measured attribute. There was no time limit imposed for this component. Although each of these
assessments demonstrated adequate internal composite reliability coefficients (α = .80, .89), the
test developers retained items primarily on the basis of predictive validity versus explanatory
aspects of a theoretical model of the applicant population.
Multimedia work simulation. Next, the test developers identified a competency that
acted as a relevant predictor of performance for the ISM jobs during the job analysis, which they
labeled Neatness. As a result, a quasi-work simulation was created to measure an applicant’s
determination of the neatness of a photographed hotel area. A variety of guest rooms and facility
areas that ranged from very neat to very messy, as determined by job experts familiar with
company standards, were photographed and shown to applicants. Applicants were then asked to

30
determine, on a 1 (very messy) to 5 (very neat) Likert-type scale, the neatness or messiness of the
photographed area. Because of the heavy use of photographs, this predictor assessment can be
labeled as a multimedia test in a simulated work environment. A total of 40 items were originally
developed (composite α = .59); however, during the validation process, the test developers
discovered that this assessment was measuring multiple constructs and decided to retain items
based on rating agreement levels between subject matter experts. Therefore, only 10 items were
available from the chosen version of the Neatness assessment delivered to the ISM job family
(Table 1).
Situational judgment test. Lastly, a situational judgment test (SJT) was developed to
measure a Customer Service competency for the CF jobs. SJTs are designed to recreate
ecologically valid scenarios that an incumbent may face on the job along with a multiple choice
list of potential behavioral responses. The test development team created the assessment by
gathering critical incidents reported by job experts, drafting initial items and responses, and then
validating the items by subject matter experts rating the realism and performance relatedness of
each scenario. In a similar fashion to the biodata items, the SJT response options were rationally
keyed on a +1, 0, and -1 scale; however, in this case a response option scored as a +1 represents
a behavior reflective of the competency, a 0 represents a neutral behavior, and -1 represents a
behavior not reflective of the competency. Again, similar to the biodata items, the final SJT item
set (n = 10) was retained based primarily on each item’s criterion-related validity and less on
each item’s psychometric components (composite α = .50).
Data Analysis
Measurement invariance tests. To verify the measurement equivalence/invariance across
different testing formats, such as mobile and non-mobile devices, a sequence of nested models
31
can be tested using multi-group confirmatory factor analysis (MGCFA; Steenkamp &
Baumgartner, 1998; Vandenberg & Lance, 2000). Instead of examining equivalence across item-
level parameters, such as in differential item functioning, MGCFA (Vandenberg, 2002) was
chosen as the appropriate analysis methodology in the current study for the following reasons.
MGCFA is particularly useful when determining ME/I at the scale level. MGCFA also uses fit
indices that can streamline comparisons between groups, and it allows for comparisons with
similar research on the equivalency of assessments delivered on mobile devices (Cole, Bedeian,
& Feild, 2006; Morelli et al., 2012; Raju, Laffitte, & Byrne, 2002; Reise, Widaman, & Pugh,
1993).
The typical model testing sequence recommended by Vandenberg and Lance (2000) for
continuous outcome variables begins with estimating a baseline model that compares the pattern
of fixed and free factor loadings for each group (i.e., configural invariance). Next, a series of
more restricted nested models are compared to the baseline model to test for potential sources of
invariance. These models first test the equivalence among the factor loadings (i.e., metric
invariance), then the item intercepts (i.e., scalar invariance), the measurement errors (i.e.,
uniqueness/residual variance invariance), and the invariance of the latent factor variances and
covariances (Cole, Bedeian, & Feild, 2006; Steenkamp & Baumgartner, 1998; Vandenberg &
Lance, 2000). Metric invariance tests for potential differences in the rating scales across devices
and is determined by constraining the factor loadings to equality, whereas scalar invariance tests
for potential differences in the item intercepts (observed means) across devices. To identify
scalar invariance, the metric invariance constraint is imposed in addition to constraining the item
intercepts to equality. Configural, metric, and scalar invariance tests ensure that the psychometric
properties of a scale or measure are equivalent across groups (French & Finch, 2006). Then, if

32
the three previous invariance tests are supported, researchers may also test the uniqueness and
factor variance/covariance equivalence to determine if measures are tapping equivalent latent
constructs with similar levels of measurement error.
While the previously described measurement invariance test sequence, which typically uses
the maximum likelihood (ML) estimator, work well for reasonably normal, continuous data
(French & Finch, 2006; Meade & Lautenschlager, 2004), using this same sequence and
estimation procedure with ordinal data could lead to a number of problems. For instance, ordinal
data do not meet the ML assumption of multivariate normality; violating this assumption can
result in distorted factor structure estimations when using multiple groups, attenuated standard
error estimates, and misleading ME/I tests (Lubke & Muthén, 2004; Flora & Curran, 2004).
These issues were addressed in the current study by estimating model parameters for ordinal
data using a robust weighted least squares estimator. Specifically, the mean- and variance-
weighted least squares estimator (WLSMV; Kline, 2011) utilized in Mplus version 5.1 was used
(Muthén & Muthén, 2010). The WLSMV estimator is more suitable for ordered-categorical
items in that it analyzes tetrachoric correlation matrices for dichotomous items and polychoric
correlation matrices for polytomous items. These correlations assume an underlying continuous
distribution exists for the ordinal scoring of an item set, which prevents the item parameters from
being underestimated (Flora & Curran, 2004). WLSMV also does not violate the multivariate
normality assumption of ML estimation and has been shown to generate more accurate model
test rejection rates and factor loadings than ML when using ordinal data, particularly when the
observed variables only have 2 or 3 response categories (Beauducel & Herzberg, 2006).
In addition, a modified ME/I test sequence described by Muthén and Muthén (2010) was
followed to address the complications with ordinal data, such as the ordered-categorical outcome
33
variables used in the current study (i.e., Likert-style items; rationally scored three-point scales;
Millsap & Yun-Tein, 2004). The testing sequence recommended by Muthén and Muthén consists
of two model tests. First, the configural test is conducted by freely estimating the thresholds and
factor loadings in both groups, and fixing the factor means to 0 and the residual variances to 1
for identification purposes. Next, the scalar invariance test is conducted by fixing the thresholds
and factor loadings to equality across groups; the residual variances and factor means are fixed in
one group and freed in the other. The metric test is skipped in this testing sequence because the
factor loadings and item intercepts (i.e., the item thresholds for categorical data) must be freed or
constrained together to account for item characteristics curves containing both components
(Millsap & Yun-Tein, 2004; Muthén & Christoffersson, 1981). With categorical data, thresholds
are used instead of item intercepts because they designate the point on the latent response
variable where a particular answer category is designated if the threshold is met or unmet (Kline,
2011).
In addition to the two model tests proposed by Muthén & Muthén (2010) a third and more
restrictive invariance test of the residual variances was conducted. Although this test has
traditionally been considered overly restrictive and impractical in most instances (Steenkamp &
Baumgartner, 1998), Millsap and Yun-Tein (2004) recommended this test as being part and
parcel of the complete test of ME/I as it includes all of the relevant item parameters. These
relevant item parameters are the item thresholds (υ) and the factor model parameters;
specifically, the latent intercepts (τ), factor loadings (Λ), and residual variances (Θ).
Conceptually, this test a necessary condition for ME/I in that it demonstrates the scalar
invariance results are not being distorted or clouded due to systematic error (e.g., unmeasured
variables) effects related to group membership (DeShon, 2004; Wu, Li, & Zambo, 2007).
34
Assuming that the previously described nested model tests indicate complete invariance
between the device groups, a final model constraining the factor variances to equality under the
scalar model constraint was compared across groups. Although this test was not considered a
nested invariance model test (Millsap & Yun-Tein, 2004), model equivalence for the factor
variances establishes the homogeneity of variance assumption, which allows meaningful latent
mean differences to be made (Ployhart & Oswald, 2004). Estimating the latent mean differences
is a powerful indication of potential performance differences across devices (Mueller, Liebig, &
Hattrup, 2007) and an important type of comparison to make when changing test formats (Scott
& Mead, 2011).
To summarize, Mplus v5.1 and the WLSMV estimator were used to conduct the following
nested ME/I tests for ordered-categorical data: configural invariance, scalar invariance, and the
invariance of the residual variances between groups. The Theta parameterization in Mplus was
used to allow the manipulation of the residual variances (Muthén & Muthén, 2010). A fourth,
non-nested model, which constrained the factor variances to equality between groups, was also
conducted to establish the homogeneity of variance assumption and facilitate the detection of
meaningful group differences between the factor means.
Model fit tests. Typically, χ2 difference tests between each nested model (e.g., metric
invariance model within the configural invariance model) are conducted to approximate a lack of
ME/I as evidenced by a significant reduction in fit (Meade et al., 2007). Because the WLSMV
estimator computes χ2
values and degrees of freedom (df) in a different manner than ML, the χ2
statistic and degrees of freedom cannot be used to compute the Δ χ2
statistic. Therefore, the
DIFFTEST feature in Mplus was used to approximate the change or deterioration in model fit
35
using the χ2
statistic; here, a significant Δ χ2
value indicates a significant deterioration of fit
between the nested models.
However, the χ2
statistic is overly sensitive to sample size and may not always be an
appropriate indication of poor model fit (Brannick, 1995). Thus, the change in the comparative
fit index (ΔCFI) was used as an alternative for comparing the fit between models (Chueng &
Rensvold, 2002). A recent ME/I simulation study conducted by Meade, Johnson, and Braddy
(2008) recommended a cutoff criterion for evaluating ΔCFI values to be less than or equal to
.002.
In addition to the CFI, the Tucker Lewis Index (TLI) and the root mean squared error of
approximation (RMSEA) fit indices were also used to determine appropriate model fit for the
individual models. The following criteria were used regarding these fit indices to determine if a
model was appropriately fitting the observed data: 1) RMSEA values were less than or equal to
.08, and 2) CFI and TLI values were greater than or equal to .95 (Hu & Bentler, 1999).
36
CHAPTER 4
RESULTS
Assessment Dimensionalities and Descriptive Statistics
Before testing the ME/I hypotheses, exploratory and confirmatory factor analyses (EFA;
CFA) using Mplus v5.1 (Muthén & Muthén, 2010) were conducted for each assessment. Both
analyses were conducted on holdout samples to determine the dimensionality and final item set
for each assessment. These preliminary analyses were performed for several reasons.
First, the applied nature of the data required a re-examination of the underlying factor
structure for each assessment. As with most applied data, the original test developers’ main goal
focused more on differentiating between applicants and less on defining a formal factor structure.
Thus, a determination and confirmation of the factor structure imposed on the final, delivered
item set was a necessary prerequisite to specifying a stable measurement model for the
configural ME/I test (Vandenberg & Lance, 2000).
Second, the internal consistency coefficients reported by the test developers do not
guarantee unidimensionality. As is the case with Cronbach’s alpha, an internal consistency
measure only tests the interrelatedness of the items and not the first factor saturation, or
unidimensionality, of the items (Cortina, 1993). As a result, the composite reliability coefficients
reported by the test developers help give a frame of reference for how the items relate to one
another, as well as how cohesive the item set was among the validation sample, but an analysis
of the underlying factor structure is necessary to help describe the assessments at the latent level.
37
Finally, establishing each assessment’s dimensionality simplifies the interpretation of the
ME/I test results; EFA and CFA allow a researcher to reduce the observed items into a more
parsimonious single factor solution for each assessment in the study. As the purpose of the
current study was to investigate the equivalence of a given assessment delivered across different
device types, a single factor solution extracted by EFA, and confirmed by CFA, allowed for the
most direct interpretation of the ME/I results. In other words, extracting multiple factors would
have made interpreting the factors incumbent on the item content; this was less desirable when
the focus was on the devices versus the assessments themselves.
Due to the categorical nature of the data, the EFAs and CFAs used WLSMV (Muthén &
Muthén, 2010; Woods, 2002) as opposed to ML. Holdout samples from each job family sample
(e.g., ISM and CF; n = 500) were also used for the EFA of each assessment. Initially, WLSMV
estimates were conducted on the full item sets for each assessment, and one through three factor
solutions were examined for simple structure and interpretability. Oblique (promax) rotation was
used because it was assumed any extracted factors would be correlated (Bandalos & Boehm,
2009). As previously noted, the objective of this initial analysis was to determine the factor
structure of the full item set for each assessment and then reduce the items to a single factor
solution by examining the communalities, eigenvalues, and scree plots. Items were selected
using the following criteria: .20 for communalities and .32 for factor loadings (Kim & Mueller,
1978; Tabachnick & Fidell, 2001). Items that did not meet these cutoffs for a single factor or
cross-loaded on more than one factor were removed. The resulting item sets were then re-
examined using one to three factor solutions to verify their unidimensionality. Specifically, item
sets that resulted in one factor solutions with eigenvalues greater than 1, displayed one-factor
scree plots (i.e., Cattell test), and had non-significant chi-square values were selected for follow-
38
up CFAs. An examination of the number of items retained (Table 3) reveals that each assessment
had to be reduced to determine a final item set that maintained a unidimensional factor structure.
To confirm the single factor solution of the reduced item sets, a CFA was also performed
using Mplus v5.1 and the WLSMV estimator on separate holdout samples (n = 300) for each
device group and job family (ISM mobile; ISM non-mobile; CF mobile; CF non-mobile). The
final item sets were constrained to a single factor solution for each assessment and model fit was
determined using the following goodness-of-fit indices: the χ2 statistic, the CFI, the TLI, the
RMSEA, and the weighted root mean square residual (WRMR) (Tanaka, 1993; Hu & Bentler,
1999; Yu, 2002). Non-significant χ2
values were considered evidence for a well fitting model,
whereas the following criteria were used for the alternative fit indices: 1) RMSEA values less
than or equal to .08, 2) CFI and TLI values greater than or equal to .95 (Hu & Bentler, 1999),
and 3) WRMR values less than or equal to 1.0 (Yu, 2002). Appendices A and B supply the
standardized factor loadings for each assessment’s reduced item set.
Table 2 provides the fit index results for each model. All but two of the CFA models
(Conscientiousness non-mobile and Neatness non-mobile) had non-significant chi-square values.
Although the Conscientiousness non-mobile and Neatness non-mobile models exhibited
significant χ2 values, the alternative fit indices suggested that the one-factor solution for these
items met a priori determined cutoff criteria. These results suggested that for each device group,
an item set from each assessment’s originally distributed and scored item pool could be
associated with a single latent factor. This greatly aided in testing the measurement equivalence
of the most parsimonious models possible.
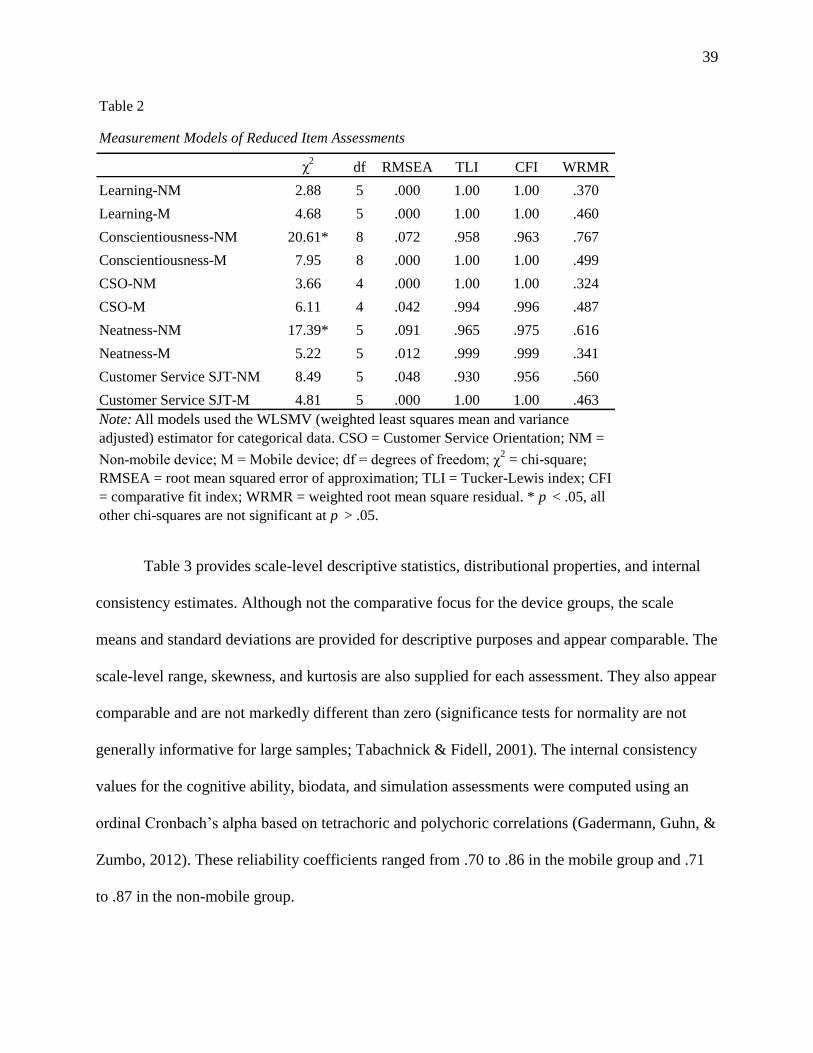
39
Table 2
Measurement Models of Reduced Item Assessments
χ2
df RMSEA TLI CFI WRMR
Learning-NM 2.88 5 .000 1.00 1.00 .370
Learning-M 4.68 5 .000 1.00 1.00 .460
Conscientiousness-NM 20.61* 8 .072 .958 .963 .767
Conscientiousness-M 7.95 8 .000 1.00 1.00 .499
CSO-NM 3.66 4 .000 1.00 1.00 .324
CSO-M 6.11 4 .042 .994 .996 .487
Neatness-NM 17.39* 5 .091 .965 .975 .616
Neatness-M 5.22 5 .012 .999 .999 .341
Customer Service SJT-NM 8.49 5 .048 .930 .956 .560
Customer Service SJT-M 4.81 5 .000 1.00 1.00 .463
Note: All models used the WLSMV (weighted least squares mean and variance
adjusted) estimator for categorical data. CSO = Customer Service Orientation; NM =
Non-mobile device; M = Mobile device; df = degrees of freedom; χ2 = chi-square;
RMSEA = root mean squared error of approximation; TLI = Tucker-Lewis index; CFI
= comparative fit index; WRMR = weighted root mean square residual. * p < .05, all
other chi-squares are not significant at p > .05.
Table 3 provides scale-level descriptive statistics, distributional properties, and internal
consistency estimates. Although not the comparative focus for the device groups, the scale
means and standard deviations are provided for descriptive purposes and appear comparable. The
scale-level range, skewness, and kurtosis are also supplied for each assessment. They also appear
comparable and are not markedly different than zero (significance tests for normality are not
generally informative for large samples; Tabachnick & Fidell, 2001). The internal consistency
values for the cognitive ability, biodata, and simulation assessments were computed using an
ordinal Cronbach’s alpha based on tetrachoric and polychoric correlations (Gadermann, Guhn, &
Zumbo, 2012). These reliability coefficients ranged from .70 to .86 in the mobile group and .71
to .87 in the non-mobile group.
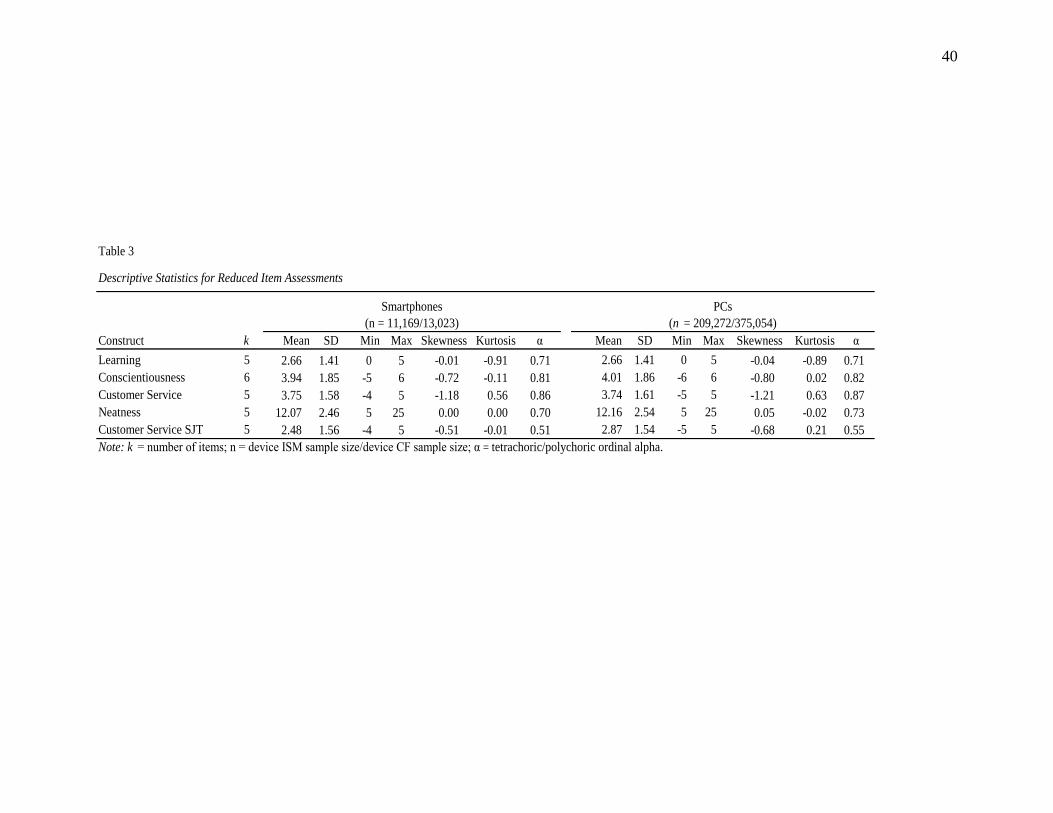
40
Table 3
Descriptive Statistics for Reduced Item Assessments
Construct k Mean SD Min Max Skewness Kurtosis α Mean SD Min Max Skewness Kurtosis α
Learning 5 2.66 1.41 0 5 -0.01 -0.91 0.71 2.66 1.41 0 5 -0.04 -0.89 0.71
Conscientiousness 6 3.94 1.85 -5 6 -0.72 -0.11 0.81 4.01 1.86 -6 6 -0.80 0.02 0.82
Customer Service 5 3.75 1.58 -4 5 -1.18 0.56 0.86 3.74 1.61 -5 5 -1.21 0.63 0.87
Neatness 5 12.07 2.46 5 25 0.00 0.00 0.70 12.16 2.54 5 25 0.05 -0.02 0.73
Customer Service SJT 5 2.48 1.56 -4 5 -0.51 -0.01 0.51 2.87 1.54 -5 5 -0.68 0.21 0.55
Note: k = number of items; n = device ISM sample size/device CF sample size; α = tetrachoric/polychoric ordinal alpha.
PCs
(n = 209,272/375,054)
Smartphones
(n = 11,169/13,023)
41
Although these reliability coefficients are somewhat lower than recommended by empirical
standards (Lance, Butts, & Michels, 2006), these coefficients appear comparable between
groups.
The SJT ordinal alpha was .51 in the mobile Smartphone group and .55 in the non-mobile
PC group. It is worth noting that the EFA and CFA conducted on the Customer Service SJT was
able to reduce the items to an approximately unidimensional factor; but, due to the
multidimensionality commonly found with SJTs there are most likely other plausible alternative
models than the observed items chosen as the final SJT factor. The lower internal consistency
estimates for this assessment, seen in Table 3, also bear this out. However, these findings are not
unusual as SJTs have been shown to measure multiple constructs at once and typically have
lower internal consistencies, yet still be viable measures of job performance (Lievens & Sackett,
2006; Schmitt & Chan, 2006). Appendices C-G provide the inter-item tetrachoric and polychoric
correlation matrices for the reduced item assessments.
Measurement Equivalence/Invariance
Once stable, single factor measurement models among the observed items for each
measure were specified, the hypotheses were tested by examining the equivalence of the
measurement models for each selection assessment across the mobile and non-mobile device
groups. To summarize the data analysis strategy previously described, multiple group analyses
were conducted via a series of hierarchically nested CFA models. The models were constrained
in a sequential fashion to identify potential sources of invariance among the factor loadings and
thresholds, as prescribed by Muthén and Muthén (2010). The first model, labeled configural,
allows the factor loadings and thresholds to be estimated freely while constraining the residual
variances to 1 in both groups (for identification purposes) and the factor means to 0. The second
42
model, labeled scalar, then constrains the factor loadings and thresholds to equality and allows
the factor mean and residual variances to be freely estimated in the comparison group (i.e., the
mobile Smartphone device group). Lastly, as prescribed in Millsap and Yun-Tein (2004), the
third model, labeled residual variances, followed the constraints of the Scalar model but instead
constrains the residual variances to equality in both device groups.
Because the χ2 test is overpowered due to sample size, the criterion of .002 for the ∆CFI
was used as the primary indication of significant decrement in fit between models. Each model
was estimated simultaneously for both groups to compare the fit indices already described. The
change in chi-square, computed using the DIFFTEST feature in Mplus v5.1, is also reported to
follow standard ME/I reporting protocol and to demonstrate a significant reduction in fit between
the nested models.
Invariance tests for assessments delivered to ISM job family. Table 4 provides the
model test results for the single factor measurement models constrained to the three levels of
invariance. The assessments included the cognitive ability Learning assessment, the
Conscientiousness biodata assessment, the Customer Service Orientation biodata assessment,
and the simulated, multimedia Neatness competency assessment. The χ2
statistic is provided to
follow standard reporting procedure (Jackson, Purc-Stephenson, & Gillaspy, 2009), but it is
worth repeating that the value calculated with the WLSMV estimator cannot be used for standard
χ2
difference tests. Thus, the ∆χ2
values indicate a significant deterioration in fit with the more
restricted models.
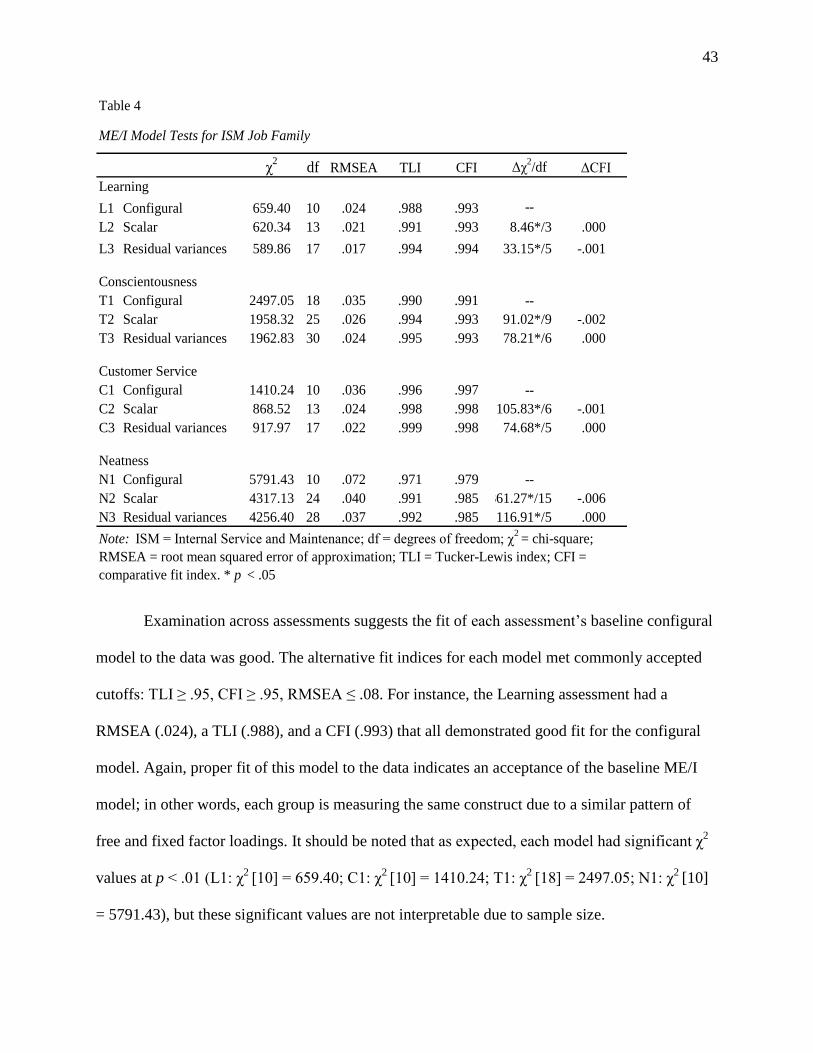
43
Table 4
ME/I Model Tests for ISM Job Family
χ2
df RMSEA TLI CFI Δχ2/df ΔCFI
Learning
L1 Configural 659.40 10 .024 .988 .993 --
L2 Scalar 620.34 13 .021 .991 .993 8.46*/3 .000
L3 Residual variances 589.86 17 .017 .994 .994 33.15*/5 -.001
Conscientousness
T1 Configural 2497.05 18 .035 .990 .991 --
T2 Scalar 1958.32 25 .026 .994 .993 91.02*/9 -.002
T3 Residual variances 1962.83 30 .024 .995 .993 78.21*/6 .000
Customer Service
C1 Configural 1410.24 10 .036 .996 .997 --
C2 Scalar 868.52 13 .024 .998 .998 105.83*/6 -.001
C3 Residual variances 917.97 17 .022 .999 .998 74.68*/5 .000
Neatness
N1 Configural 5791.43 10 .072 .971 .979 --
N2 Scalar 4317.13 24 .040 .991 .985 361.27*/15 -.006
N3 Residual variances 4256.40 28 .037 .992 .985 116.91*/5 .000
Note: ISM = Internal Service and Maintenance; df = degrees of freedom; χ2 = chi-square;
RMSEA = root mean squared error of approximation; TLI = Tucker-Lewis index; CFI =
comparative fit index. * p < .05
Examination across assessments suggests the fit of each assessment’s baseline configural
model to the data was good. The alternative fit indices for each model met commonly accepted
cutoffs: TLI ≥ .95, CFI ≥ .95, RMSEA ≤ .08. For instance, the Learning assessment had a
RMSEA (.024), a TLI (.988), and a CFI (.993) that all demonstrated good fit for the configural
model. Again, proper fit of this model to the data indicates an acceptance of the baseline ME/I
model; in other words, each group is measuring the same construct due to a similar pattern of
free and fixed factor loadings. It should be noted that as expected, each model had significant χ2
values at p < .01 (L1: χ2
[10] = 659.40; C1: χ2 [10] = 1410.24; T1: χ
2 [18] = 2497.05; N1: χ
2 [10]
= 5791.43), but these significant values are not interpretable due to sample size.
44
The following model constraints fixed the factor loadings and thresholds to equivalence
across the device groups (L2, C2, T2, and N2). Overall, the alternative fit indices and χ2
values
displayed the same pattern of results. The χ2
values were significant, as expected when using
large sample sizes, but the alternative fit indices demonstrated good fit for these model
constraints. For instance, the Conscientiousness assessment (T2) displayed very good fit indices
for the scalar invariance model: RMSEA (.026), TLI (.994), and CFI (.993). Imposing these
constraints resulted in a deterioration of fit from the configural model as evidenced by the
significant Δχ2
values; but again, the change in CFI values did not cross the accepted cutoff value
suggesting that this deterioration in fit was not meaningful. In fact, each assessment
demonstrated a slight increase in CFI value between the configural and scalar models. The
adequate fit indices and inconsequential reduction in fit suggest that the equivalence of factor
loadings and thresholds can be supported for each assessment. In other words, similar latent
constructs are being assessed whether an applicant completed an item with a mobile or non-
mobile device, and these devices do not have meaningful observed item mean differences.
Lastly, Table 4 also reports the most restrictive invariance model test (L3, T3, C3, and
N3), invariance of the residual variances, which constrains the latent residual variances to
equivalence across device groups for each selection assessment. The high alternative fit index
values and lack of reduction in fit indicated by the ∆CFI indicated that constraining all item
parameters to equality, as prescribed by Millsap and Yun-Tein (2004), resulted in virtually no
meaningful change from the scalar model. This suggests that these assessments are displaying
strict measurement invariance; in other words, the scalar invariance finding is not being clouded
by unwanted systematic effects (Wu, Li, & Zumbo, 2007).
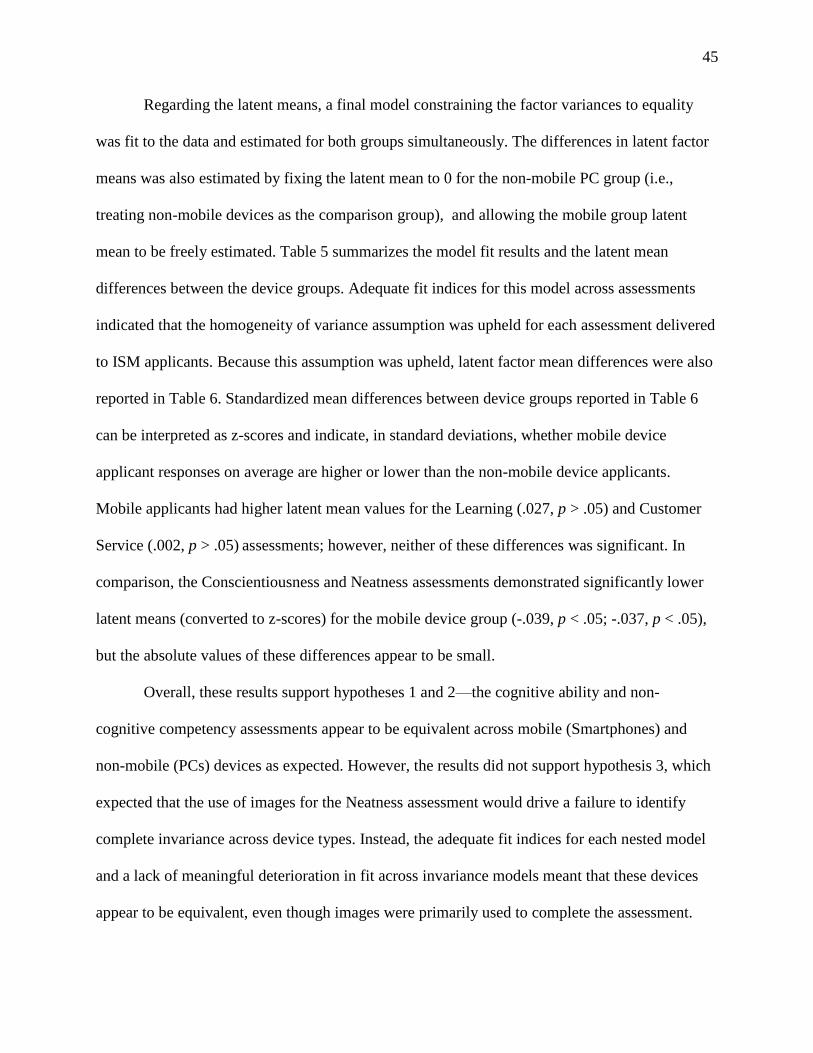
45
Regarding the latent means, a final model constraining the factor variances to equality
was fit to the data and estimated for both groups simultaneously. The differences in latent factor
means was also estimated by fixing the latent mean to 0 for the non-mobile PC group (i.e.,
treating non-mobile devices as the comparison group), and allowing the mobile group latent
mean to be freely estimated. Table 5 summarizes the model fit results and the latent mean
differences between the device groups. Adequate fit indices for this model across assessments
indicated that the homogeneity of variance assumption was upheld for each assessment delivered
to ISM applicants. Because this assumption was upheld, latent factor mean differences were also
reported in Table 6. Standardized mean differences between device groups reported in Table 6
can be interpreted as z-scores and indicate, in standard deviations, whether mobile device
applicant responses on average are higher or lower than the non-mobile device applicants.
Mobile applicants had higher latent mean values for the Learning (.027, p > .05) and Customer
Service (.002, p > .05) assessments; however, neither of these differences was significant. In
comparison, the Conscientiousness and Neatness assessments demonstrated significantly lower
latent means (converted to z-scores) for the mobile device group (-.039, p < .05; -.037, p < .05),
but the absolute values of these differences appear to be small.
Overall, these results support hypotheses 1 and 2—the cognitive ability and non-
cognitive competency assessments appear to be equivalent across mobile (Smartphones) and
non-mobile (PCs) devices as expected. However, the results did not support hypothesis 3, which
expected that the use of images for the Neatness assessment would drive a failure to identify
complete invariance across device types. Instead, the adequate fit indices for each nested model
and a lack of meaningful deterioration in fit across invariance models meant that these devices
appear to be equivalent, even though images were primarily used to complete the assessment.
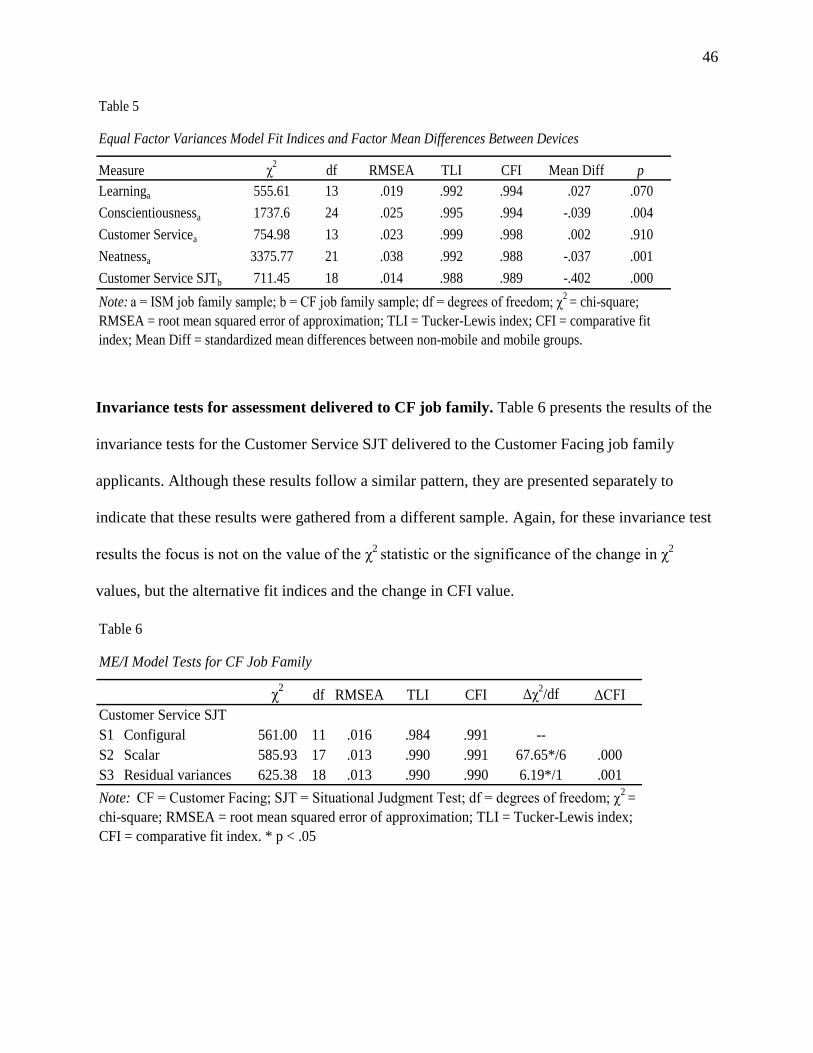
46
Table 5
Equal Factor Variances Model Fit Indices and Factor Mean Differences Between Devices
Measure χ2
df RMSEA TLI CFI Mean Diff p
Learninga 555.61 13 .019 .992 .994 .027 .070
Conscientiousnessa 1737.6 24 .025 .995 .994 -.039 .004
Customer Servicea 754.98 13 .023 .999 .998 .002 .910
Neatnessa 3375.77 21 .038 .992 .988 -.037 .001
Customer Service SJTb 711.45 18 .014 .988 .989 -.402 .000
Note: a = ISM job family sample; b = CF job family sample; df = degrees of freedom; χ2
= chi-square;
RMSEA = root mean squared error of approximation; TLI = Tucker-Lewis index; CFI = comparative fit
index; Mean Diff = standardized mean differences between non-mobile and mobile groups.
Invariance tests for assessment delivered to CF job family. Table 6 presents the results of the
invariance tests for the Customer Service SJT delivered to the Customer Facing job family
applicants. Although these results follow a similar pattern, they are presented separately to
indicate that these results were gathered from a different sample. Again, for these invariance test
results the focus is not on the value of the χ2
statistic or the significance of the change in χ2
values, but the alternative fit indices and the change in CFI value.
Table 6
ME/I Model Tests for CF Job Family
χ2
df RMSEA TLI CFI Δχ2/df ΔCFI
Customer Service SJT
S1 Configural 561.00 11 .016 .984 .991 --
S2 Scalar 585.93 17 .013 .990 .991 67.65*/6 .000
S3 Residual variances 625.38 18 .013 .990 .990 6.19*/1 .001
Note: CF = Customer Facing; SJT = Situational Judgment Test; df = degrees of freedom; χ2
=
chi-square; RMSEA = root mean squared error of approximation; TLI = Tucker-Lewis index;
CFI = comparative fit index. * p < .05

47
Fitting the configural model to the data for this job family resulted in good fit according
the reported indices. The high alternative fit indices demonstrated that the data fit well to the
unconstrained model (RMSEA = .016; TLI = .984, CFI = .991). ME/I was also supported at the
scalar level when adequate fit indices and the change in CFI were below the accepted cutoffs
(∆CFI ≤ .002).
The invariant residual variances model also demonstrated equivalence between groups.
Although there was a decrement in fit for the χ2 statistic (S3: Δχ
2 [18] = 6.19, p < .05) and the
ΔCFI value (.001), this decrement was not substantial enough to reject the equivalence of these
models. Thus, invariance tests among the three relevant item parameters indicated complete
invariance between mobile and non-mobile device groups. These results supported hypothesis 4,
which expected that the text-based SJT would be equivalent across device types.
Table 5 provides the equivalent factor variance fit indices and latent mean differences for
the Customer Service SJT. The alternative fit indices did not cross the accepted cutoffs already
stated, which indicates the homogeneity of variance assumption was met. However, the latent
mean difference was significant and indicated that mobile device applicant users were .402
standard deviations lower than their non-mobile counterparts. This finding suggests that the
mobile device group performed significantly worse than the non-mobile device group.
Summary. The preliminary exploratory and confirmatory factor analyses reduced the
item sets for each of the original assessments to more interpretable, unidimensional item sets that
fit the data reasonably well. The descriptive statistics and distributional properties were reviewed
for potential differences and appeared comparable based on a visual inspection. The hypotheses
were tested using nested, hierarchical ME/I models for ordered-categorical data (Muthén &
Muthén, 2010; Millsap & Yun-Tein, 2004). With the exception of hypothesis 3, the ME/I model

48
results supported the hypotheses. The hierarchically nested models displayed good alternative fit
indices and did not demonstrate significant reductions in fit across nested models. Latent mean
differences for the cognitive, biodata, and multimedia assessments were either non-significant or
negligible. However, the absolute value of the latent mean difference between mobile and non-
mobile applicants who completed the SJT was both noticeable and statistically significant.
Overall, the cognitive ability, biodata, and work simulations examined in this study appear to be
equivalent whether delivered on mobile or non-mobile devices.
49
CHAPTER 5
DISCUSSION
A necessary prerequisite for adapting selection assessments to new media is to establish
that the construct, knowledge, skill, ability, or competency being measured is not altered by the
medium. The purpose of this study was to determine if this prerequisite was met when a
selection assessment is delivered on mobile technology. To represent the selection tools being
utilized in common assessment batteries, a cognitive ability-type assessment, two biodata
assessments, a multimedia work simulation, and a situational judgment test were examined for
their measurement equivalence across an applicant group that used a mobile device medium
(Smartphone; e.g., iPhone™, Android™ phone) and a non-mobile device medium (PC). The
overall results from the measurement invariance tests confirmed that each assessment appeared
to be invariant across the restricted model tests. For all assessments, the more restricted models
exhibited decrements in model fit, but a review of the alternative fit indices and change in
comparative fit index revealed these differences were not practically meaningful. In other words,
complete factorial invariance was supported for each assessment type. In the proceeding section,
these overall results are evaluated in terms of the hypotheses for the individual assessments,
along with the major contributions of the current study to the selection assessment literature.
Major Contributions
The tests of measurement invariance at the configural, scalar, and residual variance levels
supported the hypotheses that the cognitive ability assessment, two biodata assessments, and SJT
would be equivalent across devices. These results, when taken together with the lack of support
50
for the multimedia work simulation hypothesis of non-equivalence, make three important
contributions to the literature: 1) the current study is the first to examine three previously
untested personnel selection assessments, 2) the current study replicates and expands initial
results on mobile device equivalence, and 3) the results from the available sample and the chosen
statistical analysis are strong indications of true medium comparability.
First, the examination and support of hypotheses one, three, and four represent the first
known research attempt to examine the equivalence of a cognitive ability assessment,
multimedia assessment, and SJT delivered on a mobile device in a selection context. In
particular, the support of complete factorial invariance across devices for the cognitive ability
Learning assessment implies that the factor structure and parameter values were consistent across
both medium deliveries. In other words, the differences in device functionality were not altering
the type of ability being measured, changing the applicants’ conceptualization of the measured
ability, or creating meaningful performance differences. This is an important expansion from
previous studies that have either not compared mobile devices to non-mobile devices for
cognitive ability assessments (e.g., Chuah et al., 2006; Whiting & Kline, 2006; Schroeders &
Wilhelm, 2011) or have not examined the ME/I for handheld, mobile devices in a selection
context (e.g., Schroeders & Wilhelm, 2010).
Although the hypothesis regarding the multimedia work simulation for the Neatness
competency was not supported, the finding that this type of assessment was equivalent across
device types in a selection context is also an important contribution to the online selection
assessment literature. Higher fidelity assessments that use images or video to better approximate
the job environment are being utilized in greater numbers (Burke, Mahoney-Phillips, Bowler, &
Downey, 2011), and previous studies examining these types of assessments have not considered
51
their delivery via mobile devices in particular. A reasonable expectation was that the smaller
screen size would interact with this type of assessment to introduce construct-irrelevant variance
to the construct measurement (Leeson, 2006). However, the nested invariance model results in
the current study imply that the technical burdens (e.g., content display requirements, user
manipulation) placed on the devices by the static images used in the assessment were not enough
to generate a detectable lack of invariance (Reynolds, 2011). Possibly, this result is an indication
that the screen resolutions and functionality of mobile devices are following the same
developmental pattern standard computer monitors followed 30 years ago. Over time, computer
monitor technology gradually approximated the resolution and functionality of paper-and-pencil
versions, thereby lessening their originally discovered lack of invariance (Noyes & Garland,
2008; Waters & Pommerich, 2007). In a similar fashion, the screen size and resolutions of
mobile devices may have already approximated the same readability and functionality as
standard computer monitors. Thus, the finding from the current study is a major contribution in
that it examines the mobile delivery of a previously untested, yet popular, assessment tool and
demonstrates that the available technology can consistently deliver static images used in similar
contexts.
The current study is also the first known examination of a SJT delivered on mobile
devices. Despite the unique challenges inherent to SJTs (e.g., difficulty in establishing construct
validity; little evidence on stability of scores; complexity of item stems and options; Schmitt &
Chan, 2006), the findings supported the hypothesis that the text-based SJT would be equivalent
across mobile and non-mobile device groups. This finding stands in contrast to other equivalence
studies that have discovered criterion-related validity, applicant reaction, and performance
differences across different media for various SJT adaptations (e.g., Mackenzie et al., 2010;
52
Lievens & Sackett, 2006). Yet, the current study focused on the interrelationships among a
homogenous item set that was reasonably detectable across groups and shared the same item
format type (i.e., text-based). Put another way, previous SJT studies have either not examined the
construct validity across groups via measurement model tests, or have examined the
measurement equivalence of SJTs that have differing item format across groups (i.e., video-
based items versus text-based items). Therefore, the results from the current study are uniquely
positioned to answer the question about SJT equivalence when the item format is maintained;
this will be especially salient as more technologically sophisticated mediums evolve. A
surprising finding was that the nested model tests suggested equivalence, but the substantive
latent mean test revealed that the mobile device users scored almost half a standard deviation
lower than their non-mobile counterparts. The root cause of this difference is difficult to pinpoint
in a non-experimental study, but it could be that reading the longer and more complicated items
stems and responses on a smaller screen requires the user to scroll to a greater degree. This could
potentially place a higher cognitive load on the applicant, which in turn could drive potential
group performance differences across devices (Leeson, 2006). Regardless of the cause, this
exploratory finding may be important for future efforts to establish the appropriateness of
delivering newer SJT iterations on mobile devices.
The second major contribution of the current study is that previous results from an initial
mobile-device equivalency study were replicated and expanded for the non-cognitive constructs
(Morelli et al., 2012). Hypothesis two expected that the non-cognitive assessments (i.e., biodata
assessments of Conscientiousness and Customer Service) would be equivalent across device
groups. Indeed, the adequate alternative fit indices across the constrained ME/I models
demonstrated that these assessments were invariant for Smartphones and PCs. This finding was
53
expected and reasonable as the current study shares a number of similarities with the Morelli et
al. (2012) study for how ME/I was tested. Specifically, both studies utilized a large sample of
actual job applicants, both studies examined the Conscientiousness and Customer Service
competencies measured with biodata items, and both studies used assessments that were text-
based, non-speeded, and delivered on similar online platforms. However, an important
distinction and expansion from the Morelli et al. study was that the current study examined new
assessment items in an untested job family and applicant pool. Specifically, manual labor-type
jobs in a hospitality organization were examined versus the sales jobs in a retail organization
examined in Morelli et al. This is important as triangulating equivalence results from various
assessments, organizations, and job families helps generalize the current study’s results and give
consumers of this information more confidence that text-based assessments of non-cognitive
performance predictors are appropriate for mobile device delivery in an unproctored, online
setting.
The methodological strengths of the current study make up the third major contribution to
the selection and assessment literature. These included using a large sample of job applicants
completing assessments in a high-stakes testing scenario, an examination of content and
criterion-valid assessments, and the use of MGCFA to establish ME/I at the latent construct
level. A limitation of previous studies that have examined mobile or handheld computer device
equivalence is that their samples have consisted of students in a classroom setting (e.g.,
Churchill, 2011; Muhanna, 2011; Schroeders & Wilhelm, 2010). Although a high-stakes testing
scenario can be simulated using students, the findings from these studies may not be completely
generalizable to the job applicant population. The current study, however, had population-level
data representative of job applicants completing assessments in a high-stakes selection test, albeit

54
online and unproctored. In a similar vein, the assessments were designed, validated, and
implemented for organizational use in predicting job performance for individual job families.
This context and the available sample are important in that the findings are more informative for
researchers or practitioners who want to know how assessments similarly designed and
implemented will perform when delivered on a mobile device. Thus, these findings are
particularly generalizable to a selection setting where an assessment battery is designed for
organizational use.
The use of MGCFA to examine group differences at the measurement versus the
structural level is another methodological strength of the current study worth noting. As has been
heavily discussed and stressed in the literature, establishing invariance at the measurement level
is a crucial, yet often ignored, prerequisite to examining the observed differences between groups
or the interrelationships between variables (e.g., Horn & McArdle, 1992). At best, failing to
establish this type of invariance may lead a researcher to discover and report mean and
dispersion level differences between groups when there are no actual group differences at the
latent mean level. At worst, a researcher may make and report untenable findings about group
differences when the variables of interest are not equivalent at the configural model level (i.e.,
the same construct is not being measured in each group). The strategies used in the current study,
such as fitting the three levels of measurement invariance models to the data and using an
estimator appropriate for ordinal data (Muthén & Muthén, 2010), are strong indications of
measurement invariance for each of these assessments across device types. This analytical
strategy is a major difference from the Doverspike et al. (2012) study, which found that there
were differences between mobile and non-mobile device users when the observed means and
dispersion values for a speeded cognitive ability assessment were compared. This seemingly
55
contradictory finding could be explained by the speededness of the test used in the Doverspike et
al. study as the observed means in the current study were identical. However, the current results
demonstrate the importance of examining the variance-covariance structure. Had Doverspike et
al. examined the measurement models for equivalence, the results may have indicated that the
relative standing of individuals on a given assessment is not affected by the delivery medium at
the latent level, even if observed mean differences suggest otherwise (Schroeders & Wilhelm,
2011).
Practical Implications
Technology-enabled selection assessments, like those delivered on mobile devices, must
meet the same qualifications of any high-quality assessment. As Scott and Mead (2011) outline,
a high-quality assessment must “provide a precise and consistent measure of the characteristics it
is intended to measure…” (p. 23). Accordingly, the most salient practical implication of the
current study is that the results add to the growing body of knowledge that assessments delivered
on mobile devices remain consistent and precise. This finding by itself has important
implications for practitioners and organizations that have already implicitly or explicitly
encouraged the use of mobile devices in completing online selection assessments.
A growing body of equivalency evidence for these devices may be useful for
practitioners who offer automated, online solutions to clients who need to screen large numbers
of applicants in a cost effective way. Although it is preferable to test for measurement
equivalence for each assessment and sample (Meade et al., 2007), these results give practitioners
some foundation on which observed-level group comparisons can be more confidently made. For
instance, practitioners use observed item and scale means to validate the inferences taken from
the assessment, develop norms and cutoff scores, and make general talent management
recommendations (Sackett, 2010). Practitioners must also assess the observed item means of
56
demographic sub-groups to detect potential disparate or adverse impact in an effort to promote
fairness in selection decisions and ensure their assessments are legally defensible (American
Educational Research Association et al., 1999; Equal Employment Opportunity Commission,
Civil Service Commission, Department of Labor, & Department of Justice, 1978; Society for
Industrial & Organizational Psychology, 2003). Along these lines, it is noteworthy that the
findings from the current study are consistent with the previous invariance study on the
equivalence of non-cognitive predictors (Morelli et al., 2012), which have less adverse impact on
protected groups (Hough, Oswald, & Ployhart, 2001). Overall, practitioners who are equipped
with the information that a wide variety of selection assessments (e.g., cognitive ability,
multimedia assessments, biodata assessments, SJTs) have been tested for measurement
equivalence on mobile devices may have more confidence in leveraging these important
observed level statistics under varying selection scenarios.
Equivalent technology-enabled assessments can also have important implications for
organizations. Online assessments have large returns on investment for organizations in that they
can screen, assess, and aggregate large amounts of applicant data in a fair and consistent manner
(Reynolds, 2011). The economy of scale enabled by online assessments, and the ability to access
these assessments via devices that are familiar and readily available to potential applicants, help
save an organization valuable resources and be an efficient method for selecting the best
candidates--both important strategic and competitive organizational advantages. If organizations
understand that the selection assessments that are currently being accessed via mobile devices
are psychometrically equivalent, they can embrace and leverage this technology, which may
serve a dual purpose.
57
First, allowing or encouraging applicants to use mobile devices to access and complete
online applicant screening tools can help an organization keep pace with new human resources
(HR) initiatives and job applicant demands. Specifically, a growing majority of HR practitioners
and leaders are calling for computerized talent management processes (e.g., recruiting, selection,
and promotion) to be “mobile friendly” (Auerbach, 2013). For example, HR consulting
companies such as Kronos are already capitalizing on this growing trend by developing a self-
serve talent management computer application built for tablet computers called the Kronos
Workforce Tablet (Priddle, 2013). Building and implementing mobile friendly talent
management processes may be especially important for selecting future job candidates over the
coming years as a recent Pew Research survey reported that one in four teens are “cell-mostly”
in their Internet access (Madden, Lenhart, Duggan, Cortesi, & Gasser, 2013). Thus, empirical
research, such as the current study, which can guide and inform mobile friendly talent
management initiatives, will have important implications for the organizations who decide to
implement them.
Second, the evidence in this study concerning mobile device equivalence may also be
helpful for organizations looking to increase their multinational or diversity and inclusion
recruiting or selection efforts. Mobile devices have a unique advantage in that they are generally
more available and affordable to a larger percentage of the global population than are standard
desktop or laptop computers. In many cases, certain demographic or regionally-based groups
may only have access to online applicant screening tools via a mobile device (Morgan Stanley,
2009). To highlight this trend, a Cisco (2012) industry report found that during 2011 global
mobile traffic increased 230 percent, which equated to a doubling for a fourth consecutive year.
Of course, new equivalence studies must be conducted using global job applicant samples before
58
mobile devices can be recommended in this way (Adler, 2011), but the results from this study
provide a useful starting point for this continuing effort.
Limitations and Future Research
There were several limitations with this study that warrant further research. First,
although using applied organizational data provided a large available job applicant sample and a
variety of selection assessments that were extremely powerful, generalizable, and valid for the
jobs at hand, there were certain limitations to using archival data. Namely, using applied,
archival data restricted the quantity and quality of the variables available. As noted in the
description of the assessments, the testing experts used the most cost-efficient and utilitarian
methods available to develop items that most appropriately met the client’s needs; therefore,
most items were developed with less concern for their latent factor structure or empirical scoring.
As a result, the analyses had to accommodate scales that had a less than desirable number of
items available, which also likely attenuated the ordinal internal consistency for each assessment
(Cortina, 1993). Additional research is recommended on mobile deliveries of empirically
developed scales that have a more robust item pool and a more established psychometric history
in the literature.
Similarly, using applied, archival data restricted the study design to be quasi-
experimental. Because applicant responses and device type was recorded automatically by the
online testing system, participants were not randomly assigned to conditions. This design aspect,
coupled with the lack of demographic data for either sample, made it impossible to empirically
test if potential invariance could be driven or explained by sample composition or sub-group
differences (this concern is lessened in light of findings from previous research which found no
sub-group differences between mobile and non-mobile devices; Morelli et al., 2012).
59
Incidentally, the results suggested assessments were equivalent across devices and did not
necessitate identifying sources of non-invariance. However, future research that utilizes a truly
experimental design with controlled conditions (e.g., random assignment, controlling for choice
of device) may help ascertain under what circumstances mobile device usage could demonstrate
a lack of invariance. To illustrate, a previous study that controlled for medium choice (i.e., paper-
and-pencil versus computer) found that forcing respondents to complete a measure or scale on a
medium they would not choose may lead to a lack of invariance (Meade et al., 2007). Similarly,
if future studies were to employ a multiple measurements design, where respondents completed
an assessment on both or all mediums, after which correlations and reliabilities are compared, a
stronger case for mobile device equivalence could be made (Scott & Mead, 2011).
Lastly, the generalizability of the results is limited to the assessment types and job
families that were available. Future research should replicate the novel findings of the current
study; in particular, the cognitive-ability assessment, multimedia work simulation, and SJT
results. More research is needed to determine if other cognitive ability tests, such as those that
use mathematical reasoning, longer or more difficult items, or a speeded format, respond
similarly as the relatively simple Learning assessment used in the current study. Also, higher
fidelity and more technologically complex work simulations and SJTs are already being
implemented (Adler, 2011; Olson-Buchanan & Drasgow, 2006). Thus, further research possibly
using differential item functioning or item response theory methods are needed to corroborate
these initial findings with the newest selection assessment iterations.
Additional Areas for Future Research and Conclusion
This study represents an important effort to stay ahead of or at least catch up with the
technological curve in technology-enhanced selection and talent management. However, even as

60
this project is completed, technological evolutions in user experiences and data management
capability have already created new opportunities for future research to address untested
psychometric issues related to online selection assessments. As such, the following additional
areas for future research are offered in an attempt to keep pace with this technological change.
First, new research is encouraged to answer the next wave of invariance questions that
arise as selection and assessment-related technology becomes more interactive and sophisticated
(i.e., mobile friendly). The current trend is to develop online selection assessment batteries and
platforms that are accessible by the most commonly available hardware and software, but the
next generation of technology-enhanced selection systems could be built specifically for mobile
platforms (Reynolds & Rupp, 2010). Thus, future research should blend current efforts to
explore mobile-device related research questions, such as computer adaptive testing specifically
designed for use on mobile phones (Triantafillou et al., 2008), with other empirical attempts to
address issues surrounding selection and pre-employment tests specifically.
As noted previously, the newest generation of realistic job previews are being delivered
online via unproctored, Internet-based assessment centers (Olson-Buchanan & Drasgow, 2006).
Additional research is also needed in this area to determine if screen sizes, resolutions, and
native software on mobile devices are equivalent to those on non-mobile devices for these more
technologically complex selection tools. In a similar way, the latest technology-enhanced HR
trends are arguing for the greater use of “gamification” and “crowd-sourcing” for talent
management tools (Handler, 2011; Hauenstein, 2012). Therefore, future research on mobile
device equivalence should also attempt to preemptively address these cutting edge trends.
Perhaps the most pressing question for future research to answer is the following: What
device-driven group performance differences occur when international applicants use mobile
61
devices in a selection setting? Some research already suggests that there are culturally-based
distinctions as to how individuals use mobile devices. Specifically, this research proposes that
culture partially determines whether individuals use a mobile device primarily as a
communication tool, as a handheld gaming device, or as a desktop or laptop computer
replacement (Baron & Segerstad, 2010). If national culture does in fact influence mobile device
usage, an applicant’s culture could potentially be interacting with the type of device chosen to
insert construct-irrelevant variance into the measurement of a selection predictor. Consequently,
additional research is needed to help expand the findings from domestic samples to include
cross-cultural samples made up of international applicants. Expanding the research questions
beyond the scope of the current study will be important over the coming years as organizations
develop their selection tools for a greater global audience.
In sum, many researchers who understand the issues surrounding technology-enhanced
assessment have alluded to the increased utility of mobile devices for candidate selection (Adler,
2011; Mead, Buchanan, & Drasgow, 2011; Reynolds & Rupp, 2010). In fact, the current study
began with Reynolds and Rupp’s astute observation that “…the demand for the delivery of
assessments on mobile platforms may become the most significant opportunity and challenge to
assessment over the next decade” (p. 612). Indeed, the usage data support Reynolds and Rupp’s
prediction made only three years ago—job applicants are in fact completing selection tools over
the Internet using mobile devices in steadily increasing numbers. Therefore, this study stands as
one of the first attempts to address this important and widespread trend. Establishing the
equivalence of common selection assessments adds to the growing knowledge base on the
appropriateness of this new technology and is intended to act as a guidepost for the technological
iterations to come.

62
REFERENCES
Adler, S. (2011). Concluding comments: Open questions. In N. Tippins & S. Adler (Eds.),
Technology-enhanced assessment of talent (pp. 418-436). San Francisco, CA: John Wiley
& Sons, Inc.
American Educational Research Association, American Psychological Association, & National
Council on Measurement in Education. (1999). Standards for educational and
psychological testing. Washington, DC: Authors.
American Psychological Association. (1986). Guidelines for computer-based tests and
interpretations. Washington, DC: Author.
American Psychological Association. (2010). Ethical principles of psychologists and code of
conduct. Washington, DC: Author.
Anastasi, A., & Urbina, S. (1997). Psychological testing (7th
ed.). Upper Saddle Rivery, NJ:
Prentice Hall.
Anderson, J. C., & Gerbing, D. W. (1988). Structural equation modeling in practice: A review
and recommended two-step approach. Psychological Bulletin, 103(3), 411-423.
Arthur, W., Glaze, R. M., Villado, A. J., & Taylor, J. E. (2010). The magnitude and extent of
cheating and response distortion effects on unproctored internet-based tests of cognitive
ability and personality. International Journal of Selection and Assessment, 18(1), 1-16.
Arthur, W., & Villado, A. J. (2008). The importance of distinguishing between constructs and
methods when comparing predictors in personnel selection research and practice. Journal
of Applied Psychology, 93(2), 435-442.

63
Auerbach, D. (2013, January). How to get a job by using your smartphone. CareerBuilder.com.
Retrieved from http://msn.careerbuilder.com/Article/MSN-3289-Job-Search-How-to-get-
a-job-by-using-your-smartphone/?SiteId=cbmsn43289&sc_extcmp=JS_3289_advice
Bandalos, D. L., & Boehm-Kaufman, M. R. (2009). Four common misconceptions in exploratory
factor analysis. In C. E. Lance & R. J. Vandenberg (Eds.), Statistical and methodological
myths and urban legends: Received doctrine, verity, and fable in the organizational and
social sciences (pp. 61-88). New York, NY: Routledge.
Baron, N. S., & Segerstad, Y. H. (2010). Cross-cultural patterns in mobile-phone use: Public
space and reachability in Sweden, the USA, and Japan. New Media & Society, 12(1), 13-
34. doi: 10.1177/1461444809355111
Beauducel, A., & Herzberg, P. Y. (2006). On the performance of maximum likelihood versus
means and variance adjusted weighted least squares estimation in CFA. Structural
Equation Modeling, 13(2), 186-203.
Brannick, M. T. (1995). Critical comments on applying covariance structure modeling. Journal
of Organizational Behavior, 16, 201–213.
Breaugh, J. A. (2009). The use of biodata for employee selection: Past research and future
directions. Human Resource Management Review, 19, 219-231. doi:
10.1016/j.hrmr.2009.02.003
Burke, E., Mahoney-Phillips, J., Bowler, W., & Downey, K. (2011). Going online with
assessment: Putting the science of assessment to the test of client need and 21st century
technologies. In N. Tippins & S. Adler (Eds.), Technology-enhanced assessment of talent
(pp. 355-379). San Francisco, CA: John Wiley & Sons, Inc.
64
Cisco Public (2012, February 14). Cisco visual networking index: Global mobile data traffic
forecast update 2011-2016 [White paper]. Retrieved from
http://www.Cisco.com/en/US/solutions/collateral/ns341/ns525/ns537/ns705/ns827/white
_pap er_c11-520862.html
Chan, D., & Schmitt, N. (1997). Video-based versus paper-and-pencil method of assessment in
situational judgment tests: Subgroup differences in test performance and face validity
perceptions. Journal of Applied Psychology, 82(1), 143-159.
Chan, D., Schmitt, N., DeShon, R. P., Clause, C. S., & Delbridge, K. (1997). Reactions to
cognitive ability tests: The relationships between race, test performance, face validity
perceptions, and test-taking motivations. Journal of Applied Psychology, 82(2), 300-310.
Christian, M. S., Edwards, B. D., & Bradley, J. C. (2010). Situational judgment tests: Constructs
assessed and a meta-analysis of their criterion-related validities. Personnel Psychology,
63, 85-117.
Chuah, S. C., Drasgow, F., & Roberts, B. W. (2006). Personality assessment: Does the medium
matter? No. Journal of Research in Personality, 40, 359-376.
Churchill, D. (2011). Conceptual model learning objects and design recommendations for small
screens. Technology & Society, 14(1), 203-216.
Clevenger, J., Pereira, G. M., Harvey, V. S., Wiechmann, D., & Schmitt, N. (2001). Incremental
validity of situational judgment tests. Journal of Applied Psychology, 86(3), 410-417.
doi: 1Q.1037//0021-90I0.86.3.4IO
Clough, G., Jones, A. C., McAndrew, P., & Scanlon, E. (2007). Informal learning with PDAs
and smartphones. Journal of Computer Assisted Learning, 24, 359-371.
65
Cochrane, T. D. (2010). Exploring mobile learning success factors. ALT-J, Research in Learning
Technology, 18(2), 133-148.
Cole, M. S., Bedeian, A. G., & Feild, H. S. (2006). The measurement equivalence of web-based
and paper-and-pencil measures of transformational leadership: A multinational test.
Organizational Research Methods, 9, 339-368.
Cortina, J. M. (1993). What is coefficient alpha? An examination of theory and applications.
Journal of Applied Psychology, 78(1), 98-104.
Coyne, I., Warszta, T., Beadle, S., & Sheehan, N. (2005). The impact of mode of administration
on the equivalence of a test battery: A quasi-experimental design. International Journal
of Selection and Assessment, 13(3), 220-224.
Crook, J. (2011, December). Samsung ships 1 million Galaxy Note phablets. [Web log post].
Retrieved from http://techcrunch.com/2011/12/29/samsung-ships-1-million-galaxy-note-
phablets/
Deshon, R. P. (2004). Measures are not invariant across groups with error variance homogeneity.
Psychology Science, 46, 137-149.
Doverspike, D., Arthur, Jr., W., Taylor, J., & Carr, A. (2012, April). Mobile mania: The impact
of device type on remotely delivered assessments. In J. Scott (chair), Chasing the
tortoise: Zeno’s paradox in technology-based assessment. Symposium conducted at the
27th annual conference of The Society for Industrial and Organizational Psychology, San
Diego, CA.
Echeverria, A., Nussbaum, M., Calderon, J. F., Bravo, C., Infante, C., & Vasquez, A. (2011).
Face-to-face collaborative learning supported by mobile phones. Interactive Learning
Environments, 19(4), 351-363.
66
ePredix, Inc. (2001). Test of learning ability (forms S01 and T01) technical manual.
Minneapolis, MN: Author.
Fallaw, S. S., Kantrowitz, T. M., & Dawson, C. R. (2012). 2012 Global assessment trends report
[White paper]. Retrieved from http://www.Shl.com/assets/GATR_2012 _US.pdf
Flora, D. B., & Curran, P. J. (2004). An empirical evaluation of alternative methods of
estimation for confirmatory factor analysis with ordinal data. Psychological Methods,
9(4), 466-491. doi: 10.1037/1082-989X.9.4.466
Frauenheim, E. (2011, May 1). More companies go with online tests to fill in the blanks.
Workforce Management, Retrieved from http://www.highbeam.com/doc/1G1-
255515760.html
French, B. F., & Finch, W. H. (2006). Confirmatory factor analytic procedures for the
determination of measurement invariance. Structural Equation Modeling: A
Multidisciplinary Journal, 13(3), 378-402.
Gadermann, A. M., Guhn, M., & Zumbo, B. D. (2012). Estimating ordinal reliability for Likert-
type and ordinal item response data: A conceptual, empirical, and practical guide.
Practical Assessment, Research & Evaluation, 17(3), 1-13.
Greaud, V. A., & Green, B. F. (1986). Equivalence of conventional and computer presentation of
speed tests. Applied Psychological Measurement, 10(1), 23-24. doi:
10.1177/014662168601000102
Handler, C. (2011, July 20). “Everything in the future online is going to look like a multiplayer
game”-Eric Schmidt (CEO, Google) [Web log post]. Retrieved from http://rocket-
hire.com/blog
Hao, Y. (2010). Does multimedia help students answer test items? Computers in Human
67
Behavior, 26, 1149-1157. doi:10.1016/j.chb.2010.03.021
Hauenstein, P. ( 2012, October 26). Frustrated with 360 degree surveys? This may be a better
alternative [Web log post]. Retrieved from http://www.tlnt.com/2012/10/26/frustrated-
with-360-degree-surveys-this-may-be-a-better-alternative/#more-66484.
Hense, R., & Janovics, J. (2011). Case study of technology-enhanced assessment centers. In N.
Tippins & S. Adler (Eds.), Technology-enhanced assessment of talent (pp. 324-337). San
Francisco, CA: John Wiley & Sons, Inc.
Horn, J. L., & McArdle, J. J. (1992). A practical and theoretical guide to measurement invariance
in aging research. Experimental Aging Research, 105(44), 117-44.
Hough, L. M., Oswald, F. L., & Ployhart, R. E. (2001). Determinants, detection and amelioration
of adverse impact in personnel selection procedures: Issues, evidence and lessons
learned. International Journal of Selection and Assessment, 9(1/2), 152-194.
Hu, L., & Bentler, P. M. (1999). Cutoff criteria for fit indexes in covariance structure analysis:
Conventional criteria versus new alternatives. Structural Equation Modeling, 6(1), 1-55.
Huff, K. C. (2006). The effects of mode of administration on timed cognitive ability tests
(Unpublished doctoral dissertation). North Carolina State University, Raleigh, NC.
International Test Commission. (2005). International guidelines on computer-based and internet
delivered testing. Granada, Spain: Author.
Jackson, D. L., Purc-Stephenson, R., Gillaspy, Jr., J. A. (2009). Reporting practices in
confirmatory factor analysis: An overview and some recommendations. Psychological
Methods, 14(1), 6-23. doi: 10.1037/a0014694
Joinson, A. (1999). Social desirability, anonymity, and Internet-based questionnaires. Behavior
Research Methods, Instruments, and Computers, 31, 433–438.

68
Keskin, N. O., & Metcalf, D. (2011). The current perspectives, theories, and practices of mobile
learning. The Turkish Online Journal of Educational Technology, 10(2), 202-208.
Kim, J., & Mueller, C. W. (1978). Factor analysis: Statistical methods and practical issues
(Sage University Paper series on Quantitative Applications in the Social Sciences, No.
07-014). Beverly Hills, CA: Sage.
Kline, R. B. (2010). Principles and practice of structural equation modeling (3rd
Ed.). New
York: Guilford Publications.
Lai, A. F., Chen, D. J., & Chen, S. L. (2008). Item attributes analysis of computerized test based
on IRT: A comparison study on static text/graphic presentation and interactive
multimedia presentation. Journal of Educational Multimedia and Hypermedia, 17(4),
531–559.
Lance, C. E., Butts, M. M., & Michels, L. C. (2006). The sources of four commonly reported
cutoff criteria: What did they really say? Organizational Research Methods, 9, 202-220.
Lance, C. E., & Vandenberg, R. J. (2001). Confirmatory factor analysis. In F. Drasgow & N.
Schmitt (Eds.), Measuring and analyzing behavior in organizations: Advances in
measurement and data analysis (pp. 221-256). San Francisco: Jossey-Bass.
Leeson, H. V. (2006). The mode effect: A literature review of human and technological issues in
computerized testing. International Journal of Testing, 6(1), 1-24.
Lievens, F., & Sackett, P. R. (2006). Video-based versus written situational judgment tests: A
comparison in terms of predictive validity. Journal of Applied Psychology, 91(5), 1181-
1188. doi: 10.1037/0021-9010.91.5.1181
69
Lubke, G. H., & Muthén, B. O. (2004). Applying multigroup confirmatory factor models for
continuous outcomes to Likert scale data complicates meaningful group comparisons.
Structural Equation Modeling, 11, 514-534.
MacKenzie, Jr., W. I., Ployhart, R., Weekley, J. A., & Ehlers, C. (2010). Contextual effects on
SJT responses: An examination of construct validity and mean differences across
applicant and incumbent contexts. Human Performance, 23, 1-21. doi:
10.1080/08959280903400143
Madden, M., Lenhart, A., Duggan, M., Cortesi, S., & Gasser, U. (2013, March 13). Teens and
technology 2013. Retrieved from http://www.pewinternet.org/Reports/2013/Teens-and-
Tech.aspx
Masri, A. A. (2012). Using mobile phone for assessing university students in English literature
in Jordan. Paper presented at the Orlando International Academic Conference, Orlando,
FL.
McDaniel, M. A., Hartman, N. S., Whetzel, D. L., & Grubb, III, W. L. (2007). Situational
judgment tests, response instructions, and validity: A meta-analysis. Personnel
Psychology, 60, 63-91.
McNelly, T., Ruggeberg, B. J., & Hall, Jr., C. R. (2011). Web-based management simulations:
Technology-enhanced assessment for executive-level selection and development. In. N.
Tippins & S. Adler (Eds.), Technology-enhanced assessment of talent (pp. 253-266). San
Francisco, CA: Jossey-Bass.
Mead, A. D., & Blitz, D. L. (2003). Comparability of paper and computerized non-cognitive
measures: A review and integration. Paper presented at the 18th
annual conference of The
Society for Industrial Psychology, Orlando, FL.
70
Mead, A. D., & Drasgow, F. (1993). Equivalence of computerized and paper-and-pencil
cognitive ability tests: A meta-analysis. Psychological Bulletin, 114(3), 449-458.
Mead, A. D., Olson-Buchanan, J. B., & Drasgow, F. (2011). Technology-based selection.
Unpublished manuscript.
Meade, A. W., Johnson, E. C., & Braddy, P. W. (2008). Power and sensitivity of alternative fit
indices in tests of measurement invariance. Journal of Applied Psychology, 93(3), 568-
592.
Meade, A. W., & Lautenschlager, G. J. (2004). A comparison of item response theory and
confirmatory factor analytic methodologies for establishing measurement
equivalence/invariance. Organizational Research Methods, 7, 361-388. doi:
10.1177/1094428104268027
Meade, A. W., Michels, L. C., & Lautenschlager, G. J. (2007). Are internet and paper- and-
pencil personality tests truly comparable? An experimental design measurement
invariance study. Organizational Research Methods, 10(2), 322-345.
Millsap, R. E., & Yun-Tein, J. (2004). Assessing factorial invariance in ordered categorical
measures. Multivariate Behavioral Research, 39(3), 479-515.
Morgan Stanley & Company, Inc. (2009). The mobile internet report setup [PowerPoint slides].
Retrieved from http://www.Morganstanley.com/institutional/techresearch.
Morelli, N. A., Illingworth, A. J., Scott, J. C., & Lance, C. E. (2012, April). Are internet-based,
unproctored assessments on mobile and non-mobile devices equivalent? In J. Scott
(chair), Chasing the tortoise: Zeno’s paradox in technology-based assessment.
Symposium presented at the 27th annual conference of The Society for Industrial and
Organizational Psychology, San Diego, CA.
71
Motowidlo, S., Dunnette, M. D., & Carter, G. W. (1990). An alternative selection procedure: The
low-fidelity simulation. Journal of Applied Psychology, 75, 640–647.
Mount, M. K., Witt, L. A., & Barrick, M. R. (2000). Incremental validity of empirically keyed
biodata scales over GMA and the five factor personality constructs. Personnel
Psychology, 53, 299–323.
Mueller, K., Liebig, C., & Hattrup, K. (2007). Computerizing organizational attitude surveys.
Educational and Psychological Measurement, 67(4), 658-678. doi:
10.1177/0013164406292084
Muhanna, W. (2011). The impact of using cell phone assessment on Jordanian university
students’ achievement in national education. European Journal of Social Sciences, 20(1),
100-111.
Mumford, M. D., & Owens, W. A. (1987). Methodology review: Principles, procedures, and
findings in the application of background data measures. Applied Psychological
Measurement, 2, 1-31.
Mumford, M. D., & Stokes, G. S. (1992). Developmental determinants of individual action:
Theory and practice in applying background measures. In M. Dunnette & L. Hough
(Eds.), Handbook of Industrial & Organizational Psychology (pp. 61-138). Palo Alto,
CA: Consulting Psychologists Press, Inc.
Murphy, K. R., Cronin, B. E., & Tam, A. P. (2003). Controversy and consensus regarding the
use of cognitive ability testing in organizations. Journal of Applied Psychology, 88(4),
660-671.
Muthén, B. O., & Christoffersson, A. (1981). Simultaneous factor analysis of dichotomous
variables in several groups. Psychometrika, 46, 407–419.
72
Muthén, L. K., & Muthén, B. O. (1998-2010). Mplus user’s guide. Sixth edition. Los Angeles,
CA: Muthén & Muthén.
Naglieri, J. A., Drasgow, F., Schmit, M., Handler, L., Prifitera, A., Margolis, A., & Velasquez,
R. (2004). Psychological testing on the internet: New problems, old issues. American
Psychologist, 59(3), 150-162.
Neisser, U., Boodoo, G., Bouchard Jr., T. J., Boykin, A. W., Brody, N., Ceci, S. J., Halpern, D.
F., Loehlin, J. C., Perloff, R., Sternberg, R. J., & Urbina, S. (1996). Intelligence: Knowns
and unknowns. American Psychologist, 51(2), 77.
Nickels, B. J. (1994). The nature of biodata. In G. Stokes, M. Mumford, & W. Owens (Eds.),
Biodata handbook: Theory, research, and use of biographical information in selection
and performance prediction (pp. 1-16). Palo Alto, CA: Consulting Psychologists Press,
Inc.
Noyes, J. M., & Garland, K. J. (2008). Computer- vs. paper-based tasks: Are they equivalent?
Ergonomics, 51(9), 1352-1375.
Nunnally, J. C., & Bernstein, I. H. (1994). Psychometric theory (3rd
ed.). New York, NY:
McGraw-Hill.
Nye, C. D., Do, B., Drasgow, F., & Fine, S. (2008). Two-step testing in employee selection: Is
score inflation a problem? International Journal of Selection and Assessment, 16(2), 112-
120.
Olson-Buchanan, J. B., & Drasgow, F. (2006). Multimedia situational judgment tests: The
medium creates the message. In J. A. Weekley & R. E. Ployhart (Eds). Situational
judgment tests: Theory, measurement, and application (pp. 253-278). San Francisco, CA:
Jossey-Bass.
73
Otis, A. S. (1920). The selection of mill workers by mental tests. Journal of Applied Psychology,
4(4), 339-341.
Ployhart, R. E. (2006). Staffing in the 21st century: New challenges and strategic opportunities.
Journal of Management, 32, 868-898.
Ployhart, R., Weekley, J. A., Holtz, B. C., & Kemp, C. (2003). Web-based and paper-and-pencil
testing of applicants in a proctored setting: Are personality, biodata, and situational
judgment tests comparable? Personnel Psychology, 56, 733-752.
Ployhart, R. E., & Oswald, F. L. (2004). Applications of mean and covariance structure analysis:
Integrating correlational and experimental approaches. Organizational Research
Methods, 7, 27-65. doi: 10.1177/1094428103259554
Potosky, D., & Bobko, P. (2004). Selection testing via the internet: Practical considerations and
exploratory empirical findings. Personnel Psychology, 57, 1003-1034.
Priddle, K. (2013, March 5). Spotlight on: Kronos workforce management tablet. eWeek
Canada.ca. Retrieved from http://eweek.itincanada.ca/index.php?id=19125&cid=81
Raju, N. S., Byrne, B. M., & Laffitte, L. J. (2002). Measurement equivalence: A comparison of
methods based on confirmatory factor analysis and item response theory. Journal of
Applied Psychology, 87(3), 517-529. doi: 10.1037//0021-9010.87.3.517
Reise, S. P., Widaman, K. F., & Pugh, R. H. (1993). Confirmatory factor analysis and item
response theory: Two approaches for exploring measurement equivalence. Psychological
Bulletin, 114, 552–566.
Reynolds, D. H. (2011). Implementing assessment technologies. In N. Tippins & S. Adler (Eds.),
Technology-enhanced assessment of talent (pp. 66-98). San Francisco, CA: John Wiley &
Sons, Inc.

74
Reynolds, D. H. & Rupp, D. E. (2010). Advances in technology-facilitated assessment. In J. C.
Scott & D. H. Reynolds (Eds.), Handbook of workplace assessment: Evidence-based
practices for selecting and developing organizational talent (pp. 609-641). San
Francisco, CA: Jossey-Bass.
Richman, W. L., Kiesler, S., Weisband, S., & Drasgow, F. (1999). A meta-analytic study of
social desirability distortion in computer administered questionnaires, traditional
questionnaires, and interviews. Journal of Applied Psychology, 84(5), 754-775.
Richman-Hirsch, W. L., Drasgow, F., & Olson-Buchanan, J. B. (2000). Examining the impact of
administration medium on examinee perceptions and attitudes. Journal of Applied
Psychology, 85(6), 880-887. doi: 10.1037/AJ021-9010.85.6.880
Roth, P., Bobko, P., McFarland, L., & Buster, M. (2008). Work sample tests in personnel
selection: A meta-analysis of black-white differences in overall and exercise scores.
Personnel Psychology, 61, 637–661.
Sacher, J., & Fletcher, J. D. (1978). Administering paper-and-pencil tests by computer, or the
medium is not always the message. In D. J. Weiss (Ed.), Proceedings of the 1977
computer adaptive testing conference (pp. 403-419). Minneapolis: University of
Minnesota, Department of Psychology, Psychometrics Methods Program.
Sackett, P. (2010). Final thoughts on the selection and assessment field. In J. C. Scott & D. H.
Reynolds (Eds.), Handbook of workplace assessment: Evidence-based practices for
selecting and developing organizational talent (pp. 757-778). San Francisco, CA: Jossey-
Bass.
75
Schmidt, F. L., & Hunter, J. E. (1998). The validity and utility of selection methods in personnel
psychology: Practical and theoretical implications of 85 years of research. Psychological
Bulletin, 124(2), 262-274.
Schmitt, N., & Chan, D. (2006). Situational judgment tests: Method or construct? In J. A.
Weekley & R. E. Ployhart (Eds.), Situational Judgment Tests: Theory, Measurement, and
Application (pp. 135-156). Malwah, NJ: Lawrence Erlbaum Associates.
Schroeders, U., & Wilhelm, O. (2010). Testing reasoning ability with handheld computers,
notebooks, and paper and pencil. European Journal of Psychological Assessment, 26(4),
284-292.
Schroeders, U., & Wilhelm, O. (2011). Equivalence of reading and listening comprehension
across test media. Educational and Psychological Measurement, 71, 849-869. doi:
10.1177/0013164410391468
Scott, J. C., & Mead, A. D. (2011). Foundations for measurement. In N. Tippins & S. Adler
(Eds.), Technology-enhanced assessment of talent (pp. 21-65). San Francisco, CA: John
Wiley & Sons, Inc.
Segall, N., Doolen, T. L., & Porter, J. D. (2005). A usability comparison of PDA-based quizzes
and paper-and-pencil quizzes. Computers & Education, 45, 417-432.
SIS International Research. (2012). SIS white paper: Trends in talent management. New York,
NY: Author.
Steenkamp, J. E. M., & Baumgartner, H. (1998). Assessing measurement in cross-national
consumer research. Journal of Consumer Research, 25, 78-90.
76
Stokes, G. S., & Cooper, L. A. (2004). Biodata. In J. C. Thomas (Ed.), Comprehensive handbook
of psychological assessment (Vol. 4, pp. 243-268). Hoboken, NJ: John Wiley & Sons,
Inc.
Society for Industrial & Organizational Psychology. (2003). Principles for the validation and use
of personnel selection procedures (4th Ed.). Bowling Green, OH: Author.
Tabachnick, B. G., & Fidell, L. S. (2001). Using multivariate statistics (4th ed.). Needham
Heights, MA: Allyn & Bacon.
Tanaka, J.S. (1993). Multifaceted conceptions of fit in structural equation models. In K.A.
Bollen & J.S. Long (Eds.), Testing structural equation models (pp. 10-39). Newbury
Park, CA: Sage.
Thomas, J. C. (2004). Overview. In J. C. Thomas (Ed.), Comprehensive handbook of
psychological assessment (Vol. 4, pp. 1-3). Hoboken, NJ: John Wiley & Sons, Inc.
Thornton, III, G. C., & Rupp, D. E. (2004). Simulations and assessment centers. In J. C. Thomas
(Ed.), Comprehensive handbook of psychological assessment (Vol. 4, pp. 319-344).
Hoboken, NJ: John Wiley & Sons, Inc.
Tippins, N. T. (2009). Where is the unproctored internet testing train headed now? Industrial and
Organizational Psychology, 2, 69-76.
Tippins, N. T. (2011). Overview of technology-enhanced assessments. In N. Tippins & S. Adler
(Eds.), Technology-enhanced assessment of talent (pp. 1-18). San Francisco, CA: John
Wiley & Sons, Inc.
Tippins, N. T., Beaty, J., Drasgow, F., Gibson, W. M., Pearlman, K., Segall, D. O., & Shepherd,
W. (2006). Unproctored internet testing in employment settings. Personnel Psychology,
59, 189-225.
77
Triantafillou, E., Georgiadou, E., & Economides, A. A. (2008). The design and evaluation of a
computerized adaptive on mobile devices. Computers & Education, 50, 1319-1330.
Waters, S. D., & Pommerich, M. (2007, April). Context effects in internet testing: A literature
review. Paper presented at the 22nd
annual conference of the Society for Industrial and
Organizational Psychology. New York City, NY.
Wiechmann, D. & Ryan, A. M. (2003). Reactions to computerized testing in selection contexts.
International Journal of Selection and Assessment, 11(2/3), 215-229.
Whiting, H., & Kline, T. J. B. (2006). Assessment of the equivalence of conventional versus
computer administration of the test of workplace essential skills. International Journal of
Training and Development, 10(4), 285-290.
Wonderlic, Inc. (2000). Wonderlic Personnel Test and Scholastic Level Exam. Libertyville, IL:
Author.
Woods, C. M. (2002). Factor analysis of scales composed of binary items: Illustration with the
Maudsley obsessional compulsive inventory. Journal of Psychopathology and Behavioral
Assessment, 24(4), 215-223.
Wu, A. D., Li, Z., & Zumbo, B. D. (2007). Decoding the meaning of factorial invariance and
updating the practice of multi-group confirmatory factor analysis: A demonstration with
TIMSS data. Practical Assessment, Research & Evaluation, 12(3), 1-26. Retrieved from
http://pareonline.net/getvn.asp?v=12&n=3
Vandenberg, R. J. (2002). Toward a further understanding of and improvement in measurement
invariance methods and procedures. Organizational Research Methods, 5, 139-158. doi:
10.1177/1094428102005002001
78
Vandenberg, R. J., & Lance, C. E. (2000). A review and synthesis of the measurement invariance
literature: Suggestions, practices, and recommendations for organizational research.
Organizational Research Methods, 3(1), 4-70.
Yu, C. Y. (2002). Evaluating cutoff criteria of model fit indices for latent variable models with
binary and continuous outcomes. (Unpublished doctoral dissertation). University of
California, Los Angeles, CA.

79
APPENDICES
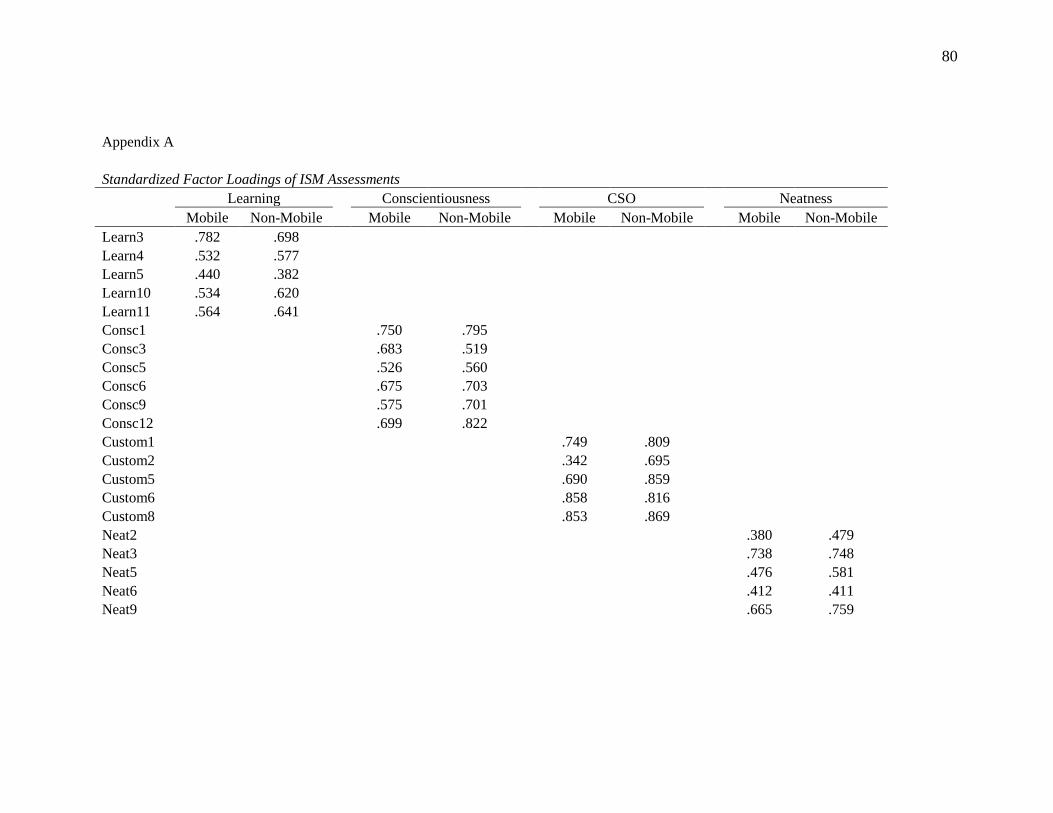
80
Appendix A
Standardized Factor Loadings of ISM Assessments
Learning
Conscientiousness
CSO
Neatness
Mobile Non-Mobile Mobile Non-Mobile Mobile Non-Mobile Mobile Non-Mobile
Learn3 .782 .698
Learn4 .532 .577
Learn5 .440 .382
Learn10 .534 .620
Learn11 .564 .641
Consc1
.750 .795
Consc3
.683 .519
Consc5
.526 .560
Consc6
.675 .703
Consc9
.575 .701
Consc12
.699 .822
Custom1
.749 .809
Custom2
.342 .695
Custom5
.690 .859
Custom6
.858 .816
Custom8
.853 .869
Neat2
.380 .479
Neat3
.738 .748
Neat5
.476 .581
Neat6
.412 .411
Neat9
.665 .759

81
Appendix B
Standardized Factor Loadings of CF Assessment
Customer Service SJT
Mobile Non-Mobile
CustSJT1 0.279 0.529
CustSJT2 0.402 0.476
CustSJT6 0.610 0.477
CustSJT7 0.408 0.625
CustSJT9 0.278 0.464
Appendix C
Inter-item Tetrachoric Correlations for Learning Assessment
1 2 3 4 5
1. Learn3 - .43 .26 .45 .37
2. Learn4 .39 - .25 .33 .32
3. Learn5 .28 .23 - .28 .24
4. Learn10 .41 .32 .30 - .39
5. Learn11 .38 .31 .29 .42 -
Note: Inter-item correlations for the PC group lie below the diagonal, inter-
item correlations for the Phone group lie above the diagonal. All correlations
are significant at p < .05.
Appendix D
Inter-item Polychoric Correlations for Conscientiousness Assessment
1 2 3 4 5 6
1. Consc1 - .47 .38 .56 .38 .56
2. Consc3 .49 - .23 .41 .41 .48
3. Consc5 .42 .27 - .38 .26 .38
4. Consc6 .57 .43 .40 - .40 .53
5. Consc9 .39 .43 .29 .40 - .43
6. Consc12 .58 .49 .42 .53 .46 - Note: Inter-item correlations for the PC group lie below the diagonal, inter-item
correlations for the Phone group lie above the diagonal. All correlations are significant at p
< .05.
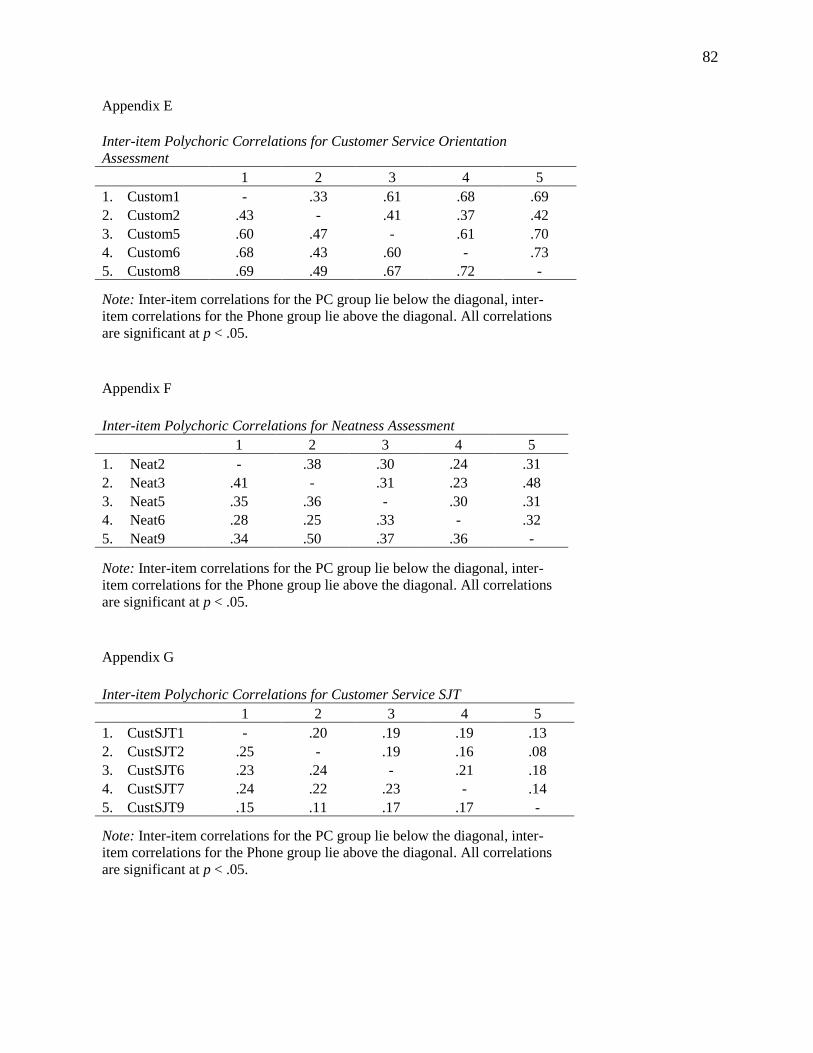
82
Appendix E
Inter-item Polychoric Correlations for Customer Service Orientation
Assessment
1 2 3 4 5
1. Custom1 - .33 .61 .68 .69
2. Custom2 .43 - .41 .37 .42
3. Custom5 .60 .47 - .61 .70
4. Custom6 .68 .43 .60 - .73
5. Custom8 .69 .49 .67 .72 -
Note: Inter-item correlations for the PC group lie below the diagonal, inter-
item correlations for the Phone group lie above the diagonal. All correlations
are significant at p < .05.
Appendix F
Inter-item Polychoric Correlations for Neatness Assessment
1 2 3 4 5
1. Neat2 - .38 .30 .24 .31
2. Neat3 .41 - .31 .23 .48
3. Neat5 .35 .36 - .30 .31
4. Neat6 .28 .25 .33 - .32
5. Neat9 .34 .50 .37 .36 -
Note: Inter-item correlations for the PC group lie below the diagonal, inter-
item correlations for the Phone group lie above the diagonal. All correlations
are significant at p < .05.
Appendix G
Inter-item Polychoric Correlations for Customer Service SJT
1 2 3 4 5
1. CustSJT1 - .20 .19 .19 .13
2. CustSJT2 .25 - .19 .16 .08
3. CustSJT6 .23 .24 - .21 .18
4. CustSJT7 .24 .22 .23 - .14
5. CustSJT9 .15 .11 .17 .17 -
Note: Inter-item correlations for the PC group lie below the diagonal, inter-
item correlations for the Phone group lie above the diagonal. All correlations
are significant at p < .05.