establishing special and common cause...
TRANSCRIPT

Establishing Special and Common Cause VariationCarol Haraden, PhD
This presenter has nothing to disclose
March 3, 2017

Framework for Clinical ExcellencePatient Safety
Transparency
Leadership
Psychological
Safety
Negotiation
Teamwork &
Communication
Accountability
ReliabilityImprovement
&
Measurement
Continuous
Learning
Engagement of
Patients & Family
Learning System
Culture
© IHI and Allan Frankel

Vulnerable System Syndrome
Three core pathologies
- Blame
- Denial
- And the pursuit of (the wrong kind of) excellence
What data do you have about how people
are harmed and why they die? Let’s look at
the case…

Root Cause Analysis
What data will you want to know to understand what happened?
5

How do we know if what happened to Mr.
Taylor is special cause or common cause
(happening throughout the organization)?
6

What data would we like to have?
INRs within range (outpatient and inpatient)
Deaths from VTE
Compliance with VTE assessment and prophylaxis
Surgical prophylaxis
Readmission data for anticoagulation issues
7
Were the processes unreliable?
For Mr. Taylor? Throughout the organization?
8

What processes concern you with Mr.
Taylor’s care?

Communication between outpatient and inpatient
Critical lab value follow up
Pre-op identification and dosing
Identification of deterioration and rescue
Medication reconciliation
Use of structured communication especially in problem situations

How can we learn about our system
performance?
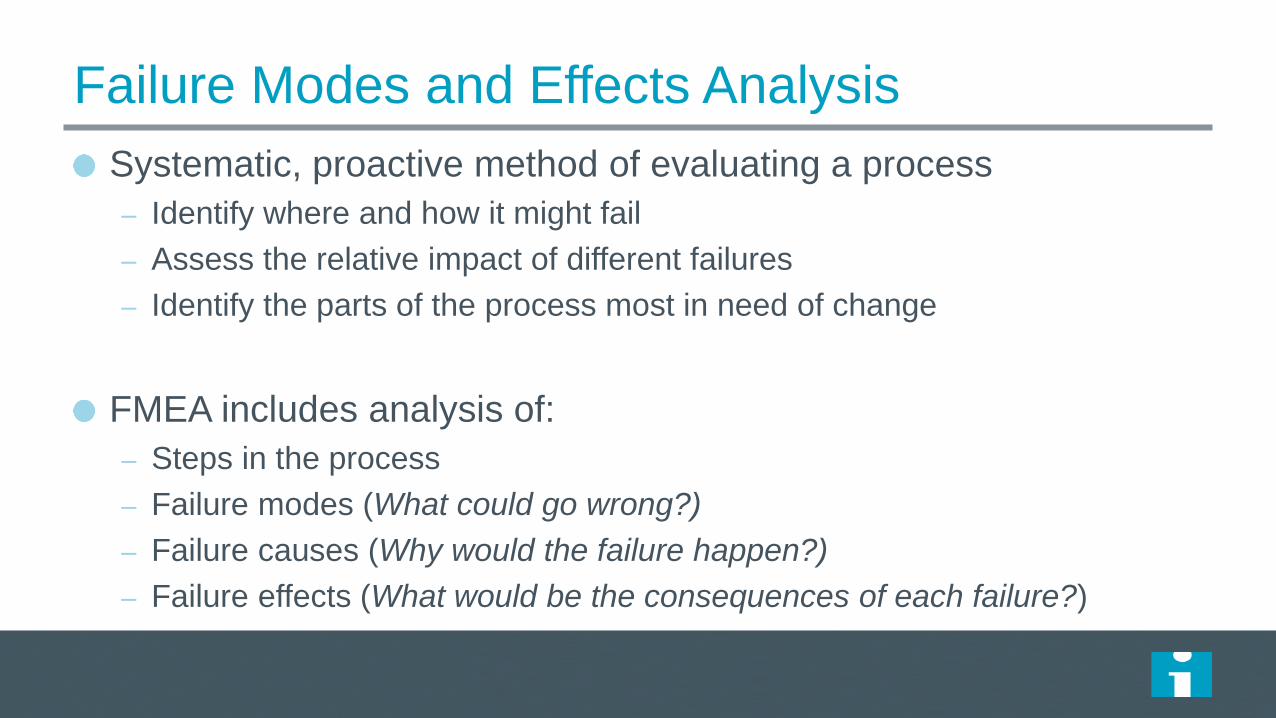
Failure Modes and Effects Analysis
Systematic, proactive method of evaluating a process
– Identify where and how it might fail
– Assess the relative impact of different failures
– Identify the parts of the process most in need of change
FMEA includes analysis of:
– Steps in the process
– Failure modes (What could go wrong?)
– Failure causes (Why would the failure happen?)
– Failure effects (What would be the consequences of each failure?)

Creating your own FMEA
Select a process to evaluate with FMEA
Recruit a multidisciplinary team
Meet together to list all the steps in the process
List failure modes and causes
For each failure mode, assign a numeric value for
– Likelihood of occurrence (1–10)
– Likelihood of detection (1–10)
– Severity (1–10)
Evaluate the results
– Multiply numbers to get a Risk Priority Number (RPN)
– Total RPN is the sum of all step and failure mode RPNs

Sample FMEA Spreadsheet
Stepsin the Process
Failure Mode
Failure Causes
Failure Effects
Likelihood Occurrence
(1–10)
Likelihood Detection(1–10)
Severity(1–10)
Risk Priority Number
Actions to Reduce
Occurrence
1
2
Total RPN (sum RPNs):
Failure Mode: What could go wrong? Likelihood of the failure: 1=10 (10= very likely to occur)Failure Causes: Why would the failure happen? Likelihood of detection: 1-10 (10= very unlikely to detect)Failure Effects: Consequences of failure? Severity: 1-10 (10= most severe)Risk Profile Number (RPN): Likelihood of Occurrence × Likelihood of Detection × Severity

Example: FMEA Chemotherapy
Stepsin the Process
Failure Mode Failure Causes Failure Effects Likelihood of Occurrence
(1–10)
Likelihood of Detection(1–10)
Severity(1–10)
Risk Priority Number (RPN)
Actions to Reduce Occurrence of Failure
MD Order Incorrect
drug is
ordered
Mental slip;
handwriting issue,
mis-reading
protocol; lack of
knowledge;
protocol printed
incorrectly
Pot. fatal
outcome
1 8 10 80 Database of
protocols;
chemo
checking
checklist
Incorrect
dose is
ordered
Calculation error;
mis-reading
protocol, incorrect
patient data
(weight, height,
WBC, creatinine),
BSA caclulated
incorrectly,
handwriting issue;
patient data not
available; mental
slip; protocol
printed incorrectly.
Pot. Fatal
outcome
4 3 10 120 Database of
protocols;
chemo
checking
checklist

Example: FMEA Chemotherapy
Stepsin the Process
Failure Mode Failure Causes Failure Effects Likelihood of Occurrence
(1–10)
Likelihood of Detection(1–10)
Severity(1–10)
Risk Priority Number (RPN)
Actions to Reduce Occurrence of Failure
Wrong
route is
ordered
Mis-reading
protocol,
handwriting issue;
mental slip;
protocol printed
incorrectly;
dangerous
abbreviation;
dangerous
convention.
Pot. fatal
outcome
especially
if it is an
intrathecal
route.
2 2 10 40 Pre-typed
order form
template;
database of
protocols
Dose
exceeds
lifetime
limits
Knowledge;
patient
information
unavailable;
history of prior
dosing
unavailable
Pot. Fatal
outcome
2 9 10 180 Patient
dosing cards
Total RPN
420 (2092)

Targeting Areas for Improvement
Prioritize improvement efforts based on RPN
– Focus on failure modes with high RPNs
– Failure modes with low RPNs have little effect
Consider individual RPN components as well:
– Reduce severity first – most important component
– Pay special attention to 9 and 10, regardless of total RPN
– Take preventive/corrective actions to avoid failure mode
– Then occurrence – has greatest overall benefit
– Then detection – be sure to test effectiveness
Create multiple scenarios showing different changes
Target half-life (50% reduction) for each pass

Diagnostic Journey
People die unnecessarily every day under our care.
We need a diagnostic tool that moves us out of a model for
judgment and into a model for learning.

The Mortality Diagnostic – 2x2 Matrix
Review most recent 50 consecutive deaths.
Place them into a two by two matrix based on:- Was the patient admitted for palliative care?- Was the patient admitted to the ICU?
Focus your work initially on boxes that have at least 20% of your mortality.
In which box would you place Mr. Taylor?
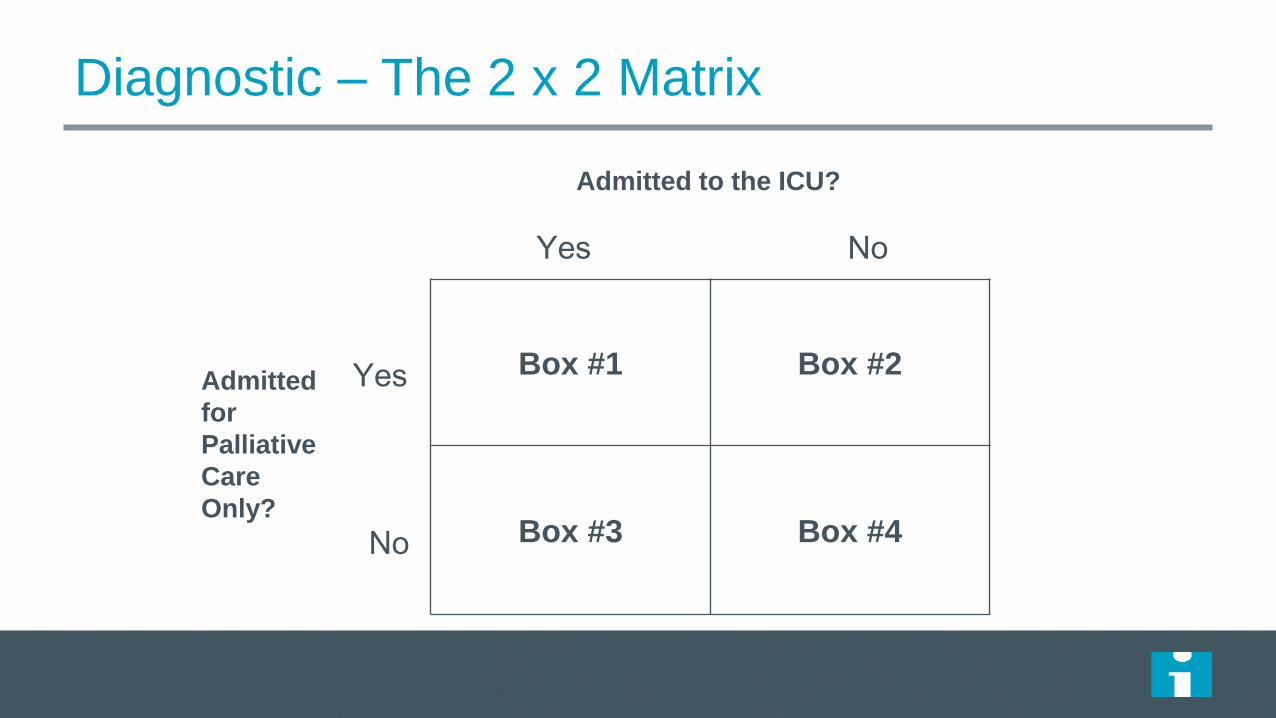
Diagnostic – The 2 x 2 Matrix
Admitted to the ICU?
Yes No
Admitted
for
Palliative
Care
Only?
Yes
No
Box #1 Box #2
Box #3 Box #4


US 2X2 Table Aggregate64 Hospitals
ICU Admission
No ICU Admission
Comfort Care 86/3175 3%
(0-14%)
402/3175 13%
(0-40%)
Non Comfort Care 1161/3175 37%
(10-72%)
1526/3175 48%
(18-76%)

The Mortality Diagnostic - Failure to Recognize,
Plan, Communicate
Analyze deaths in box 3 and 4 for evidence of failure to:
recognize, communicate, plan.
This will help you understand the local environment.
The journey….
What are our problems as seen from the diagnostics?
How would we prioritize these?
How reliable are we? What are the issues?
How do they relate to our strategic plan?
How do we deploy the work in a way that we meet our most important aims?

Resources
White papers (on IHI.org)
– Mortality
– Global Trigger Tool
– Waste Tool
25

Take a moment to reflect
on your own work.
What will you incorporate from
this session into your plans?