establishing a baseline of school safety practices using ... a baseline of school safety practices...
TRANSCRIPT

1
Establishing a Baseline of school safety practices using RapidPro real-time SMS technology in Khyber Pakhtunkhwa Education Section UNICEF Pakistan Country Office By Elliot McBride
February, 2017

2
Contents
Table of Tables........................................................................................................................................................................ 3
Table of Figures ...................................................................................................................................................................... 3
Acronyms ................................................................................................................................................................................ 3
Acknowledgements ................................................................................................................................................................. 4
Executive Summary ................................................................................................................................................................ 5
Report Objectives ................................................................................................................................................................ 5
Overview/Rationale ............................................................................................................................................................. 5
Key Highlights ..................................................................................................................................................................... 6
Recommendations .............................................................................................................................................................. 6
Hypotheses ............................................................................................................................................................................. 7
Section 1: Background ............................................................................................................................................................ 8
Section 2: Design .................................................................................................................................................................. 11
Aim .................................................................................................................................................................................... 11
Method .............................................................................................................................................................................. 11
Sampling ........................................................................................................................................................................... 12
Section 3: Results ................................................................................................................................................................. 13
General emergency concern ............................................................................................................................................. 15
Emergency Confidence Mean (ECM) ............................................................................................................................... 16
Armed attack ..................................................................................................................................................................... 19
Flooding ............................................................................................................................................................................. 20
Earthquakes ...................................................................................................................................................................... 21
Section 4: Conclusion ........................................................................................................................................................... 26
General emergency preparedness ................................................................................................................................... 26
Armed ................................................................................................................................................................................ 26
Flooding ............................................................................................................................................................................. 26
Earthquakes ...................................................................................................................................................................... 26
Medical concerns and Other concerns ............................................................................................................................. 26
References ............................................................................................................................................................................ 27
Annexure ............................................................................................................................................................................... 28
Protocol for RapidPro applications within programmes ........................................................................................................ 33
Question development .......................................................................................................................................................... 34
Testing ................................................................................................................................................................................... 34
Checklist ................................................................................................................................................................................ 34

3
Table of Tables
Table 1: RapidPro SMS Survey ............................................................................................................................................ 11 Table 2 Survey Result Metrics .............................................................................................................................................. 13 Table 3 mean concern rates across all Tehsils ..................................................................................................................... 16 Table 4 RapidPro Safety in Schools Baseline Survey .......................................................................................................... 28 Table 5 Data Collected From RapidPro Safety in Schools Baseline Survey ........................................................................ 30
Table of Figures
Figure 1: OCHA map – MapDoc:Pak766_v11 ...................................................................................................................... 10 Figure 2 Emergency Types Least prepared for .................................................................................................................... 15 Figure 3 Help needed for School safety plan - remainder .................................................................................................... 15 Figure 4 Help needed for School safety plan - ALL emergency concern ............................................................................. 15 Figure 5 Effects of Training Rates on General safety concern levels ................................................................................... 16 Figure 6 Rates of School safety plans on Emergency Confidence Means (ECM) ............................................................... 17 Figure 7 School Safety Plans and Emergency Confidence Means ...................................................................................... 17 Figure 8 Effect of Training rates on teaching School safety plans........................................................................................ 18 Figure 9 Effect of School safety plans on Attack concern rates in FATA bordering and non FATA bordering Tehsils ........ 19 Figure 10 Training rates on ECM in FATA bodering and non FATA bordering Tehsils........................................................ 20 Figure 11 Concern rates for flood preparedness in flood affected and non-flood affected Tehsils ...................................... 20 Figure 12 School safety plans and flood concern rates ........................................................................................................ 21 Figure 13 Average overall levels of flood concern and earthquake concern ........................................................................ 21 Figure 14 Earthquake concern in earthquake affected and non-earthquake affected Tehsils ............................................. 22 Figure 15 - Emergency Confidence Mean (ECM) results found no significant difference in FATA bordering Tehsils. ........ 23 Figure 16 Flood affected regions and concern surrounding flood preparedness ................................................................. 24 Figure 18 Earthquake heat map............................................................................................................................................ 25
Acronyms
ATC Attack Concern ANOVA Analysis of Variance EA Earthquake affected region EAC Earthquake concern ECM Emergency Confidence Mean EMIS Education Management Information System
EQ Earthquake
FA Flood affected region
FGDs Focus Group Discussions
FLC Flood concern
HOSP Number of hospitals
IASC Inter-Agency Standing Committee
KP Khyber Pakhtunkhwa MEDC Medical concern NDMA National Disaster Management Authority OCHA United Nations Office for Coordination of Humanitarian Assistance
TR Training Rate
UNICEF United Nations International Children’s Emergency Fund

4
Acknowledgements
A number of different participants were responsible for making this initiative successful. First and most significantly, to Stuart Campo and Kalee McFadden from the UNICEF Global Innovation Centre (GIC). Thank you for your constant guidance, quality control and grand strategy. You remain the energy that Pakistan innovations programmes require to achieve meaningful impact.
A very large thank you to the Government of Khyber Pakhtunkhwa, Department of Education for an effective partnership, which included community outreach and helpful coordination. To the Education Section within UNICEF Pakistan headquarters in Islamabad, Mr Toumane Dianka and Mr Yasir Arafat, for coordination and assistance throughout the project lifecycle. In the Khyber Pakhtunkhwa education section, Muhammad Riaz for troubleshooting, phone number assimilation and assistance.
To Masooma Qazilbash for technical and expert assistance in Disaster Risk Reduction, thank you for the survey development, editing, finalization and consistent technical and expert help through the timeline of this report. To Mr Cal Lee, thank you for the assistance with technical coding necessary to complete this project on time and to a high and professional standard. To Evan Wheeler, another technical specialist who has made himself available without limit or complaint for troubleshooting beyond our abilities.
Finally, thank you to the relevant section and office chiefs. Ellen Van Kalmthout from Education, Daniel Timme from Advocacy and Communication and the Chief of Khyber Pakhtunkhwa field office, Francois Kampundu. Without your direction, encouragement, and management at this senior level, obstacles with this project simply would not have been overcome with the efficiency and professionalism that made this project possible.
As is clear from the above, many individuals and organizations have made significant contributions to this study; any errors and omissions, however, are the consultant’s responsibility.
Elliot McBride
Innovation Coordinator
Islamabad Pakistan

5
Executive Summary
Pakistan’s extensive history with disasters is the basis of this confidence and safety practice assessment in Khyber Pakhtunkhwa. This baseline assessment was designed to serve a dual purpose. First, it analyses the levels of confidence and habits surrounding safety in schools and compares those metrics with Khyber Pakhtunkhwa, where disasters occurred between 2005 and 2015. Second, it provides pre-intervention measurements for any potential impact evaluation on safety training due to be given to schools in Khyber Pakhtunkhwa. Following safety preparedness training given to schools, a follow up survey can be distributed, using the pre training survey results as an initial measurement for training impact.
RapidPro is an open source software platform that sends and receives messages from beneficiaries over SMS and consolidates their responses for post-hoc analysis. Until now, there has not been a platform that automated, two-way communication with beneficiaries at scale, in multiple languages and across multiple modes of communication. RapidPro has the potential to revolutionize monitoring and evaluation by automating data entry and analysis. Furthermore, the penetration rate for SMS feedback in Pakistan is much higher and further reaching, enabling the analysis of beneficiary data disaggregated by gender, location, age and other factors such as profession, and minority status.
Report Objectives
This report disseminates results from a census of government schools in Khyber Pakhtunkhwa which measures safety confidence and practices. Phone numbers of education focal points working at these schools were available through the Education Management Information System (EMIS). Each school had a total of one focal person who was contacted. The EMIS database often provided 2 focal points however only one was included per school.
The survey will be a self-reported metric of confidence surrounding for school safety situations. This will take metrics in 2 ways:
a) Safety concern rates – levels of concern surrounding preparedness for specific emergencies (earthquake, flood, etc.)
b) Safety confidence means - a mean of confidence scores in school regions preparedness in the event of general emergencies. It is noted as confidence and not actual preparedness as this survey is self-reported. No measure of performance is able to be taken with this survey.
While these two metrics are measuring emergencies on opposing scales, they are not necessarily correlated (i.e. an increase in emergency confidence does not equal a decrease in emergency concern); therefore, the two metrics are measured and analyzed independently.
This report also aims to measure the impact that safety practices have on comfort around emergency preparedness. The relationship between safety training and perceived emergency preparedness will also be measured to determine training effectiveness. Furthermore, existing School Safety Plans (School safety plans) will be measured against preparedness. All data taken from Khyber Pakhtunkhwa will be geographically plotted by Tehsil. A Tehsil is a subdivision of a district. This measurement was taken to give a more accurate geographical distribution of collected data.
The results will also be compared to recent emergencies in order to examine regional perceptions of preparedness based on previous disasters. Three maps have been created to examine the results of flood-affected areas and confidence in flood preparedness, earthquake-affected areas and confidence in earthquake preparedness, and a heatmap of the ECM in proximity to FATA.
Overview/Rationale
Previously, feedback on safety programming could only be collected during active training, whether through focus group discussions (FGDs) or other activities conducted in the field. This method leaves a time gap between the programme and incorporation of the feedback that is received. Incorporation of RapidPro technology allows a real time information component to be included from a distance so that preparations can be made to future initiatives based on user feedback prior to delivery, not after programme implementation. A key part of the “Transformative Agenda” introduced by the Inter Agency Standing Committee (IASC) in July 2012, which sought to reform humanitarian interventions, is “accountability to affected populations,” including principles such as transparency, feedback and complaint resolution”. This RapidPro initiative is positioned to maximize the line of communication between the beneficiary and UNICEF through the collection and dissemination of real time information.

6
UNICEF Pakistan is now using RapidPro as an innovative way to monitor programmes in real-time. The survey was successfully completed by 3842 school focal points across Khyber Pakhtunkhwa. Respondents self-selected in either English or Urdu. Results of incomplete surveys were also included.
After registration, respondents were asked 4 questions with 2 sub questions:
Key Highlights
1. There were significant differences in concern rates surrounding preparedness for flooding if the region has previously experienced flooding.
2. There were significant differences in concern rates surrounding preparedness for earthquakes if the region has previously experienced earthquakes
3. Tehsils where school training is higher have increased confidence in preparedness and increased amounts of reported school safety plans.
4. Schools with higher training rates are more likely to report teaching school safety plans. 5. School Safety plans and school safety training are correlated with lower reported scores of concern concerning
floods, however the results were not significant with earthquakes. 6. If a Tehsils schools have higher rates of training, they are more likely to experience higher rates of confidence
surrounding emergency preparedness, this is true of both FATA-bordering and non FATA-bordering Tehsils. 7. Despite extensive flooding, there is greater concern about medical emergency preparedness than flooding. 8. There was no geographical relationship between FATA proximity and emergency or attack confidence.
Recommendations
1. It was discovered from the results that the Emergency Confidence Mean (ECM) was too broad a metric. In order to measure deficits with greater accuracy, there should be an adjustment in the questionnaire that focuses less on the general safety preparedness of schools and focuses on specific deficits. i.e. regarding your most vulnerable type of emergency, how well are you prepared for it?
2. This assessment can be used as an impact assessment for safety training was to regions within Khyber Pakhtunkhwa, if training is given to a region, this assessment can be conducted again in order to measure the impact that the training has delivered in those schools.
3. Future studies should include deficit types (training, infrastructure, staff/personnel) including a question on type of deficit that affects safety preparedness.
4. Emergency specific training should be targeted to regions who are prone to disasters ad should take into account geographical differences for previously disaster affected areas.
Question Follow up
1. Has your school received safety training
in the last 2 years? Yes/No
2. Do teachers at your school teach children about what to do in the event of an emergency such as earthquakes, floods, attacks and medical emergencies using a plan? Yes/No
If No, does you school need assistance with a school safety plan?
3. Between 1 and 5 how well prepared is your school where 5 is completely prepared and 1 is not prepared?
If 4 or 5, what makes your school so prepared for an emergency? If 1 or 2, what makes your school so unprepared?
4. What emergency are you least prepared for? Earthquake, Flood, Armed attack, medical, All, None, Other

7
5. There remains an ongoing need for safety training resulting in the development of a school safety plan specific to each school. Doing so increases confidence in emergency preparedness.
Hypotheses
When assessing the practices of safety preparedness in Khyber Pakhtunkhwa, it is hypothesized that:
1. FATA bordering regions will have lower confidence in school safety and higher rates of concern surrounding armed attack preparedness
2. Regions affected by flooding will have higher concern surrounding flood preparedness than regions which have not been affected by flooding.
3. Earthquake prone regions will report higher rates of concern surrounding 4. Regions who have higher training rates will differ in confidence than those who have lower training rates in the
last 2 years. 5. Rates where school training is higher will have increased confidence and increased amounts of reported school
safety plans. 6. Schools with low confidence in preparedness will have lower rates of safety training and school safety plans.

8
Section 1: Background
Amongst the gamut of disasters that could be potentially measured in this survey, floods, terror attacks, earthquakes and medical emergencies are the most common types of disasters identified by UNICEF Pakistan’s Disaster Risk Reduction unit for Khyber Pakhtunkhwa (KP). Assessing disasters outside of these types which have been identified is beyond the scope of this study. Whilst this initial program is for schools within KP only, it has been designed for scalability to the rest of Pakistan.
Pakistan lies on a competing tectonic plate (Indo-Australian) which is moving north into the Eurasian tectonic plate, creating the Himalayan, Hindukush and Karakuram Mountain ranges. These ranges cover most of Khyber Pakhtunkhwa with major mountainous areas to the north, and minor mountain ranges to the south in the Dir, Swat and Kohistan districts. As this plate is continuously moving north, it causes seismic activity which can be devastating to many parts of Khyber Pakhtunkhwa and Pakistan more broadly. This impacts population zones all over KP as shown in the below map of earthquake affected areas, including the many schools and school children within KP. These areas have experienced 4 major earthquakes in 1935, 1945, 1976 and 2005. Khyber Pakhtunkhwa has experienced many smaller, more frequent earthquakes with localized damage.
Pakistan is in a geographical region susceptible to seasonal monsoonal rains which have caused major flooding of the indus river basin over the last 10 years. This has major economic and migration impacts for Pakistan1. Since 2005, 37.23 million people have been effected by flooding throughout Pakistan. 2 The Indus river basin has a total area of 1.12 million squared kilometers. 47% of which lies in Pakistan with an approximate area of 520 000 km², or 65 percent of the nation. The entire provinces of Punjab and Khyber Pakhtunkhwa are covered by the basin.3 Major flooding of the indus river basin occurs in monsoon season late in the summer between July and September. Monsoonal rains usually occur from the extending rivers from the basin rather than the basin itself.4 Snow fed rivers cause flooding during summer heat waves combined with monsoonal rains, furthermore dam bursts have propelled the propensity of flooding after heavy rainfall. The economic and social impacts of flooding have major impacts on schools. School infrastructure is often used as alternate housing when homes are damaged or inaccessible due to flooding. Furthermore, as flash flooding occurs rapidly schools often do not have effective coordination over their large population increasing risk for students and teachers during evacuations.
Armed attacks in Pakistan have been a consistent threat to civilians throughout Pakistan over the last 50 years. Schools in particular are at greater risk due to increased population density, openness and a lack of security. In KP alone there have been 103 armed attacks within KP including an attack at a school in Peshawar that claimed 140 lives, most of whom were children.56 Related to many disasters is the ability for schools to understand and respond to medical emergencies. This can include delivering first aid, ability to deliver assistance within the school grounds or access to medical facilities external to the school.
This initiative has been assembled by UNICEF Pakistan’s Innovation unit in conjunction with UNICEF Pakistan sections for Education and Disaster Risk Reduction. UNICEF Khyber Pakhtunkhwa field office coordinated with the department of education in Khyber Pakhtunkhwa for outreach to school focal points and assimilation of contact numbers from the EMIS database. As the implantation of this project occurred without the use of an implementing partner, no other costs were involved past telecommunication expenses already incurred from the UNICEF innovation’s RapidPro implementation.
Below is a map compiled by UNOCHA of the major disasters which have affected Pakistan between 2005 and 2015, it shows regions and populations which have been effected by floods, droughts, earthquakes, and complex emergencies. Complex emergencies in this instance can be defined by ‘any event which results in a mass influx or efflux of internally displaced persons’. This report will examine imminent emergencies only which will include medical, armed attacks, earthquakes and flooding.
1 Fact sheet - Pakistan Humanitarian Pool Fund (PHPF) Pakistan, United Nations Office for the Coordination of Humanitarian Affairs. https://www.humanitarianresponse.info/en/system/files/documents/files/phpf_fact_sheet_august_2016.pdf 2 Pakistan: Districts effected by major emergencies 2005-2015. Mapdoc Pak766_v11 3 Akhtar, Shamshad. "The south Asiatic monsoon and flood hazards in the Indus river basin, Pakistan." Journal of Basic & Applied Sciences 7, no. 2 (2011). 4 Food and Agricultural Organisation, United Nations & Aquastat. “The Indus river basin”. http://www.fao.org/nr/water/aquastat/basins/indus/indus-CP_eng.pdf (2011) 5 The South Asia Terrorism Portal – Khyber Pakhtunkhwa Timeline 2016. http://www.satp.org/satporgtp/countries/pakistan/nwfp/timeline/index.html accessed 05/09/2016 6Militant siege of Peshawar school ends, 141 killed. Dawn. Updated DEC 16, 2014 10:44PM http://www.dawn.com/news/1151203

9
In order to be emergency-ready, it is vital that schools develop a safety plan. Establishing a school safety plan greatly contributes to emergency preparedness and greatly decreases the risk of injury, death and recovery, post disaster. Numerous studies have shown the benefits of school safety plans in preparedness and ability to cope during an emergency.7 Safety plans cover an array of practices learned by teachers and taught to students in various ways such as, evacuation plans, designated evacuation areas, and general safety awareness. These safety plans should be regularly revisited during the schooling yea in order to keep safe practice at the forefront of student awareness. Schools were surveyed for their safety plan status. Those who currently did not have a safety plan were then asked if they required assistance in developing one. They were also asked if they had received safety training in the past 2 years. Results were averaged from schools across KP.
School Safety Training is conducted in KP schools as preemptive counter measure to increase preparedness in the practices that save lives in the event of a disaster. School safety training is a mandatory measure throughout KP schools which aim to ‘Discuss the concepts and principles of disaster risk. Identify key components in disaster risk assessment, and perform child-centered disaster risk assessment.8
7The results of the below graph show a statistically significant relationship between continued school safety plans and training rates of <2yrs, with a linear regression value of (P = >|t| = 0.000778, a = .95)
8 Gender & child cell, national disaster management authority NDMA, Consolidated Report. Child center DRR & comprehensive school safety training-pakistan. (2014) pp1.

10
Figure 1: OCHA map – MapDoc:Pak766_v11

11
Section 2: Design
Aim
To understand the dynamics, and influences for confidence in school safety regarding emergencies. This will be undertaken by surveying the administrative focal points of schools in Khyber Pakhtunkhwa, measuring confidence levels and standard practices surrounding safety within schools. This will determine the best predictor(s) of confidence surrounding safety in schools. Furthermore, this study aims to examine the effects that two mitigating measures (school’s safety training and school safety plans) have on confidence and emergency preparedness. Both of these practices have been measured in the schools within Khyber Pakhtunkhwa.
Method
Implementation of this project was conducted through local government and UNICEF staff in Khyber Pakhtunkhwa field office. Implementation of this project was aligned with the UNICEF innovation protocol which can be found in the annexure (item 3). There was no external implementing partner used in this project. All work was undertaken between the UNICEF Pakistan innovation unit, the UNICEF KP field office and the department of education.
Table 1: RapidPro SMS Survey
Question Answer options Follow up question(s)
Which Tehsil do you work in?
1 Name of Tehsil NA
Has your school received safety
training in the last 2 years?
2 A) Yes B) No C) Unsure
NA
Do teachers at your school teach children
about what to do in the event of an
emergency such as earthquakes, floods, attacks and medical
emergencies using a plan?
3 A) Yes B) No
If No – Do you need assistance developing a school safety plan? If Yes – how often are they taught about emergencies? A) weekly B) monthly C) per semester D) Every Year
Between 1 and 5 how well prepared is your
school where 5 is completely prepared
and 1 is not prepared?
4 1 – not prepared 2 – poorly prepared 3 – neither prepared nor unprepared 4 – mostly prepared 5 – completely prepared
If 5 or 4 - What makes your school so prepared for an emergency? (answer in 1 sentence only)
What emergency are you least prepared
for?
6 a) Flood b) Medical c) Armed attack d) Earthquake e) All
NA

12
f) None g) Other
Sampling
This study is dividing KP at the Tehsil level, this is to provide a more detailed level of geographical insight into results then if districts were used. All data in the used set was segregated to this level. Traditional feedback methods are only capable of reaching groups of beneficiaries who are coordinated in FGDs or by word of mouth, bringing into question issues of quality of content. This method is unable to match populations reached when compared to RapidPro. RapidPro programme monitoring has greater external validity as the much larger sample sizes obtained are far more representative of the general population.
This sample was conducted as a census of all government school focal points within Khyber Pakhtunkhwa. A school focal point in KP is a teacher, principal or administrator who acts as is the point of contact for the KP Government Department of Education surrounding matters of curriculum, planning and administration. This is the justification for their selection as the survey sample, as they are the person most accustomed to individual school safety in KP. All focal points are required to have a cell phone and all school focal points are registered in a database kept by the department of education with phone numbers. The survey was available in English or Urdu for participants to select, therefore no school focal points were excluded from not possessing the required level of ability.
As the survey method was via SMS where the contact details were entered via upload from the EMIS database, as the surveys were not supervised with each member an issue of non-response bias must be considered. That is where individuals not responding to the SMS survey might be somehow correlated to the variables of interest, and therefore the results that received are not properly representative of your target population. As the contact details of all government school focal points are available and all contacts within it were sent a survey. Despite having issues with gaps in completed surveys each school focal point had an equal opportunity to complete the survey. Therefore the sample who responded can be considered representative of the population of school focal points throughout KP and eliminating non-response bias. As there was no way to tell if the owner of the phone is the one completing the survey, there remains an unmitigable risk for this project.
3842 school focal points completed the survey. As survey participation was voluntary and self-selecting, frequency of respondents could not be controlled past the point of instruction from district level government officials. The results of 5 tehsils have been removed due to a lack of representative samples (Kalam Kalkot Barawal PirBaba Chagharzai). The data collected and presented in this report is designed to be an introductory baseline of issues surrounding safety for schools in KP.
13
Section 3: Results
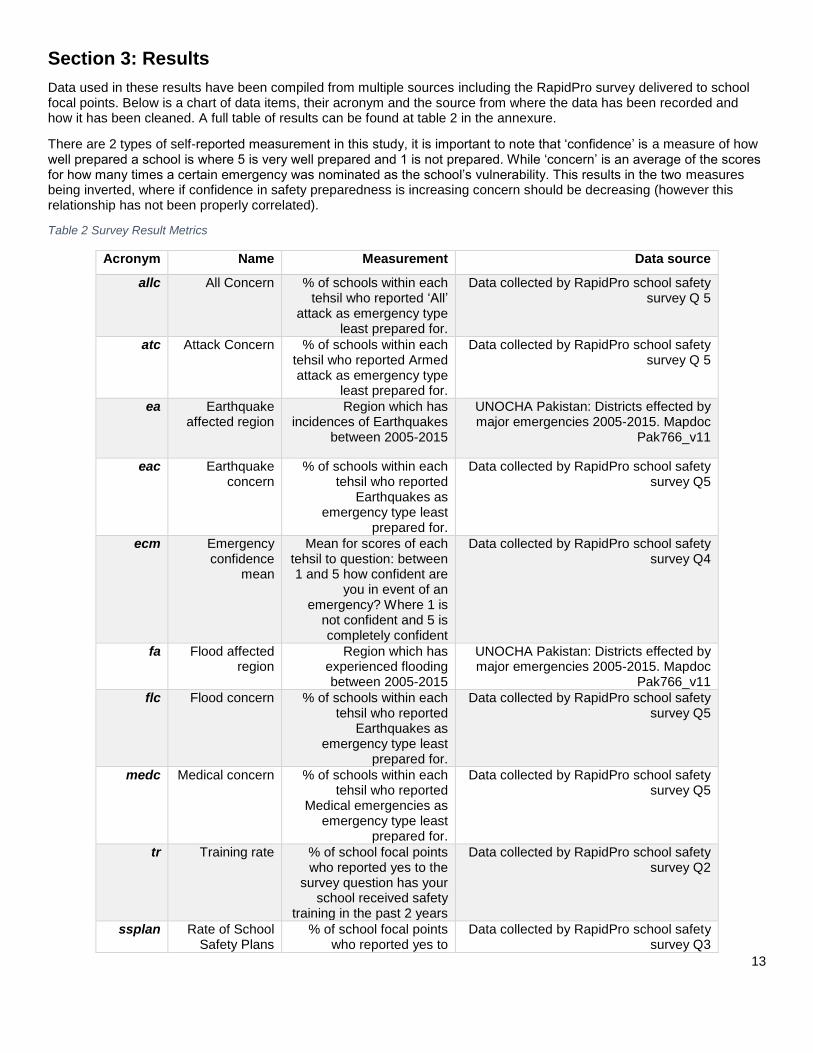
Data used in these results have been compiled from multiple sources including the RapidPro survey delivered to school focal points. Below is a chart of data items, their acronym and the source from where the data has been recorded and how it has been cleaned. A full table of results can be found at table 2 in the annexure.
There are 2 types of self-reported measurement in this study, it is important to note that ‘confidence’ is a measure of how well prepared a school is where 5 is very well prepared and 1 is not prepared. While ‘concern’ is an average of the scores for how many times a certain emergency was nominated as the school’s vulnerability. This results in the two measures being inverted, where if confidence in safety preparedness is increasing concern should be decreasing (however this relationship has not been properly correlated).
Table 2 Survey Result Metrics
Acronym Name Measurement Data source
allc All Concern % of schools within each tehsil who reported ‘All’
attack as emergency type least prepared for.
Data collected by RapidPro school safety survey Q 5
atc Attack Concern % of schools within each tehsil who reported Armed attack as emergency type
least prepared for.
Data collected by RapidPro school safety survey Q 5
ea Earthquake affected region
Region which has incidences of Earthquakes
between 2005-2015
UNOCHA Pakistan: Districts effected by major emergencies 2005-2015. Mapdoc
Pak766_v11
eac Earthquake concern
% of schools within each tehsil who reported
Earthquakes as emergency type least
prepared for.
Data collected by RapidPro school safety survey Q5
ecm Emergency confidence
mean
Mean for scores of each tehsil to question: between 1 and 5 how confident are
you in event of an emergency? Where 1 is
not confident and 5 is completely confident
Data collected by RapidPro school safety survey Q4
fa Flood affected region
Region which has experienced flooding between 2005-2015
UNOCHA Pakistan: Districts effected by major emergencies 2005-2015. Mapdoc
Pak766_v11
flc Flood concern % of schools within each tehsil who reported
Earthquakes as emergency type least
prepared for.
Data collected by RapidPro school safety survey Q5
medc Medical concern % of schools within each tehsil who reported
Medical emergencies as emergency type least
prepared for.
Data collected by RapidPro school safety survey Q5
tr Training rate % of school focal points who reported yes to the
survey question has your school received safety
training in the past 2 years
Data collected by RapidPro school safety survey Q2
ssplan Rate of School Safety Plans
% of school focal points who reported yes to
Data collected by RapidPro school safety survey Q3

14
currently teaching a school safety plan

15
Measuring emergency preparedness
The below shows the raw scores for responses to question 3, ‘Which emergency are you least prepared for?
Figure 2 Emergency Types Least prepared for
In response to this question, nearly the most common responses to emergency type least prepared for was ‘All’ emergencies. This is indicative that general confidence in emergency preparedness is low in many areas. Below graphs show rates of desired assistance for a school safety plan between schools that responded with “All” and Schools that responded with anything else. Schools that responded that they were least prepared for All emergency types equally were also more likely to require help developing School Safety plans and were less likely to have training in the last 2 years (All – 4.04%, Everything else – 10.2%).
General emergency concern
When asked ‘what emergency are you least prepared for’ the options were each type of emergency being measured including an ‘All’ or ‘Other’ option. ‘Other’ results were insignificant, and were therefore omitted. This question resulted in 5 data points compiled in the results table (see annexure) - All Concern (Allc), Attack Concern (Atc), Flood Concern (Flc), Medical Concern (Mdc) and Earthquake Concern (Eac). It is important to note that as these metrics are measuring concern and not confidence they are inverted compared to the rest of the data collected. i.e. Higher scores are indicative of more concern surrounding emergencies and not more confidence in their ability to deal with these emergencies. These points were disaggregated by each tehsil as a percentage of overall responses to that question therefore a score of 21% for Eac
Figure 4 Help needed for School safety plan - ALL emergency concern
Figure 3 Help needed for School safety plan - remainder

16
was means that 21% of all responses have registered earthquakes as the emergency that they feel they are least prepared for, the data was not inverted as a 21% concern rate does not equal a 79% confidence rate as there has been no relationship investigated between confidence and concern. Below are the raw scores for the responses to this question, without being first disaggregated by tehsil. ‘All’ emergencies therefore indicate that there are deficits in preparedness generally. Furthermore, if scores for each Tehsil are taken as an average compared with other emergency types, ‘All’ emergencies are the highest score on average when measured by Tehsil. Indicating that while raw scores for Armed attack are higher, Tehsils are more concerned about general emergency preparedness. Table 3 mean concern rates across all Tehsils
Mean ‘All’ Mean ‘Flc’ Mean ‘atc’ Mean ‘Medc’ Mean ‘Eac’
36.05011 8.291364 30.2947 13.38542 15.31318
However, training is effective at reducing concerns surrounding general preparedness. There is a correlation between lower scores of general emergency concern (or ‘All’ concern) and increased levels of school safety training. Indicating that school safety training is effective in reducing general preparedness concerns.
Figure 5 Effects of Training Rates on General safety concern levels
While there is a low R-squared value associated with this linear regression the slope of the model indicates that there is a relationship between higher levels of training and lower levels of general concern. (r = - 0.282). A similar trend was recorded between general concern and school safety plans however results were not significant. (r= - 0.024)
Emergency Confidence Mean (ECM)
When developing the questionnaire an overall measurement of ‘confidence surrounding emergency preparedness was required. A Likert scale was used to answer the question ‘Between 1 and 5 how well prepared is your school where 5 is completely prepared and 1 is not prepared?’ The result was a general emergency measurement aimed to determine the confidence of each school in their preparedness with emergencies common to Khyber Pakhtunkhwa. The mean of the results was taken across each Tehsil to determine the Emergency Confidence Mean (ECM). As this was a self-reported metric, it has been labeled as a measure of ‘confidence’ to reflect how the school focal person feels that the school would perform, and is a good indication as to the mindset reflected if ever having to respond to an emergency. FigureX below is a heatmap for all of the ECM’s across Khyber Pakhtunkhwa, with the red border demarcating the border between the Federally

17
Administered Tribal Areas (FATA), and Khyber Pakhtunkhwa. This was intended to be used as an indicator of where to focus the targeting of school training in consistent with regions of lower safety confidence. There were consistent patterns where higher rates of training and existing school safety plans were equal to higher ECMs, however these results were only general correlations and could not be called significant. To replicate this study moving forwards, there must be a more specific question that generates a measurement of safety confidence, such as ‘considering your least prepared for emergency is x, how prepared for x are you between 1 and 5? This will provide a measure of safety confidence most relevant to each school’s vulnerabilities and will be therefore a better measure of safety confidence and will allow assistance to be a more targeted and effective intervention.
The ECM plotted by color in the above graph is difficult to associate to a pattern as the range of the ECM variable is very small, however this relationship is more easily examined in the below graph when trying to identify the impact that school safety plans have on Emergency preparedness. While the above graph does not show a great level of significance per each tehsil, with scores taken as an average, the graph below highlights the relationship trend that safety plans have on Emergency Confidence, by measuring raw scores of emergency confidence and their SSplan status.
In the above graph bin width represents score frequency, as it is displayed above the raw scores for ECM are normally distributed. The above data shows consistent trends in the relationship between school safety plans, and the effects on the ECM of a tehsil. Training rates were also found to be effectual in retaining school safety plans. A preliminary inspection of the data found that the higher the rates of school safety received by the school focal point the higher the retention of school safety plans, the data shows a significant correlation between training rates and prepared school safety plans.
Figure 7 School Safety Plans and Emergency Confidence Means
Figure 6 Rates of School safety plans on Emergency Confidence Means (ECM)

18
Figure 8 Effect of Training rates on teaching School safety plans

19
Armed attack
Overall the emergency type that schools feel they are least prepared for is an armed attack. Armed attacks are an important emergency to be prepared for as Khyber Pakhtunkhwa has witnessed some horrific attacks within schools, such as the Peshawar school massacre in 2014 and the Bacha Khan University attack in 2015. However, to truly understand how to better assist schools who feel vulnerable to these attacks we must understand the impact of what counter measures such as training and emergency preparation have on safety confidence.
Khyber Pakhtunkhwa’s proximity to Pakistan’s Federally Administered Tribal Areas (FATA), make it especially vulnerable to armed attacks. It was hypothesized that schools, in tehsils which border FATA, would have a higher rate of concern surrounding preparedness for armed attacks. However, it was found that there was a small, non-significant trend in confidence for FATA bordering tehsils. As such the result shows there is no difference in safety confidence between FATA bordering and non FATA bordering tehsils.
School safety plans and school safety training have been found to decrease concern regarding armed attack. The below graph shows attack concern rates and the relationship that school safety plans have for tehsils that border FATA compared to tehsils which do not. The linear regression model for FATA bordering tehsils shows that there is a moderate significant relationship for schools that have safety plans and lower rates of concern surrounding armed attack. There is a small trend for non FATA-bordering tehsils however this relationship is not significant with the grey region indicating an 80% confidence interval. Training rates have also been shown to have a positive impact on school safety confidence, as school training rates were positively correlated with higher ECMs (r= 0.20).
It was also found that there were consistent trends between school safety training rates and higher ECM scores. In tehsils with higher rates of school safety training their reported emergency confidence means were also higher, this was consistent in FATA bordering and non-FATA bordering tehsils, also rejecting the hypothesis that FATA bordering tehsils would show less confidence in armed attack emergency preparedness.
Figure 9 Effect of School safety plans on Attack concern rates in FATA bordering and non FATA bordering Tehsils

20
Flooding
KP was the most comprehensively affected province of the 2010 flood that occurred in late July which originated at the Indus River basin. This was the worst flooding experienced by Pakistan in the nation’s history. 274 millimeters (10.8 in) of rain fell in Peshawar during 24 hours9. Out of the 70 tehsils in KP only 12 were not flood affected between 2005 and 2015. Due to the high rate of flooding, it has left many KP regions with a flood prone status. It was found that tehsils with a flood prone status had higher levels of concern surrounding their preparedness for flooding.
Figure 11 Concern rates for flood preparedness in flood affected and non-flood affected Tehsils
Precautionary measures for flooding have been in school standard operating procedures under mandatory implementation from the KP department of education. It has also been found that school safety plans reduce the concern rates regarding flooding. A linear regression was conducted between rates of school safety plans and the rates of concern surrounding
9 "UN starts relief works in flood hit provinces". Dawn. 30 July 2010. Archived from the original on 3 August 2010.
Figure 10 Training rates on ECM in FATA bodering and non FATA bordering Tehsils

21
flood preparedness in schools who nominated that flooding was a concern.10 The below correlation shows that in tehsils which have higher rates of school safety plans, have lower levels of concern surrounding flooding preparedness.
Figure 12 School safety plans and flood concern rates
Earthquakes
As a result of the historically active earthquakes across the Asiatic tectonic plate the impacts of earthquakes are a frequent and devastating disaster that affects KP schools. As such earthquake concern is significant amongst the KP school focal points targeted in the RapidPro results. Regions that are prone to earthquakes are significantly higher in concern in their preparedness to respond to an earthquake disaster. Furthermore, Khyber Pakhtunkhwa as a whole is more frequently concerned about earthquakes as reported overall by school focal points. Earthquake affected regions have a higher mean earthquake concern rate than floods. (i.e a higher percentage of schools reported that earthquakes are the disaster they are least prepared for, when compared with flooding affected schools.)
Mean earthquake concern (earthquake affected tehsils)
Mean flood concern (flood affected tehsils)
19.08696 12.4058
Figure 13 Average overall levels of flood concern and earthquake concern
10 Tehsils which did not nominate flooding within their sample at least once were omitted as outliers. Only tehsils which considered flooding a safety concern were included.

22
Figure 14 Earthquake concern in earthquake affected and non-earthquake affected Tehsils

23
Figure 15 - Emergency Confidence Mean (ECM) results found no significant difference in FATA bordering Tehsils.

24
Figure 16 Flood affected regions and concern surrounding flood preparedness
ounding

25
Figure 17 Earthquake heat map

26
Section 4: Conclusion
General emergency preparedness
Apart from armed attack emergencies it was found that ‘All emergencies were reported as least prepared for. This is indicative that amongst KP school’s general concerns about emergency preparedness are common. Supporting this, the least prevalent response was ‘none’ indicating that concerns rates of focal points who nominated ‘All’ contained at concerns about emergency preparedness rather than none. Based on these results It can be concluded then that the need for school trainings and school safety plans are a desired resource by schools in Khyber Pakhtunkhwa. While the emergency confidence mean showed consistent trends it lacked significance when correlated with other metrics. In future studies this metric should be more targeted to specific emergency deficits. E.g. Considering that you are least prepared for floods – between 1 and 5, how prepared are you in the event of a flood?
Armed
Before the outset of the baseline survey, it was hypothesized that FATA bordering Tehsils would have lower confidence in school safety and higher rates of concern surrounding armed attack preparedness. It was found that the most frequently reported type by all KP Tehsils regardless of region was “Armed attack” emergencies, however this was across all regions and not significantly different in FATA bordering Tehsils. This was reflected in the concern rates (ECM) across Khyber Pakhtunkhwa where no trend was found between FATA bordering and non FATA bordering Tehsils for emergency concern means. However, it was found that there was an increased effect of safety plans on concern rates for armed attacks in FATA bordering Tehsils, compared to non FATA bordering tehsils where there was no correlation. As armed attack is the most common concern of all schools, it can be included into the necessary requirements for targeted training within schools in the future
Flooding
Considering that flooding poses a major risk for schools in Khyber Pakhtunkhwa, it was hypothesized that regions affected by flooding will have higher concern surrounding flood preparedness than regions which have not been affected by flooding. This was found to be true with significantly distinct differences in flood affected and non-flood affected regions as per figure 8 - Flood affected regions and concern surrounding flood preparedness. Both flood affected regions and non-flood affected regions see a decrease in concern rates when there is an increase of training rates and safety plans. This is also true when measuring concern in earthquake affected and non-earthquake affected Tehsils. Previously affected areas are significantly less confident in their preparedness compared to non-affected areas.
Earthquakes
Before the outset of the survey, it was hypothesized that earthquake concern would resemble that of flooding in regards to regions which are earthquake prone compared to those that are not. It was found that there was significantly more concern in regards to earthquake preparedness than flooding preparedness overall, and that if a school has previously been affected by earthquakes it is significantly more likely to have concerns with its preparedness for future earthquakes. Despite having training rates not significantly different than those of non-earthquake affected schools, priority should be given to these regions to alleviate concern and increase confidence. Overall concern surrounding earthquakes is more frequent and at concern rates at higher levels than floods.
Medical concerns and Other concerns
There were no significant levels of concern for other emergencies measured by the question “What other emergency are you most concerned about”. There were a significant number of medical concerns however these were no correlated to School safety plans or training rates in Tehsils.

27
References
Akhtar, Shamshad. "The South Asiatic monsoon and flood hazards in the Indus river basin, Pakistan." Journal of Basic & Applied Sciences 7, no. 2 (2011). Fact sheet - Pakistan Humanitarian Pool Fund (PHPF) Pakistan, United Nations Office for the Coordination of Humanitarian Affairs. https://www.humanitarianresponse.info/en/system/files/documents/files/phpf_fact_sheet_august_2016.pdf Food and Agricultural Organisation, United Nations & Aquastat. “The Indus river basin”. http://www.fao.org/nr/water/aquastat/basins/indus/indus-CP_eng.pdf (2011) Gender & child cell, national disaster management authority NDMA, Consolidated Report. Child center DRR & comprehensive school safety training-pakistan. (2014). Militant siege of Peshawar school ends, 141 killed. Dawn. Updated DEC 16, 2014 10:44PM http://www.dawn.com/news/1151203 Pakistan: Districts effected by major emergencies 2005-2015. Mapdoc Pak766_v11 The South Asia Terrorism Portal – Khyber Pakhtunkhwa Timeline 2016. http://www.satp.org/satporgtp/countries/pakistan/nwfp/timeline/index.html accessed 05/09/2016 Tehsils which did not nominate flooding within their sample at least once were omitted as outliers. Only tehsils which considered flooding a safety concern were included. UN starts relief works in flood hit provinces. Dawn. 30 July 2010. Archived from the original on 3 August 2010.

28
Annexure
Table 4 RapidPro Safety in Schools Baseline Survey
English Urdu
You have been identified as a school leader in Khyber Pakhtunkhwa, this is a voluntary school safety survey from the Department of Education and UNICEF. Please respond to all questions accurately. All SMS are FREE. Please select: A) English B) Urdu?
کے طور پر پہچانے یڈرل اسکول یکا یںپختونخواہ م یبرآپ خسروے آپ یہصورتحال پر یحفاظت ی۔ اسکولوں کیںگئے ہ
یاگ یجاطرف سے بھ یک یونیسیفڈپارٹمنٹ اور یجوکیشنکو ا۔ زبان کا انتخاب یںہے۔ تمام سواالت کے درست جوابات د
۔دیں جواب کر لکھ2 یا 1 مہربانی برائے. یںکرEnglish (1
اردو2)
Has your school received Safety Training in the last 2 years? A) Yes B) No C) Unsure
یا تربیت حفاظتی میں سال دو پچھلے کو اسکول کے آپ کیا ہے؟ گئی دی ٹریننگ
(A Han (B Nahi (C Pata Nahi
Thank you. What Tehsil is your school in? Please reply in English script
انگریزی مہربانی برائے ہے؟ میں تحصیل کس اسکول کا آپ Peshawarپر طور کے مثال۔ دیں جواب میں زبان
Sorry we could not identify your Khyber Pakhtunkhwa Tehsil, please enter it again in English script.
پہچان تحصیل کی آپ میں پختونخواہ خیبر ہم کیجیے، معاف زبان انگریزی دوبارہ تحصیل اپنی بانیمہر برائے۔ پائے نہیں ۔بھیجیں کر لکھ میں
Is your Tehsil… ہے؟ ..…… تحصیل کی آپ کیا Do teachers at your school teach children what to do during an emergency such as floods, earthquakes, attacks or medical emergencies? A) Yes B) No
کہ ہیں سکھاتے یہ کو بچوں استاد، میں اسکول کے آپ کیا ہنگامی طبی یا حملہ زلزلہ، سیالب، کہ جیسا حاالت ہنگامی
چاہیے؟ کرنا کیا میں صورتحال(A Han (B Nahi
Please answer A) Yes or B) No مہربانی برائے A)Hanیا B)Nahi۔دیں جواب کر لکھ We did not understand that. Please enter A) Yes or B) No
برائے ۔ہوا نہیں موصول میں انداز درست جواب کا آپ ہمیں ۔دیں جواب کر لکھB)Nahi یاA)Han مہربانی
How often are children taught what to do during an emergency? A) Every week B) Every Month C) Every Semester D) Every Year
ہنگامی کو بچوں میں اسکول کے آپ بعد کے وقت کتنے ہے؟ جاتی دی تربیت کی اقدام والے جانے اٹھائے میں حاالت
Har Hafte (A Har Maheene (B
Har 6 Maah Baad (C Har Saal (D
Does your school need help with a school safety plan? A) Yes B) No
کی مدد ںمی دینے تشکیل تدابیر حفاظتی کو اسکول کے آپ کیا ہے؟ ضرورت
(A Han (B Nahi
Between 1 and 5, how well prepared do you feel your school in the event of an emergency? 5 Completely prepared 4 Very well prepared 3 Neither prepared nor unprepared 2 Poorly prepared 1 Not prepared for an emergency
قدر کس لیے کے کرنے سامنہ کا حاالت ہنگامی اسکول اک آپ .دیں جواب کر لکھ 5 یا 1 ,2 ,3 ,4 ہے؟ تیار پر طور مکمل5. طرح اچھی بہت4. پر سطح درمیانی3. پر طور بخش تسلی غیر2. نہیں تیار بھی بلکل1.
Please respond with 1 2 3 4 or 5 where 1 is not prepared and 5 is completely prepared
5 جہاں دیں جواب کر لکھ 5 یا 1, 2, 3, 4 مہربانی برائے بلکل ہے مطلب کا 1 اور تیار پر طور مکمل ہے مطلب کا
۔نہیں تیار بھیWhat type of emergency you are least prepared for? a) armed attack
تیار کم سے سب آپ لیے کے حاالت ہنگامی کے قسم کس .دیں جواب کر لکھ 5 یا 1 ,2 ,3 ,4 ہیں؟

29
b) flood c) earthquake d) medical e) all of the above f) other
حملہ مصلح1. سیالب2. زلزلہ3. صورتحال طبی4. حاالت سب والے اوپر5.
حاالت اور کوئیWhat makes your school so prepared for an emergency? (answer in 1 sentence only)
اقدام کونسے اسکول کا آپ کہ بتائیں میں جملے ایک صرف ہیں؟ تیار لیے کے حاالت ینگامی پر دارومدار کے
What other emergency are you not prepared for? کے کرنے سامنہ کا جن ہیں حاالت ہنگامی سے کون کون اور ہے؟ نہیں تیار اسکول کا آپ لیے

30
Table 5 Data Collected From RapidPro Safety in Schools Baseline Survey
Tehsil ssplan fa ea ecm tr fata flc eac atc medc
Abbottabad 52.94118 Yes No 2.97561 35.62 No 7.894737 31.57895 21.05263 13.15789
Adenzai 60.71429 Yes Yes 3.115385 31.03 No 6.25 6.25 50 12.5
Allai 73.77049 Yes No 2.783333 24.62 No 10.34483 13.7931 29.31034 6.896552
Alpuri 70.58824 Yes No 3 57.89 No 14.28571 0 42.85714 14.28571
Babuzai?Swat 100 No Yes 3.136364 56.52 No 0 20 40 16.66667
Balakot 58.82353 Yes No 3.0625 37.93 No 0 33.33333 13.33333 NA
Banda Daud Shah 100 No No 3 Yes 11.11111 22.22222 11.11111 6.25
Bannu 51.6129 Yes No 3.246377 29.47 Yes 14.0625 10.9375 39.0625 7.8125
Barikot 75 No Yes 3.25 50 No 5 28.57143 14.28571 NA
Batagram?(Banna) 53.33333 Yes No 2.95082 29.73 No 3.508772 15.78947 42.10526 7.017544
Behrain 62.5 No Yes 2.857143 25 No 3.5 20 60 14.28571
Charbagh 100 No Yes 3.6 55.56 No 3 12.5 18.75 NA
Charsadda 40 Yes No 3.081081 23.08 No 8.823529 8.823529 38.23529 NA
Chitral 78.94737 Yes Yes 3.517241 42.22 No 25 12.5 25 10.81081
Daggar?Buner 84.74576 Yes Yes 2.985075 54.29 No 9.433962 15.09434 28.30189 10.71429
Daraban 60 Yes No 2.666667 42.86 Yes 0 0 100 NA
Dassu 71.42857 Yes Yes 3.25 60 No 0 50 0 NA
Dera Ismail Khan 50 Yes No 3.75 12.5 No NA NA NA 33.3333
Dir 69.76744 Yes Yes 2.878049 28.81 No 8.163265 22.44898 38.77551 7.317073
Domel 100 Yes No 2.5 25 Yes 0 0 0 NA
Gagra 70.68966 Yes Yes 2.491228 45.31 No 0 37.5 33.33333 5.454545
Ghazi 63.63636 Yes No 3.363636 31.82 No 0 9.090909 36.36364 NA
Hangu 42.85714 Yes No 2.928571 38.1 Yes 14.28571 7.142857 35.71429 7.142857
Haripur 66.66667 Yes No 3.395349 37.93 No 12.5 7.5 22.5 7.317073
Havelian 76.31579 Yes No 2.942857 34.78 No 9.677419 16.12903 25.80645 9.375
Jahangira 80 Yes No 3.6 50 No 20 20 40 NA
Kabal 100 No Yes 3.1875 55 No 0 9.090909 63.63636 6.25
Kandia 0 Yes Yes NA 33.33 No 0 0 0 NA
Karak 44.44444 No No 3 45.45 Yes 0 0 33.33333 NA
Katlang 20 Yes No 2.6 14.29 No 0 33.33333 0 NA
Khadokhail 82.14286 Yes Yes 3.035714 67.86 No 8 12 40 8

31
Khwaza Khela 80 No Yes 2.5 27.27 No 0 0 66.66667 NA
Kohat 64.28571 Yes No 3.131579 49.35 Yes 14.28571 14.28571 28.57143 11.11
Kulachi 60 Yes No 3.5 25 Yes 0 33.33333 0 33.33
Lachi 87.5 Yes No 2.714286 37.5 No 11.47541 14.7541 52.45902 14.28571
Lahor 64 Yes No 2.2 20.69 No 0 0 46.66667 22.22222
Lakki Marwat 66.66667 Yes No 3.226131 31.62 Yes 10.69519 12.29947 33.15508 9.574468
Lal Qila 85.71429 Yes Yes 3.263158 54.17 No 4.347826 30.43478 34.78261 16.66667
Mandar 75 Yes Yes 3.1 63.04 No 11.53846 23.07692 42.30769 17.24138
Mansehra 60 Yes No 2.786885 37.04 No 8.77193 17.54386 36.84211 10.52632
Mardan 60 Yes No 3.225806 42.37 No 7.407407 18.51852 40.74074 24.4898
Mastuj 71.42857 Yes Yes 2.714286 16.67 No 0 18.18182 27.27273 NA
Matta Shamzai 100 No Yes NA NA No NA NA NA NA
Naurang 90 Yes No 3.25974 23.33 No 5.405405 9.459459 32.43243 12.16216
Nowshera 72.72727 Yes No 3.259259 31.43 No 13.63636 13.63636 27.27273 12.5
Oghi 69.23077 Yes No 3.32 23.53 No 9.090909 22.72727 31.81818 4.545455
Pabbi 60 Yes No 2.733333 22.73 Yes 20 20 26.66667 6.666667
Paharpur 72.72727 Yes No 3.1 38.46 No 11.11111 22.22222 22.22222 11.6
Palas 87.5 Yes Yes 3.285714 21.05 No 14.28571 14.28571 14.28571 28.57143
Paroa 46.66667 Yes No 2.692308 61.11 No 25 16.66667 16.66667 8.333333
Pattan 92.85714 Yes Yes 3.214286 75 No 0 21.42857 42.85714 7.142857
Peshawar 60.86957 Yes Yes 3.104478 20.83 Yes 8.77193 14.03509 38.59649 NA
Puran 83.33333 Yes No 2.75 50 No 8.333333 8.333333 41.66667 25
Razar 61.90476 Yes No 3.055556 23.33 No 0 6.25 25 16.66667
Sam Ranizai 100 Yes Yes 3.111111 50 No 9.090909 27.27273 27.27273 14.28571
Samarbagh?(Barwa) 0 Yes Yes NA NA No NA NA NA NA
Shabqadar 54.54545 Yes No 2.625 25 No 57.14286 0 28.57143 NA
Sharingal 72.72727 Yes Yes 3.166667 25 No 0 14.28571 28.57143 33.33333
Swabi 60 Yes No 2.774194 29.09 No 11.11111 7.407407 25.92593 3.571429
Swat Ranizai 100 Yes Yes 3.285714 66.67 No 15.38462 38.46154 15.38462 NA
Takht Bhai 100 Yes No 3.21875 50 No 0 0 0 22.22222
Takht-E-Nasrati 50 No No 3 41.67 No 0 18.18182 39.39394 16.66667
Tall 69.23077 Yes No 3.230769 36.84 Yes 8 4 44 8.333333
Tangi 71.42857 Yes No 3.5 30.43 No 11.11111 11.11111 11.11111 NA

32
Tank 50 Yes No 3.6 41.18 Yes 0 0 12.5 12.5
Temergara 69.23077 Yes Yes 3.333333 41.38 No 14.28571 42.85714 28.57143 4.347826
Topi 71.42857 Yes No 2.833333 11.11 No 0 0 20 20
Tor Ghar?(F.R. Kala Dhaka)
71.42857 No Yes 2.583333 42.86 No 10 20 20 NA
Wari 58.33333 Yes Yes 2.903226 33.33 No 31.57895 0 26.31579 10

33
Item 3
Protocol for RapidPro applications within programmes
This is a guide to formulating a strategy based on the initial factors which need addressing before SMS application RapidPro can be applied to programmatic functions. The following points must be considered prior to planning and implementation:
1. Identifying the central question
2. Develop a Timeline
3. Technical development
4. Survey Development
5. Testing
6. Communications Delivery
7. Delivery Monitoring
Identifying the central question:
What is it that we want our survey to discover? The question should be able to be put into a single sentence such as: “We wish to determine the use and access of men and women for WASH services in Sindh.” “We want to measure the satisfaction of beneficiaries in Punjab regarding their school safety”.
Determine the central questions you want answered by beneficiaries
What is the satisfaction of ‘x’?
How is your access to ‘x’?
How often do you ‘x’?
You must also carefully consider which comparisons you want to make later in the data analysis.
Male vs Female (is there a difference between gender for our measurement?)
District/ provincial (is there a difference between geographical locations for our measurement?)
Age (is there a difference between life stages for our measurement?)
Literacy (will illiterate beneficiaries have different access/behaviours/habits?)
If these comparisons are relevant to your analysis, there must be registration questions included in your survey. However, any surplus questions should be omitted as the longer any survey is the higher the dropout rate before the survey has been completed. Any survey should not be longer than 7 questions including registration and follow up.
Develop a timeline of implementation.
When is your survey delivered?
What communications material need to be in place beforehand?
If you are working with an IP, are they aware of critical dates?
These must be highlighted before any implementation begins including the date you expect to release communications materials or the RapidPro survey.
Technical development
First determine how the beneficiaries will be contacted by RapidPro (2 options)
a. Users register by texting the shortcode from their handsets
If the users must register themselves, the shortcode delivery to the beneficiary becomes the priority. This aim becomes reaching beneficiaries who are within the scope of the survey and not informing those outside of the scope.
34
b. Phone numbers are entered into the system by UNICEF staff i. Where will the numbers come from?
This requires contact with an agent who has the phone numbers, formatting, and software delivery. This method, as it is not voluntary requires consent to be secured with an opt-out function. i.e. “this is a voluntary survey that you do not need to complete”
ii. Will you contact the beneficiaries in advance telling them about the SMS?
This requires an organization that has communication access to target groups. It can be done via letters, billboards, and posters or through communication agencies such as Imams at local Madrassas, schools, workplaces etc.
Question development
There should be a maximum of 7 SMS questions total. This includes registration and follow up questions. The technical team who specializes in the programme section should be responsible for question development as it requires in depth technical knowledge about the programme topic. This can be then given to the innovations coordinator for system entry.
Testing
c. Translation
Initially, the survey is likely to be developed in English as it is a common language between the technical officers i.e. WASH specialists and the innovations section. Later according to the region, specific translations are to be entered into the RapidPro system by a native speaker of the relevant language.
d. Field testing
Prior to implementation it can be beneficial to conduct a pre-test of survey questions and concepts in an information session/FGD. This requires finding an IP that has an established ground presence and access to a population of willing participants.
Adaptations and changes can be made during and after – this is also a useful tool for advocacy of the RapidPro system.
e. Technical testing
All users of the system should run through the survey on their phones and record any errors/ final adaptations to be made before delivery.
Checklist
Before the first SMS is sent/received by a beneficiary, you should have the following finalized:
Launch date(s) finalized
RapidPro questions completed/translated
Number of products disseminated, finalized
Communications materials sent with “FREE SMS” included on the product
Shortcode in place and target group(s) informed of its purpose.
FGD’s conducted with language/questions tested.
Survey thoroughly tested on RapidPro with handsets.
All completed before Launch date.