essential service commission
TRANSCRIPT

Essential Service Commission Port of Melbourne Five-Year Compliance Enquiry
Public Submission by Victoria International Container Terminal Limited
September 2021

Contents VICT Concession Terminal Design ........................................................................................... 3
Table 1.1 – World’s largest vessels compared to the largest vessel calling PoM .... 3
Image 1.1 – The “Knuckle” ............................................................................................... 4
Shipping Services and Delays ................................................................................................. 4
Image 1.2 – VICT’s berth length design with two 300m LOA vessels compared with current vessels calling at the PoM at 336 meter LOA ......................................... 5
Global Market and Vessel Trends ........................................................................................... 6
Table 1.2 – Market trend and forecast for larger vessels calling at the PoM .......... 6
Table 1.3 – Current Vessel Orderbook ............................................................................ 7
Table 1.4 – Current vessel order book ............................................................................ 7
Current Market Capacity ......................................................................................................... 8
Table 1.5 – Current volume and capacity within the PoM ......................................... 9
Image 1.3 – Proposed design showing two large vessels berthing simultaneously ............................................................................................................................................. 10
Table 1.6 - Current Victorian Terminal Designs ............................................................ 10
Table 1.7 - Upgraded Terminal Designs after VICT removes the “knuckle” ........... 11
Competition ............................................................................................................................. 11
Table 1.8 – Australian Competition and Consumer Commission Stevedoring Monitoring Report 2019/20 ............................................................................................. 12
Table 1.9 – Revenue based on yearly CPI ................................................................... 12
Swanson Dock Investments and On-Dock Rail .................................................................. 12
Image 1.4 – Swanson Dock On-Rail Connection ....................................................... 14
Image 1.5 – The Port Rail Shuttle Network.................................................................... 15
VICT Concession Terminal Design
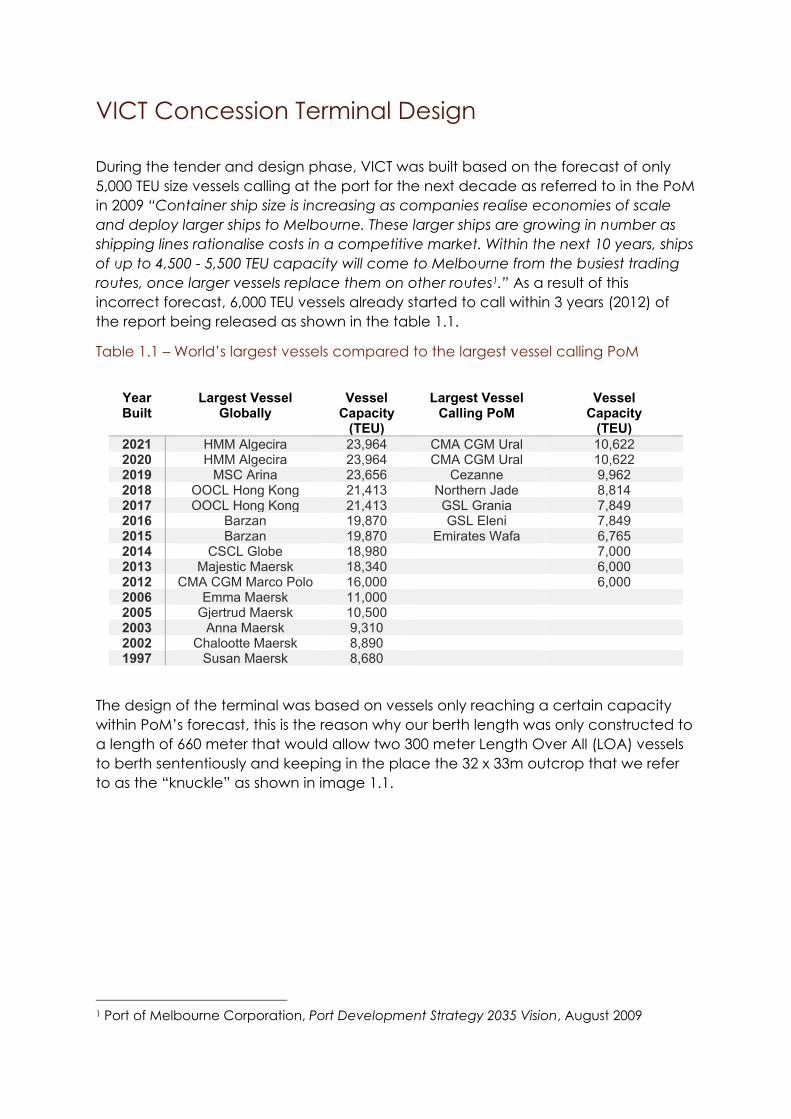
During the tender and design phase, VICT was built based on the forecast of only 5,000 TEU size vessels calling at the port for the next decade as referred to in the PoM in 2009 “Container ship size is increasing as companies realise economies of scale and deploy larger ships to Melbourne. These larger ships are growing in number as shipping lines rationalise costs in a competitive market. Within the next 10 years, ships of up to 4,500 - 5,500 TEU capacity will come to Melbourne from the busiest trading routes, once larger vessels replace them on other routes1.” As a result of this incorrect forecast, 6,000 TEU vessels already started to call within 3 years (2012) of the report being released as shown in the table 1.1.
Table 1.1 – World’s largest vessels compared to the largest vessel calling PoM
Year Built
Largest Vessel Globally
Vessel Capacity
(TEU)
Largest Vessel Calling PoM
Vessel Capacity
(TEU) 2021 HMM Algecira 23,964 CMA CGM Ural 10,622 2020 HMM Algecira 23,964 CMA CGM Ural 10,622 2019 MSC Arina 23,656 Cezanne 9,962 2018 OOCL Hong Kong 21,413 Northern Jade 8,814 2017 OOCL Hong Kong 21,413 GSL Grania 7,849 2016 Barzan 19,870 GSL Eleni 7,849 2015 Barzan 19,870 Emirates Wafa 6,765 2014 CSCL Globe 18,980 7,000 2013 Majestic Maersk 18,340 6,000 2012 CMA CGM Marco Polo 16,000 6,000 2006 Emma Maersk 11,000 2005 Gjertrud Maersk 10,500 2003 Anna Maersk 9,310 2002 Chalootte Maersk 8,890 1997 Susan Maersk 8,680
The design of the terminal was based on vessels only reaching a certain capacity within PoM’s forecast, this is the reason why our berth length was only constructed to a length of 660 meter that would allow two 300 meter Length Over All (LOA) vessels to berth sententiously and keeping in the place the 32 x 33m outcrop that we refer to as the “knuckle” as shown in image 1.1.
1 Port of Melbourne Corporation, Port Development Strategy 2035 Vision, August 2009

Image 1.1 – The “Knuckle”
Shipping Services and Delays
Within 2 years of VICT commencing operations (2018) the PoM already started to experience an increase in vessel sizes calling at the port with the first 8,000 plus TEU size vessels (323 to 336 meter LOA) on the A3 Central service calling all major east coast ports (August 2018) and VICT in Melbourne 2as this was the only terminal that can accept these sizes of vessels. Swanson Dock was limited to vessels of 325 meter LOA.
Since the A3 Central service deployed larger vessels, a further 3 services are currently operating vessels within this range:
1. A3 Central (A3C) deploying 8,063 – 8,888 TEU size vessels 2. Australia Asia Express Loop 1 (AAX) deploying 8,073 – 10,622 TEU size
vessels 3. North Europe – Med Sea – Oceania (NEMO) deploying 8,328 – 9,580 TEU
size vessels 4. Australia North-East Asia Service (AUN) deploying 5,570 – 8,400 TEU size
vessels
Three out of the four services call at VICT and as the vessels exceed the design length of 300 meter LOA, it technically turns VICT into a one berth terminal resulting
2 Nine News, Port Melbourne Welcomes Biggest Freight Ship in its History (https://www.9news.com.au/national/biggest-freight-ship-port-melbourne-victoria-oocl-seoul-port-phillip-bay-arrive/baf677f8-d57f-4f22-92bc-e226c18e78bf), August 2018

in our capacity being limited. On top of the capacity constraints, there are immediate delays as we simply run out of quay length as shown in image 1.1 regardless of how many additional cranes we add as physically we can’t berth two vessels simultaneously.
Image 1.2 – VICT’s berth length design with two 300m LOA vessels compared with current vessels calling at the PoM at 336 meter LOA
Unutilised area that VICT are paying lease for and will not be developed until the “knuckle” is removed.

Global Market and Vessel Trends
The global trend of larger vessels shifting trades is a common occurrence, the largest vessels currently being built in the vicinity of the 24,000 TEU are always deployed for the largest service, the Asia to Europe trades that has significant volume to meet the large population in Europe. The vessels previously deployed on the Asia to Europe services then cascade to other trade lanes like the Asia to United States that started to see 16,000 TEU size vessels enter the East Coast market3 which was previously restricted but have made significant investment to allow for larger vessels.
While Australia represents a smaller market, we have also seen growth within the last 5 years of 35% in the largest vessel capacity and have now serviced vessels reaching 10,622 TEU (CMA CGM Ural on the AAX1 service) and vessel LOA of 346.98 meter (Soroe Maersk). While the increase is significant, it is capped as the ports do have limitation and if these restrictions were eased the jump in vessel capacity would have been much faster and higher than 35%.
Keeping in line with past trends, the upward trajectory for larger vessels in the 8,000 plus range will increase and will be adjusted based on the largest vessels that can enter the PoM, based on simulations conducted the limitation through the heads (without investment) should be 366 meter4 LOA vessels equalling 16,000 TEU.
Table 1.2 – Market trend and forecast for larger vessels calling at the PoM
Vessels will continue to be built especially with larger capacity (currently new build vessel Ever Reach will hit 23,992 TEU) to utilise the economies of scale to gain a
3 Business Insider Australia, The largest container ship to ever visit the East Coast just arrived at the Port of New York and New Jersey: Meet the Marco Polo (https://www.businessinsider.com.au/largest-container-ship-visit-east-coast-arrives-new-jersey-port-2021-5?r=US&IR=T), May 2021 4 AECOM, Hydrodynamics Infrastructure Victoria Second Container Port Advice, May 2017
-200
0
200
400
600
800
1000
1200
2017 2018 2019 2020 2021 2022 2023 2024 2025 2026
Num
ber
of v
esse
l Ca
lls
Vessel Capacity (TEU) Forecast
500- 8,000 TEU 8,001 + TEU
Linear (500- 8,000 TEU) Linear (8,001 + TEU)

competitive edge and most importantly reduce carbon emissions per container. This is highlighted with vessels in the 10,000 - 24,000 TEU range representing 84% of new-builds (Table 1.3). Only 5% of these new vessels are in the 4,000 to 7,499 TEU category demonstrating a shrinking requirement for these vessel classes and what was previously predicted as the vessels to be deployed at the PoM.
Table 1.3 – Current Vessel Orderbook5
In addition to the current order book within the first 6 months of 2021, a total of 2.88 million TEU or 11.75% of today’s global vessel capacity has been ordered, a figure that has not been seen since 2008/09 (Table 1.4) and mostly within the larger capacity.
Table 1.4 – Current vessel order book6
5 Alphaliner, Alphaliner Monthly Monitor, July 2021 6 Alphaliner, Alphaliner Weekly Newsletter 2021-28, July 2021

While our competitors argue that there is no need for investment in the larger vessels, if this was the case, we continue to ask why there was such a push from these operators to escalate with PoM and Victoria Ports Corporation (VPC) to fast-track simulations and allow for increased vessels sizes (337 meter LOA and 45.6 meter BEAM) in December 2019. At the same time receiving upgrades to their bollards to withstand increase displacement from these larger vessels up to 140,000 metric tonne (MT) all at the cost to the PoM and yet to be recovered.
Current Market Capacity
The PoM has seen an average growth of around 3% over the last ten years with the most current 2020/21 financial year recording double digit (14.6%) growth compared to the previous financial year.
Utilising the current capacity within the port, Swanson Dock representing 2.8 million TEU and VICT with a usable capacity of 800,000 TEU per annum, currently the volume that’s handled at the port is at 79% of the total capacity. At these levels hovering around the 80% mark demonstrates there is congestion not only evident at VICT but also for other terminals within Melbourne.
During the 3rd and 4th quarter of 2020, there was congestion in Sydney (Port Botany) and as a result, shipping lines implementing the following to counter act the delays:
Port Omissions – Vessels would purposely omit the port due to the significant delays and impact it would have on the vessel schedule. As a result, the import cargo destined for the port that has been omitted will be discharge at a different port and transhipped onto the next vessel. For the export cargo, it will either be loaded and transhipped at another port or it will have to wait for the next vessel on that service to load. This not only adds costs to the shipping lines but also delays the inbound and outbound cargo causing impact to the entire supply chain and market. For the PoM, this not only impacts the Victorian cargo but also the Tasmanian market as Melbourne is utilised as the transhipment hub for most Tasmanian volume.
Congestion Surcharges – When vessels do call ports that are congested, there are significant wait periods for the vessels that result in additional costs for the daily hiring of the vessel, fuel to speed up for schedule recovery and less voyages per year due to the delays.
By not investing in the removal of the “knuckle” and utilising a very modest 1.5% growth in 2021/22 and a slightly higher 2.5% growth for the following years, the PoM will reach 100% utilisation by 2030/31 (Table 1.5). This means that between now and 2031, there is limited capacity within the port and as we’ve seen, when demands start to exceed supply, there will be an immediate increase to pricing that challenges the suggestions that the current investment in Webb Dock will increase costs. In fact, if we don’t invest, that itself will drive up costs as capacity is limited and with a growing market it will be seller’s market.
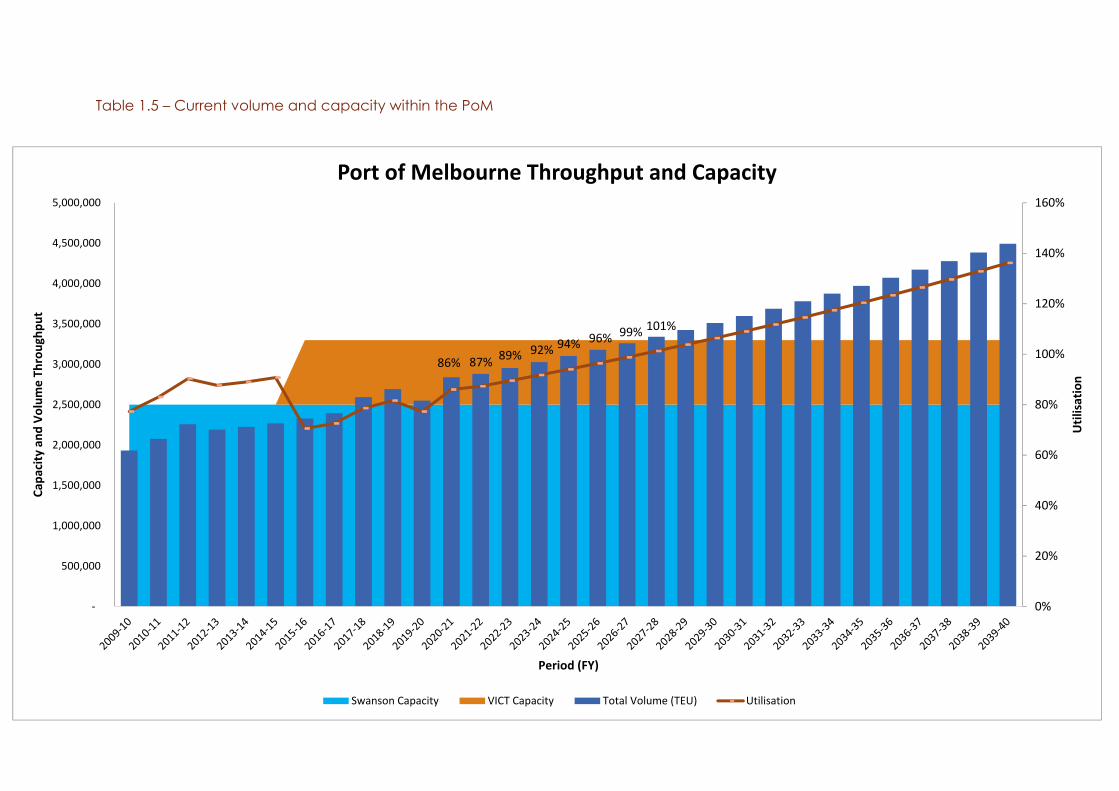
86% 87% 89% 92% 94% 96% 99% 101%
0%
20%
40%
60%
80%
100%
120%
140%
160%
‐
500,000
1,000,000
1,500,000
2,000,000
2,500,000
3,000,000
3,500,000
4,000,000
4,500,000
5,000,000
Utilisation
Capa
city and
Volum
e Th
roughp
ut
Period (FY)
Port of Melbourne Throughput and Capacity
Swanson Capacity VICT Capacity Total Volume (TEU) Utilisation
Table 1.5 – Current volume and capacity within the PoM

VICT’s Webb Dock berth extension consists of removing the “knuckle” to allow for an additional 71m of quay line to berth two large vessels simultaneously (Image 1.3). Currently with the restriction to only berth one large vessel at a time, it has limited VICT’s capacity to 800,000 TEU per annum hence the urgent requirement to unlock capacity.
Image 1.3 – Proposed design showing two large vessels berthing simultaneously
Table 1.6 - Current Victorian Terminal Designs
VICT DPW Patrick Berth Length 660 meters 944 meters 885 meters
Berths for vessels class over 300m
1 2
2
Terminal Space
35ha 49ha 40ha

Table 1.7 - Upgraded Terminal Designs after VICT removes the “knuckle”
VICT DPW Patrick Berth Length 731 meters 944 meters 884 meters
Berths for vessels class over 300m
2 2 2
Terminal Space
35ha 49ha 40ha
As shown in Table 1.7, even with the removal of the “knuckle” and an additional 71m of quay line to resolve the current berthing limitations and unlock capacity as a result of incorrect vessel forecasting, VICT will still have 21 - 29% less berth length than our competitors not to mention the overall footprint of the terminal.
The “knuckle” removal will only add 2% of additional footprint to VICT’s current concession with the PoM and highlights that VICT have and continuing to pay for our leased area that can’t reach its full potential capacity.
Even if the PoM were to proceed with the removal, it will still take a total of 24 months to bring the loss capacity back into the market and with current volumes in the port hitting 25% higher in the first six months comparing to last year, the needed capacity is well overdue.
Competition
The market in the PoM has been very competitive since VICT entered in 2016 and the volume is evenly split between all three operators.
When there were only two operators within the major Australian ports in 2010-11, the overall revenue for stevedores relating to quay and landside was at AUD300.70 per container. Nine years on in 2019, utilising the same metrics it has reduced by 3% to AUD292.10 (Table 1.8)7, quite a significant reduction considering the overall CPI within this period reaching an average of 1.93% per annum and would have reached AUD364 per container (Table 1.9).
A cost saving back to the consumers, this highlights the need for competition within our ports and if the “knuckle” removal doesn’t proceed, VICT would continue to be limited by its capacity and allow for our competitors to increase costs in the market that eventually result in the consumers paying the additional costs.
7 Australian Competition and Consumer Commission, Container Stevedoring Monitoring Report 2019-20, November 2020

Table 1.8 – Australian Competition and Consumer Commission Stevedoring Monitoring Report 2019/20
Table 1.9 – Revenue based on yearly CPI
Year Revenue Yearly
CPI 2010 300.7 2011 310.0 3.10% 2012 316.8 2.20% 2013 325.4 2.70% 2014 330.9 1.70% 2015 336.6 1.70% 2016 341.6 1.50% 2017 348.1 1.90% 2018 354.4 1.80% 2019 360.7 1.80% 2020 364.0 0.90%
VICT supports competition within the PoM allowing the shipping lines to have multiple options within the market and not be restricted to certain terminals due to constraints and lack of investment from the PoM.
Swanson Dock Investments and On-Dock Rail
While there has been protest from Swanson Dock operators in the Webb Dock investment, it goes without saying that there has been significant investment in Swanson Dock over the last three years with costs yet to be recovered by the PoM:
Simulations for larger vessels – vessel simulations were fast tracked as a priority for Swanson dock as another 2 services deployed 8,000 plus TEU in late 2019. In December 2019, PoM immediately advised that trials at Swanson were to

commence increasing the limitations from 323 meter LOA and 42.8 meter BEAM to 337 meter LOA and 45.6 meter BEAM vessels8. 13 months later (January 2021), the trial limitations were removed and allowable vessels further increased to either 337 meter LOA and 45.6 meter BEAM or 316m LOA or 48.2m BEAM9. During the same period, VICT was not allowed to handle any vessel larger than 47 meter LOA and only received approval to increase vessel draft from 13.25 meter to 14 meter.
Upgraded Bollards10 – to assist with the larger vessel trials, the PoM installed new 150MT bollards to increase both terminal displacement capacity from 98,000MT to 140,000MT. An expenditure that the PoM are yet to recover.
In addition to the above investment in Swanson Dock, the PoM and the Victorian Government has committed in January 2020 to invest $125 million to build new on-dock rail. Once completed, the facilities will be handed back to the terminal operators to run and further increase their revenue streams and to fund this, all import containers will be charged an additional $9.75 per TEU regardless of where the container is handled.
The Federal Budget for 2021/22 incorporated a $2 billion-dollar investment in a new Melbourne Intermodal Terminal 11that will strengthen the network to promote rail within Victoria didn’t even include Webb Dock rail connectivity. Further highlighting the disadvantage of being the third entrant into the market and while VICT aim to reduce supply chain costs, congestion, promote competition and investment into the Victorian economy, our competitors are trying to discourage competition within the market by blocking the Webb Dock investment even though they’ve received more than their fair share over the last three years and years to come.
8 Port of Melbourne, Information Update to Shipping Lines, December 2019 9 Port of Melbourne, Information Update to Shipping Lines, January 2021 10 Port of Melbourne, Information Update to Shipping Lines, January 2021 11 Prime Minister of Australia, Media Release Federal Budget Supports Victoria’s Recovery Plan, May 10
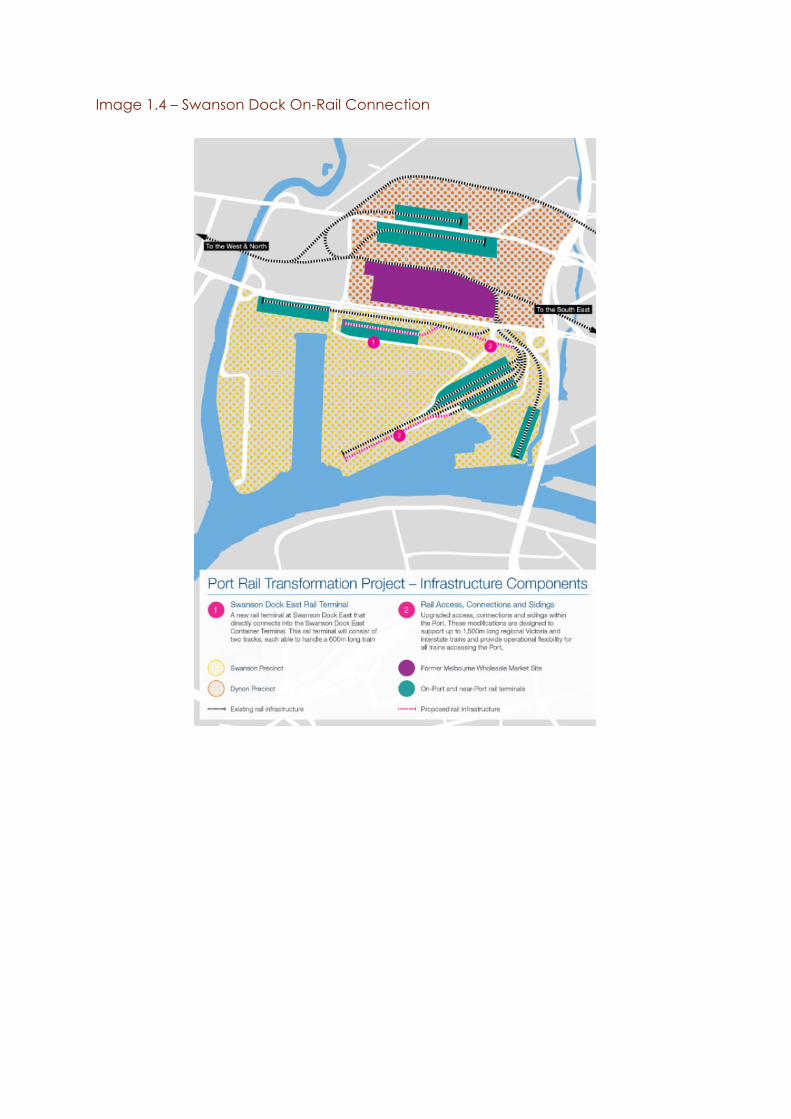
Image 1.4 – Swanson Dock On-Rail Connection

Image 1.5 – The Port Rail Shuttle Network