essential question: what is the shape of a quadratic graph?
TRANSCRIPT

Essential Question: What is the shape of a quadratic graph?

10-1: Exploring Quadratic GraphsQuadratic Function: a function that can be
written in the form y = ax2 + bx + c. This is called the standard form of a quadratic function.Examples: y = 5x2
Examples: y = x2 + 7Examples: y = x2 – x – 3
The simplest quadratic function is y = x2. This is called the quadratic parent function.
The graph of a quadratic function is aU-shaped curve called a parabola.

10-1: Exploring Quadratic GraphsYou can fold a parabola so that the two sides match
exactly. This property is called symmetry. The fold/line that divides the parabola into two equal parts is called the axis of symmetry.
The highest or lowest point on a parabola is called the vertex, which is always on the axis of symmetry.If a > 0 (is positive) in ax2 + bx + c, the parabola
opens up, and the vertex represents the minimum of the graph.
If a < 0 (is negative) in ax2 + bx + c, the parabola opens down, and the vertex represents the maximum of the graph.

10-1: Exploring Quadratic GraphsExample 1: Identifying a Vertex
Identify the vertex of each graph. Tell whether it is a minimum or maximum
The vertex is at (1, -2) The vertex is at (-2,4)It is a minimum It is a maximum
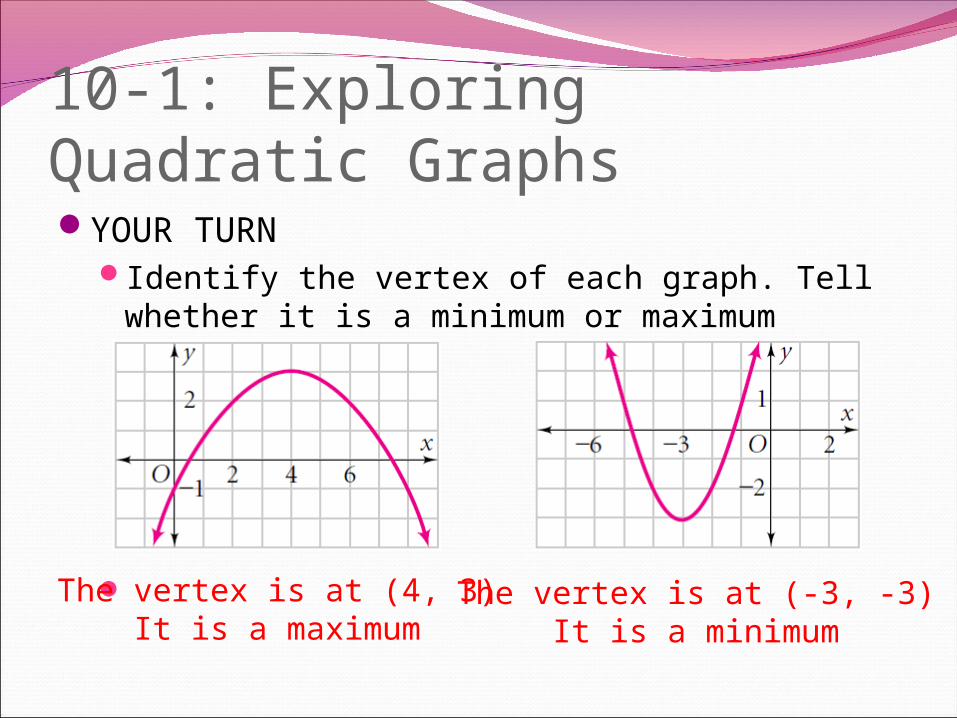
10-1: Exploring Quadratic GraphsYOUR TURN
Identify the vertex of each graph. Tell whether it is a minimum or maximum
The vertex is at (4, 3)It is a maximum
The vertex is at (-3, -3)It is a minimum

10-1: Exploring Quadratic GraphsNo need to copy
You can use the fact that a parabola is symmetric to graph it quickly. First, find the coordinates of the vertex, then a few points on either side of the vertex. Then reflect the points across the axis of symmetry.
For functions in the form y = ax2, the vertex is at the origin
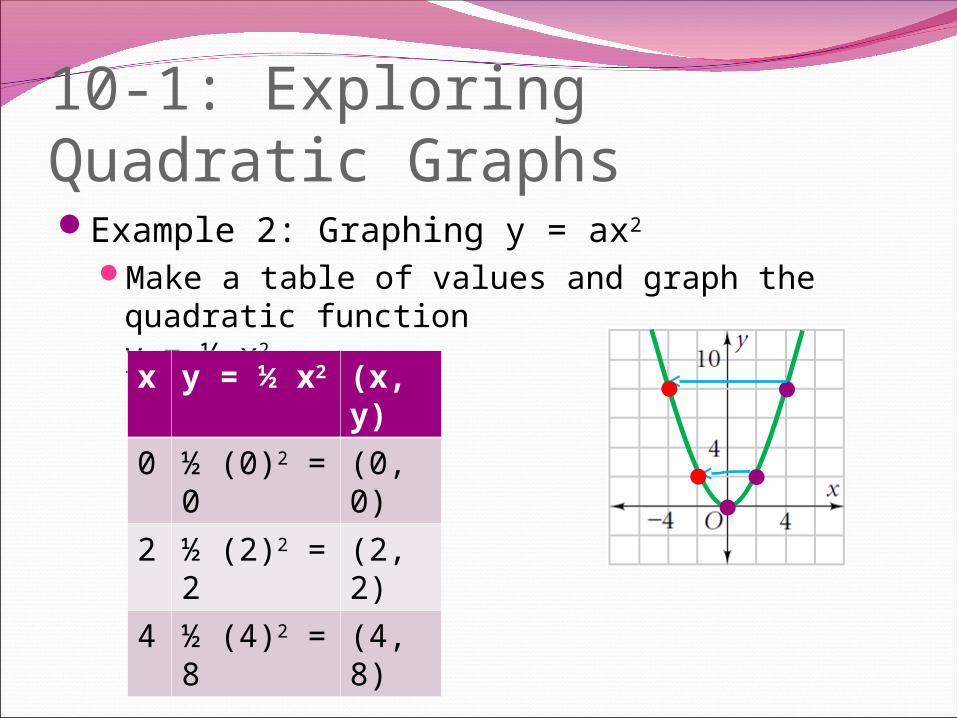
10-1: Exploring Quadratic GraphsExample 2: Graphing y = ax2
Make a table of values and graph the quadratic functiony = ½ x2
x y = ½ x2 (x, y)
0 ½ (0)2 = 0
(0, 0)
2 ½ (2)2 = 2
(2, 2)
4 ½ (4)2 = 8
(4, 8)
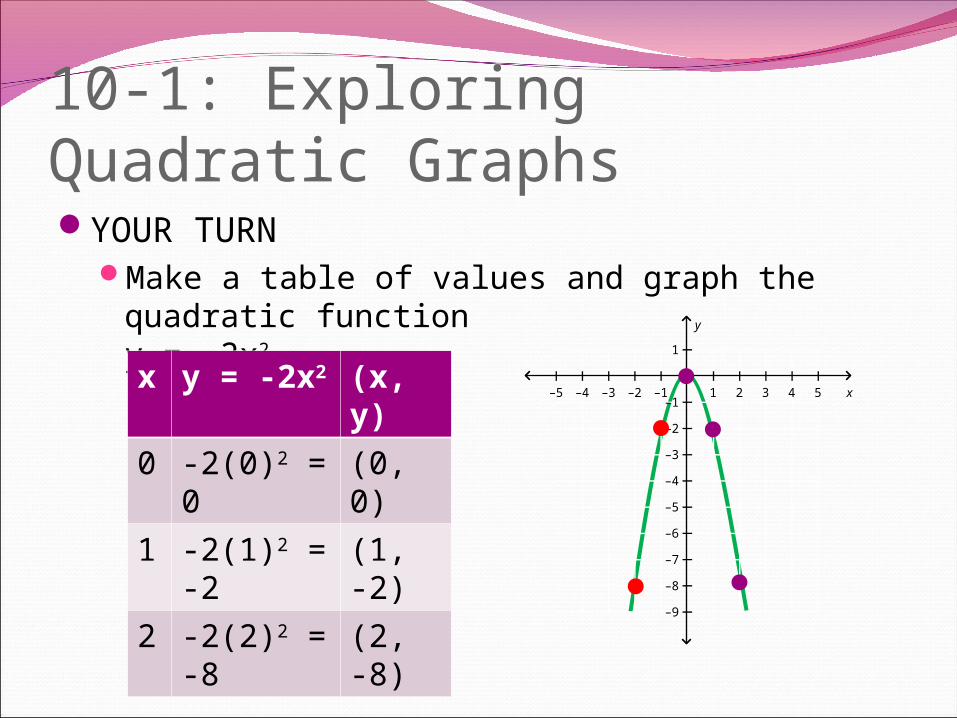
10-1: Exploring Quadratic GraphsYOUR TURN
Make a table of values and graph the quadratic functiony = -2x2
x y = -2x2 (x, y)
0 -2(0)2 = 0
(0, 0)
1 -2(1)2 = -2
(1, -2)
2 -2(2)2 = -8
(2, -8)
1 2 3 4 5–1–2–3–4–5 x
1
–1
–2
–3
–4
–5
–6
–7
–8
–9
y

10-1: Exploring Quadratic GraphsAssignment
Worksheet #10-1Problems 1, 3, 5, 13, 15
Graph each function (don’t follow directions for #1 – 5)
Essential Question: What is the shape of a quadratic graph?

10-1: Exploring Quadratic GraphsThe y-axis is also the axis of symmetry for
functions in the form y = ax2 + c, so like yesterday, start your table of values with x = 0.
Fundamentally, the value of c translates (shifts) the graph up or down.
Example 4: Graph y = 2x2 + 3x y = 2x2 + 3
(x, y)
0 2(0)2 + 3 = 3
(0, 3)
1 2(1)2 + 3 = 5
(1, 5)
2 2(2)2 + 3 = 11
(2, 11)

10-1: Exploring Quadratic GraphsYOUR TURN
Make a table of values and graph the quadratic functiony = x2 – 4x y = x2 – 4 (x, y)
0 (0)2 – 4 = -4
(0, -4)
1 (1)2 – 4 = -3
(1, -3)
2 (2)2 – 4 = 0
(2, 0)
1 2 3 4 5–1–2–3–4–5 x
1
–1
–2
–3
–4
–5
–6
–7
–8
–9
y

10-1: Exploring Quadratic GraphsYou can model the height of an object moving due
to gravity using a quadratic function.As an object falls, its speed continues to increase.
Ignoring air resistance, you can find the approximate height of a falling object using the function
h = -16t2 + cExample 5
Suppose you see an eagle flying over a canyon. The eagle is 30 ft above sea level when it drops a rock. The function y = -16t2 + 30 gives the height of the rock after t seconds.
Graph this quadratic function.

10-1: Exploring Quadratic GraphsExample 5
Suppose you see an eagle flying over a canyon. The eagle is 30 ft above sea level when it drops a rock. The function h = -16t2 + 30 gives the height of the rock after t seconds.
Graph this quadratic function.t h = -16t2 + 30
(t, h)
0 -16(0)2 + 30 = 30
(0, 30)
1 -16(1)2 + 30 = 14
(1, 14)
2 -16(2)2 + 30 = -34
(2, -34)

10-1: Exploring Quadratic GraphsYOUR TURN
Suppose a squirrel is in a tree 24 ft above the ground. She drops an acorn. The function h = -16t2 + 24 gives the height of the acorn after t seconds. Graph this function.
Graph on board
t h = -16t2 + 24
(t, h)
0 -16(0)2 + 24 = 24
(0, 24)
1 -16(1)2 + 24 = 8
(1, 8)
2 -16(2)2 + 24 = -40
(2, -40)

10-1: Exploring Quadratic GraphsAssignment
Worksheet 10-1 (You got it yesterday)Problems 17 – 27, odds