essbase calculations: a visual...
TRANSCRIPT

Marketing Technologies Group | Page 1
Essbase Calculations: A Visual Approach
TABLE OF CONTENTS Essbase Calculations: A Visual Approach ............................................................................ 2
How Essbase Refers To Cells: Intersections and Intersection Names ........................ 2 Global Calculation ....................................................................................................... 3
Relative References and Underspecification .................................................................. 6 Absolute References and Cross Dimensional Operators ................................................ 6
Nonsensical Aggregation and Two-Pass Calc .............................................................. 7 Essbase Default Calculation Order: Step by Step ....................................................... 9
About the Author .............................................................................................................. 14

Marketing Technologies Group | Page 2
Essbase Calculations: A Visual Approach It’s pretty easy to get Essbase to do a few simple calculations. It’s another thing altogether to master Essbase calculations. I find that to really master a topic I have to tear it apart and put it back together piece by piece. With that in mind let’s explore a few basic concepts that can be tricky for new Essbase developers; global calculation and scope, absolute and fixed references, two pass calculations and calculation order. I also find that it’s much easier to understand Essbase calculations if you visualize them. This article doesn’t address syntax, only concepts. I am assuming that the reader has some basic knowledge of Essbase outlines and of Microsoft Excel.
How Essbase Refers To Cells: Intersections and Intersection Names An Essbase calculation can be thought of as an equal sign with one or more dependent cells (result cells) on the left and one or more precedent cells (source cells) on the right. In the following example, Revenue is the dependent and Price and Quantity are the precedents.
Revenue = Price x Quantity Essbase calculations depend on referring to those cells correctly. That’s pretty simple in a spreadsheet because (most of the time) you only have to think about two dimensions. When you are dealing with more than two dimensions it’s a lot more complicated (and a lot more powerful). We can make it a lot easier if we thoroughly understand how Essbase thinks about cell names. The structure of an Essbase database is created by dimensions in the outline. The individual items that make up the dimensions are called members. Cells in Essbase are intersections of members and intersections have names. The name of an intersection is one member from each stored dimension. We use intersection names for almost all Essbase operations including reporting, loading data and calculating. In the example to the right, using spreadsheet terminology, you would say that the number 24,703 is stored in cell B5. In Essbase we don't use column letters and row numbers to identify an intersection. We use business descriptions such as Qtr1 and Profit which are members of the Time and Accounts dimensions. We can think of those member names as coordinates. The spreadsheet has two-dimensions, rows and columns, so the intersection name requires two coordinates.
Marketing Technologies Group | Page 3
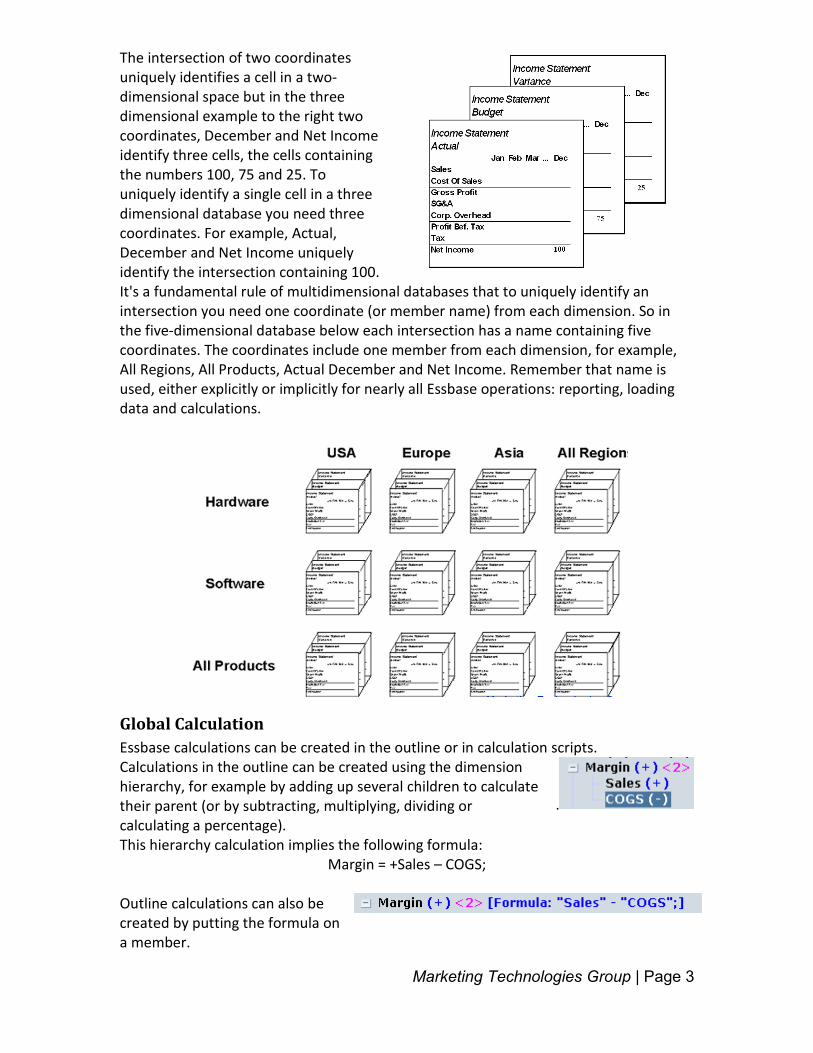
The intersection of two coordinates uniquely identifies a cell in a two-dimensional space but in the three dimensional example to the right two coordinates, December and Net Income identify three cells, the cells containing the numbers 100, 75 and 25. To uniquely identify a single cell in a three dimensional database you need three coordinates. For example, Actual, December and Net Income uniquely identify the intersection containing 100.
It's a fundamental rule of multidimensional databases that to uniquely identify an intersection you need one coordinate (or member name) from each dimension. So in the five-dimensional database below each intersection has a name containing five coordinates. The coordinates include one member from each dimension, for example, All Regions, All Products, Actual December and Net Income. Remember that name is used, either explicitly or implicitly for nearly all Essbase operations: reporting, loading data and calculations.
Global Calculation Essbase calculations can be created in the outline or in calculation scripts. Calculations in the outline can be created using the dimension hierarchy, for example by adding up several children to calculate their parent (or by subtracting, multiplying, dividing or calculating a percentage).
.
This hierarchy calculation implies the following formula: Margin = +Sales – COGS;
Outline calculations can also be created by putting the formula on a member.
Marketing Technologies Group | Page 4
Whether you use a hierarchy consolidation or a formula on a member, a formula is implied. The left side of the equation represents the result of the calculation and the right side represents the source data.
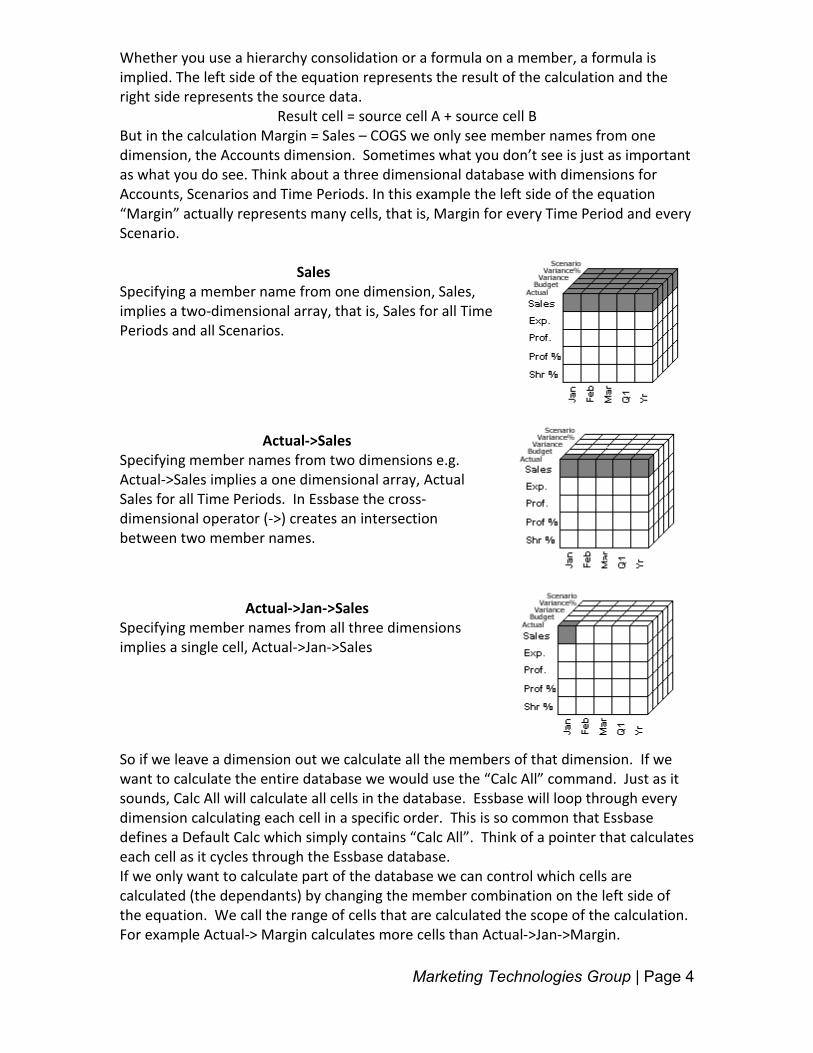
Result cell = source cell A + source cell B But in the calculation Margin = Sales – COGS we only see member names from one dimension, the Accounts dimension. Sometimes what you don’t see is just as important as what you do see. Think about a three dimensional database with dimensions for Accounts, Scenarios and Time Periods. In this example the left side of the equation “Margin” actually represents many cells, that is, Margin for every Time Period and every Scenario.
Sales
Specifying a member name from one dimension, Sales, implies a two-dimensional array, that is, Sales for all Time Periods and all Scenarios.
Actual->Sales Specifying member names from two dimensions e.g. Actual->Sales implies a one dimensional array, Actual Sales for all Time Periods. In Essbase the cross-dimensional operator (->) creates an intersection between two member names.
Actual->Jan->Sales
Specifying member names from all three dimensions implies a single cell, Actual->Jan->Sales
So if we leave a dimension out we calculate all the members of that dimension. If we want to calculate the entire database we would use the “Calc All” command. Just as it sounds, Calc All will calculate all cells in the database. Essbase will loop through every dimension calculating each cell in a specific order. This is so common that Essbase defines a Default Calc which simply contains “Calc All”. Think of a pointer that calculates each cell as it cycles through the Essbase database. If we only want to calculate part of the database we can control which cells are calculated (the dependants) by changing the member combination on the left side of the equation. We call the range of cells that are calculated the scope of the calculation. For example Actual-> Margin calculates more cells than Actual->Jan->Margin.

Marketing Technologies Group | Page 5
Actual->Margin calculates all the time periods instead of just January. By dropping the member name Jan we include all the members of the Time dimension. We can also control the calculation scope using the FIX or the IF commands which act a lot like specifying members names on the right side of the equation. Here is another three dimensional example. In a three dimensional database Jan->NY->Margin will calculate one cell Jan->NY-> Margin =Jan->NY-> Sales – Jan ->NY-> COGS;
If we drop the specification for the month of January the formula will calculate all months. NY->Margin= NY->Sales - NY->COGS;
. If we then drop the specification for the state of NY, the formula will calculate all the months and all the states Margin = Sales – COGS
This is called global calculation. One formula (or hierarchy calculation) controls many cells. If the left side of the equation is Margin the formula controls every cell where the intersection name includes the member Margin including all members of all the other dimensions.

Marketing Technologies Group | Page 6
That makes Essbase calculation fast to implement and extremely consistent. Because they are extremely consistent, Essbase formulas are much less error prone than alternatives such as spreadsheets.
Relative References and Underspecification Notice that there is an implied match between the missing members names from the left and right sides of the equation. For example when Essbase is calculating Jan->Margin it naturally uses Jan->Sales and Jan-> COGS. As long as you are matching the member names you don’t need to specify them. This is called underspecification and it results in relative references. That is, when the left side of the equation changes the right side changes the same way just like a spreadsheet
Absolute References and Cross Dimensional Operators Many formulas require absolute references (fixed references); for example, market share. In this case the left side of the equation and the numerator on the right side change the same way e.g. New York, Massachusetts, Florida, but the denominator is fixed on one cell Total Market.
In Excel you would use the dollar sign to create an absolute reference. In Essbase you use the cross dimensional operator “->” to fix the denominator on “Total Market”. For example:
Share = Sales / “Total Market”->Sales; Notice that every result cell refers to the same source cell in the denominator. That’s how we know it’s an absolute reference.
Result Cell Numerator Denominator New York New York Total Markets
Massachusetts Massachusetts Total Markets Florida Florida Total Markets
Just like a spreadsheet, Essbase defaults to relative references because it matches member names that are omitted or underspecified.

Marketing Technologies Group | Page 7
In this example, relative references would result in errors so you need to use the cross dimensional operator to created an absolute reference to Total Markets
Essbase Default Calculation Order Many calculations depend on a specific processing order so it is important to understand Essbase’s default calc order. Essbase calculations can be batch calculations which are run as part of the cube preparation process, or they can be dynamic. Dynamic Calcs are executed when data is retrieved. The batch calculation order is different from the dynamic calculation order. Put simply, batch calculations process dense dimensions first and dynamic calculations process sparse dimensions first.
Batch Calc Order Dynamic Calc Order
Accounts Dimension Sparse Dimensions Time Dimension Accounts Dimension Remaining Dense Dimensions Time Dimension Remaining Sparse Dimensions Remaining Dense Dimensions When the Calc All command is executed Essbase processes every cell in the batch calc default order. Later when data is retrieved dynamic calculations are processed in the dynamic calc order. Calculation order depends on sparse and dense dimension settings and on the accounts dimension property and the time dimension property. Optional settings may also affect calculation order.
We call the lowest level members in the outline level 0 members. For each dimension Essbase will calculate outline formulas and hierarchy consolidations beginning with the first Level 0 member and accumulating children into their parents. In the example on the right the numbers to the right of member names indicate the order in which Essbase processes the members.
Nonsensical Aggregation and Two-Pass Calc When a Calc All is executed, Essbase calculates all hierarchy consolidations and all member formulas dimension by dimension in the default order. You can also calculate individual dimensions using the Calc Dim command. First let’s load some data to a single block.

Marketing Technologies Group | Page 8
In the default order, the accounts dimension is calculated first. Level 0 members are accumulated up to level 1. Level 1 members are accumulated up to level 2 until the stored members of the dimension are all calculated.
Calc Dim Measures
Jan Feb Mar Qtr1Measures L 262 245 259 - 8 Calc Measures for all dense dims Profit ~ 262 245 259 - 8 Calc Profit for all dense dims Margin + 407 387 405 - 3 Calc Margin for all dense dims Sales + 678 645 675 - 1 Read Sales Data COGS - 271 258 270 - 2 Read COGS Data Total Expenses - 145 142 146 - 7 Calc Total Expenses for all dense dims Marketing + 94 90 94 - 4 Read Marketing data Payroll + 51 51 51 - 5 Read Payroll data Misc + 0 1 1 - 6 Read Misc. data Ratios L 60.0 60.0 60.0 - 9 Calc Margin % for all dense dims Margin % F 60.0 60.0 60.0 - 9 Calc Ratios for all dense dims Profit % F 38.6 38.0 38.4 - 10 Calc Profit % for all dense dims
Formulas: Margin % Sales, Profit % Sales
Accounts Dimension Calculation
The time dimension is calculated second. The hierarchy logic on the time dimension implies the formula:
Qtr1 = Jan + Feb + Mar; This formula is correct for the descendents of profit. Those calculations include only addition and subtraction, so calculation order doesn't matter. However, Margin % and profit % mix multiplication and division within addition and subtraction so adding up the months causes errors in “quarter one”-> “margin%” and “quarter one”-> “profit%”

Marketing Technologies Group | Page 9
Jan Feb Mar Qtr1Measures L 262 245 259 766 8 Calc Measures for all dense dims Profit ~ 262 245 259 766 8 Calc Profit for all dense dims Margin + 407 387 405 1199 3 Calc Margin for all dense dims Sales + 678 645 675 1998 1 Read Sales Data COGS - 271 258 270 799 2 Read COGS Data Total Expenses - 145 142 146 433 7 Calc Total Expenses for all dense dims Marketing + 94 90 94 278 4 Read Marketing data Payroll + 51 51 51 153 5 Read Payroll data Misc + 0 1 1 2 6 Read Misc. data Ratios L 60.0 60.0 60.0 180.0 9 Calc Margin % for all dense dims Margin % F 60.0 60.0 60.0 180.0 9 Calc Ratios for all dense dims Profit % F 38.6 38.0 38.4 115.0 10 Calc Profit % for all dense dims
11 Calc Qtr 1 for all dense dims
Consolidate Jan (+), Feb (+) and Mar (+)Time Dimension Calculation
To correct this Essbase needs to recalculate margin% and profit% using the accounts dimension formulas. To do this we apply the two pass calc property to Margin % and Profit %.
Essbase Default Calculation Order: Step by Step Here is an example of what happens when Essbase processes the CALC ALL; command. Essbase processes two pass calcs differently when you execute the Default Calc versus a when you execute a custom calculation script. This example illustrates a custom calc script, with no dynamic calcs in the outline:
CALC ALL; CALC TWOPASS;
EMPTY DATABASE The Essbase outline defines the structure pictured above. Before data is loaded there are no blocks, which means there is no page file and no index file.

Marketing Technologies Group | Page 10
Load Data Loading data creates blocks, which creates a page file and an index file. Since we are loading data only to Level 0 members, all the blocks are Level 0 blocks. After loading data, each Level 0 block contains Level 0 Accounts data for Level 0 Time Periods; that is, Sales and Expenses for Jan, Feb and Mar. The page file contains six blocks and the index contains six nodes.
LOADED LEVEL 0 DATA
The Dense Calc
Accounts The first dimension calculated is the Accounts dimension because it has the Accounts dimension attribute. Essbase calculates all of the instances of each calculated member before moving on to the next Accounts member. For example, Essbase calculates all the profit numbers before calculating Profit%. When Essbase finishes calculating the Accounts dimension, Profit and Profit% are correctly calculated for Level 0 periods. MktShr% is missing…why? MktShr% depends on a value from an upper level block AllMkts->AllPdt, which has not yet been calculated, so at this point MktShr% is missing.
ACCOUNTS CALCULATED FOR NY->APPLES BLOCK
The dense calc is executed one block at a time. That is, all dense dimensions are calculated for a single block before the next block is calculated. Calculating one

Marketing Technologies Group | Page 11
dimension at a time for all the blocks would require a pass through the database for each dense dimension. Calculating all the dense dimensions for each block requires only one pass (for the additive members), thus optimizing calculation performance.
Periods The dimension with the Time property is now calculated for the first block. The additive Accounts are correctly calculated (according to the formula Q1=Jan + Feb + Mar). Percentages are not additive, so the Q1 formula produces an incorrect result. This requires a two pass calculation; i.e. the members tagged as two pass calc are recalculated when the second pass is executed, overwriting the incorrect summation with the correct calculation, which is defined on the Accounts dimension.. New data is created because the calculated values are created.
TIME DIMENSION CALCULATED FOR NY->APPLES BLOCK
This process proceeds one block at a time. Each block has the Accounts dimension calculated first, then the Time dimension, then any remaining dense dimensions. Many derived values are created, but no new blocks are created.
DENSE CALC COMPLETED ON LEVEL 0 BLOCKS

Marketing Technologies Group | Page 12
The Sparse Calc
AllMkts Essbase applies the AllMkt consolidation using the formula: AllMkts=NY+NJ+CT; This creates two new blocks, Apples->AllMkts and Oranges->AllMkts. No block is created for AllPdt->AllMkts because its children on the AllMkts dimension have not been calculated yet. The two pass problem continues because Essbase just adds up the values according to the consolidation for AllMkts.
AGGREGATE AllMkts
AllPdt Essbase applies the AllPdt consolidation using the consolidation properties: AllPdt= Apples + Oranges;. This calculation creates four new blocks. The two pass problem continues:
AGGREGATE AllPdt
Calc Twopass Because no data was available when the Level 0 blocks were calculated, MktShr% is missing. Now that the sparse calc has aggregated Sales to the AllMkts blocks the values for Market Share % can be calculated. In addition, Profit% and Margin% must be recalculated in all the blocks. That happens when Essbase executes the CALC TWOPASS; command.

Marketing Technologies Group | Page 13
This corrects the non-additive percentages and calculates all the MktShr% values. However, it requires two complete passes through the database.
TWO PASS CALC COMPLETED
This illustrates the order when you use a calc script other than the default. If you use the default calc the order is different. When Essbase encounters the Calc All command in the default calc it calculates the two pass calc block by block during the first pass. Default Calc (Calc All;) Script with Calc All and Calc Twopass Accounts Accounts Time Time Remaining Dense Remaining Dense Two pass Remaining Sparse Remaining Sparse Two Pass The calc script approach requires an additional pass through the entire database and that means it’s much slower. The default calc would work fine except for the market share calculation and it would be much faster. How do we get both the speed and the market share calculation? The answer is that we make Market Share % a dynamic calc so it is not calculated until it’s retrieved. At that point Sales->AllMkts has already been calculated at the end of the batch calc. But that’s not even the best part. We can frequently (but not always) make all the dense calcs dynamic. That means far fewer cells are stored. Take a look at the comparison of block sizes in the example to the right. The database is much smaller and the batch calc is much faster.
Because dense calcs are very fast, it doesn’t usually hurt query performance. How is that possible? Great question, but it will have to wait for next time. –Ron Moore
Marketing Technologies Group | Page 14
About the Author Ron Moore was one of the first Essbase certified consultants in the world. He founded Marketing Technologies Group which specializes in Essbase training, consulting and collaborative development. MTG’s Oracle authorized training facility is located in New York City’s Wall Street district. Ron is known for his ability reveal the mysteries of Essbase using real world examples from his more than 14 years of hands-on field experience.
Prior to founding MTG Ron worked for Manageware, developers of Compete!, one of the earliest desktop OLAP tools, and for The Alcar Group who developed software for shareholder value and strategic financial planning. He also worked for the Futures Group, a futurist consulting firm and he also taught college economics. He holds Bachelor and Master Degrees in Economics from Boston University. About Marketing Technologies Group: MTG is an industry leading provider of OLAP and Business Intelligence consulting and training services, as well as one of the oldest and most technically certified Hyperion Essbase specialty firms on the planet. We are experts in multidimensional financial modeling and have helped hundreds of Fortune 500 companies improve their business performance by making the most of their critical data. MTG is widely recognized for its technical achievement, customer focus, and the highest standards of quality and design. Contact us at: Marketing Technologies Group 55 Broad Street, 10th Floor New York City, NY 10004 Phone: 212-824-2900 Fax: 212-824-4929 Web: www.mtgny.com Email: [email protected]