esports analytics through encounter detection … · esports analytics through encounter detection...
TRANSCRIPT

LUND UNIVERSITY
PO Box 117221 00 Lund+46 46-222 00 00
Esports Analytics Through Encounter Detection
Schubert, Matthias; Drachen, Anders; Mahlmann, Tobias
Published in:Proceedings of the MIT Sloan Sports Analytics Conference 2016
Published: 2016-01-01
Link to publication
Citation for published version (APA):Schubert, M., Drachen, A., & Mahlmann, T. (2016). Esports Analytics Through Encounter Detection. InProceedings of the MIT Sloan Sports Analytics Conference 2016 MIT Sloan.
General rightsCopyright and moral rights for the publications made accessible in the public portal are retained by the authorsand/or other copyright owners and it is a condition of accessing publications that users recognise and abide by thelegal requirements associated with these rights.
• Users may download and print one copy of any publication from the public portal for the purpose of privatestudy or research. • You may not further distribute the material or use it for any profit-making activity or commercial gain • You may freely distribute the URL identifying the publication in the public portalTake down policyIf you believe that this document breaches copyright please contact us providing details, and we will removeaccess to the work immediately and investigate your claim.

Download date: 30. May. 2018

1
2016 Research Papers Competition Presented by:
Esports Analytics Through Encounter Detection
Other Sports 1458
Matthias Schubert Anders Drachen Tobias Mahlmann Ludwig-Maximilians-
University Munich, Germany
Aarlborg University Denmark
Lund University Sweden
[email protected] [email protected] [email protected]
Abstract Esports is computer games played in a competitive environment, and analytics in this domain is focused on player and team behavior. Multiplayer Online Battle Arena (MOBA) games are among the most played digital games in the world. In these games, teams of players fight against each other in enclosed arena environments, with a complex gameplay focused on tactical combat. Here we present a technique for segmenting matches into spatio-temporally defined components referred to as encounters, enabling performance analysis. We apply encounter-based analysis to match data from the popular esport game DOTA, and present win probability predictions based on encounters. Finally, metrics for evaluating team performance during match runtime are proposed.
1. Introduction Esport (or e-sport, eSport) refers to situations where computer games are played competitively. In recent years, the esports environment around online digital games have gained momentum. While precise numbers are not known, SuperData [1] reported a worldwide audience of 71 million people who watch competitive gaming in 2014. In 2015, the viewership statistics reported by Riot Games, the publisher of League of Legends (LoL), reported 36 million unique viewers for the world finals. The number of players active in the gaming community is increasing, with for example a reported 27 million daily active players - or cyberathletes - for LoL in 2014 [2,3]. Considerable resources are allocated from the parent companies such as Riot Games, Wargaming, Valve, ESA and Ubisoft to support the esports environment. For DOTA 2 (here abbreviated to DOTA) the main tournament of the year 2015, The International, contained a 18 million USD prize pool of which the winning time earned about 6 million USD. This is a tenfold increase in just two years and the largest in esports history [4].
In parallel with the rise of esports, a corresponding need to analyze strategies and predict behavior has emerged. This has given rise to the nascent field of esports analytics. We formally define esports analytics as: the process of using esports related data, primarily behavioural telemetry but also other sources, to find meaningful patterns and trends in said data, and the communication of these patterns using visualization techniques to assist with decision-making processes. This definition relates esports analytics closely with (physical) sports analytics, and follows the definition of Lewis [5]. It also aligns with digital game

2
2016 Research Papers Competition Presented by:
analytics [9]. It covers working with in-game behaviors as well as the context around the games, e.g. tournaments and production.
Esports analytics can be viewed as a subset of sports analytics and/or game analytics [6-9]. Many of the basic principles and challenges are similar across these three analytics application domains. Esports analytics has enjoyed wealth of community-based initiatives towards helping fans access data, analyse data and obtain insights from data. However, community-driven esports analytics remains generally focused on descriptive methods. Thanks to APIs providing access to telemetry data from matches/games (e.g. Riot and Valve's APIs) data is available to the broad public. Irrespective analytics has become a big component of the esports environment. Today, most professional teams employ analysts to observe opponents and discover their tendencies and strategies, develop counter-strategies etc., similar to analysts working in physical sports [10]. Furthermore, analysts and commentators, referred to as "statsmen", report their analyses during tournaments and matches.
In this paper, the focus is on Multi-Player Online Battle-Arena games (MOBAs) [11] which have evolved to comprise a significant fraction of the esports environment in recent years. The term MOBA describes games where two teams of five players each controlling one avatar compete within an enclosed virtual structure over a short period of time. The gameplay is a mixture between role-playing and real-time strategy game where each player controls one avatar (commonly referred to as a hero or unit). The game is viewed from a top-down (isometric) perspective. The player units are primarily controlled using the mouse with additional keyboard shortcuts. Game play takes place on an interactive map that is, apart from the players, often populated with computer-controlled entities. These entities can be enemies, allies or unaffiliated with either team, and serve a variety of roles. While there exist many variations across different games, there generally imposed behaviour for each team is to attack the enemy base while defending their own. In order to win, each team must coordinate its actions and react to the actions of the opposing team as efficiently as possible. In essence, MOBAs feature a broad spectrum of possible behaviours which means that mastering these games is quite challenging.
Since a match can take up to an hour of gameplay, analyzing a match should focus on the most interesting parts. Unlike games like American football or tennis where a match can be separated by the structure of the game, MOBAs do not have a natural structure. Furthermore, it is possible that two relevant actions take place on two separated parts of the map in parallel. This means that a technique for breaking down matches into analyzable sections of decisive game play is needed before player and team performance can be evaluated in detail. In this paper, we present a technique for breaking down MOBA matches into spatio-temporally defined components referred to as encounters. An encounter is established when two or more heroes (units) from opposing teams are in range to affect each other. We model encounter dynamics by a graph where the units form nodes, and edges result from closely positioned units. Encounters are defined as a sequence of situations in time and space involving the same units. A match is summarized by describing its encounters with metrics for unit values, defeated units, and/or gained

3
2016 Research Papers Competition Presented by:
resources per team. Based on the initial setting, predictors for the outcome can be learned, and models predicting win/loss match conditions developed. The usefulness of being able to segment matches or at least summarize information is highlighted by Valve´s decision to introduce “fight recaps” for someone watching a live DOTA match or a replay. The system is however not spatially aware, and the temporal dimension of a fight is determined by a timer and based on time since last damage dealt.
The contributions of this paper are as follows:
1. A general definition of encounters based on spatial positioning. 2. An algorithm to extract encounters while parsing through a replay. 3. A set of metrics to describe the initial setting of an encounter and the outcome of an
encounter in a compact way. 4. An experimental evaluation based on 412 replays that examines the new metrics
w.r.t. their predictive power.
The rest of the paper is organized as follows: Section 2 gives a brief introduction to the gameplay of DOTA. Section 3 presents related work on analyzing computer games and esports analytics. Section 4 gives a formal definition of the encounter pattern, describes an algorithms for extracting encounters and Section 5 names metrics for evaluating encounters. Section 6 presents the results of our experimental evaluation and section 7 concludes the paper with a summary and some ideas for future work.
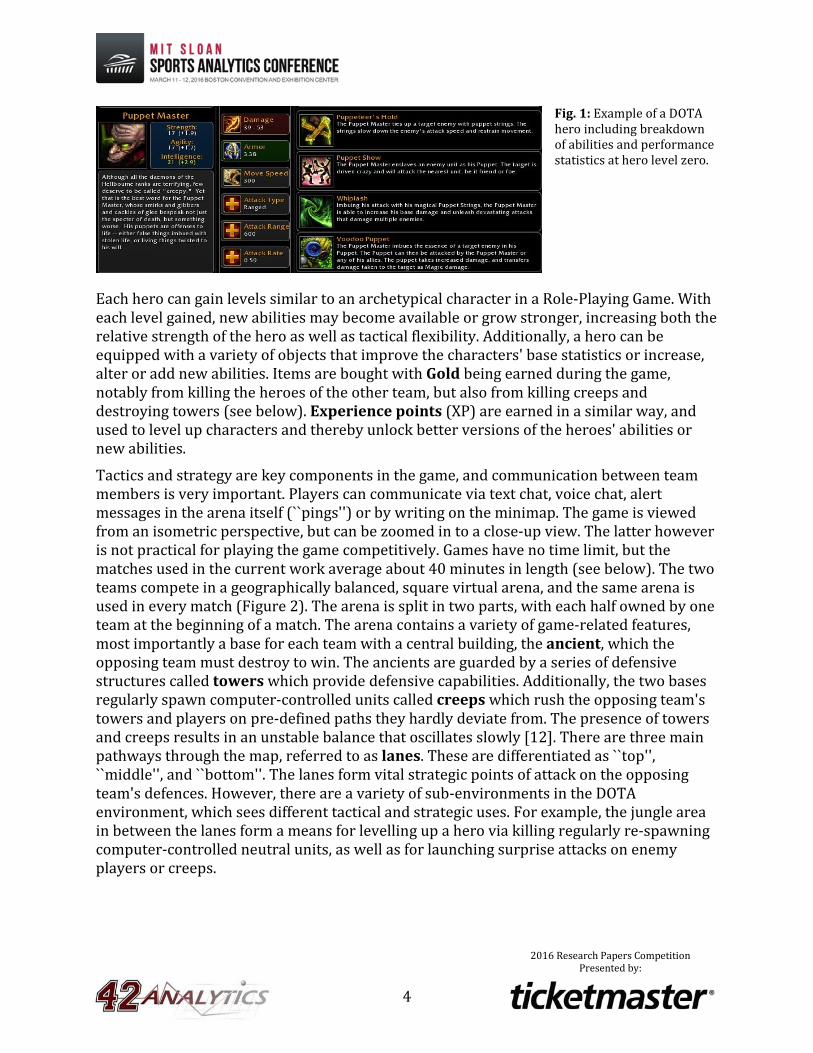
2. DOTA: Gameplay DOTA (Defence of the Ancients) is a player-developed modified version of the real-time strategy game Warcraft 3: Reign of Chaos (developed by Blizzard). DOTA 2 is the current version of the game which is now a standalone game being independently developed by Valve. In general, most people refer to DOTA2 as DOTA. DOTA is today the most played game on the online distribution platform Steam (owned by Valve), in itself one of the most heavily trafficked digital game platforms in the world. According to SteamPowered1, the native analytics service of Valve, DOTA is played more than 1140 years every day. This is confirmed by Sifa et al. [13] and Orland [14]. The latter estimated a total playtime for DOTA of 430,000 years by April 2014. The game has a reported number of 7.86 million monthly active players and achieved a revenue of 80 million USD in 2013 via micro-transactions which are limited to selling cosmetic items. According to Steam´s reporting service SteamCharts2, DOTA has roughly 500-600,000 concurrent players on average in 2015. DOTA (i.e. DOTA 2) is played by two teams of 5 players, each of them controlling one avatar-character being selected from a roster of more than 100. Each hero has different abilities and is suited for different tactical roles or play styles in the game, e.g. for dealing damage at a distance, close combat or healing teammates (Figure 1). Hero roles are not formally defined but have been established among the player community [see e.g. 15].
1 http://store.steampowered.com/stats/ 2 www.steamcharts.com
4
2016 Research Papers Competition Presented by:
Fig. 1: Example of a DOTA hero including breakdown of abilities and performance statistics at hero level zero.
Each hero can gain levels similar to an archetypical character in a Role-Playing Game. With each level gained, new abilities may become available or grow stronger, increasing both the relative strength of the hero as well as tactical flexibility. Additionally, a hero can be equipped with a variety of objects that improve the characters' base statistics or increase, alter or add new abilities. Items are bought with Gold being earned during the game, notably from killing the heroes of the other team, but also from killing creeps and destroying towers (see below). Experience points (XP) are earned in a similar way, and used to level up characters and thereby unlock better versions of the heroes' abilities or new abilities.
Tactics and strategy are key components in the game, and communication between team members is very important. Players can communicate via text chat, voice chat, alert messages in the arena itself (``pings'') or by writing on the minimap. The game is viewed from an isometric perspective, but can be zoomed in to a close-up view. The latter however is not practical for playing the game competitively. Games have no time limit, but the matches used in the current work average about 40 minutes in length (see below). The two teams compete in a geographically balanced, square virtual arena, and the same arena is used in every match (Figure 2). The arena is split in two parts, with each half owned by one team at the beginning of a match. The arena contains a variety of game-related features, most importantly a base for each team with a central building, the ancient, which the opposing team must destroy to win. The ancients are guarded by a series of defensive structures called towers which provide defensive capabilities. Additionally, the two bases regularly spawn computer-controlled units called creeps which rush the opposing team's towers and players on pre-defined paths they hardly deviate from. The presence of towers and creeps results in an unstable balance that oscillates slowly [12]. There are three main pathways through the map, referred to as lanes. These are differentiated as ``top'', ``middle'', and ``bottom''. The lanes form vital strategic points of attack on the opposing team's defences. However, there are a variety of sub-environments in the DOTA environment, which sees different tactical and strategic uses. For example, the jungle area in between the lanes form a means for levelling up a hero via killing regularly re-spawning computer-controlled neutral units, as well as for launching surprise attacks on enemy players or creeps.

5
2016 Research Papers Competition Presented by:
Fig. 2: The DOTA map. The Radiant base is at the bottom left, the Dire base at the top right. The three lanes are indicated as is the location of towers (see text) (Source: DOTA 2 wiki, http://DOTA:gamepedia:com/Lane)
3. Related work A small number of publications have targeted MOBAs so far. Starting with work operating outside the spatio-temporal domain, Ong et al. [17] considered clustering player behavior to learn optimal team compositions for League of Legends, with the goal of developing a set of descriptive play style groupings, feeding these into a prediction model for win/loss outcomes. The authors demonstrate that match win/loss conditions could be predicted from team composition-based features with accuracies around 70% depending on the classification used. Gao et al. [16] targeted the identification of the heroes that players are controlling and the role they take. They define a basic model with three roles a player can fulfill that are predicted with an accuracy of about 74%. Eggert et al. [15] built on the work of Gao et al. [16], applying supervised machine learning to classify the behavior of DOTA players in terms of their hero roles or playstyles. The authors used attribute evaluation techniques to develop a series of hero roles which were then evaluated again on DOTA match data. Yang et al. [18] presented an approach for discovering and defining patterns in combat tactics among winning teams, based on graph representation. The authors defined specific roles of DOTA players in the game, modelled combat as a sequence of graphs and used this representation to extract patterns that predict successful outcomes of 9 minute sequences in the game as well as matches with an 80% prediction accuracy. The authors attributed features to the graphs using frequent sub-graph mining which allowed them to describe how different combat tactics contributed to team success in specific situation. The work of Yang et al. [18] is a step towards breaking down a DOTA match into segments, but has two limitations: The main drawback with the approach is that spatial information was not used, which means that events happening in different sections of the DOTA map were not separated, and furthermore, the temporal granularity used eliminates the possibility of detailed analysis.
Drachen et al. [11] investigated skill-based differences in the spatio-temporal team behavior of DOTA matches. The authors found that higher-skilled players to move more actively and closer to their teammates around the map. For collecting positional information they used a spatial division of the Dota 2 map into zones and investigated hero zone changes. This approach inspired the technique used by Eggert et al. to detect early

6
2016 Research Papers Competition Presented by:
game movement. Batsford [19] used a feed-forward sigmoidal neural network in connection with several genetic algorithms to discover optimal routes in the jungle areas of DOTA, using simulation. The author noted that there appeared to be convergence towards optimal jungle routes, but that more work was needed and highlights the complexity involved in representing the game state in DOTA. Rioult et al. [12], who used topological measures - areas of polygons described by the players, inertia, diameter, distance to the base to show that outcomes of matches can be predicted with recall rates of 90% in DOTA, highlighting the importance of player positioning in the game. The authors concluded that topological clues appear relevant for predicting outcomes of MOBA matches as well as for determining which features that are relevant to drive prediction, e.g. team aggressiveness. A potential limitation of the work presented is that spatial positioning information was estimated via movement orders triggered by players, which adds an unknown amount of uncertainty to the positional data used.
4. Encounters: defining the components of MOBA matches In order to describe encounters in MOBAs, we first of all need to formally describe them. A player unit u is described by the following tuple (pos, team, type) where pos ∈ IR2 is the position on the map, team∈ IN describes the team the player belongs to and type is the type of unit. The set 𝑇𝑇𝑖𝑖 = {𝑢𝑢 ∈ 𝑈𝑈|𝑢𝑢. 𝑡𝑡𝑡𝑡𝑡𝑡𝑡𝑡 = 𝑖𝑖} is called team i. A match is a time series describing the position of each unit at each point in time. We will refer to a discrete point of time t as tick.
If unit 𝑢𝑢1 ∈ 𝑇𝑇1 can fight unit 𝑢𝑢2 ∈ 𝑇𝑇2 or vice versa at some tick t, we say that (u1, u2) forms a combat link. To decide whether a combat link exists there are several possibilities. One possibility is to require that u1 indeed performs some action being directed at u2. Though this makes sure that the link indeed exists, it usually does not hold for most ticks because there is only a certain amount of allowed actions in a given time interval. Furthermore, waiting for the right time to attack is also an important part of an encounter. Therefore, we will rely on a more loose definition of a combat link which is based on the distance between the units. The idea is that units being sufficiently close to each other could potentially fight. Since the ranges of the unit abilities vary in most computer games, combat links are directed. For example, within a certain distance an archer could hit a melee soldier, but the soldier needs to close the distance before fighting the archer due to his smaller combat range (Figure 3, 4).
A similar relationship between units of the same team exists if 𝑢𝑢1 ∈ 𝑇𝑇1can support unit 𝑢𝑢2 ∈𝑇𝑇1. In this case, we speak of a support link (u1, u2). For example, if u1 is a healer and u2 is within the healing range of u1. Combat and support links at tick t form a graph. Based on this graph, we can determine groups of units which might potentially interact. To find encounter situations, we additionally require that at least two units in the connected sub graph belong to opposing teams.

7
2016 Research Papers Competition Presented by:
Fig. 3: An example combat component. Red arrows represent combat links and green arrows support links. Blue circles represent the combat range. The green circle shows the support range of a supporting unit.
4.1. Definition: Combat Component Given a set of units U and the union 𝐸𝐸𝑑𝑑 = 𝐶𝐶𝐶𝐶 ∪ 𝑆𝑆𝐶𝐶 of combat links CL and support links SL between the units in U. Let 𝐸𝐸𝑢𝑢 = {(𝑢𝑢𝑖𝑖,𝑢𝑢𝑗𝑗)|(𝑢𝑢𝑖𝑖,𝑢𝑢𝑗𝑗) ∈ 𝐸𝐸𝑑𝑑 ∨ (𝑢𝑢𝑗𝑗 ,𝑢𝑢𝑖𝑖) ∈ 𝐸𝐸𝑑𝑑} be the set of undirected links corresponding to 𝐸𝐸𝑑𝑑 , the situation graph is defined as 𝐺𝐺(𝑈𝑈,𝐸𝐸𝑢𝑢). An combat component C is a connected subgraph 𝐺𝐺(𝑈𝑈�,𝐸𝐸�) of 𝐺𝐺(𝑈𝑈,𝐸𝐸𝑢𝑢) where 𝑈𝑈� ⊆ 𝑈𝑈,𝐸𝐸� ⊆ 𝑈𝑈� × 𝑈𝑈� and ∀𝑢𝑢1,𝑢𝑢𝑙𝑙 ∈ 𝑈𝑈�:∃(𝑢𝑢1,𝑢𝑢2, . .𝑢𝑢𝑙𝑙) where 𝑖𝑖 ∈ {1, . . , 𝑙𝑙}: (𝑢𝑢𝑖𝑖, 𝑢𝑢𝑖𝑖+1) ∈ 𝐸𝐸� and ∃𝑢𝑢𝑖𝑖,𝑢𝑢𝑗𝑗 ∈ 𝑈𝑈�:𝑢𝑢1. 𝑡𝑡𝑡𝑡𝑡𝑡𝑡𝑡 ≠ 𝑢𝑢2. 𝑡𝑡𝑡𝑡𝑡𝑡𝑡𝑡.
In other words, an encounter component is a subset of units where each unit is connected to all other units via an undirected path of combat and support links and at least two units belong to different sides. An Encounter Component thus represents of a subset of players which could interact at tick t. Since encounters usually last multiple ticks, we now need to connect encounter components from different ticks to form encounters. Since encounters can split and join, an encounter E might comprise several components Ci in tick t. For example, a join occurs if two separated encounters meet after some time. To decide whether an encounter continues at some later tick 𝑡𝑡 + 𝛥𝛥𝑡𝑡, we have to define a relation describing whether a new component 𝐶𝐶𝑡𝑡+𝛥𝛥𝑡𝑡 extends an encounter currently ending a tick t. We will refer to this relation as successor relation and define it in the following:
4.2. Definition: Successor Given a set of components CSt={ C1,t ,… ,Cl,t } describing encounter E at tick t. Let 𝜏𝜏 be a timeout threshold. A component 𝐶𝐶𝑡𝑡+𝛥𝛥𝑡𝑡is a successor of CSt denoted as 𝐶𝐶𝑆𝑆𝑡𝑡 → 𝐶𝐶𝑡𝑡+𝛥𝛥𝑡𝑡if the following conditions hold:
• 𝛥𝛥𝑡𝑡 ≤ 𝜏𝜏
• ∃𝑢𝑢1,𝑢𝑢2 ∈ 𝐶𝐶𝑡𝑡+𝛥𝛥𝑡𝑡:∃𝐶𝐶𝑖𝑖,𝑡𝑡 ∈ 𝐶𝐶𝑆𝑆𝑡𝑡:𝑢𝑢1 ∈ 𝐶𝐶𝑖𝑖,𝑡𝑡 ∧ 𝐶𝐶𝑗𝑗,𝑡𝑡 ∈ 𝐶𝐶𝑆𝑆𝑡𝑡:𝑢𝑢2 ∈ 𝐶𝐶𝑗𝑗,𝑡𝑡 ∧ 𝑢𝑢1. 𝑡𝑡𝑡𝑡𝑡𝑡𝑡𝑡 ≠ 𝑢𝑢2. 𝑡𝑡𝑡𝑡𝑡𝑡𝑡𝑡
To conclude a component extends a list of components within the timespan 𝛥𝛥t if at least two opposing units being previously involved are in the new component as well. The idea behind this definition is that at least two units fighting each other stay in the encounter. Finally, an encounter is defined as follows:

8
2016 Research Papers Competition Presented by:
Fig. 4: A sequence of components being selected from an encounter starting with 3 vs. 3 units. The blue circles symbolize the combat ranges whereas the cyan circle displays the support range. Only the most top player is a supporter. In the first component, the red team is positioned rather compact. In the second component, we can see how the supporter attacks the yellow. In the next component, the red team moves closer together, but a fourth player on the yellow team arrives in the encounter. This leads to the killing the red supporter between component 4 and 5. Given the new odds 4 vs. 2 the red team withdraws into its own territory, but only one player manages to escape.
4.3. Definition: Encounter An encounter is a sequence (CS0,.., CS,l) of lists of components CSi where the following condition holds: : ∀𝐶𝐶𝑖𝑖,𝑡𝑡 ∈ 𝐶𝐶𝑆𝑆𝑡𝑡:𝐶𝐶𝑆𝑆𝑡𝑡−1 → 𝐶𝐶𝑖𝑖,𝑡𝑡 with 𝑡𝑡 ∈ {1, . . , 𝑙𝑙}. Therefore, encounters can be split or joint, and units might leave and join encounters at some point in time.
4.4. An Online Algorithm for Encounter Detection After formalizing encounters, we now introduce our algorithms for extracting encounters. Our method is suitable for online extraction and thus, we assume that the data is given as stream of position updates containing a unit_id, a tick and the new position pos of the unit. Let us note that we assume the input is ordered by ticks in ascending order and that multiple inputs might have identical ticks if units move simultaneously.
While processing the stream our method maintains a position table storing the last known position of each player unit. Furthermore, we store a distance matrix of player distances. When a new update arrives, we update both data structures. Let us note that we only need to update the distance matrix in the row and in the column corresponding to unit having a new position. Based on the distance table, we are now computing whether the changed element belongs to a component based on the updated situation graph. Since the existence of combat and support links depends on the distance, we can check the existence based on the distance table. If the units are on the same side, we compare the distance to the support ranges of both units. If the units belong to the opposite side, we compare the distance to their combat ranges. If the distance is smaller than the range of any of both players the link
9
2016 Research Papers Competition Presented by:
exists. The ranges of the unit types are taken from the observed damage distances. Therefore, we determined the mean and the standard deviation of the damage distance for each unit. For each unit we add one standard deviation to the mean of the distances. In this way, ca. 85% all damage was within the combat range.
To determine whether the changed unit is part of a new combat component, we perform a depth-first traversal to find all reachable units. If the found subgraph does not contain any combat link, the algorithm continues to the next input from the stream.
If a new combat component is found, we have to find out whether the new component extends any existing encounter. Given the list of all open encounters, we check the successor relation for the new component and each encounter. Based on the number of predecessor encounters, we can now distinguish 3 cases:
1. The component does not extend any existing encounter. In this this, case the component starts a new encounter which is inserted into the list of open encounters.
2. An encounter extends exactly one encounter. In this case, the encounter is updated to contain the component for the current tick.
3. The component succeeds multiple encounters. In this case, opponents from various encounters are found and thus, we need to join these encounters into a single one. This, is done by merging the sequence of components for each tick.
We do not have to explicitly consider the case for which an encounter splits into multiple components; since we only process one component at a time, splits are handled by successive iterations of the algorithm (Algorithm 1).
After the current component is handled, our algorithm checks all open encounters for time-outs. Thus, the tick of the last registered component of each encounter is compared to the current tick. If the time between both ticks is larger than 𝜏𝜏, we move the encounter to the set of finished encounters because there cannot not be any successor component in any further tick. After the match is finished, there are no more position updates and the remaining open encounters can be finalized as well.
5. MOBA Encounter Metrics After detecting encounters, it is important to find compact and descriptive metrics to understand the initial setting of the encounters and the result of each encounter. To understand the initial setting, important metrics are the number of involved units, their Experience Points (XPs) corresponding to the level and the earned Gold corresponding to available items. Since XP and Gold depend on the player unit, we need to sum these values up for each of the teams.
Another influence on the encounter is the types of units in each of the teams. There are more the 100 different types of player units called heroes in DOTA and comparable MOBA games. Thus, considering the exact composition of each team does often not yield a generalized pattern. However, each of these units can be played to take a certain role in the

10
2016 Research Papers Competition Presented by:
game. In DOTA there are 10 generally approved roles a unit might take, e.g. Carry, Jungler and Pusher [see 15]. The role distribution for the unit is now the uniform likelihood that the player take one of the roles being available for his unit. For example, if a unit type can act as Pusher, Nuker or Carry, the class distribution would show ⅓ for these three roles and 0 for the remaining 7 other roles. In general, each unit can take between 2 and 4 roles. To describe the team composition, we accumulate over these role distributions for each unit in the team. The initial setting is important to examine how the odds are that a particular team wins an encounter.
To decide which team won an encounter, we also need to consider possible metrics. In general, the increase in XP and Gold of the team members at the end of the encounter, can be considered as a way to measure the result of an encounter. Furthermore, the outcome of the encounter can be measured by the amount of kills each team achieved during the encounter. In general, all three metric are connected because kills grant Gold and XP. However, being killed also prevents the player from increasing his Gold and XP for some time after encounter end.
Finally, after measuring the initial setting and the result of the encounter, we can evaluate the performance of each team during the encounter. This is typically measured by summarizing e.g. damage dealt, abilities used, etc. done during the encounter. The results are useful to analyze the contribution of each player within the encounter. In MOBAs and DOTA in particular, these measurements are hard to compare because encounters are rather dynamic w.r.t. members. This means that features should be normalized according to the amount of time a player took part in the encounter. However, this normalization cannot measure whether a player should have joined the encounter earlier or when to withdraw.
The positioning of a player can be summarized by the amount of combat outlinks and combat inlinks during the encounter. The summarized number of links is a measure of the average number of opponents being within damaging range and the average number of allies being within support range. Correspondingly, it is interesting to know how many opponents could inflict damage on a unit and whether there is a healer close by. Thus, we can characterize the contribution of a unit in the encounter by the average number of incoming and outgoing links over all components within the encounter. For example, a supporter should have a large number of close-by allies to support, but should usually stay away from the opponents. A ranged fighter should have a larger number of outlinks than inlinks to make use of the superior damage range. In the end, player performance within the encounter is also depending on timing ability usages and proper positioning which is still challenging to reflect.

11
2016 Research Papers Competition Presented by:
6. Experimental evaluation and analysis Our data set consist of detailed records of 412 DOTA matches. The match data are obtained by parsing replay files from DOTA, obtained from online replay repositories. Replay files are generated by the game client for the purpose of enabling match record sharing and analysis. The files include all of the information needed for another player´s game client to replay the match. Matches with incomplete data or where players left the game early were not included here.
The procedure for extracting spatio-temporal coordinates from DOTA replays is described in detail in Drachen et al. [11]. In brief, a game of DOTA happens in ticks representing 33 ms of wall time. During a state update, the game engine records the relevant changes and organizes this information in the replay files as a tick packet, which can contain multiple messages. This information is used by parsers such as Bruno´s [20] and Dotalys [21], which decode the packets. Dotalys was extended for use here to include Gold and XP team graphs among other features, and is open source [40]. The positions of heroes and other entities in the game are provided by a grid reference. The spatial information is represented in a two-level hierarchy: 1) a 128*128 grid overlay; 2) the position of the entity within the grid cell, determined by a vector. This permits precise spatial positioning.
6.1. Experiments In this section, we will show the results of our experimental evaluation and analyze the data set being described above. The majority of the analysis and the encounter detection itself was implemented using Python 2.7. For the prediction experiments, we used Weka 3.6 [22] as data mining library. The raw data was extracted from the replay file using Dotalys [21] and exported into a MySql database.
In a first set of experiments, we examine metrics to measure the current standings of a match. For these experiments, we examined the accumulated earned Gold and XP for each team. To show that both values are well-suited to understand who is currently more likely to win. We examine the likelihood that the team having more Gold or XP after a given time interval t wins the complete match. The result can be seen in Figure 5. The team having earned more Gold after the first five minutes already has a 70% chance to win the match. This increases up to a winning probability of up to 90% after 15 minutes. The graph for XP behaves very similar. Thus, XP and Gold are a good metric for determining which team is ahead. However, this raises the question where and when the differences in Gold and XP are generated during the game.
In the next set of experiments, we will examine how much of the Gold and XP gain happens during encounters. Furthermore, we will examine one of the major reasons for gaining an advantage in DOTA, killing other player units. Killing other players has two effects on the balance between teams, first of all the units being involved in the kill gain a considerable amount of Gold and XP. The second effect is that the killed player has to wait until his units

12
2016 Research Papers Competition Presented by:
Fig. 5: The winning probability of the team having more Gold or XP for the first 15 min.
respawns at the base. Until the respawn the player cannot continue to collect Gold and XP. Thus, the gap between the teams increases even wider.
The DOTA replays contained 16,714 death events of hero units, averaging 40.6 per match. We extracted 23,110 encounters based on the definition above. 18,744 (81.1%) of these encounters did not contain any kill events. Of these, about 50% of the encounters resulted in damage taken by either or both teams, with the remainder of the encounters not resulting in any damage, i.e. players from opposing teams were in range but did not initiate combat. For the encounters with damage, the majority were caused by players attacking creeps (AI bots) and being dealt damage by them in return. The remaining 4366 (18.9%) encounters comprise 16,556 death events (99.05%). The remaining 158 death events all happened through players using abilities that cover the entire map, or alternatively AI bots killing a player hero (a rare occurrence in the game, less than 1%). This demonstrates that the relevant part of the game happened during the detected encounters. Encounters occur throughout the map (Figure 6).
Figure 7 displays the percentage of gained Gold, gained XP and achieved kills happening during the detected encounters. We additionally measured the duration of the encounters compared to the match. Since encounters can occur simultaneously, we measured the time on a player bases. Thus, we accumulated the time each player was in any encounter compared to the complete time of the match and averaged this over all player units. As mentioned above the majority of encounters did not have a clear result and not considered further. Therefore, we run the same experiments on a reduced set of encounters where one team managed to kill more opponents than the other team. We will refer to these 4012 encounters as decisive encounters (Figure 7).

13
2016 Research Papers Competition Presented by:
Fig. 6: (left) Early-game encounter heatmap, 412 matches (first 10 mins. of the matches), showing encounters generally occuring along the border between the two team´s areas, (middle) example of encounter heatmap for one full DOTA match, showing a clear dominance of the Radiant team (home base lower left). (right) Late-game encounter heatmap, 412 matches (after 40 mins. of the matches), showing encounters generally occuring in the mid-lane of the map and the team home bases, as well as at the domain of Roshan, a neutral monster whose strength scales with match time. Fighting Roshan requires careful timing and planning.
Fig. 7: Encounter coverage of key DOTA match features. Decisive encounters are those resulting in one or more player deaths. Distribution of resource gains (XP, Gold) in the DOTA matches covered by encounters. The bulk of the XP and Gold generation that occurs outside encounters is the result of players landing last hits (killing) creeps (AI bots) or enemy defensive towers. Killing a creep results in XP and Gold rewards. Players very rarely die directly in combat with creeps or towers. Most of the kills are captured by the encounters, while allowing the analysis to ignore almost half the match time.
The results show that the 82% of the gained XP, 79% of the gained Gold were won during encounters. Which means that the killing of computer controlled units only had an impact of about 20%. As mentioned before the majority of kills are covered by encounters which is a result from the definition. Furthermore, the results indicate that the players are more than 30% of the time not involved in any encounter. The smaller set of decisive encounters comprised only 17% of all encounters. However, these still covered 69% of the gained XP and 68% of the gained Gold. The decisive encounters still cover 93% of the kills meaning that only 5% of the kills happened in encounters where both teams had an equal number of kills. It can also be seen that even though only the 17% of the encounters are decisive, the covered time was only 13% shorter than the time being covered by all encounters. Thus, we can conclude that decisive encounter take significantly longer than the non-decisive ones. To conclude, encounters cover the majority of relevant game play and can be used to automatically detect times of interesting game play.

14
2016 Research Papers Competition Presented by:
Fig. 8: Win prediction based on cumulated encounter outcomes. The encounter results are described by XP gain, Gold gain, and the number of killed opponents. Additionally, the blue line shows the performance of a combined model using all three metrics for the encounter result.
In the next experiment, we evaluate the proposed metrics for describing the outcome of an encounter, in order to predict the winner of a match. To combine the result of the first k encounter in a match, we simply sum up over the results of all previous encounters. Based on these metrics, we perform a classification experiment to predict the match winner after observing the result of the first k encounters. To achieve an independent test set for our model we employ 10-fold cross validation. As classifier we use logistic regression as implemented by [22]. We perform an experiment for each separate metric and we additionally build a combined model (Figure 8).
The results show that XP gain is weakest metric for this category. A reason might be that at the beginning of a match killing non-player units also provides sufficient XP and that in many matches player units reach the maximum level making additional XP irrelevant. Gold gain and kill difference on the other hand provide a better prediction of the match winner showing significantly larger prediction accuracies. The combined model can increase the prediction accuracy, especially after 3 to 6 observed encounters. To conclude the prediction accuracy indicates that all three metrics have a good correlation to the outcome of the match. Let us note that larger prediction accuracies would also indicate that the remaining game play becomes less relevant and thus, the game would need to be changed in order to keep open for a longer part of a match.
After evaluating the outcome of an encounter, we now turn to evaluating the metrics which describe the initial state of an encounter w.r.t. their predictive power to its result. We implemented a classification experiment describing each decisive encounter by a vector of metrics and then, train a model to predict which team had more kills in the encounter. To evaluate the predictive power of the metrics, we again performed a 10-fold cross validation experiments using logistic regression for classification. We evaluated 4 types of metrics describing the setup of each team: number of units, accumulated XP, accumulated Gold, and accumulated role distribution. As described in Section 6 the accumulated role distribution is based on the distribution of a unit type over the 10 possible roles the unit can take in DOTA. For each of these metrics, we performed a separated prediction experiment to

15
2016 Research Papers Competition Presented by:
Fig. 9: Prediction of win probabilities based on the initial situation in encounters, across four feature (number of units involved in the encounter, the distribution of hero roles, and the amount of accumulated Gold and XP during the encounter). The bottom bar shows the prediction using a combined model of all four features.
evaluate the metric independently. Furthermore, we trained a combined model using all the features mentioned above. The results are depicted in Figure 9.
Even though the number of involved players is the most obvious metric, it also provide the weakest prediction accuracy with about 67%. Distributing the amount of players over the roles they can take increases the prediction accuracy by 4% to 71%. The prediction accuracy being achieved based on the initial Gold and the initial XP for each team are comparable and allow to predict the outcome of the encounter with an accuracy of about 74%. Finally the combined model based on all 4 metrics achieved an accuracy of about 78%. Even though these prediction accuracies are not extremely high, they indicate that the initial setting already has an important impact on the outcome of an encounter. A higher prediction accuracy would indicate that game play within the encounter gets increasingly irrelevant compared to encounters having a favorable initial setting.
6.2. Defining DOTA match runtime metrics The accumulation of Gold and XP by DOTA teams, as well as their ability to eliminate opposing team´s players, is key factors in determining match outcome. This leads to the definition of new metrics for DOTA match commenting and performance evaluation, either at the team level or for each individual player (team level examples included here) (Figure 10):
Gold Gain Rate (GGR) is the Gold gained per minute for a team. This can range from zero and upwards and will fluctuate during a match. Gold Team Differential (GTD): is the difference in accumulated Gold gained across the two teams, , throughout the match up to the point of calculation. Experience Gain Rate (EGR): is the XP gained per minute for a team. This can range from zero and upwards and will fluctuate during a match. Experience Team Differential (ETD): is the difference in accumulated XP gained across the two teams, throughout the match up to the point of calculation. Kill Ratio (KR): is the kills made by one team as a function of kills made by the other team, accumulated throughout a match up to the point of calculation. The elimination of an opposing team´s player is an important event in the game because it slows down the opposing team and leads to an increase in the Gold and XP Differential, at least temporarily. As shown in Figure 8, kill difference is a strong predictor of match outcome.

16
2016 Research Papers Competition Presented by:
Fig. 10: Team Gold difference (left) and Team XP difference (right) for a DOTA match (pro skill tier). Notice the trend in the two curves indicating an accumulating difference in the resource gain rate for the two features (Team Gold and Team XP).
7. Conclusions and future work Multi-Player Online Battle Arena (MOBA) games are among the most played digital games today, and form a key component of the global esports environment [1-4]. Encounter-based analysis provides a framework breaking down complex dynamics into manageable components, as evidenced in the case of DOTA. The technique presented here can in principle be applied to any team-based, competitive esport. Validating the technique in other esports games and defining encounter types for other MOBAs form a line of future investigations. In DOTA, encounter outcomes can be predicted based on the initial conditions, and the outcome of encounters be used to predict match outcomes. This result highlights that DOTA is a game where reversals in team lead is difficult to manage as resource gain differential between teams tend to accelerate throughout a match. Having established an early lead, a team is statistically likely to win the match. The importance of resource gain differential and winning encounters naturally leads to the definition of metrics for evaluating team (and player) performance during match runtime. Digital games change continually during their lifetime as new patches are released and additional content is provided. Therefore, esports analytics techniques have to be adaptable to changing rules and player strategies. Encounter-based analysis facilitate this requirement. Recent work on esports analytics and MOBAs in particular has shown that there are a variety of ways in which to approach the problem of analysing gameplay, evaluate cyberathlete performance and predicting match outcomes [11-19]. The component encounter model for MOBA matches represents an attempt to condense gameplay to the most relevant part to analyze match outcomes and evaluate player/team performance. Though results indicate that general encounters can measure much of the relevant game play, there are multiple aspects being specific to DOTA which can be investigated to deepen the understanding of encounters. For example, the role of player items and the damage being caused by computer controlled entities. Especially, defense towers have a measurable impact on the outcome of the game and play an important role in the player positioning. Thus, including defense towers and item usage to encounter-based analysis is a step towards understanding the player behavior within an encounter. Another approach to improve the outcome of encounters and matches is to increase the granularity of units to specific types of units. However, this approach requires a strongly increased database of matches.
17
2016 Research Papers Competition Presented by:
References [1] SuperData Research (2014, April). eSports Digital Games Market Trends Brief. Retrieved from: http://gallery:mailchimp:com/a2b9207999131347c9c0c44ce/files/SuperData Research eSports Brief.pdf [2] Tassi, P. (2015, December). Monstrous Viewership Numbers Show “League of Legends” Is Still eSports King. Forbes. Retrieved from: http://www.forbes.com/sites/insertcoin/2015/12/11/monstrous-viewership-numbers-show-league-of-legends-is-still-esports-king/ [3] Gaudiosi, J. (2012, July). Riot games’ league of legends officially becomes most played pc game in the world. Forbes. Retrieved from: http://www:forbes:com/sites/johngaudiosi/2012/07/11/riot-games-league -of-legends-officially-becomes-most-played-pc-game-in-the-world/ [4] Valve Corporation (2012) The International DOTA 2 championships official website. Retrieved from: http://www:DOTA:com/international/overview/ [5] Lewis, M. (2004). Moneyball: The Art of Winning an Unfair Game. W. W. Norton and Company. [6] Lindsey, G. R. (1959). Statistical Data Useful for the Operation of a Baseball Team. Operations Research, 7(2), 197-207. [7] Wei, X., Lucey, P., Morgan, S. and Sridharan, S. (2013). “Sweet-Spot”: Using Spatiotemporal Data to Discover and Predict Shots in Tennis. Paper presented at the 7th Annual MIT Sloan Sports Analytics Conference, Boston, MA. [8] Franks, A., Miller, A.; Bornn, L. and Goldsberry, K. (2015). Counterpoints: Advanced Defensive Metrics for NBA Basketball. Paper presented at the 9th Annual MIT Sloan Sports Analytics Conference, Boston, MA. [9] El-Nasr, M. S., Drachen, A. and Canossa, A. (2013). Game analytics: Maximizing the value of player data. Springer Publishers. [10] Alamar, B. and Mehrotra, V. (2012, February). Beyond Moneyball: The Future of sports analytics. Analytics Magazine. Retrieved from: http://www.analytics-magazine.org/special-articles/525-beyond-moneyball-the-future-of-sports-analytics [11] Drachen, A., Yancey, M., Maquire, J., Chu, D., Wang, Y. I., Mahlman, T., Schubert, M. and Klabjan, D. (2014). Skill-Based Differences in Spatio-Temporal Team Behavior in Defence of the Ancients 2 (DotA 2). In Proceedings of the Consumer Electronics Society Games, Entertainment, Media Conference, Toronto, Canada. [12] Rioult, R., Metivier J.-P., Helleu, B., Scelles, N., Durand, C. et al. (2014). Mining tracks of competitive video games. Proceedings of AASRI Conference on Sports Engineering and Computer Science, London, England. [13] Sifa, R., Bauckhage, C. and Drachen, A. (2014). The playtime principle: Large scale cross-games interest modelin. Proceedings of the IEEE Computational Intelligence in Games, Bonn, Germany. [14] Orland, K. (2014, September) Introducing steam gauge: Ars reveals steams most popular games. Retrieved from: http://arstechnica:com/gaming/2014/04/introducing-steam-gaugears-reveals-steams-most-popular-games [15] Eggert, C., Herrlich, M., Smeddinck, J. and Malaka, R. (2015). Classification of Player Roles in the Team-Based Multi-player Game Dota 2. Proceedings of Entertainment Computing, LNCS 9353, 112-125, Trondheim, Norway. [16] Gao, L., Judd, J., Wong, D., Lowder, J. (2013). Classifying dota 2 hero characters based on play style and performance. Report for Univ. of Utah Course on ML. Retrieved from: http://spotidoc.com/doc/163929/classifying-dota-2-heroes-based-on-play-style-and-perform... [17] Ong, H. Y., Deolalikar, S. and Penge, M. V. (2015) Player Behavior and Optimal Team Composition in Online Multiplayer Games. Stanford University, arXiv:1503.02230 [cs.SI]. Retrieved from: http://arxiv.org/abs/1503.02230 [18] Yang, P. Harrison, B. and Roberts, D. L. (2014). Identifying patterns in combat that are predictive of success in moba games. Proceedings of the Foundations of Digital Games, Miami, Florida, USA. [19] Batsford, T. (2014). Calculating optimal jungling routes in dota 2 using neural networks and genetic algorithms. Game Behaviour, 1(1). [20] Carlucci, B. (2013, January). Bruno’s replay parser. Retrieved from: http://www:cyborgmatt:com/2013/01/dota-2-replay-parser-bruno/ [21] Mahlmann, T. (2014, March). Dotalys2. Retrieved from: http://www:lighti:de/dotalys-2 [22] Hall, M., Frank, E., Holmes, G., Pfahringer, B., Reutemann, P. and Witten, I. H. (2009). The WEKA Data Mining Software: An Update. SIGKDD Explorations, 11(1).

18
2016 Research Papers Competition Presented by:
Appendix The below pseudocode shows the complete method for encounter detection in MOBAs.
Algorithm: Encounter Detection Encounter Detection (position_stream) Open_encounters = [] Closed_encounters=[] Position_table = int[player_number][2] Distance_table = float[player_number][ player_number] While position_stream.hasNext(): tick,unit,pos = stream.next() update_position(position_table,unit,pos)
update_distance(position_table,distance_table,unit,pos) component = build_component(unit,distance_table) if component is not combat component: continue predecessors(component, open_encounters) if predecessors.size() == 0: open_encounters.add(new Encounter(component) if predecessors.size() == 1: predecessors.get(1).update(component) if predecessors.size() >1: open_encounters.remove(predecessors) joint_encounter = join(predecessors) joint_encounter.update(component) open_encounters.add(joint_encounter) for encounter in open_encouters: if encounter has timeout: open_encounters.remove(encounter) closed_encounters.add(encounter) for encounter in open_encouters: open_encounters.remove(encounter) closed_encounters.add(encounter) return closed_encounters