espon internal seminar 5-6 december 2012 in paphos territorial trends and perspectives related to...
TRANSCRIPT

ESPON Internal Seminar 5-6 December 2012 in Paphos
Territorial Trends and Perspectives Related to the European Neighbourhood

Structure
The European Territory, The Neighbourhood, The World
– Globalisation, Crises and Climate Change– New Markets and Trade Flows– Population, Employment and Wealth– Access, Connections and Cooperation– Conclusions

The enlarging territorial context
• Today a wider territorial perspective is necessary • No place can today
develop in isolation• Competition is
increasingly world-wide and no longer a zero-sum-game within Europe or a nation
World City Network, 2008

Internet Users in the world, 1999-2009Average annual growth rate
• The world is rapidly changing• New markets• New flows• New
interdependencies• New connections

• European networks of cities servicing global capital more evenly spread and balanced than among other global players
• London remains Europe’s top-ranking centre followed by Paris, Milan and Madrid. Other particular high performer cities are Brussels, Munich and Amsterdam.
• Challenge to keep the position of Europe’s major global cities while exploiting second tier cities global opportunities to both grow and balance territories.
• Skt. Petersburg and Istanbul,Ankara important in the Neighbourhood
Places servicing global capital, 2000-2008
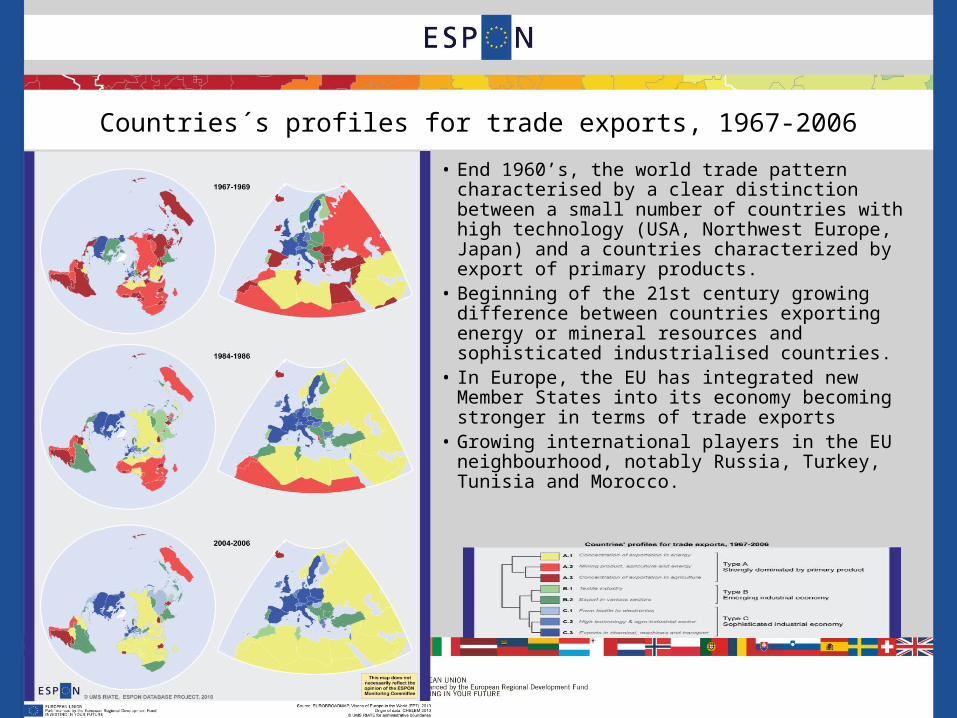
• End 1960’s, the world trade pattern characterised by a clear distinction between a small number of countries with high technology (USA, Northwest Europe, Japan) and a countries characterized by export of primary products.
• Beginning of the 21st century growing difference between countries exporting energy or mineral resources and sophisticated industrialised countries.
• In Europe, the EU has integrated new Member States into its economy becoming stronger in terms of trade exports
• Growing international players in the EU neighbourhood, notably Russia, Turkey, Tunisia and Morocco.
Countries´s profiles for trade exports, 1967-2006

Aggregate potential impact of climate change
Legend
• Impacts hits hardest in south of Europe and in western territories facing the sea
• Double challenge in the south as same areas have the lowest adaptive capacity

• Population growth strongest in southern and eastern Mediterranean countries
• Eastern European Neighbourhood largely showing population decline
• In the EU positive growth apart from Eastern Germany, parts of Poland, northern Scandinavia, parts of Scotland and Spanish regions in the north-west
Population Growth 1990-2010

• The European population only increasing slowly towards 2013.
• In the EU, a trend of East-West divide in demographic development is visible, mostly due to a negative migration balance in Eastern Europe.
• Europe is getting older and the median age in 2030 will in some regions exceed 50 years.
• Migration plays a key role for population growth in Europe.
• Towards 2030, population growth will be significantly higher in neighbouring countries to the South sustaining a particular migratory pressure on Europe
Population in EU and its neighbourhood in 2030

• Most dominant differences between Europe (including Turkey) and North Africa, and between Finland and Russia.
• Economic divisions within Europe between west and east, and before the crisis, between Greece and Cyprus.
• Noticeable additional discontinuity between Northern Africa and countries across the Sahara
• Divisions in economic wealth in the EU between east-west parallel to demographic perspectives
Discontinuities in GDP per capita, 2008

• Regional labour force developed most favourably in the northern core of Europe
• Ireland, Iceland and Romania have relatively lost employment
• Some countries in the Balkans have witnessed strong decline
Regional Employment Rates (labour force), 2000-2010
11

• The strongest regions in Science and Technology human resources in the north western part of Europe
• The largest cities visible as key places for this segment of the labour force
• In Turkey, the Ankara region is the strongest player
Human Resources in Science and Technology 2009
12

• Younger people (30-34) with tertiary education particularly low in the south-eastern countries, including Turkey
• Portugal and parts of northern Germany and central Poland under EU average as well
• Western and Northern Europe have the most educated younger population
• Capital cities in general scoring best within the country
Tertiary Education of Population aged 30-34, 2010

• Accessibility and connectivity a central agglomeration benefit and driver in the economic and social development of places
• Air accessibility, Europe appears as a mosaic with regions of high, medium and low number of destinations served
• Modifications of destinations since 2001 changing regional air access, both positively and negatively
• Low cost air carriers involve risks for long-term air accessibility
• Only regions with large international airports seem to ensure a stable position of air accessibility.
• Air connections seem to support European polycentric development and important for world integration
Airports – Number of destinations served

• Nearly half (46%) of EU27+4 international bilateral treaties are with the EU neighbourhood
• Without NO, SW, and IS the share falls to 193 (25%): 7% for Mediterranean countries, 8% for Western Balkans, 10% for Eastern neighbors, including Russia.
• Intensification of political relations is clear in the East (Russia, Ukraine, Moldova), except for Belarus.
• The political cooperation with the Western Balkans countries is also increasing
• Contrary, the Mediterranean neighborhood is generally trailing behind
• 5
Cooperation with Neighbourhood: Bilateral Treaties

Conclusions (1)– Living conditions in neighbourhood countries are in general
well below the EU average, however a more wealthy middle class is growing increasing the demand
– European trade needs diversifying opening new markets keeping the US and EU neighbourhood as important trade partners
– In terms of trade, the neighbourhood have a position with regions specialized in low value added goods but also an increasing pressure from countries with lower labour costs
– Population growth and migration pressure originates mainly from the Southern neighbourhood
– The Eastern neighbourhood not characterized by migration pressures, more by border restrictions hampering a free flow of people and goods
Conclusions (2)
– GDP discontinuities largest in the southern neighbourhood releasing northbound migration pressure
– Climate change seems not to affect the eastern neighbourhood as severely as the southern neighbourhood
– Skt. Petersborg and Istanbul/Ankara are potential world cities and potential partners in metropolitan cooperation
– Cities at north-African shores should be considered potential cooperation partners with cities in the EU
– Access by air to the neighbourhood overall not so bad, however many smaller airports sensitive to crisis
– International treaties favours (currently) the markets in the eastern neighbourhood
