esn analyser - exprivia · esn analyser general industrials cembre (neutral) q1-18e results should...
TRANSCRIPT

Produced & Distributed by the Members of ESN (see last page of this report)
Page 1 of 56
14 May 2018
ESN Top Picks
Roadshows
Corporate Events
Tactical Sector Views
ESN European Top Picks
Arcelormittal (OUT) – Blue Chips
RECOMMENDATION CHANGES
El.En. downgraded to Neutral from Buy Results Preview
STRATEGY NEWS
European Strategy News: Finnish companies’ Q1 results: Fairly in line with expectations
NEWS BY SECTOR ALTERNATIVE ENERGY SIF group (Buy) New monopile market opening up
AUTOMOBILES & PARTS Fiat Chrysler Automobiles (Buy) The Trump administration wants to raise the custom duties on Europe-imported cars
to 20% Landi Renzo (Neutral) Q1 2018 results: we see a moderate improvement
BANKS Banca Carige (Rating Suspended) Q1 18 results back to a small profit Banca MPS (Buy) Feed-back from results presentation Deutsche Pfandbriefbank (Neutral) Q1 results better than expected Mediobanca (Accumulate) Feed-back from results presentation UBI Banca (Neutral) Feed-back from results presentation
BASIC RESOURCES Altri (Accumulate) 1Q18 post comment: EBITDA 57.7% YoY The Navigator Company (Neutral) 1Q18 comment and valuation update
CHEMICALS K+S AG (Neutral) Q1 a bit light not only because of the USD
FINANCIAL SERVICES Anima (Accumulate) We expect a strong Q1-18 thanks to Aletti SGR Banca Sistema (Neutral) Q1 18 results slightly lower than expected
FOOD & DRUG RETAILERS Marr (Neutral) Q1 18 preview: expected results without particular surprises
ESN Analyser
Investment Research

Produced & Distributed by the Members of ESN (see last page of this report)
Page 2 of 56
ESN Analyser
GENERAL INDUSTRIALS Cembre (Neutral) Q1-18e results should be coherent with full year trends
HEALTHCARE Abivax (Buy) On track to deliver topline data in ulcerative colitis in 2H18 Biotest (Neutral) Error! No text of specified style in document. El.En. (Neutral) Results Preview
HOUSEHOLD GOODS Philips Lighting (Neutral) Small Chinese add on acquisition
INDUSTRIAL ENGINEERING Carraro (Buy) We expect flattish Q1 2018 results
INSURANCE Cattolica Assicurazioni (Accumulate) Q1-18 CC feedback UnipolSai (Neutral) Conference call feedback: no material news emerged
MATERIALS, CONSTRUCTION & INFRASTRUCTURE Astaldi (Reduce) Weaker results expected in Q1 Atlantia (Accumulate) Sound results in Q1 Saint Gobain (Buy) Sika: knock and the door will be opened
MEDIA Arnoldo Mondadori Editore (Neutral) Earnings downgrade Teleperformance (Accumulate) An interest in Convergys?
OIL & GAS PRODUCERS Neste Corporation (Neutral) Reuters: Biofuels waivers to be reduced
PERSONAL GOODS Luxottica (Accumulate) SGH increases its distribution in the US
REAL ESTATE Hispania Activos Inmobiliarios (Sell) 1Q18 results. Growth continues lar España (Buy) Good 1Q18 results
SOFTWARE & COMPUTER SERVICES Exprivia (Accumulate) Q1 2018 Pre: ITALTEL enters the consolidation perimeter Rovio Entertainment (Buy) Q1pre: Eyes on ARPPU trend and user acquisition costs
SUPPORT SERVICES ENAV (Accumulate) Steady results expected in Q1 Fiera Milano (Accumulate) Good Q1 18 results
TECHNOLOGY HARDWARE & EQUIPMENT Besi (Accumulate) Reporting troubles at KNS, but outlook stays strong
Produced & Distributed by the Members of ESN (see last page of this report)
Page 3 of 56
ESN Analyser
TELECOMMUNICATIONS Wind Tre Q1 2018: another weak quarter pending Iliad’s entry Masmovil (Accumulate) Not a strategic investment for ACS
UTILITIES Acciona (Buy) Good 1Q18 results EDP (Accumulate) CTG launches a voluntary take-over bid on EDP EDP Renováveis (Neutral) CTG launches mandatory take-over bid

Produced & Distributed by the Members of ESN (see last page of this report)
Page 4 of 56
Blue Chips Top Picks
Compa ny Count r y S e c t or I de a Ra t i ngP r i c e a s of
13 / 0 5 / 2 0 18
Ta r ge t
P r i c e
Upsi de /
Downsi deEnt r y da t e
Ent r y
pr i c e
Ent r y
pr i c e
( D i v .
Adj )
Tot a l
Re t ur n
Ent r y To
Da t e
Re l . Cml . d
pe r f . v s Eur o
S t ox x
AS M L Net herlands Technology Hardware & EquipmentLong Buy 167.25 200.00 20% 13/ 02/ 2018 158.05 156.65 6 . 8 % 4.6%
ENDES A Spain Ut ilit ies Long Accumulat e 19.46 22.50 16% 23/ 04/ 2018 17.80 17.80 9 . 3 % 7.1%
I NDI TEX Spain General Ret ailers Long Buy 26.75 35.50 33% 15/ 03/ 2018 24.21 24.21 10 . 5 % 6.1%
I NTES A S ANP AOLO It aly Banks Long Accumulat e 3.15 3.50 11% 14/ 03/ 2018 3.10 3.10 1. 5 % -3.8%
LEONARDO It aly Aerospace & Def ense Long Buy 9.61 12.25 27% 07/ 02/ 2018 9.06 9.06 6 . 1% 6.1%
P UM A Germany Personal Goods Long Buy 414.00 492.00 19% 28/ 02/ 2018 385.50 373.00 11. 0 % 3.7% source: ESN Members’ estimates
M/S Caps Top Picks
Compa ny Count r y S e c t or I de a Ra t i ngP r i c e a s of
13 / 0 5 / 2 0 18
Ta r ge t
P r i c e
Upsi de /
Downsi deEnt r y da t e
Ent r y
pr i c e
Ent r y pr i c e
( D i v . Adj )
Tot a l
Re t ur n
Ent r y To
Da t e
Re l . Cml . d
pe r f . v s
Eur o
S t ox x
ACERI NOX Spain Basic Resources Long Buy 11.90 14.00 18% 01/ 03/ 2018 12.30 12.30 - 3 . 3 % -6.7%
ARCADI S Net herlands General Indust r ials Long Buy 16.45 25.00 52% 27/ 03/ 2018 15.06 14.59 12 . 7 % 4.7%
BI OCARTI S Belgium Healt hcare Long Buy 13.04 15.90 22% 12/ 04/ 2018 12.66 12.66 3 . 0 % -1.2%
BOS KALI S WES TM I NS TER Net herlands Mat erials, Const ruct ion & Inf rast ruct ure Long Buy 23.88 33.00 38% 26/ 03/ 2018 23.78 23.78 0 . 4 % -6.9%
CORES TATE CAP I TAL HOLDI NG S . A . Germany Financial Services Indust r ials Long Buy 46.65 72.00 54% 13/ 02/ 2018 49.35 47.35 - 1. 5 % -7.2%
FERRATUM Germany Financial Services Banks Long Buy 26.50 30.00 13% 13/ 02/ 2018 26.45 26.27 0 . 9 % -4.8%
J UM BO Greece General Ret ailers Long Buy 15.18 17.00 12% 11/ 10/ 2017 15.38 15.21 - 0 . 2 % 0.6%
KWS S AAT Germany Chemicals Long Buy 299.00 348.00 16% 05/ 01/ 2018 293.00 293.00 2 . 0 % 0.4%
P I AGGI O It aly Aut omobiles & Part s Long Buy 2.18 3.10 42% 16/ 01/ 2018 2.36 2.30 - 5 . 0 % -8.5%
S AI P EM It aly Oil Services Long Buy 3.40 4.40 29% 30/ 04/ 2018 3.36 3.36 1. 2 % -1.0%
S I F GROUP Net herlands Alt ernat ive Energy Long Buy 18.70 22.00 18% 01/ 03/ 2018 17.20 16.90 10 . 7 % 7.0%
S ONAE CAP I TAL Port ugal Travel & Leisure Long Buy 1.02 1.05 3% 19/ 04/ 2018 0.94 0.94 8 . 1% 3.3%
THE NAVI GATOR COM P ANY Port ugal Basic Resources Long Neut ral 4.97 5.10 3% 19/ 03/ 2018 4.50 4.50 10 . 4 % 10.9%
VALM ET Finland Indust r ial Engineering Long Buy 15.89 18.50 16% 05/ 03/ 2018 16.06 16.06 - 1. 1% -6.8% source: ESN Members’ estimates
This selection of stocks is not intended to provide a recommended portfolio; therefore there is no point in comparing its performance with any benchmark. The performance of each stock has to be considered independently. Risk factors are taken into account when selecting individual stocks but the risk profile of the selection as a whole is not considered. The approach used to select each investment idea is opportunistic with
an absolute return target.
ESN Top Picks
Produced & Distributed by the Members of ESN (see last page of this report)
Page 5 of 56
ESN Top Picks
ESN European Top Picks
Arcelormittal (OUT) – Blue Chips
ArcelorMittal released 1Q18 results.
EBITDA came in 8% above consensus and our estimates.
According to the document released the outlook for 2018 improve throughout the year. The acquisition of Ilva is expected to be completed in 2Q, having already received the greenlight on behalf of the EU.
Produced & Distributed by the Members of ESN (see last page of this report)
Page 6 of 56
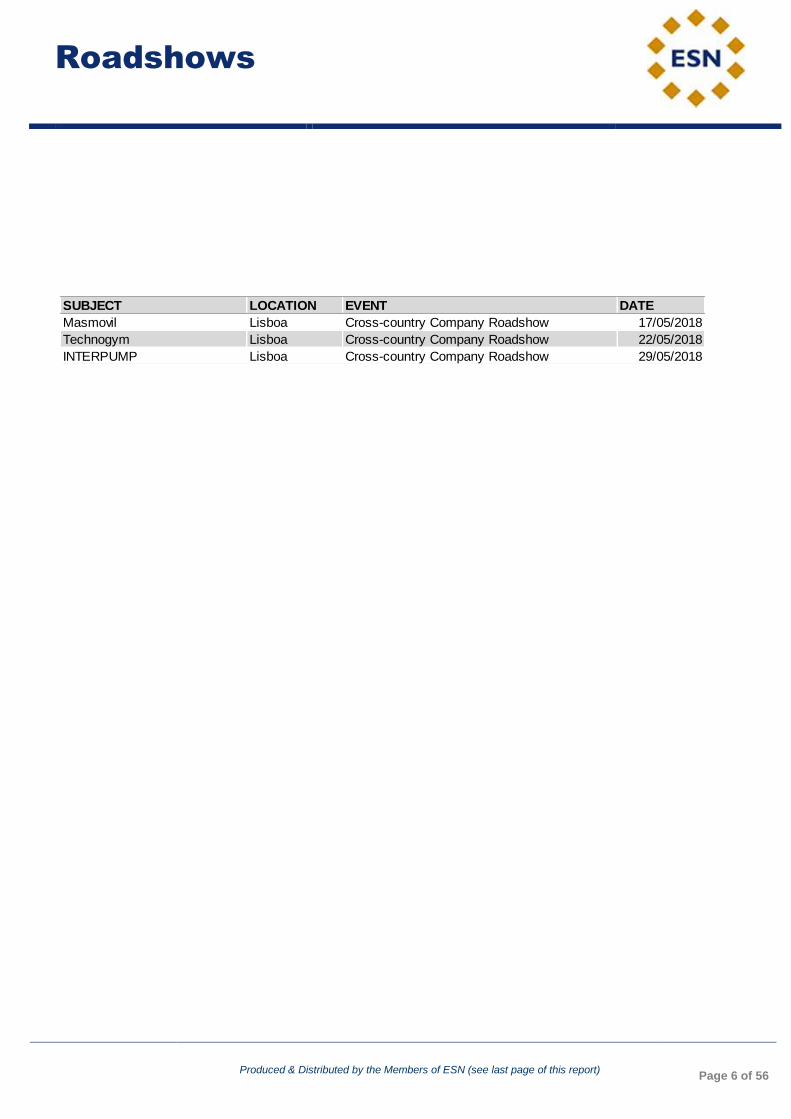
SUBJECT LOCATION EVENT DATE
Masmovil Lisboa Cross-country Company Roadshow 17/05/2018
Technogym Lisboa Cross-country Company Roadshow 22/05/2018
INTERPUMP Lisboa Cross-country Company Roadshow 29/05/2018
Roadshows
Produced & Distributed by the Members of ESN (see last page of this report)
Page 7 of 56
Corporate Events
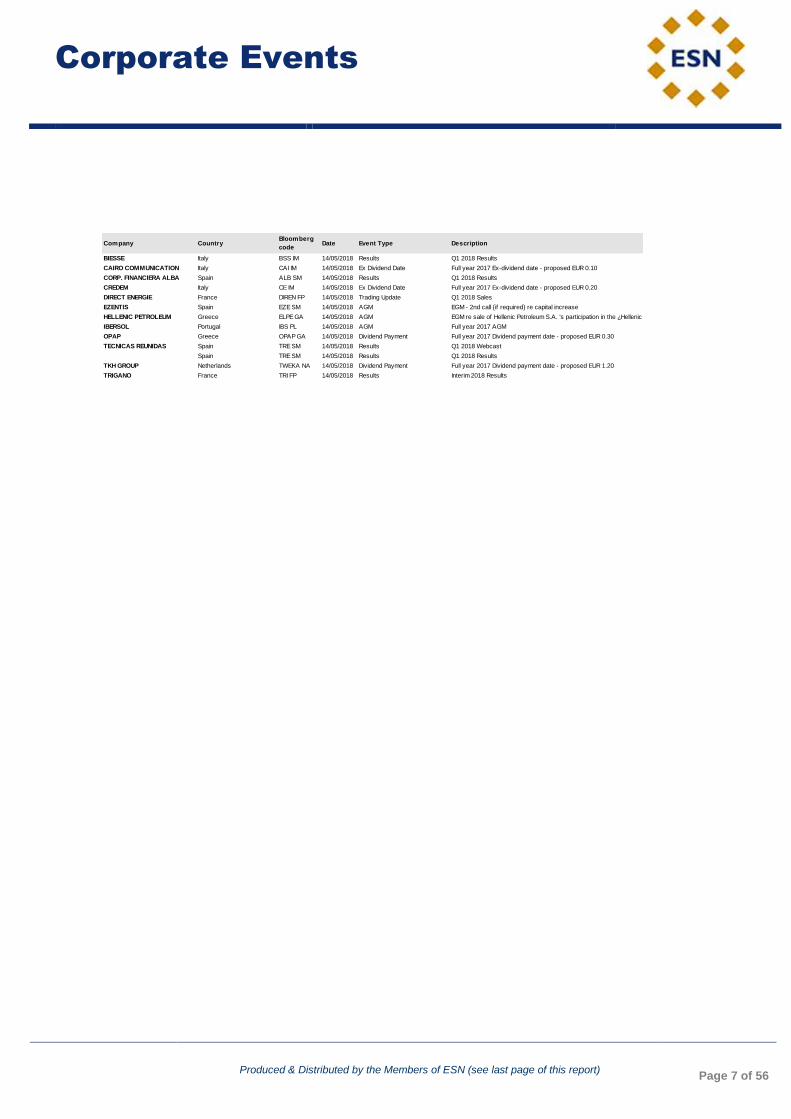
Company CountryBloomberg
codeDate Event Type Description
BIESSE Italy BSS IM 14/05/2018 Results Q1 2018 Results
CAIRO COMMUNICATION Italy CAI IM 14/05/2018 Ex Dividend Date Full year 2017 Ex-dividend date - proposed EUR 0.10
CORP. FINANCIERA ALBA Spain ALB SM 14/05/2018 Results Q1 2018 Results
CREDEM Italy CE IM 14/05/2018 Ex Dividend Date Full year 2017 Ex-dividend date - proposed EUR 0.20
DIRECT ENERGIE France DIREN FP 14/05/2018 Trading Update Q1 2018 Sales
EZENTIS Spain EZE SM 14/05/2018 AGM EGM - 2nd call {if required} re capital increase
HELLENIC PETROLEUM Greece ELPE GA 14/05/2018 AGM EGM re sale of Hellenic Petroleum S.A. 's participation in the ¿Hellenic Gas Transmission System Operator (DESFA) S.A
IBERSOL Portugal IBS PL 14/05/2018 AGM Full year 2017 AGM
OPAP Greece OPAP GA 14/05/2018 Dividend Payment Full year 2017 Dividend payment date - proposed EUR 0.30
TECNICAS REUNIDAS Spain TRE SM 14/05/2018 Results Q1 2018 Webcast
Spain TRE SM 14/05/2018 Results Q1 2018 Results
TKH GROUP Netherlands TWEKA NA 14/05/2018 Dividend Payment Full year 2017 Dividend payment date - proposed EUR 1.20
TRIGANO France TRI FP 14/05/2018 Results Interim 2018 Results
Produced & Distributed by the Members of ESN (see last page of this report)
Page 8 of 56
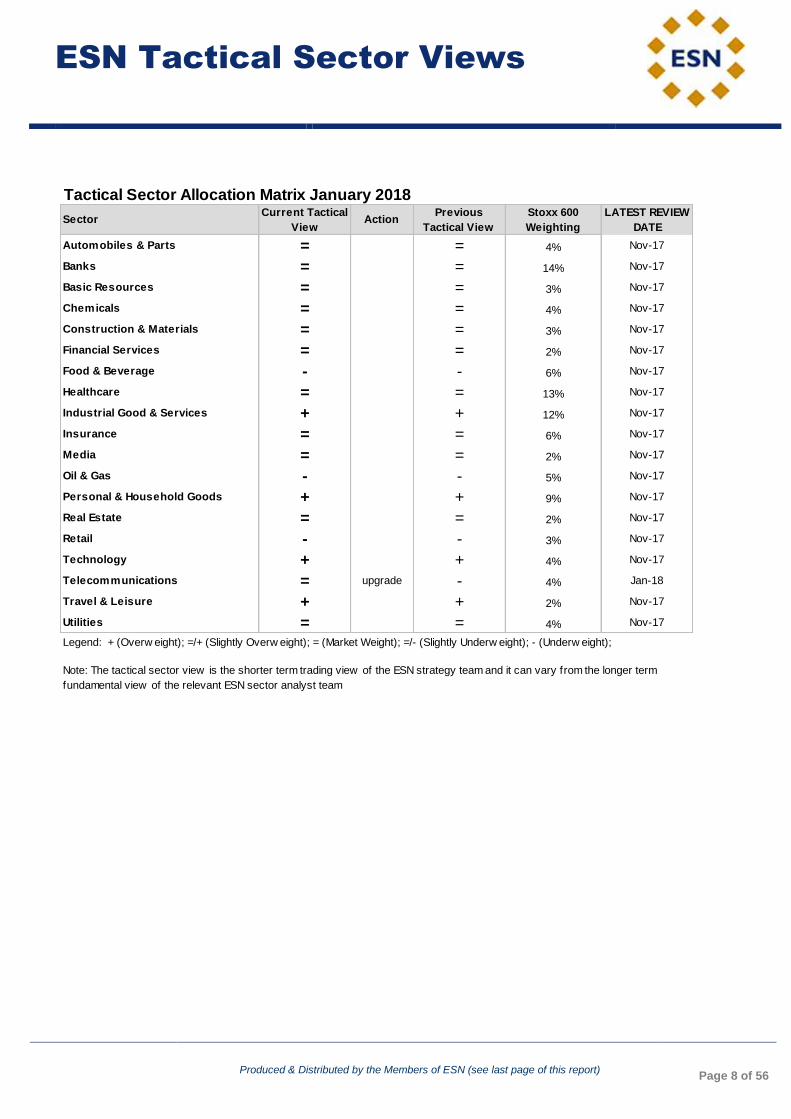
Tactical Sector Allocation Matrix January 2018
SectorCurrent Tactical
ViewAction
Previous
Tactical View
Stoxx 600
Weighting
LATEST REVIEW
DATE
Automobiles & Parts = = 4% Nov-17
Banks = = 14% Nov-17
Basic Resources = = 3% Nov-17
Chemicals = = 4% Nov-17
Construction & Materials = = 3% Nov-17
Financial Services = = 2% Nov-17
Food & Beverage - - 6% Nov-17
Healthcare = = 13% Nov-17
Industrial Good & Services + + 12% Nov-17
Insurance = = 6% Nov-17
Media = = 2% Nov-17
Oil & Gas - - 5% Nov-17
Personal & Household Goods + + 9% Nov-17
Real Estate = = 2% Nov-17
Retail - - 3% Nov-17
Technology + + 4% Nov-17
Telecommunications = upgrade - 4% Jan-18
Travel & Leisure + + 2% Nov-17
Utilities = = 4% Nov-17
Legend: + (Overw eight); =/+ (Slightly Overw eight); = (Market Weight); =/- (Slightly Underw eight); - (Underw eight);
Note: The tactical sector view is the shorter term trading view of the ESN strategy team and it can vary from the longer term
fundamental view of the relevant ESN sector analyst team
ESN Tactical Sector Views

For important disclosure information, please refer to the disclaimer page of this report Page 9 of 56
Sources: OP, Factset, Inquiry Financial, Reuters, SM E Direkt, Vara Research
Finnish companies Q1 2018 results vs. consensus
25 30
24
179
10
29 3236
0%
25%
50%
75%
100%
Sales EBIT EPS
Above expectations In line Below expectations
Finnish companies’ Q1 results: Fairly in line with expectations
In the Q1 earnings season, Finnish companies in general performed nearly as expected. In terms of sales and EBIT, there was
more or less an equal number of both positive and negative surprises even though surprises related to EPS were mainly negative.
The total sales of all companies were in line with consensus forecasts and operating profit was 1.7% below forecasts. Excluding
Nokia, total EBIT was 0.9% higher than consensus. In spite of balanced earnings surprises, the share price reactions of HEX25
companies were mainly negative.
In Q1 2018, the aggregate sales of the Finnish companies in our coverage increased by 1.0% YoY and operating profits by 4.5%.
However, Nokia had a notable effect on the universe as its earnings reduced considerably (-30% YoY). When Nokia is excluded,
total sales increased 2.3% and EBIT 7.1%. The earnings momentum of Nasdaq OMX Helsinki remained relatively stable in
relation to previous quarters. Measured by number, 63% of companies managed to increase their operating profit YoY, which is
slightly below the percentage in the previous quarter (Q4/2017: 70%).
In terms of sectors, the forestry and energy sectors’ performance was solid with regard to the comparison period and consensus
estimates similar to the previous quarter. In terms of sectors, there was weak performance in relation to both the comparison
period and consensus estimates in the construction, healthcare and technology sectors (Nokia). Consumer sector’s performance
was weak in relation to expectations.
Analyst:
Antti Saari, OP Corporate Bank
+358 10 252 4359
Finnish Strategy Update Summary
European Strategy News: Finnish companies’ Q1 results: Fairly in line with expectations
Analyser 14 May 2018

SIF group
For important disclosure information, please refer to the disclaimer page of this report Page 10 of 56
New monopile market opening up
The facts: On April 30 Jan de Nul announced that it has won its 2nd
contract in
Taiwan. Jan de Nul will not only be responsible for the Formosa 1 Phase 2 project
(120 Mw capacity) but will also be responsible for the Changhua Offshore Wind farm
project (on an EPCI basis) with a capacity of 64 mw, in cooperation with Hitachi.
The project is part of the Taiwanese target of installing 5.5 Gw of offshore wind
capacity in the near term. Construction of foundations is expected in 2019 with
installation expected to start early 2020.
Our analysis: We spoke with Jan de Nul representatives on the OTC in Houston a
little over a week ago and learned that both projects (Formosa Phase 2 and
Changhua) will be opting for monopiles. This is a surprising development given that
there have been strong signals (also from SIF) that the Taiwanese market would be
more a jacket market than a monopile market due (1) to a lack of a supply chain for
monopiles and (2) because of the geology (deep levels of sediment).
Now that Jan de Nul has won the EPCI contract for Formosa and Changhua based
on a monopile design, it is clear that there is another market opening up for EEW
and SIF and possibly Steelwind. That in itself is positive as it is clear that with a 5.5
Gw target set by the Taiwanese government, more orders are up for grabs.
We also learned at the OTC that EEW is close to making a final investment decision
on the expansion of its manufacturing site in Korea (part of EEW SPC). This would
allow EEW to manufacture semi-finished product and ship those units using barges
to Korea after which final assembly and coating will take place in Korea before load
out to Taiwan. That is obviously positive for SIF because if EEW is making such an
investment to obtain orders in Taiwan, it has less capacity available to win projects
in Europe, which remains the key market for SIF for now. SIF is working hard to
prepare itself for the Japanese, Indian and North American market but has not
secured any orders so far.
Conclusion & Action: The US market is moving forward at an incredible pace and
now the Taiwanese market is also opening up, providing new opportunities for
monopile players like EEW and SIF. For now, EEW seems to have the better cards
than SIF but if EEW wins orders in those regions, it also means that there is less
capacity for EEW to compete for orders in Europe. That is positive for SIF in terms
of volumes (and thus utilisation) but probably also in terms of pricing. We rate the
shares Buy as SIF represents the cheapest option to gain exposure to renewable
energy (FY19 EV/EBITDA <5x).
SIF group
Netherlands | Alternative Energy
ALTERNATIVE ENERGY SIF group (Buy) Finnish companies’ Q1 results: Fairly in line with expectations
Analyser 14 May 2018
Analyst(s)
Martijn den Drijver
+312 0 5508636
Buy
18.70
closing price as of 11/05/2018
22.00
17.6%Upside/Downside Potential
Target Price unchanged
Recommendation unchanged
Target price: EUR
Share price: EUR
Reuters/Bloomberg SIFG.AS/SIFG NA
Market capitalisation (EURm) 477
Current N° of shares (m) 26
Free float 23%
Daily avg. no. trad. sh. 12 mth 55
Daily avg. trad. vol. 12 mth (m) 374.83
Price high/low 12 months 14.82 / 20.80
Abs Perfs 1/3/12 mths (%) -2.81/16.88/-3.66
Key financials (EUR) 12/17 12/18e 12/19e
Sales (m) 327 267 373
EBITDA (m) 55 40 88
EBITDA margin 16.7% 15.0% 23.5%
EBIT (m) 41 27 75
EBIT margin 12.7% 10.1% 20.0%
ROCE 26.2% 17.9% -17.0%
Net debt/(cash) (m) 25 8 (44)
Net Debt/Equity 0.3 0.1 -0.3
Debt/EBITDA 0.5 0.2 -0.5
EV/Sales 1.4 1.8 1.2
EV/EBITDA 8.6 12.1 4.9
EV/EBITDA (adj.) 8.6 12.1 4.9
EV/EBIT 11.3 17.9 5.8
P/E (adj.) 14.4 24.3 8.5
P/BV 4.8 4.5 3.1
OpFCF yield 5.9% 5.2% 12.6%
Dividend yield 1.6% 1.6% 4.1%
EPS (adj.) 1.21 0.77 2.21
BVPS 3.66 4.12 6.02
DPS 0.30 0.30 0.77
Shareholders
Egeria 69%; Vanguard 3%; Farringdon 3%; BNP Paribas
2.00%; Delta Lloyd 1.80%;
14
15
16
17
18
19
20
21
22
Apr 17 May 17 Jun 17 Jul 17 Aug 17 Sep 17 Oct 17 Nov 17 Dec 17 Jan 18 Feb 18 Mar 18 Apr 18 May 18
vvdsvdvsdy
SIF GROUP Amsterdam Small Cap Index (Rebased)
Source: Factset
Fiat Chrysler Automobiles
For important disclosure information, please refer to the disclaimer page of this report Page 11 of 56
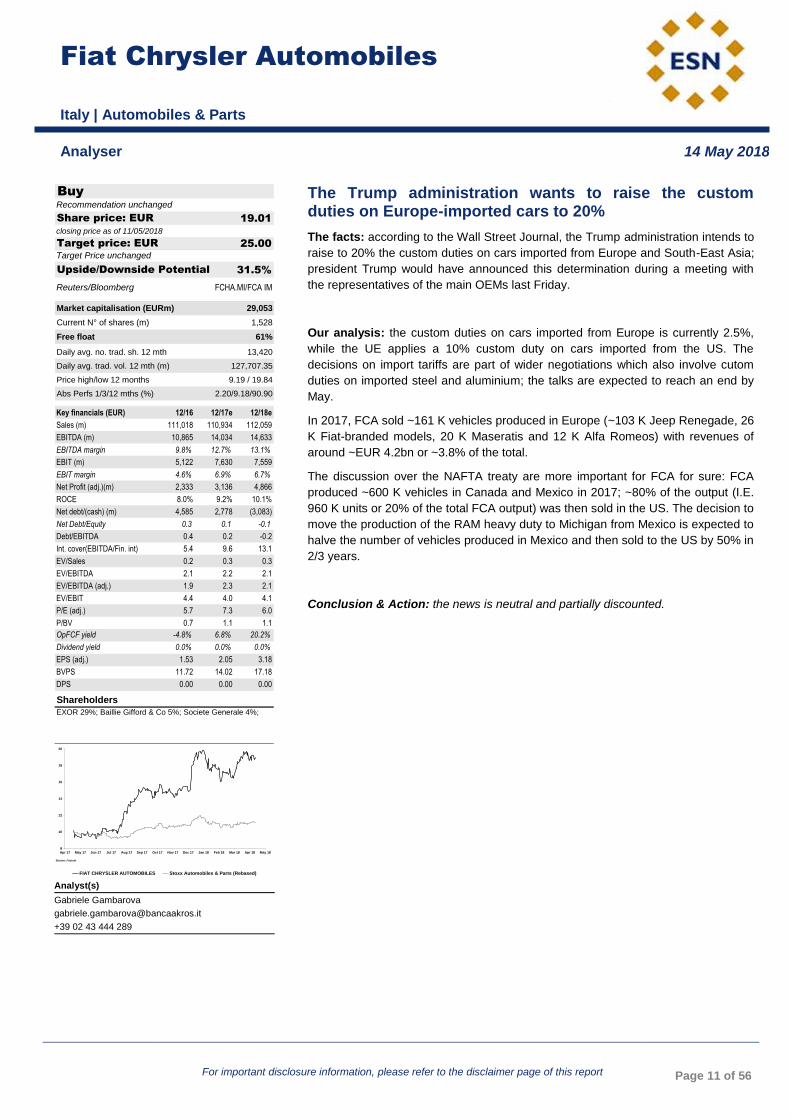
The Trump administration wants to raise the custom duties on Europe-imported cars to 20%
The facts: according to the Wall Street Journal, the Trump administration intends to
raise to 20% the custom duties on cars imported from Europe and South-East Asia;
president Trump would have announced this determination during a meeting with
the representatives of the main OEMs last Friday.
Our analysis: the custom duties on cars imported from Europe is currently 2.5%,
while the UE applies a 10% custom duty on cars imported from the US. The
decisions on import tariffs are part of wider negotiations which also involve cutom
duties on imported steel and aluminium; the talks are expected to reach an end by
May.
In 2017, FCA sold ~161 K vehicles produced in Europe (~103 K Jeep Renegade, 26
K Fiat-branded models, 20 K Maseratis and 12 K Alfa Romeos) with revenues of
around ~EUR 4.2bn or ~3.8% of the total.
The discussion over the NAFTA treaty are more important for FCA for sure: FCA
produced ~600 K vehicles in Canada and Mexico in 2017; ~80% of the output (I.E.
960 K units or 20% of the total FCA output) was then sold in the US. The decision to
move the production of the RAM heavy duty to Michigan from Mexico is expected to
halve the number of vehicles produced in Mexico and then sold to the US by 50% in
2/3 years.
Conclusion & Action: the news is neutral and partially discounted.
Fiat Chrysler Automobiles
Italy | Automobiles & Parts
AUTOMOBILES & PARTS Fiat Chrysler Automobiles (Buy) New monopile market opening up
Analyser 14 May 2018
Analyst(s)
Gabriele Gambarova
+39 02 43 444 289
Buy
19.01
closing price as of 11/05/2018
25.00
31.5%Upside/Downside Potential
Target Price unchanged
Recommendation unchanged
Target price: EUR
Share price: EUR
Reuters/Bloomberg FCHA.MI/FCA IM
Market capitalisation (EURm) 29,053
Current N° of shares (m) 1,528
Free float 61%
Daily avg. no. trad. sh. 12 mth 13,420
Daily avg. trad. vol. 12 mth (m) 127,707.35
Price high/low 12 months 9.19 / 19.84
Abs Perfs 1/3/12 mths (%) 2.20/9.18/90.90
Key financials (EUR) 12/16 12/17e 12/18e
Sales (m) 111,018 110,934 112,059
EBITDA (m) 10,865 14,034 14,633
EBITDA margin 9.8% 12.7% 13.1%
EBIT (m) 5,122 7,630 7,559
EBIT margin 4.6% 6.9% 6.7%
Net Profit (adj.)(m) 2,333 3,136 4,866
ROCE 8.0% 9.2% 10.1%
Net debt/(cash) (m) 4,585 2,778 (3,083)
Net Debt/Equity 0.3 0.1 -0.1
Debt/EBITDA 0.4 0.2 -0.2
Int. cover(EBITDA/Fin. int) 5.4 9.6 13.1
EV/Sales 0.2 0.3 0.3
EV/EBITDA 2.1 2.2 2.1
EV/EBITDA (adj.) 1.9 2.3 2.1
EV/EBIT 4.4 4.0 4.1
P/E (adj.) 5.7 7.3 6.0
P/BV 0.7 1.1 1.1
OpFCF yield -4.8% 6.8% 20.2%
Dividend yield 0.0% 0.0% 0.0%
EPS (adj.) 1.53 2.05 3.18
BVPS 11.72 14.02 17.18
DPS 0.00 0.00 0.00
Shareholders
EXOR 29%; Baillie Gifford & Co 5%; Societe Generale 4%;
8
10
12
14
16
18
20
Apr 17 May 17 Jun 17 Jul 17 Aug 17 Sep 17 Oct 17 Nov 17 Dec 17 Jan 18 Feb 18 Mar 18 Apr 18 May 18
vvdsvdvsdy
FIAT CHRYSLER AUTOMOBILES Stoxx Automobiles & Parts (Rebased)
Source: Factset

Landi Renzo
For important disclosure information, please refer to the disclaimer page of this report Page 12 of 56
Q1 2018 results: we see a moderate improvement
The facts: LR is due to release its Q1 2018 results on May 14th
; no conference call
has been set.
Our analysis: here follow our Q1 2018 P&L estimates. We stress that LR de-
consolidated its SAFE subsidiary; we thus adjusted the Q1 2017 results to make
them comparable.
We stress that the sell-out of LPG cars in Italy drop 7.5% Y/Y in Q1, while the sell-
out of CNG cars soared almost 30% Y/Y.
We are assuming that volumes of sales went up by ~5% Y/Y and that they were
almost entirely offset by an adverse FOREX impact; we see EBITDA to have
reached EUR 4.2m after EUR 1.5m of restructuring costs; we expect the bottom
line result to have reached breakeven.
We expect the Net Debt (EUR 49m as at the end of 2017) to have worsened
sequentially to EUR 51m.
Conclusion & Action: we don't expect Q4 results to provide much room for
surprise.
Landi Renzo
Italy | Automobiles & Parts
AUTOMOBILES & PARTS Landi Renzo (Neutral) The Trump administration wants to raise the custom duties on Europe-imported cars to 20%
Analyser 14 May 2018
Analyst(s)
Gabriele Gambarova
+39 02 43 444 289
Neutral
1.61
closing price as of 11/05/2018
1.60
-0.5%Upside/Downside Potential
Target Price unchanged
Recommendation unchanged
Target price: EUR
Share price: EUR
Reuters/Bloomberg LR.MI/LR IM
Market capitalisation (EURm) 181
Current N° of shares (m) 113
Free float 33%
Daily avg. no. trad. sh. 12 mth 1,119
Daily avg. trad. vol. 12 mth (m) 431.54
Price high/low 12 months 0.47 / 1.92
Abs Perfs 1/3/12 mths (%) 7.20/8.80/228.83
Key financials (EUR) 12/17 12/18e 12/19e
Sales (m) 206 171 177
EBITDA (m) 5 23 27
EBITDA margin 2.3% 13.1% 15.0%
EBIT (m) (11) 10 17
EBIT margin nm 5.8% 9.7%
Net Profit (adj.)(m) 4 6 14
ROCE -2.6% 7.7% 11.1%
Net debt/(cash) (m) 49 54 49
Net Debt/Equity 0.9 0.8 0.6
Debt/EBITDA 10.4 2.4 1.9
Int. cover(EBITDA/Fin. int) 0.8 5.6 10.2
EV/Sales 0.9 1.1 1.1
EV/EBITDA 39.9 8.7 7.1
EV/EBITDA (adj.) 14.8 8.2 7.1
EV/EBIT nm 19.6 11.0
P/E (adj.) 42.7 29.4 13.3
P/BV 3.1 2.5 2.1
OpFCF yield 19.1% -1.7% 5.0%
Dividend yield 0.0% 0.0% 0.0%
EPS (adj.) 0.04 0.05 0.12
BVPS 0.51 0.64 0.76
DPS 0.00 0.00 0.00
Shareholders
Trust Landi 59%; Aerius IH 5%; Impax AM 3%;
0.4
0.6
0.8
1.0
1.2
1.4
1.6
1.8
2.0
Apr 17 May 17 Jun 17 Jul 17 Aug 17 Sep 17 Oct 17 Nov 17 Dec 17 Jan 18 Feb 18 Mar 18 Apr 18 May 18
vvdsvdvsdy
LANDI RENZO Stoxx Automobiles & Parts (Rebased)
Source: Factset

Banca Carige
For important disclosure information, please refer to the disclaimer page of this report Page 13 of 56
Q1 18 results back to a small profit
The facts: Banca Carige published and presented Q1 18 results last Friday.
Our analysis: After 5Y of losses, Banca Carige closed Q1 18 with a small profit of
EUR 6.4m vs. a net loss of EUR -41m one year ago.
The phased-in CET1 ratio was down 30bps Q/Q to 12.1%, higher than SREP
Guidance of 11.175%, while the phased-in TCR settled at 12.3%, temporarily lower
than 13.125% SREP target. The finalisation of the disposals included in the
business plan and currently underway, will lead to the threshold being exceeded.
(EUR m) Q1 18A Q1 17A Y/Y Q4 17A Q/Q
Revenues 135 148 -8.8% 114 18.4%
Operating costs -118 -130 -9.2% -128 -7.8%
GOP 18 18 0.0% -14 nm
Loan provisions -13 -76 -82.9% -252 -94.8%
Net Profit 6 -41 nm -178 nm
The balance sheet deleveraging and de-risking continued to take its toll on income
generation, with total revenues down 8.5% Y/Y to EUR 135m, led by the NII
decreasing 11% Y/Y to EUR 55.5m and the trading income declining 13% to EUR
13.5m. However, the net commissions stabilised at EUR 62m thanks to AM inflows.
The lower revenues were compensated by an ever stronger cut in operating
expenses of 9% Y/Y to EUR 118m, leading to a gross operating profit (GOP) almost
flat Y/Y at EUR 17.5m, with a still high C/I ratio of around 87%.
The huge balance sheet de-risking delivered over the last year (35% cut of the
gross NPE portfolio) allowed a yearly reduction in loan impairments of 83% Y/Y to
EUR 13m with a very low cost of credit risk of 32bps. Together with an increased
NPE coverage of 52.3%, the net NPE ratio was cut by 7 p.p. to 15.6%.
Conclusion & Action: Our rating remains suspended on this penny stock.
Banca Carige
Italy | Banks
BANKS Banca Carige (Rating Suspended) Q1 2018 results: we see a moderate improvement
Analyser 14 May 2018
Analyst(s)
Luigi Tramontana
+39 02 4344 4239
Rating Suspended
0.01
closing price as of 11/05/2018
-100.0%Upside/Downside Potential
Recommendation unchanged
Share price: EUR
Reuters/Bloomberg CRGI.MI/CRG IM
Market capitalisation (EURm) 486
Current N° of shares (m) 55,266
Free float 53%
Daily avg. no. trad. sh. 12 mth 353,382
Daily avg. trad. vol. 12 mth (m) 11,439.09
Price high/low 12 months 0.01 / 0.02
Abs Perfs 1/3/12 mths (%) 10.00/10.00/-59.24
Key financials (EUR) 12/17 12/18e 12/19e
Total Revenue (m) 517 553 591
Pre-Provision Profit (PPP) (m) -17 43 89
Operating profit (OP) -444 -80 -19
Earnings Before Tax (m) -589 20 -19
Net Profit (adj.) (m) -291 -62 -13
Shareholders Equity (m) 2,253 2,248 2,215
Tangible BV (m) 2,218 2,213 2,180
RWA (m) 15,300 15,453 15,608
ROTE -13.6% -2.8% -0.6%
Total Capital Ratio (B3) 12.6% 13.4% 13.1%
Cost/Income 98.5% 90.5% 83.3%
NPL ratio (gross) 9.5% 4.4% 6.0%
P/PPP -27.1 11.4 5.5
P/E (adj.) nm nm nm
P/BV 0.2 0.2 0.2
P/TBV 0.2 0.2 0.2
Dividend Yield 0.0% 0.0% 0.0%
PPPPS 0.00 0.00 0.00
EPS (adj.) -0.01 0.00 0.00
BVPS 0.04 0.04 0.04
TBVPS 0.04 0.04 0.04
DPS 0.00 0.00 0.00
Shareholders
Malacalza 21%; Volpi 9%; SGA 5%; Fonspa 5%;
0.006
0.008
0.010
0.012
0.014
0.016
0.018
0.020
0.022
0.024
Apr 17 May 17 Jun 17 Jul 17 Aug 17 Sep 17 Oct 17 Nov 17 Dec 17 Jan 18 Feb 18 Mar 18 Apr 18 May 18
vvdsvdvsdy
BANCA CARIGE Stoxx Banks (Rebased)
Source: Factset

Banca MPS
For important disclosure information, please refer to the disclaimer page of this report Page 14 of 56
Feed-back from results presentation
The facts: Banca MPS held last Friday a conference call to present Q1 18 results.
Our analysis: The mgmt gave a positive message during the presentation on:
Cost of risk: the mgmt. is confident to maintain 61bps of Q1 18 also for FY18,
much lower than 79bps FY19 business plan target, thanks to reassuring asset
quality trends. Indeed, default rate declined to 1.5% vs. 2.5% in FY17 and 2%
FY19 business plan target, while danger rate was as low as 10.3% thanks to
seasonality, but 20% guidance was given for FY18 vs. 24% last year. Recovery
rate remained strong 5.9%. Successful closure of EUR 24bn NPL securitization
bodes well for the future and mgmt. targets an over-delivery vs. EUR 3.5bn UTP
reduction by 2019: well on track to deliver EUR 1.5bn FY18 disposal target
within H1 and do better in H2 and next year.
Revenues: higher income generation remains a long process, but 10bps lower
funding cost has already been delivered in Q1 and helped to improve
commercial spread by 6bps Q/Q and 3bps Y/Y. As BMPS still has 16bps gap in
funding cost vs. the system, levers are still available to improve the situation,
while lending growth is capped by EC agreement. Net commissions are also
progressing well thanks to renewed commercial focus.
GOP and net income: improved profitability will be mgmt’s main focus going
on, helped also by the strong cost cuts the bank is delivering. Future possible
recognition of up to EUR 2.1bn DTA will also help. Mgmt giving guidance of
EUR 150/200m for FY18, including some EUR 80m already recorded in Q1.
Conclusion & Action: We reiterate Buy with EUR 3.4 target price.
Banca MPS
Italy | Banks
BANKS Banca MPS (Buy) Q1 18 results back to a small profit
Analyser 14 May 2018
Analyst(s)
Luigi Tramontana
+39 02 4344 4239
Buy
3.20
closing price as of 11/05/2018
3.40
6.3%Upside/Downside Potential
Target Price unchanged
from Neutral
Target price: EUR
Share price: EUR
Reuters/Bloomberg BMPS.MI/BMPS IM
Market capitalisation (EURm) 3,649
Current N° of shares (m) 1,140
Free float 25%
Daily avg. no. trad. sh. 12 mth 1,411
Daily avg. trad. vol. 12 mth (m) 59,414.98
Price high/low 12 months 2.48 / 15.08
Abs Perfs 1/3/12 mths (%) 19.99/-15.34/-78.78
Key financials (EUR) 12/17 12/18e 12/19e
Total Revenue (m) 4,026 3,554 3,578
Pre-Provision Profit (PPP) (m) 1,087 826 939
Operating profit (OP) -4,237 40 233
Earnings Before Tax (m) -4,186 -110 233
Net Profit (adj.) (m) -263 285 403
Shareholders Equity (m) 10,429 10,564 10,967
Tangible BV (m) 10,421 10,556 10,959
RWA (m) 60,600 67,206 67,963
ROTE -3.2% 2.7% 3.7%
Total Capital Ratio (B3) 14.9% 15.9% 15.2%
Cost/Income 63.2% 69.7% 66.2%
NPL ratio (gross) 28.2% 9.1% 10.2%
P/PPP 4.1 4.4 3.9
P/E (adj.) nm 12.8 9.1
P/BV 0.4 0.3 0.3
P/TBV 0.4 0.3 0.3
Dividend Yield 0.0% 0.0% 0.0%
PPPPS 0.95 0.72 0.82
EPS (adj.) -0.23 0.25 0.35
BVPS 9.14 9.26 9.61
TBVPS 9.14 9.26 9.61
DPS 0.00 0.00 0.00
Shareholders
Italian Government 68%; Generali 4%;
2
4
6
8
10
12
14
16
Apr 17 May 17 Jun 17 Jul 17 Aug 17 Sep 17 Oct 17 Nov 17 Dec 17 Jan 18 Feb 18 Mar 18 Apr 18 May 18
vvdsvdvsdy
BANCA MPS Stoxx Banks (Rebased)
Source: Factset
Deutsche Pfandbriefbank
For important disclosure information, please refer to the disclaimer page of this report Page 15 of 56
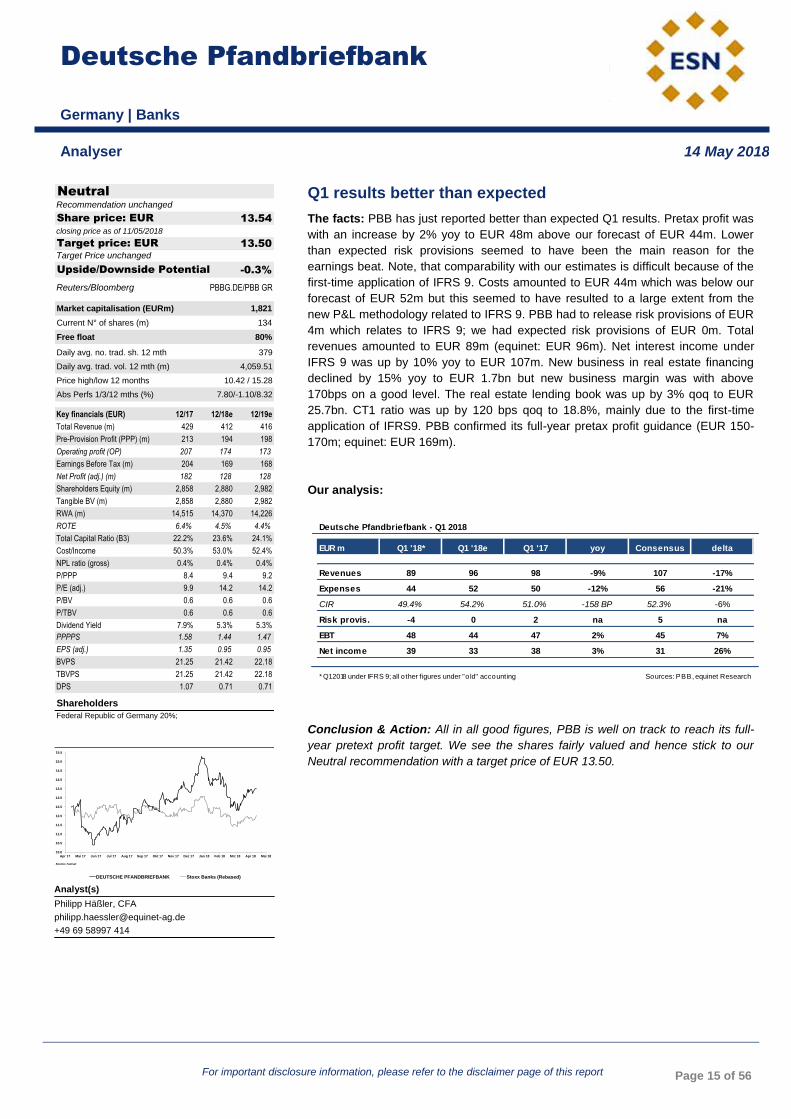
Q1 results better than expected
The facts: PBB has just reported better than expected Q1 results. Pretax profit was
with an increase by 2% yoy to EUR 48m above our forecast of EUR 44m. Lower
than expected risk provisions seemed to have been the main reason for the
earnings beat. Note, that comparability with our estimates is difficult because of the
first-time application of IFRS 9. Costs amounted to EUR 44m which was below our
forecast of EUR 52m but this seemed to have resulted to a large extent from the
new P&L methodology related to IFRS 9. PBB had to release risk provisions of EUR
4m which relates to IFRS 9; we had expected risk provisions of EUR 0m. Total
revenues amounted to EUR 89m (equinet: EUR 96m). Net interest income under
IFRS 9 was up by 10% yoy to EUR 107m. New business in real estate financing
declined by 15% yoy to EUR 1.7bn but new business margin was with above
170bps on a good level. The real estate lending book was up by 3% qoq to EUR
25.7bn. CT1 ratio was up by 120 bps qoq to 18.8%, mainly due to the first-time
application of IFRS9. PBB confirmed its full-year pretax profit guidance (EUR 150-
170m; equinet: EUR 169m).
Our analysis:
Conclusion & Action: All in all good figures, PBB is well on track to reach its full-
year pretext profit target. We see the shares fairly valued and hence stick to our
Neutral recommendation with a target price of EUR 13.50.
Deutsche Pfandbriefbank
Germany | Banks
BANKS Deutsche Pfandbriefbank (Neutral) Feed-back from results presentation
Analyser 14 May 2018
Analyst(s)
Philipp Häßler, CFA
+49 69 58997 414
Neutral
13.54
closing price as of 11/05/2018
13.50
-0.3%Upside/Downside Potential
Target Price unchanged
Recommendation unchanged
Target price: EUR
Share price: EUR
Reuters/Bloomberg PBBG.DE/PBB GR
Market capitalisation (EURm) 1,821
Current N° of shares (m) 134
Free float 80%
Daily avg. no. trad. sh. 12 mth 379
Daily avg. trad. vol. 12 mth (m) 4,059.51
Price high/low 12 months 10.42 / 15.28
Abs Perfs 1/3/12 mths (%) 7.80/-1.10/8.32
Key financials (EUR) 12/17 12/18e 12/19e
Total Revenue (m) 429 412 416
Pre-Provision Profit (PPP) (m) 213 194 198
Operating profit (OP) 207 174 173
Earnings Before Tax (m) 204 169 168
Net Profit (adj.) (m) 182 128 128
Shareholders Equity (m) 2,858 2,880 2,982
Tangible BV (m) 2,858 2,880 2,982
RWA (m) 14,515 14,370 14,226
ROTE 6.4% 4.5% 4.4%
Total Capital Ratio (B3) 22.2% 23.6% 24.1%
Cost/Income 50.3% 53.0% 52.4%
NPL ratio (gross) 0.4% 0.4% 0.4%
P/PPP 8.4 9.4 9.2
P/E (adj.) 9.9 14.2 14.2
P/BV 0.6 0.6 0.6
P/TBV 0.6 0.6 0.6
Dividend Yield 7.9% 5.3% 5.3%
PPPPS 1.58 1.44 1.47
EPS (adj.) 1.35 0.95 0.95
BVPS 21.25 21.42 22.18
TBVPS 21.25 21.42 22.18
DPS 1.07 0.71 0.71
Shareholders
Federal Republic of Germany 20%;
10.0
10.5
11.0
11.5
12.0
12.5
13.0
13.5
14.0
14.5
15.0
15.5
Apr 17 Mai 17 Jun 17 Jul 17 Aug 17 Sep 17 Okt 17 Nov 17 Dez 17 Jan 18 Feb 18 Mrz 18 Apr 18 Mai 18
vvdsvdvsdy
DEUTSCHE PFANDBRIEFBANK Stoxx Banks (Rebased)
Source: Factset
Deutsche Pfandbriefbank - Q1 2018
EUR m Q1 '18* Q1 '18e Q1 '17 yoy Consensus delta
Revenues 89 96 98 -9% 107 -17%
Expenses 44 52 50 -12% 56 -21%
CIR 49.4% 54.2% 51.0% -158 BP 52.3% -6%
Risk provis. -4 0 2 na 5 na
EBT 48 44 47 2% 45 7%
Net income 39 33 38 3% 31 26%
* Q1 2018 under IFRS 9; all o ther figures under "o ld" accounting Sources: PBB, equinet Research

Mediobanca
For important disclosure information, please refer to the disclaimer page of this report Page 16 of 56
Feed-back from results presentation
The facts: Mediobanca held a conference call last Friday to present Q3/9M results.
Our analysis: During the presentation, the CEO stressed once again the growth
and sustainability of Mediobanca’s business model:
- Wealth Mgmt.: reshaping is continuing and the division is scaling up in visibility
and contribution, as it now represents some 25% of group’s revenues. AUM
growing 22% in 9M fuelled by organic growth (EUR 3.2bn net new money) and
RAM acquisition (adding EUR 4.2bn). More growth to come driven by
distribution enhancement/new projects, with strong investments in the next 2Y
in the digital platform, robot advisory, additional hiring of FA and private
bankers, with M&A scouting ongoing in distribution and alternative AM
platforms.
- Consumer credit: continue growing, with no compromise on sustainability,
leading to record results in 9M with net profit up 21% fostered by stable revenue
growth (+4%) and reduction in the cost of risk (slightly above 200bps). Compass
is a top player in the domestic market and is ready to seize new opportunities
through selective M&A, in order to leverage best in class pricing/risk
assessment opportunities.
- CIB: still the underperforming leg of the group due to NII decreasing 10% in 9M
on the back of margin pressure deriving from fierce competition. However,
revenue diversification is improving (50% lending, 40% investment banking,
10% trading), with improved clients coverage and M&A scouting on selected IB
teams and NPL servicers.
Conclusion & Action: We reiterate Accumulate with EUR 10.8 TP.
Mediobanca
Italy | Banks
BANKS Mediobanca (Accumulate) Q1 results better than expected
Analyser 14 May 2018
Analyst(s)
Luigi Tramontana
+39 02 4344 4239
Accumulate
9.95
closing price as of 11/05/2018
10.80
8.6%Upside/Downside Potential
Target Price unchanged
Recommendation unchanged
Target price: EUR
Share price: EUR
Reuters/Bloomberg MDBI.MI/MB IM
Market capitalisation (EURm) 8,795
Current N° of shares (m) 884
Free float 69%
Daily avg. no. trad. sh. 12 mth 3,709
Daily avg. trad. vol. 12 mth (m) 45,585.82
Price high/low 12 months 8.27 / 10.45
Abs Perfs 1/3/12 mths (%) 1.53/2.37/8.25
Key financials (EUR) 06/17 06/18e 06/19e
Total Revenue (m) 2,196 2,331 2,484
Pre-Provision Profit (PPP) (m) 1,172 1,199 1,328
Operating profit (OP) 855 935 968
Earnings Before Tax (m) 914 1,004 928
Net Profit (adj.) (m) 696 725 730
Shareholders Equity (m) 9,192 9,644 10,008
Tangible BV (m) 8,775 9,228 9,592
RWA (m) 52,698 47,442 45,821
ROTE 7.7% 7.7% 7.4%
Total Capital Ratio (B3) 16.8% 18.4% 0.0%
Cost/Income 46.6% 48.6% 46.5%
NPL ratio (gross) 0.0% 0.0% 0.0%
P/PPP 6.5 7.3 6.6
P/E (adj.) 10.9 12.1 12.0
P/BV 0.8 0.9 0.9
P/TBV 0.9 1.0 0.9
Dividend Yield 3.7% 3.7% 3.8%
PPPPS 1.33 1.36 1.50
EPS (adj.) 0.79 0.82 0.83
BVPS 10.43 10.91 11.32
TBVPS 9.96 10.44 10.85
DPS 0.37 0.37 0.38
Shareholders
Shareholder Pact 31%;
8.0
8.5
9.0
9.5
10.0
10.5
Apr 17 May 17 Jun 17 Jul 17 Aug 17 Sep 17 Oct 17 Nov 17 Dec 17 Jan 18 Feb 18 Mar 18 Apr 18 May 18
vvdsvdvsdy
MEDIOBANCA Stoxx Banks (Rebased)
Source: Factset

UBI Banca
For important disclosure information, please refer to the disclaimer page of this report Page 17 of 56
Feed-back from results presentation
The facts: UBI Banca held a conference call last Friday to present Q1 18 results.
Our analysis: During the presentation, the mgmt. flagged the following:
Capital: further improvement in capital ratios (including Model Change and IFRS9),
with CET1 ratio at 12% phased-in and 11.64% fully loaded (i.e. including full
impact of IFRS9), as the ca. EUR -840m impact on CET1 capital from IFRS9
FTA and shortfall was compensated by EUR -6.4bn RWA reduction from model
changes and EUR -0.3bn RWA reduction related to DTA. Some 30bps could be
gained once AIRB models will be extended to 3 Bridge banks.
NII: customer loans improved for the 3rd
quarter in a row (+0.7% in Q1), while
customer spread improved 4bps Q/Q to 170bps thanks to funding costs
declining 5bps Q/Q to 72bps.
Net commissions: income up again by 3% Q/Q, driven by AuM and bancassurance
due to the integration of 3 Bridge banks acquired in 2017, redefinition of
distribution network, new distribution to relationship managers.
Asset quality: gross NPE ratio at 12.74% and net NPE at 8.06% before disposals
expected to take place within 3Q18. NPE Coverage up to 49.83% including
write-offs, o/w coverage of Bad loans up to 63.77% including write-offs.
Coverage of performing loans of 67bps. Default rate 1.8%, Texas ratio below
100% (98.9%)
Business Outlook forecast at the end of 2017 confirmed in 1Q18
Conclusion & Action: We stick to Neutral with EUR 4.4 target price.
UBI Banca
Italy | Banks
BANKS UBI Banca (Neutral) Feed-back from results presentation
Analyser 14 May 2018
Analyst(s)
Luigi Tramontana
+39 02 4344 4239
Neutral
4.28
closing price as of 11/05/2018
4.40
2.8%Upside/Downside Potential
Target Price unchanged
Recommendation unchanged
Target price: EUR
Share price: EUR
Reuters/Bloomberg UBI.MI/UBI IM
Market capitalisation (EURm) 4,898
Current N° of shares (m) 1,144
Free float 100%
Daily avg. no. trad. sh. 12 mth 11,406
Daily avg. trad. vol. 12 mth (m) 65,708.94
Price high/low 12 months 2.66 / 4.58
Abs Perfs 1/3/12 mths (%) 12.66/4.52/40.49
Key financials (EUR) 12/17 12/18e 12/19e
Total Revenue (m) 3,579 3,702 3,890
Pre-Provision Profit (PPP) (m) 1,143 1,202 1,460
Operating profit (OP) 414 602 861
Earnings Before Tax (m) 281 602 861
Net Profit (adj.) (m) 134 519 726
Shareholders Equity (m) 9,925 10,318 10,837
Tangible BV (m) 8,460 8,853 9,372
RWA (m) 67,053 67,671 68,922
ROTE 1.7% 6.0% 8.0%
Total Capital Ratio (B3) 14.1% 14.5% 14.8%
Cost/Income 67.8% 67.0% 61.9%
NPL ratio (gross) 7.6% 6.3% 6.2%
P/PPP 3.7 4.1 3.4
P/E (adj.) 31.2 9.4 6.8
P/BV 0.5 0.6 0.5
P/TBV 0.5 0.6 0.5
Dividend Yield 2.6% 4.2% 5.8%
PPPPS 1.00 1.05 1.28
EPS (adj.) 0.12 0.45 0.63
BVPS 7.39 7.74 8.19
TBVPS 7.39 7.74 8.19
DPS 0.11 0.18 0.25
Shareholders
2.6
2.8
3.0
3.2
3.4
3.6
3.8
4.0
4.2
4.4
4.6
Apr 17 May 17 Jun 17 Jul 17 Aug 17 Sep 17 Oct 17 Nov 17 Dec 17 Jan 18 Feb 18 Mar 18 Apr 18 May 18
vvdsvdvsdy
UBI BANCA Stoxx Banks (Rebased)
Source: Factset

Altri
For important disclosure information, please refer to the disclaimer page of this report Page 18 of 56
1Q18 post comment: EBITDA 57.7% YoY
The facts: Altri released its 1Q18 results on Friday after the market close. The
company recorded revenues of EUR 173.4m, EBITDA of EUR 63.3m and net
income of EUR 32.6m.
Our analysis: 1Q18 results stood 1% and 2% above our forecasts in terms of
revenues and EBITDA, respectively. Net income stood 3% below forecasts with the
main deviation towards ours estimates coming from higher taxes paid.
The company produced 257.1 thousand tons of pulp in 1Q18 and reached sales of
247.5 thousand tons. BHKP average pulp price recorded at the end of March was at
EUR 1,030/ton, supporting pulp sales of EUR 149.1m (11% YoY).
Altri reported once again robust demand in the first quarter of the year. The demand
for eucalyptus pulp was up 4.2% in the 1Q18, with Chinese consumption increasing
3% (source: PPPC Chemical Market Pulp Global 100 Report – March 2018).
Altri’s revenues in the quarter reached EUR 173.4m (8.5% YoY and -0.9% QoQ)
supported on rising pulp prices. Opex in 1Q18 was down 8% YoY, with EBITDA
standing at EUR 63.3m (57.7% YoY and 27.3% QoQ). EBITDA margin stood at
36.5% in 1Q18, which compares with 25.1% recorded in 1Q17 and with 28.4%
obtained in 4Q17. The net financial result reached EUR 1.9m, which corresponds to
a decrease of about 59% QoQ, mainly due to the exchange rate impact.
Net income in 1Q18 reached EUR 32.6m (+90.6% YoY and +23.5% QoQ).
Net debt totalled EUR 365.2m by the end of 1Q18, decreasing EUR 23m versus the
YE2017, while capex stood at EUR 23.4m in the same period.
Conclusion & Action: Another strong set of results for Altri, with EBITDA rising
58% YoY and EBITDA margin reaching 36.5%. Going forward, Altri expects the
market conditions to remain very supportive in terms of prices and growth, also
expecting an increase in terms of sales in 2Q18. The company reported that the
investment project in Celtejo is expectable to be complete in the 2H18.
Altri
Portugal | Basic Resources
BASIC RESOURCES Altri (Accumulate) Feed-back from results presentation
Analyser 14 May 2018
Analyst(s)
Carlos Jesus
+351 21 389 6812
Artur Amaro
+351 213 89 6822
Accumulate
6.14
closing price as of 11/05/2018
5.30
-13.7%Upside/Downside Potential
Target Price unchanged
Recommendation unchanged
Target price: EUR
Share price: EUR
Reuters/Bloomberg ALSS.LS/ALTR PL
Market capitalisation (EURm) 1,260
Current N° of shares (m) 205
Free float 34%
Daily avg. no. trad. sh. 12 mth 298
Daily avg. trad. vol. 12 mth (m) 1,440.58
Price high/low 12 months 3.63 / 6.24
Abs Perfs 1/3/12 mths (%) 11.64/39.23/46.68
Key financials (EUR) 12/16 12/17e 12/18e
Sales (m) 613 653 659
EBITDA (m) 169 189 200
EBITDA margin 27.5% 29.0% 30.3%
EBIT (m) 117 134 145
EBIT margin 19.1% 20.5% 21.9%
Net Profit (adj.)(m) 78 92 96
ROCE 10.6% 11.9% -4.7%
Net debt/(cash) (m) 429 395 335
Net Debt/Equity 1.2 1.0 0.8
Debt/EBITDA 2.5 2.1 1.7
Int. cover(EBITDA/Fin. int) 10.8 12.5 14.3
EV/Sales 2.0 2.2 2.4
EV/EBITDA 7.2 7.7 8.0
EV/EBITDA (adj.) 7.2 7.7 8.0
EV/EBIT 10.4 10.9 11.0
P/E (adj.) 10.2 11.5 13.1
P/BV 2.3 2.8 2.9
OpFCF yield 11.3% 6.5% 8.8%
Dividend yield 4.1% 4.1% 4.1%
EPS (adj.) 0.38 0.45 0.47
BVPS 1.68 1.87 2.09
DPS 0.25 0.25 0.25
Shareholders
Management 61%; Bestinver 5%;
3.5
4.0
4.5
5.0
5.5
6.0
6.5
abr 17 mai 17 jun 17 jul 17 ago 17 set 17 out 17 nov 17 dez 17 jan 18 fev 18 mar 18 abr 18 mai 18
vvdsvdvsdy
ALTRI Stoxx Basic Resources (Rebased)
Source: Factset
EURm 1Q17 4Q17 1Q18Chg. %
(YoY)
Chg. %
(QoQ)
Revenues 159.8 175.0 173.4 8.5% -0.9%
EBITDA 40.1 49.7 63.3 57.7% 27.3%
margin 25.1% 28.4% 36.5% 11.4 p.p. 8.1 p.p.
EBIT 26.2 37.2 49.4 88.6% 32.8%
margin 16.4% 21.3% 28.5% 12.1 p.p. 7.2 p.p.
Net Fin. -4.1 -6.9 -1.9 -53.8% -72.5%
Net Inc. 17.1 26.4 32.6 90.6% 23.5%
margin 10.7% 15.1% 18.8% 8.1 p.p. 3.7 p.p.

The Navigator Company
For important disclosure information, please refer to the disclaimer page of this report Page 19 of 56
1Q18 comment and valuation update
The facts: The Navigator Company released its 1Q18 results on Thursday after the
market close, with management holding a conference call afterwards. Revenues
stood at EUR 384.9m, EBITDA at EUR 110.9m and net income at EUR 53.2m.
We’ve updated our assumptions for pulp and paper prices following the last
developments in both markets. This led to an increase of the YE2018 fair value to
EUR 5.10 per share, with the recommendation now at Neutral.
Our analysis: Paper production in the quarter stood at 385.8 thousand tons (396.4
thousand in 1Q17), with sales reaching 361.2 thousand tons (371.3 thousand in
1Q17). Pulp production amounted to 346.1 thousand tons (382.4 thousand in 1Q17)
with sales at 53.1 thousand tons (90.4 thousand in 1Q17). The pulp business was
affected by the planned maintenance stop in Setúbal (that did not happen in the first
three months of 2017) and also the need to build stocks in anticipation of the
stoppage scheduled for April at the Figueira da Foz mill (following the capacity
increase project).
Paper prices benefited from market conditions to increase 1.6% qoq and 5.1% yoy
(PIX average of the quarter). Order books are above the 10-year average at 34
days, with the increase in pulp prices also acting as a catalyst. The company led two
paper price increases in Europe and others in the United States and international
markets. The mix of paper sales also improved with higher sales of premium and
own brands, with the company’s average sale price up by 3.1% yoy. The yoy
devaluation of the US dollar against the euro limited the gains of the first quarter of
2018. Total tissue sales declined both qoq and yoy, standing at 13.5 thousand tons
(14.0 thousand in 1Q17), but with an improved mix as the weight of reel sales
declined. Tissue producers are struggling to pass-through the increases in pulp
prices to the retail consumer, hurting the pricing environment, but also opening the
door for consolidation opportunities as non-integrated players are in increasing
financial distress. This is also true for non-integrated paper producers, with the
differential between paper and pulp prices are record lows.
In the last quarters the pulp market has recorded one of the best performances in
history, with BHKP prices breaching above USD 1,000 per ton for the first time (euro
denominated prices are also at all-time highs). Despite new capacity coming into the
market in 2017-2018 (Horizonte 2, OKI, amongst others), with the market
presumably recording an excess supply in 2018, there is no indication that bleached
hardwood pulp prices will experience a significant correction anytime soon. In this
report we provide an update of our pulp price forward curve to account for the
current market conditions and expectations. We’ve increase our pulp price
assumptions by 15% in 2018, 14% in 2019 and 16% in 2020 (more details in the
following exhibits), also with the consequent calibration of our paper price estimates.
We also made some slight assumptions in our EURUSD forward curve in order to
better match current conditions.
Conclusion & Action: We’ve updated our assumptions for pulp and paper prices
following the last developments in both markets. This led to an increase of the
YE2018 fair value to EUR 5.10 per share, with the recommendation now at Neutral.
We highlight that the valuation of Navigator is capped by our paper price forecasts
which assume a negative spread over pulp prices in 2019 and 2020. This is clearly
a conservative view that time will prove correct or not, but it should be noted as it
imply that, in normal conditions, paper prices could exceed our estimates with the
consequent impact in valuation.
The Navigator Company
Portugal | Basic Resources
BASIC RESOURCES The Navigator Company (Neutral) 1Q18 post comment: EBITDA 57.7% YoY
Analyser 14 May 2018
Analyst(s)
Carlos Jesus
+351 21 389 6812
Artur Amaro
+351 213 89 6822
Neutral
4.97
closing price as of 11/05/2018
5.10
4.90
2.6%Upside/Downside Potential
from Target Price: EUR
from Buy
Target price: EUR
Share price: EUR
Reuters/Bloomberg NVGR.LS/NVG PL
Market capitalisation (EURm) 3,566
Current N° of shares (m) 718
Free float 31%
Daily avg. no. trad. sh. 12 mth 608
Daily avg. trad. vol. 12 mth (m) 2,301.02
Price high/low 12 months 3.55 / 4.98
Abs Perfs 1/3/12 mths (%) 5.97/23.63/25.19
Key financials (EUR) 12/17 12/18e 12/19e
Sales (m) 1,637 1,681 1,766
EBITDA (m) 404 456 498
EBITDA margin 24.7% 27.1% 28.2%
EBIT (m) 255 331 387
EBIT margin 15.6% 19.7% 21.9%
Net Profit (adj.)(m) 208 246 297
ROCE 9.7% 12.7% 15.2%
Net debt/(cash) (m) 695 633 515
Net Debt/Equity 0.6 0.5 0.4
Debt/EBITDA 1.7 1.4 1.0
Int. cover(EBITDA/Fin. int) 70.9 29.6 40.7
EV/Sales 2.3 2.5 2.3
EV/EBITDA 9.3 9.2 8.2
EV/EBITDA (adj.) 9.3 9.2 8.2
EV/EBIT 14.7 12.7 10.5
P/E (adj.) 14.7 14.5 12.0
P/BV 2.6 2.9 2.8
OpFCF yield 7.9% 5.4% 9.6%
Dividend yield 7.0% 5.6% 6.5%
EPS (adj.) 0.29 0.34 0.41
BVPS 1.65 1.69 1.78
DPS 0.35 0.28 0.33
Shareholders
Semapa 69%;
3.4
3.6
3.8
4.0
4.2
4.4
4.6
4.8
5.0
5.2
Apr 17 May 17 Jun 17 Jul 17 Aug 17 Sep 17 Oct 17 Nov 17 Dec 17 Jan 18 Feb 18 Mar 18 Apr 18 May 18
vvdsvdvsdy
THE NAVIGATOR COMPANY Stoxx Basic Resources (Rebased)
Source: Factset

K+S AG
For important disclosure information, please refer to the disclaimer page of this report Page 20 of 56
Q1 a bit light not only because of the USD
We were cautious on Q1 beforehand, and thus the slight miss today does not
come as a surprise to us. Revenues were below expectations mainly due to
P&M, while the earnings in the Salt segment disappointed because of adverse
price and FX conditions. On the positive side, Bethune has reached its full
production capacity. K+S kept the guidance for the full year (“significant
increase in EBITDA”). We expect a soft start of the share today.
In P&M, the harsh winter on the Northern hemisphere caused a late start into
the fertilizer season. It is not yet clear if lost volumes can be fully recovered in
Q2, but K+S sounded optimistic. In addition, the Werra production is still not
back to normal operations, although the wastewater problem has in principle
been solved. The management has pointed at the mounting problems to fill
vacancies at the Werra site during the Q4 call, not least as a consequence of
the many downtimes in the last couple of years due to the aforementioned
wastewater problem.
Third, the ongoing recovery of potash prices (in USD) is not reflected in ASP
due to mix and the massive FX impact. In fact, the ASP was EUR 252 after
EUR 260 in Q1 2017 and EUR 254 in Q4 2017. Interestingly, the ASP realized
overseas dropped from USD 277 to USD 269, which calls for more detailed
information.
The good news in P&M was that the Bethune site has technically reached the
nameplate capacity of 2.0mt by now, and the management sticks to the
guidance that EBIT is about to break even in 2019.
The miss in earnings was mainly because of the Salt segment, although good
winter conditions supported K+S’ de-icing activities. Consequently, volumes
were up by 35%. Negative FX effects and lower prices in the North American
de-icing salt business had an adverse effect on profitability. In fact, K+S realized
ASP of EUR 52.50 after EUR 61.30 in Q1 2017. In addition, higher logistic cost
as a consequence of last year’s disasters weighed on earnings.
There will be a conference call at 10h MEST.
K+S AG
Germany | Chemicals
CHEMICALS K+S AG (Neutral) 1Q18 comment and valuation update
Analyser 14 May 2018
Analyst(s)
Dr. Knud Hinkel, CFA
+ 49 69 58997 419
Neutral
24.21
closing price as of 11/05/2018
24.40
0.8%Upside/Downside Potential
Target Price unchanged
Recommendation unchanged
Target price: EUR
Share price: EUR
Reuters/Bloomberg SDFG.DE/SDF GY
Market capitalisation (EURm) 4,634
Current N° of shares (m) 191
Free float 100%
Daily avg. no. trad. sh. 12 mth 1,170
Daily avg. trad. vol. 12 mth (m) 36,738.86
Price high/low 12 months 19.11 / 24.67
Abs Perfs 1/3/12 mths (%) 1.42/17.64/8.64
Key financials (EUR) 12/17 12/18e 12/19e
Sales (m) 3,627 3,967 3,943
EBITDA (m) 577 806 866
EBITDA margin 15.9% 20.3% 22.0%
EBIT (m) 327 418 476
EBIT margin 9.0% 10.5% 12.1%
Net Profit (adj.)(m) 185 251 278
ROCE 2.2% 3.2% 3.7%
Net debt/(cash) (m) 2,839 2,911 2,763
Net Debt/Equity 0.7 0.7 0.6
Debt/EBITDA 4.9 3.6 3.2
Int. cover(EBITDA/Fin. int) 13.5 9.2 9.2
EV/Sales 2.0 2.0 2.0
EV/EBITDA 12.4 9.8 8.9
EV/EBITDA (adj.) 13.7 9.8 8.9
EV/EBIT 21.8 18.8 16.3
P/E (adj.) 21.5 18.4 16.6
P/BV 1.0 1.1 1.0
OpFCF yield -11.3% -0.2% 5.1%
Dividend yield 1.3% 2.0% 2.4%
EPS (adj.) 0.96 1.31 1.45
BVPS 21.73 22.72 23.71
DPS 0.32 0.47 0.58
Shareholders
19
20
21
22
23
24
25
Apr 17 Mai 17 Jun 17 Jul 17 Aug 17 Sep 17 Okt 17 Nov 17 Dez 17 Jan 18 Feb 18 Mrz 18 Apr 18 Mai 18
vvdsvdvsdy
K+S AG DAX30 (Rebased)
Source: Factset

Anima
For important disclosure information, please refer to the disclaimer page of this report Page 21 of 56
We expect a strong Q1-18 thanks to Aletti SGR
The facts: Anima is due to release its Q1-18 results on 14th
May, followed by
a conference call (details not disclose yet).
Our analysis: Our main P&L estimates are the following:
Anima: Q1-18 estimates
EUR m Q1-18e Y/Y Q1-17
Net commissions 72 41.1% 51
Performance fees 10 n.m. 2
Other income 6 -8.4% 7
Total revenues 88 47.4% 60
Operating expense -21 29.6% -16
Other income / costs -8 -1.5% -8
EBT 59 67.4% 35
Net profit 41 59.4% 26
Adj. Net profit 45 41.6% 32
Source: Company data, Banca Akros estimates
We expect total revenues around EUR 88m, +47% Y/Y, mainly thanks to the
acquisition of Aletti SGR, which was finalized in Q4-17, and to the performance
fees we estimate at c. EUR 10m vs EUR 2m in Q1-17. Asset profitability (net
commissions on average assets) is seen improving at 8bps compared to 7bps in
Q1-17. We estimate an EBT up c. 67% Y/Y at around EUR 59m, mainly due to
the aforementioned consolidation of Aletti SGR. The C/I ratio, ex performance
fees, ought to close at 26.9% vs 28.1% in Q1-17. All in all, we expect an adj. net
profit of c. EUR 45m vs EUR 32m in Q1-17.
Conclusion & Action: overall we expect a positive set of results. We stick
to Accumulate. With the acquisition of Aletti SGR and the signature of the
partnership with Poste, Anima will improve its competitive position, in terms of
scale, distribution channels, business mix and skills.
Anima
Italy | Financial Services Banks
FINANCIAL SERVICES BANKS Anima (Accumulate) Q1 a bit light not only because of the USD
Analyser 14 May 2018
Analyst(s)
Enrico Esposti, CIIA
+39 02 4344 4022
Accumulate
6.00
closing price as of 11/05/2018
7.00
16.7%Upside/Downside Potential
Target Price unchanged
Recommendation unchanged
Target price: EUR
Share price: EUR
Reuters/Bloomberg ANIM.MI/ANIM IM
Market capitalisation (EURm) 1,849
Current N° of shares (m) 308
Free float 75%
Daily avg. no. trad. sh. 12 mth 1,144
Daily avg. trad. vol. 12 mth (m) 3,191.31
Price high/low 12 months 4.96 / 6.46
Abs Perfs 1/3/12 mths (%) 8.11/2.50/11.94
Key financials (EUR) 12/16 12/17e 12/18e
Total Revenue (m) 254 254 284
Pre-Provision Profit (PPP) (m) 173 172 202
Operating profit (OP) 173 172 202
Earnings Before Tax (m) 157 158 198
Net Profit (adj.) (m) 128 136 152
Shareholders Equity (m) 834 870 932
Tangible BV (m) 0 0 0
RWA (m) 0 0 0
ROTE 15.7% 16.0% 16.9%
Total Capital Ratio (B3) 0.0% 0.0% 0.0%
Cost/Income 31.8% 32.4% 28.8%
P/PPP 8.0 9.6 9.2
P/E (adj.) 10.9 12.1 12.1
P/BV 1.7 1.9 2.0
P/TBV nm nm nm
Dividend Yield 4.1% 4.1% 4.4%
PPPPS 0.58 0.56 0.65
EPS (adj.) 0.43 0.44 0.49
BVPS 2.78 2.82 3.03
TBVPS 0.00 0.00 0.00
DPS 0.25 0.25 0.26
Shareholders
BPM 15%; Poste Italiane 10%;
4.8
5.0
5.2
5.4
5.6
5.8
6.0
6.2
6.4
6.6
Apr 17 May 17 Jun 17 Jul 17 Aug 17 Sep 17 Oct 17 Nov 17 Dec 17 Jan 18 Feb 18 Mar 18 Apr 18 May 18
vvdsvdvsdy
ANIMA FTSE Italy All Share (Rebased)
Source: Factset

Banca Sistema
For important disclosure information, please refer to the disclaimer page of this report Page 22 of 56
Q1 18 results slightly lower than expected
The facts: Banca Sistema published and presented Q1 18 results last Friday.
Our analysis: Banca Sistema closed Q1 18 with a net profit up 7% Y/Y to EUR
4.7m, but lower than our EUR 5.1m estimate due to less revenues.
The CET1 ratio decreased 10bps Q/Q to 11.8%, o/w -2bps generated by IFRS 9
FTA and the rest by the strong volume growth.
(EUR m) Q1 18A Q1 18E Differ. Q1 17A Y/Y Q4 17A Q/Q
Revenues 18.1 18.9 -4.2% 14.9 21.5% 19.8 -8.6%
Operating costs -9.9 -10.0 -1.0% -9.2 7.6% -9.7 2.1%
GOP 8.2 8.9 -7.9% 5.7 43.9% 10.1 -18.8%
Loan provisions -1.0 -1.0 0.0% 0.5 nm -2.3 -56.5%
Net Profit 4.7 5.1 -7.8% 4.4 6.8% 4.9 -4.1%
Indeed, the factoring turnover increased 24 Y/Y to EUR 0.5bn as anticipated,
leading to an outstanding 35% higher Y/Y to EUR 1.5bn, o/w 24% represented by
tax receivables. In salary/pension-backed loans the group purchased about EUR
40m of loans, pushing the outstanding up 68% Y/Y to EUR 526m.
Thanks to the strong lending volume growth the interest income jumped 18% Y/Y to
EUR 20m as expected. However, the interest expense increased 40% Y/Y to EUR
6.4m vs. our 5.9m estimate, due to the additional coupons to be paid on senior and
subordinated bond issues, as well as EUR 0.8m non-recurring write-off of TLTRO II
benefit. Therefore, the NII grew 10% Y/Y to EUR 13.7m but was 4% lower than
expected. Net commissions improved 58% Y/Y to EUR 3.6m as anticipated, while
the financial income was nearly EUR 1m vs. 0.2m in Q1 17 and in line with our
estimate.
The ongoing hiring and investments led to a 7.6% growth in operating expenses to
EUR 9.9m, leading to a gross operating profit (GOP) up 44% Y/Y to EUR 8.2m or
8% less than anticipated, with a C/I ratio of 54.7%.
Loan impairments came in at EUR 1m as estimated, with a cost of credit risk of
22bps vs. 33bps in FY17.
During the presentation, the mgmt. stressed the lower factoring profitability was due
to a combination of lower priced yield and also higher weight of tax receivables on
total stock which, however, have a longer duration and require no capital
absorption.
Conclusion & Action: We stick to Neutral with EUR 2.4 target price.
Banca Sistema
Italy | Financial Services Banks
FINANCIAL SERVICES BANKS Banca Sistema (Neutral) We expect a strong Q1-18 thanks to Aletti SGR
Analyser 14 May 2018
Analyst(s)
Luigi Tramontana
+39 02 4344 4239
Neutral
2.25
closing price as of 11/05/2018
2.40
6.7%Upside/Downside Potential
Target Price unchanged
Recommendation unchanged
Target price: EUR
Share price: EUR
Reuters/Bloomberg BSTA.MI/BST IM
Market capitalisation (EURm) 181
Current N° of shares (m) 80
Free float 54%
Daily avg. no. trad. sh. 12 mth 199
Daily avg. trad. vol. 12 mth (m) 667.92
Price high/low 12 months 2.10 / 2.61
Abs Perfs 1/3/12 mths (%) -0.44/-0.44/-4.74
Key financials (EUR) 12/17 12/18e 12/19e
Total Revenue (m) 82 85 92
Pre-Provision Profit (PPP) (m) 44 46 49
Operating profit (OP) 39 40 41
Earnings Before Tax (m) 39 40 41
Net Profit (adj.) (m) 27 28 29
Shareholders Equity (m) 135 156 178
Tangible BV (m) 133 154 176
RWA (m) 1,056 1,310 1,592
ROTE 20.0% 17.8% 16.3%
Total Capital Ratio (B3) 15.3% 14.2% 13.1%
Cost/Income 46.2% 46.0% 46.2%
P/PPP 4.1 3.9 3.7
P/E (adj.) 6.8 6.5 6.2
P/BV 1.4 1.2 1.0
P/TBV 1.4 1.2 1.0
Dividend Yield 3.8% 3.8% 4.0%
PPPPS 0.55 0.57 0.61
EPS (adj.) 0.33 0.35 0.36
BVPS 1.68 1.93 2.21
TBVPS 1.65 1.91 2.19
DPS 0.09 0.09 0.09
Shareholders
Management 24%; Local Foundations 22%;
2.10
2.20
2.30
2.40
2.50
2.60
2.70
Apr 17 May 17 Jun 17 Jul 17 Aug 17 Sep 17 Oct 17 Nov 17 Dec 17 Jan 18 Feb 18 Mar 18 Apr 18 May 18
vvdsvdvsdy
BANCA SISTEMA FTSE Italy All Share (Rebased)
Source: Factset

Marr
For important disclosure information, please refer to the disclaimer page of this report Page 23 of 56
Q1 18 preview: expected results without particular surprises
The facts: Q1 18 results are due out on 14th
May.
Our analysis: we forecast a 2.2% increase in revenues in Q1 18 to EUR 335.5m,
especially driven by positive growth in the Street Market channel. We expect Q1 18e
EBITDA at EUR 15.8m, with an EBITDA margin of 4.7% in line with the previous
year.
The following table shows our sales and profitability forecast.
Q1 17a Q1 18e Chg
Sales 328.3 335.5 +2.2%
EBITDA 15.4 15.8 +2.6%
Margin % 4.7% 4.7%
Conclusion & Action: expected positive Q1 17 trend should allow the management
to confirm FY guidance given in March (sales increase higher than the reference
market growth and stable operating margins).
Marr
Italy | Food & Drug Retailers
FOOD & DRUG RETAILERS Marr (Neutral) Q1 18 results slightly lower than expected
Analyser 14 May 2018
Analyst(s)
Paola Saglietti
+39 02 4344 4287
Neutral
25.10
closing price as of 11/05/2018
23.60
-6.0%Upside/Downside Potential
Target Price unchanged
Recommendation unchanged
Target price: EUR
Share price: EUR
Reuters/Bloomberg MARR.MI/MARR IM
Market capitalisation (EURm) 1,658
Current N° of shares (m) 66
Free float 49%
Daily avg. no. trad. sh. 12 mth 75
Daily avg. trad. vol. 12 mth (m) 1,278.55
Price high/low 12 months 20.47 / 25.40
Abs Perfs 1/3/12 mths (%) 1.37/19.52/12.20
Key financials (EUR) 12/17 12/18e 12/19e
Sales (m) 1,625 1,682 1,745
EBITDA (m) 116 119 125
EBITDA margin 7.1% 7.1% 7.2%
EBIT (m) 97 101 108
EBIT margin 6.0% 6.0% 6.2%
Net Profit (adj.)(m) 65 74 80
ROCE 15.6% 15.2% 16.7%
Net debt/(cash) (m) 158 162 123
Net Debt/Equity 0.5 0.5 0.3
Debt/EBITDA 1.4 1.4 1.0
Int. cover(EBITDA/Fin. int) 22.9 (28.0) (31.7)
EV/Sales 1.0 1.1 1.0
EV/EBITDA 13.4 15.1 14.0
EV/EBITDA (adj.) 13.4 15.1 14.0
EV/EBIT 16.0 17.8 16.2
P/E (adj.) 28.3 29.0 27.1
P/BV 4.6 5.0 4.6
OpFCF yield 5.0% 2.6% 5.3%
Dividend yield 2.9% 3.0% 3.1%
EPS (adj.) 0.76 0.87 0.92
BVPS 4.64 5.03 5.47
DPS 0.74 0.76 0.77
Shareholders
Cremonini S.p.a. 51%;
20.0
20.5
21.0
21.5
22.0
22.5
23.0
23.5
24.0
24.5
25.0
25.5
Apr 17 May 17 Jun 17 Jul 17 Aug 17 Sep 17 Oct 17 Nov 17 Dec 17 Jan 18 Feb 18 Mar 18 Apr 18 May 18
vvdsvdvsdy
MARR FTSE Italy STAR (Rebased)
Source: Factset

Cembre
For important disclosure information, please refer to the disclaimer page of this report Page 24 of 56
Q1-18e results should be coherent with full year trends
The facts: Cembre should report results on Monday, May 14th
Our analysis: Results should be coherent with full year trends. The fall in tax rate
reflects the patent box effects.
Conclusion & Action: Rating and price target confirmed
Cembre: Quarterly results
(EUR m) 1Q17A 1Q18e %ch.
Sales 33.2 35.5 7%
EBITDA 8.9 9.6 8%
% sales 26.9% 27.1%
D&A (1.5) (1.7) 8%
EBIT 7.4 8.0 8%
% sales 22.3% 22.5%
Net Fin. Costs (0.1) 0.0
EBT 7.3 8.0 9%
Taxes (2.2) (2.0) -10%
Tax rate 30% 25%
Net profit 5.1 6.0 17%
Net debt/(cash) (26.7) (19.2)
Source: Company Data, Banca Akros forecasts
Cembre
Italy | General Industrials
GENERAL INDUSTRIALS Cembre (Neutral) Q1 18 preview: expected results without particular surprises
Analyser 14 May 2018
Analyst(s)
Andrea Bonfà
+39 02 4344 4269
Neutral
26.70
closing price as of 11/05/2018
22.00
-17.6%Upside/Downside Potential
Target Price unchanged
Recommendation unchanged
Target price: EUR
Share price: EUR
Reuters/Bloomberg CEMB.MI/CMB IM
Market capitalisation (EURm) 454
Current N° of shares (m) 17
Free float 26%
Daily avg. no. trad. sh. 12 mth 11
Daily avg. trad. vol. 12 mth (m) 277.21
Price high/low 12 months 18.90 / 26.70
Abs Perfs 1/3/12 mths (%) 15.09/21.36/37.13
Key financials (EUR) 12/17 12/18e 12/19e
Sales (m) 133 143 148
EBITDA (m) 33 37 38
EBITDA margin 25.2% 25.9% 25.9%
EBIT (m) 27 30 31
EBIT margin 20.4% 20.9% 20.9%
Net Profit (adj.)(m) 23 22 23
ROCE 15.5% 17.0% 17.4%
Net debt/(cash) (m) (20) (28) (36)
Net Debt/Equity -0.1 -0.2 -0.2
Debt/EBITDA -0.6 -0.8 -0.9
Int. cover(EBITDA/Fin. int) (655.6) high high
EV/Sales 2.7 3.0 2.9
EV/EBITDA 10.5 11.7 11.0
EV/EBITDA (adj.) 10.5 11.7 11.0
EV/EBIT 13.0 14.4 13.6
P/E (adj.) 16.1 20.3 19.5
P/BV 2.6 3.0 2.8
OpFCF yield 2.8% 4.7% 4.7%
Dividend yield 2.6% 3.0% 3.0%
EPS (adj.) 1.34 1.32 1.37
BVPS 8.42 8.93 9.50
DPS 0.70 0.80 0.80
Shareholders
Rosani Family 70%; Lazard 2%; Financier De L'Echiquier
1.48%;
17
18
19
20
21
22
23
24
25
26
27
Apr 17 May 17 Jun 17 Jul 17 Aug 17 Sep 17 Oct 17 Nov 17 Dec 17 Jan 18 Feb 18 Mar 18 Apr 18 May 18
vvdsvdvsdy
CEMBRE FTSE Italy STAR (Rebased)
Source: Factset

Abivax
For important disclosure information, please refer to the disclaimer page of this report Page 25 of 56
On track to deliver topline data in ulcerative colitis in 2H18
The facts: This morning Abivax, a company specialized in immunology, announced
it completed enrollment of 30 patients of its phase IIa proof-of-concept study in
ulcerative colitis (UC) for its lead compound ABX464. Ulcerative Colitis concerns
chronic inflammation of the colon and rectum.
Our analysis: Though we put more weight on Abivax developments and data
(topline June/July) in HIV in potentially developing a functional cure, recruitment in
UC puts the company on track to meet readouts late 2H18; which could have a
halo-effect on development of ABX464 in HIV.
The trial is constructed as a 30 patient, randomized double-blind, 2 month multi
centre trial evaluating the safety of ABX464 (50mg; same dose as HIV) once daily
vs placebo for moderate-to-severe patients who do not respond to
immunomodulators, corticosteroids, TNFα or vedolizumab (first until fourth line). In
literature response for the aforementioned drug classes are between 40%-65%, but
typically patients build up resistance rapidly ultimately leading to a colectomy,
highlighting why there is well defined market potential in UC (~2m patients EU &
US, TAM ~€2bn). After the trial Abivax has planned a 12 month open label follow up
study of which 10 patients are already recruited, if the trial moves on it is likely to
enter phase IIb where it will position as a third/fourth line compound in a growing
market of inflammatory bowel diseases (UC and Crohn’s disease).
ABX464 has an anti-inflammatory effect and is therefore being studied in both UC
and HIV. An efficacy signal in UC would improve ABX464’s potential in HIV as
chronic inflammation is a key cause of co-morbidities.
Conclusion & Action: We believe Abivax is on track for major value inflecting
newsflow in the next 12 months for its lead phase II compound ABX464 where HIV
data could prove transformative. We expect UC data is likely to support our thesis in
HIV in addition to giving an inroad into a new and growing indication within
inflammatory bowel diseases.
Abivax
France | Healthcare
HEALTHCARE Abivax (Buy) Q1-18e results should be coherent with full year trends
Analyser 14 May 2018
Analyst(s)
Dylan van Haaften
+31 (0)61 191 54 85
Anita Ye
+31 (0)62 116 17 87
Buy
6.96
closing price as of 11/05/2018
15.10
117.0%Upside/Downside Potential
Target Price unchanged
Recommendation unchanged
Target price: EUR
Share price: EUR
Reuters/Bloomberg ABVX.PA/ABVX FP
Market capitalisation (EURm) 94
Current N° of shares (m) 14
Free float 25%
Daily avg. no. trad. sh. 12 mth 30
Daily avg. trad. vol. 12 mth (m) 259.90
Price high/low 12 months 6.96 / 16.73
Abs Perfs 1/3/12 mths (%) -6.95/-11.22/-60.39
Key financials (EUR) 12/16 12/17e 12/18e
Sales (m) 0 0 0
EBITDA (m) (18) (14) (15)
EBITDA margin nm nm nm
EBIT (m) (18) (14) (15)
EBIT margin nm nm nm
Net Profit (adj.)(m) (14) (10) (15)
ROCE -36.7% -28.9% -29.5%
Net debt/(cash) (m) (23) (12) (26)
Net Debt/Equity -0.4 -0.3 -0.4
Debt/EBITDA 1.2 0.8 1.7
Int. cover(EBITDA/Fin. int) 70.7 31.8 65.5
EV/Sales nm nm
EV/EBITDA nm nm
EV/EBITDA (adj.) nm nm
EV/EBIT nm nm
P/E (adj.) nm nm nm
P/BV 1.9 1.6
OpFCF yield -26.9% -13.3% -16.6%
Dividend yield 0.0% 0.0%
EPS (adj.) (1.47) (1.07) (1.09)
BVPS 4.55 4.39
DPS 0.00 0.00
Shareholders
Truffle capital 66%; Aviva 5%; Holding Incubatrice 3%; Credit
Agricole 1.63%;
6
8
10
12
14
16
18
Apr 17 May 17 Jun 17 Jul 17 Aug 17 Sep 17 Oct 17 Nov 17 Dec 17 Jan 18 Feb 18 Mar 18 Apr 18 May 18
vvdsvdvsdy
ABIVAX CAC Small & Mid 190 (Rebased)
Source: Factset

Biotest
For important disclosure information, please refer to the disclaimer page of this report Page 26 of 56
Implications of a Potential Domination Agreement
The facts: On February 8th 2018, an announcement was made that Tiancheng
Pharmaceutical (Creat Group) has the intention to enter into a domination and profit
and loss transfer agreement with Biotest.
If Creat proceeds with such an agreement, the Biotest preference shares would
receive another offer which would depend on the outcome of the valuation
conducted by independent auditors. We describe the valuation process and attempt
to arrive at an approximate value at which the preference shareholders would have
the opportunity to exit their investment
The company is in the process of selling its US operations and investing heavily in
the Biotest Next Level (BNL) project. While the benefits would take time to
materialize, the company expects doubling of capacity from BNL.
Our analysis: We believe that implementation of the domination and profit and loss
transfer agreement is the most likely scenario. This arrangement would allow Creat
to increase control of Biotest, transfer assets and profits in a more beneficial way
and integrate the company with its other portfolio assets.
The preference shareholders might have an opportunity to exit their investment at a
better price than initially offered. A fair value opinion would be based on the higher
of: a) the intrinsic value generated by the auditors valuation, which would be based
on planning assumptions included in the business plan (that would be provided by
Biotest), which we estimate at EUR 25.00 per share and b) the 3-month VWAP of
preference shares just prior to the announcement of the intention to enter into a
domination agreement (EUR 22.39), which would serve as the floor price, providing
limited downside risk.
We estimate potential revenue over EUR 1bn by the end of 2027. By then, the
company expects reaching a sustainable 16-18% EBIT margin.
Conclusion & Action: We raise our target price to EUR 25.00 per preference share
based on our valuation of Biotest assuming estimates that would likely be used in
the analysis by the auditors. We thus maintain our Neutral recommendation, but
note potential upside from the optionality inherent in the process of executing a
domination agreement, while the downside is limited, with the VWAP of ca. EUR
22.40/preference share prior to the announcement likely providing a floor under
such a scenario.
Biotest
Sponsored Research
Germany | Healthcare
HEALTHCARE Biotest (Neutral) On track to deliver topline data in ulcerative colitis in 2H18
Analyser 14 May 2018
Analyst(s)
Marietta Miemietz CFA
+49-69-58997-439
Dennis Berzhanin
+49 69 58997 434
Neutral
25.50
closing price as of 11/05/2018
25.00
18.00
-2.0%Upside/Downside Potential
from Target Price: EUR
Recommendation unchanged
Target price: EUR
Share price: EUR
Reuters/Bloomberg BIOG_P.DE/BIO3 GR
Market capitalisation (EURm) 1,050
Current N° of shares (m) 40
Free float 52%
Daily avg. no. trad. sh. 12 mth 51
Daily avg. trad. vol. 12 mth (m) 417.19
Price high/low 12 months 18.50 / 27.60
Abs Perfs 1/3/12 mths (%) -5.03/-5.38/30.14
Key financials (EUR) 12/17 12/18e 12/19e
Sales (m) 378 393 413
EBITDA (m) 13 63 68
EBITDA margin 3.4% 16.1% 16.5%
EBIT (m) (9) 12 17
EBIT margin nm 3.0% 4.0%
Net Profit (adj.)(m) (16) 1 4
ROCE 4.1% 1.1% 1.5%
Net debt/(cash) (m) 384 295 282
Net Debt/Equity 1.1 0.8 0.7
Debt/EBITDA 29.5 4.6 4.1
Int. cover(EBITDA/Fin. int) 0.8 6.1 6.5
EV/Sales 3.5 3.6 2.2
EV/EBITDA nm 22.6 13.5
EV/EBITDA (adj.) 20.6 22.6 13.5
EV/EBIT nm nm 55.8
P/E (adj.) nm nm nm
P/BV 2.3 2.8 1.3
OpFCF yield -9.9% -2.5% 2.7%
Dividend yield 0.2% 0.2% 0.2%
EPS (adj.) (0.41) 0.02 0.22
BVPS 8.78 9.24 19.33
DPS 0.06 0.04 0.04
Shareholders
Tiancheng (for Creat Group) 45%; JO Hambro 3%;
16
18
20
22
24
26
28
Apr 17 Mai 17 Jun 17 Jul 17 Aug 17 Sep 17 Okt 17 Nov 17 Dez 17 Jan 18 Feb 18 Mrz 18 Apr 18 Mai 18
vvdsvdvsdy
BIOTEST Stoxx Healthcare (Rebased)
Source: Factset

El.En.
For important disclosure information, please refer to the disclaimer page of this report Page 27 of 56
Results Preview
The facts: Elen should report Q1-18e results on Tuesday, May 15th
.
Our analysis: Results should be subdued compared with company’s guidance and
our forecasts mainly due to difficult comparison basis on the forex side with both the
CNY and USD devaluating materially in Q1 by 7% and 15% respectively. We remind
investors that although only translational, the industrial business is 60% made in
China (app. EUR 80m) while the medical laser business is exposed with directs
export of the Monalisa Touch and other products to the USA. We expect the same
forex trends in Q2’18e and then a much better comparison in H2’18e with virtually
no forex headwind at current exchange rates.
Conclusion & Action: We are confirming our PT on ELEN based on our SOP but
given the limited implied upside from current share price levels we change our rating
from BUY to NEUTRAL.
ELEN: Quarterly results
DIVISION (Eurm) Q1 '17a Q1 '18e %Ch.
Industrial Systems 26.1 28.4 9%
% total 40% 41%
Easthetical/Medical Laser 39.1 41.2 5%
% total 60% 59%
Total 65.1 69.6 7%
Eurm 1Q17a 1Q18e %Ch.
Sales 65.1 69.6 7%
Gross margin 26.9 28.8 7%
% sales 41.3% 41.3%
Other op. costs (8.1) (8.8) 8%
Added value 18.8 20.0 6%
% sales 28.9% 28.7%
Labour costs (12.3) (13.4) 9%
EBITDA 6.5 6.6 1%
EBITDA Margin 10.0% 9.5%
D&A (1.0) (1.0) 0%
EBIT 5.5 5.6 2%
EBIT margin 8.5% 8.1%
Forex (0.3) 0.0
Associates 0.0 0.0
Net Fin. Inc./(costs) 0.0 0.0
Extraordinary items 0.0 0.0
Pre-tax profit 5.2 5.6 9%
Net Debt/(Cash) (79.2) (79.5)
Source: Company Data, Banca Akros forecasts
El.En.
Italy | Healthcare
HEALTHCARE El.En. (Neutral) On track to deliver topline data in ulcerative colitis in 2H18
Analyser 14 May 2018
Analyst(s)
Andrea Bonfà
+39 02 4344 4269
Neutral
33.48
closing price as of 11/05/2018
34.00
1.6%Upside/Downside Potential
Target Price unchanged
from Buy
Target price: EUR
Share price: EUR
Reuters/Bloomberg ELEN.MI/ELN IM
Market capitalisation (EURm) 646
Current N° of shares (m) 19
Free float 64%
Daily avg. no. trad. sh. 12 mth 94
Daily avg. trad. vol. 12 mth (m) 1,783.99
Price high/low 12 months 21.08 / 34.54
Abs Perfs 1/3/12 mths (%) 4.82/33.81/-1.01
Key financials (EUR) 12/17 12/18e 12/19e
Sales (m) 306 345 372
EBITDA (m) 36 42 50
EBITDA margin 11.8% 12.3% 13.3%
EBIT (m) 30 37 44
EBIT margin 9.9% 10.6% 11.7%
Net Profit (adj.)(m) 16 22 27
ROCE 21.4% 23.4% 25.3%
Net debt/(cash) (m) (85) (90) (102)
Net Debt/Equity -0.4 -0.4 -0.4
Debt/EBITDA -2.3 -2.1 -2.1
Int. cover(EBITDA/Fin. int) (64.1) high high
EV/Sales 1.7 1.9 1.7
EV/EBITDA 14.3 15.5 13.0
EV/EBITDA (adj.) 14.3 15.5 13.0
EV/EBIT 17.0 17.8 14.8
P/E (adj.) 32.0 29.3 24.0
P/BV 2.6 3.2 2.9
OpFCF yield 2.9% 2.6% 3.3%
Dividend yield 1.2% 1.2% 1.2%
EPS (adj.) 0.81 1.14 1.39
BVPS 9.88 10.56 11.55
DPS 0.40 0.40 0.40
Shareholders
Cangioli Andrea 15%; Pecci Alberto 11%; Clementi Gabriele
10%;
20
22
24
26
28
30
32
34
36
38
Apr 17 May 17 Jun 17 Jul 17 Aug 17 Sep 17 Oct 17 Nov 17 Dec 17 Jan 18 Feb 18 Mar 18 Apr 18 May 18
vvdsvdvsdy
El.En. FTSE Italy STAR (Rebased)
Source: Factset

Philips Lighting
For important disclosure information, please refer to the disclaimer page of this report Page 28 of 56
Small Chinese add on acquisition
The facts: Philips Lighting acquires Chinese urban lighting company LiteMagic
Technologies with revenues of ~EUR 30m. No further financial details were
disclosed.
Our analysis: Philips Lighting is going to acquire Shenzhen LiteMagic
Technologies, a Chinese manufacturer and seller of lighting luminaires and control
systems for urban and façade lighting. The transaction (upon approval of Chinese
regulatory authorities), is expected to close Q3 and should be earnings accretive in
2019.
With Shenzhen LiteMagic Philips Lighting expands its portfolio of façade lighting
with a complementary portfolio of luminaires and control systems which will be
applied to capture growth in the mid segment of the urban market.
Philips Lighting has been in China since 1920. Currently the company serves
professional and consumer markets through its 36 sales offices, more than 300
branded retail stores and 10,000 outlets. Philips Lighting's second largest research
and development center is located in China while it also operates five manufacturing
sites in the country.
Conclusion & Action: This is a smaller add on acquisition for Philips Lighting and
acquiring a Chinese company (which is refreshing for a change) is the way to gain a
stronger foothold in the region. It is also in line with the strategy to grow both
organically and through selected acquisitions. As such a small positive. We have a
Neutral rating and PT of EUR 31.
Philips Lighting
Netherlands | Household Goods
HOUSEHOLD GOODS Philips Lighting (Neutral) Results Preview
Analyser 14 May 2018
Analyst(s)
Edwin de Jong
+312 0 5508569
Neutral
25.90
closing price as of 11/05/2018
31.00
19.7%Upside/Downside Potential
Target Price unchanged
Recommendation unchanged
Target price: EUR
Share price: EUR
Reuters/Bloomberg LIGHT.AS/LIGHT NA
Market capitalisation (EURm) 3,631
Current N° of shares (m) 140
Free float 63%
Daily avg. no. trad. sh. 12 mth 532
Daily avg. trad. vol. 12 mth (m) 25,525.13
Price high/low 12 months 25.24 / 35.95
Abs Perfs 1/3/12 mths (%) -14.58/-13.92/-18.43
Key financials (EUR) 12/17 12/18e 12/19e
Sales (m) 6,965 7,085 7,304
EBITDA (m) 675 779 791
EBITDA margin 9.7% 11.0% 10.8%
EBIT (m) 388 489 496
EBIT margin 5.6% 6.9% 6.8%
Net Profit (adj.)(m) 365 405 402
ROCE 10.1% 13.6% 14.8%
Net debt/(cash) (m) 520 263 (40)
Net Debt/Equity 0.2 0.1 0.0
Debt/EBITDA 0.8 0.3 -0.1
Int. cover(EBITDA/Fin. int) 15.7 24.1 24.6
EV/Sales 0.7 0.5 0.5
EV/EBITDA 7.1 5.0 4.5
EV/EBITDA (adj.) 7.1 5.0 4.5
EV/EBIT 12.4 8.0 7.2
P/E (adj.) 11.7 9.0 9.0
P/BV 1.6 1.3 1.2
OpFCF yield 4.3% 12.0% 13.0%
Dividend yield 4.8% 4.8% 4.5%
EPS (adj.) 2.61 2.89 2.87
BVPS 18.74 19.77 20.94
DPS 1.25 1.25 1.17
Shareholders
Philips 29%; Schroders 3%; Standard Life 5%;
24
26
28
30
32
34
36
Apr 17 May 17 Jun 17 Jul 17 Aug 17 Sep 17 Oct 17 Nov 17 Dec 17 Jan 18 Feb 18 Mar 18 Apr 18 May 18
vvdsvdvsdy
PHILIPS LIGHTING Amsterdam Small Cap Index (Rebased)
Source: Factset
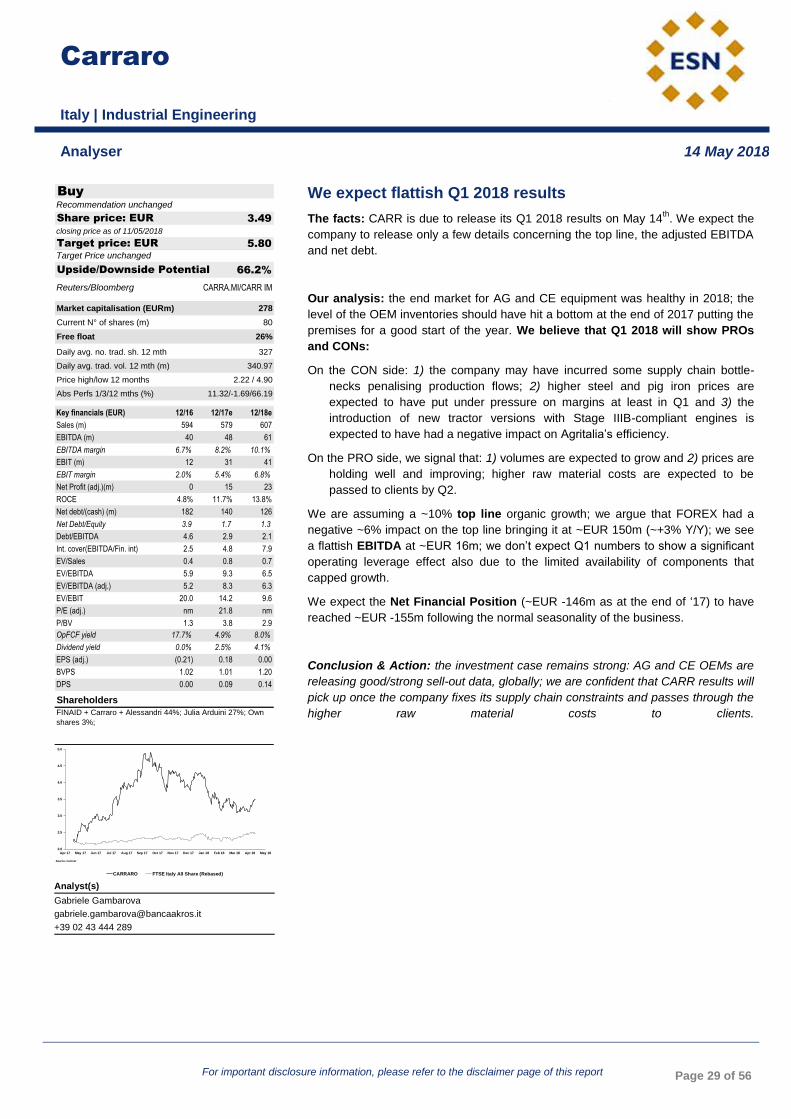
Carraro
For important disclosure information, please refer to the disclaimer page of this report Page 29 of 56
We expect flattish Q1 2018 results
The facts: CARR is due to release its Q1 2018 results on May 14th
. We expect the
company to release only a few details concerning the top line, the adjusted EBITDA
and net debt.
Our analysis: the end market for AG and CE equipment was healthy in 2018; the
level of the OEM inventories should have hit a bottom at the end of 2017 putting the
premises for a good start of the year. We believe that Q1 2018 will show PROs
and CONs:
On the CON side: 1) the company may have incurred some supply chain bottle-
necks penalising production flows; 2) higher steel and pig iron prices are
expected to have put under pressure on margins at least in Q1 and 3) the
introduction of new tractor versions with Stage IIIB-compliant engines is
expected to have had a negative impact on Agritalia’s efficiency.
On the PRO side, we signal that: 1) volumes are expected to grow and 2) prices are
holding well and improving; higher raw material costs are expected to be
passed to clients by Q2.
We are assuming a ~10% top line organic growth; we argue that FOREX had a
negative ~6% impact on the top line bringing it at ~EUR 150m (~+3% Y/Y); we see
a flattish EBITDA at ~EUR 16m; we don’t expect Q1 numbers to show a significant
operating leverage effect also due to the limited availability of components that
capped growth.
We expect the Net Financial Position (~EUR -146m as at the end of ‘17) to have
reached ~EUR -155m following the normal seasonality of the business.
Conclusion & Action: the investment case remains strong: AG and CE OEMs are
releasing good/strong sell-out data, globally; we are confident that CARR results will
pick up once the company fixes its supply chain constraints and passes through the
higher raw material costs to clients.
Carraro
Italy | Industrial Engineering
INDUSTRIAL ENGINEERING Carraro (Buy) Small Chinese add on acquisition
Analyser 14 May 2018
Analyst(s)
Gabriele Gambarova
+39 02 43 444 289
Buy
3.49
closing price as of 11/05/2018
5.80
66.2%Upside/Downside Potential
Target Price unchanged
Recommendation unchanged
Target price: EUR
Share price: EUR
Reuters/Bloomberg CARRA.MI/CARR IM
Market capitalisation (EURm) 278
Current N° of shares (m) 80
Free float 26%
Daily avg. no. trad. sh. 12 mth 327
Daily avg. trad. vol. 12 mth (m) 340.97
Price high/low 12 months 2.22 / 4.90
Abs Perfs 1/3/12 mths (%) 11.32/-1.69/66.19
Key financials (EUR) 12/16 12/17e 12/18e
Sales (m) 594 579 607
EBITDA (m) 40 48 61
EBITDA margin 6.7% 8.2% 10.1%
EBIT (m) 12 31 41
EBIT margin 2.0% 5.4% 6.8%
Net Profit (adj.)(m) 0 15 23
ROCE 4.8% 11.7% 13.8%
Net debt/(cash) (m) 182 140 126
Net Debt/Equity 3.9 1.7 1.3
Debt/EBITDA 4.6 2.9 2.1
Int. cover(EBITDA/Fin. int) 2.5 4.8 7.9
EV/Sales 0.4 0.8 0.7
EV/EBITDA 5.9 9.3 6.5
EV/EBITDA (adj.) 5.2 8.3 6.3
EV/EBIT 20.0 14.2 9.6
P/E (adj.) nm 21.8 nm
P/BV 1.3 3.8 2.9
OpFCF yield 17.7% 4.9% 8.0%
Dividend yield 0.0% 2.5% 4.1%
EPS (adj.) (0.21) 0.18 0.00
BVPS 1.02 1.01 1.20
DPS 0.00 0.09 0.14
Shareholders
FINAID + Carraro + Alessandri 44%; Julia Arduini 27%; Own
shares 3%;
2.0
2.5
3.0
3.5
4.0
4.5
5.0
Apr 17 May 17 Jun 17 Jul 17 Aug 17 Sep 17 Oct 17 Nov 17 Dec 17 Jan 18 Feb 18 Mar 18 Apr 18 May 18
vvdsvdvsdy
CARRARO FTSE Italy All Share (Rebased)
Source: Factset

Cattolica Assicurazioni
For important disclosure information, please refer to the disclaimer page of this report Page 30 of 56
Q1-18 CC feedback
The facts: Cattolica held a conference call on Q1-18 results at 9.30 AM CEST on
Friday.
Our analysis: we highlight the most important takeaways here to follow.
Operating result. Operating results increased by c. 4% to EUR 45m in Q1 while net
profit decreased by c. 20% to EUR 24m. The difference is due to the interests on
the subordinated bond issued last year and to the lower capital gains, especially in
Non-Auto business;
Non-Life business – Non-Motor business decreased by c. 3.5% , due to the lack of
the JV with BPVI and to some one-offs. Net of this effects, the increase would have
been c. 1.5%, more in line with the trend expected in the business plan. CoR closed
at 93.7% from 93.4% in Q1-17 mainly due to the expense ratio (27.4% from 25.4%)
due to the increase in commissions (1%) linked to some reinsurance contracts and
to G&A costs (1%) due to the implementation of the strategic plan. The average
motor premium increase by c. 0.2% q/q but decline 1% Y/Y. The number of policies
decreased c. 0.2% q/q, decrease that the management expects will disappear in the
next quarters of the year;
Life business – premiums increased +1.7% Y/Y despite the end of the JV with
BPVI and thanks to CASS’ other JV (Lombarda Vita and BCC Vita). Net inflows
closed at c. EUR 26m vs EUR 432m in Q1-17, due to the expiration of a pension
fund mandate which anyway had a low profitability. The spread between average
yield and minimum guaranteed is still improving and it was equal to c. 200bps at the
end of Q1-18;
Investments – the de-risking policy is ongoing with the weight of Italian
Government bonds reduced to 58.4% from the previous 60.5% with the aim to
achieve 50% in 2020. At the moment Cattolica is investing in Bonos and in RE to
underpin the expected decrease in portfolio yield as a consequence of the
aforementioned de-risking policy;
SII Ratio – the decrease in SII ratio (from 245% in FY-17 to 199% in Q1-18) was
due to the dividend (-6%), to the market movements (+15%) and to the JV with
BBPM (-55%). The SII sensitivity seems challenging: an increase of c. 50bps in
Italian spread will determine a decrease by c. 11 pp in SII ratio;
Partnership with BBPM – the JV has started a little bit earlier than expected. In the
agreement there are some clauses related to net inflows (not disclosed) and we
understand that the focus will be on the sale of UL policies. The first effects of the
partnership will already start in Q2-18.
Conclusion & Action: the stock had a sharp drop after the call. The only negative
message, considering the Italian political situation, came from the sensitivity of the
SII ratio to the Italian spread. Considering that Cattolica had a SII ratio of c. 199% at
the end of Q1-18 with a business plan target between 160% - 180% in 2020, the
sensitivity could have worried some investors, also considering that Cattolica’s SII
ratio is a little bit worse than other Italian peers, mainly due recent partnership
signed with BBPM. Anyway, excluding any kind of shock, we believe that the
situation is manageable. We stick to Accumulate. The stock is not pricing the
bancaassurance agreement with BBPM, which is a game changer for the company
and it is likely to give the boost to CASS’s profit in 2020 and beyond.
Cattolica Assicurazioni
Italy | Insurance
INSURANCE Cattolica Assicurazioni (Accumulate) We expect flattish Q1 2018 results
Analyser 14 May 2018
Analyst(s)
Enrico Esposti, CIIA
+39 02 4344 4022
Accumulate
8.49
closing price as of 11/05/2018
10.00
10.60
17.8%Upside/Downside Potential
from Target Price: EUR
from Neutral
Target price: EUR
Share price: EUR
Reuters/Bloomberg CASS.MI/CASS IM
Market capitalisation (EURm) 1,423
Current N° of shares (m) 168
Free float 91%
Daily avg. no. trad. sh. 12 mth 840
Daily avg. trad. vol. 12 mth (m) 25,340.61
Price high/low 12 months 6.79 / 10.73
Abs Perfs 1/3/12 mths (%) 0.41/-12.16/8.29
Key financials (EUR) 12/17 12/18e 12/19e
Life Gross premiums (m) 2,751 2,888 3,723
Non-Life Gross prem.(m) 2,059 2,120 2,251
Total Net Revenues (m) 5,062 5,298 6,265
Life Ins.Tech.Result (m) -386 -395 -397
Non-Life Ins. Tech.Result 95 97 122
EBIT (m) 206 239 289
Net Profit (adj.) (m) 121 102 124
Shareholders Equity (m) 1,845 1,934 1,998
ANAV (m) 1,678 1,767 1,831
ROE (adj.) (%) 6.5 5.4 6.3
Combined ratio (%) 94.7 94.7 93.7
Solvency Ratio 239.0% 200.0% 180.0%
P/E (adj.) 12.5 13.9 11.5
P/BV 0.8 0.7 0.7
P/ANAV nm nm nm
P/EbV nm nm nm
Dividend Yield 4.1% 4.2% 5.1%
EPS (adj.) 0.72 0.61 0.74
BVPS 11.01 11.54 11.92
ANAVPS 0.00 0.00 0.00
EbVPS 0.00 0.00 0.00
DPS 0.35 0.36 0.44
Shareholders
Berkshire Hathaway 9%;
6.5
7.0
7.5
8.0
8.5
9.0
9.5
10.0
10.5
11.0
apr 17 mag 17 giu 17 lug 17 ago 17 set 17 ott 17 nov 17 dic 17 gen 18 feb 18 mar 18 apr 18 mag 18
vvdsvdvsdy
CATTOLICA ASSICURAZIONI FTSE Italy All Share (Rebased)
Source: Factset

UnipolSai
For important disclosure information, please refer to the disclaimer page of this report Page 31 of 56
Conference call feedback: no material news emerged
The facts: UnipolSai reported its Q1-18 results on Friday, followed by a conference
call.
Our analysis: the conference call set the following most important takeaways:
Non-Life business – the average premium had been pretty stable in Q1-18 while
the decrease by c. 3% in claims can explain the improvement in the technical
result.The decrease in Non-Auto business premiums (-1.7% Y/Y) was mainly
due to the drop in value-contracts, but the decline is likely to be offset in the
next quarters of the year. The reserve release was c. EUR 85m (o/w EUR 25m
in Auto) in Q1-18 vs EUR 97m in Q1-17 with a positive impact of c. 4.5% on the
loss ratio. The consolidation of Linear and Unisalute had a positive impact on
UnipolSai’ s CoR, considering that Unisalute has a CoR of c. 85% and its
premiums growth was c. 5% in Q1-18;
BPER - Mr Cimbri reiterated its opinion on BPER, saying that Unipol can participate
to any capital increase aiming at improving bank’s profitability;
RE & Other businesses - the negative result in Q1-18 (EUR -45m) was mainly due
to a one-off of c. EUR 35m, gross of taxes, and related to “Area Castello” in
Florence, RE asset that is likely to be sold soon;
Unipol Banca – the bank had a CET1 stand-alone of 10.5%. Mr Cimbri said again
that Unipol Banca could be merged with another bank only if the transaction is
profitable;
Insurance JVs: Unipol’s stake in Arca Vita (c. 63.4%) will be transferred to
UnipolSai, as planned, by H1-18. The transaction ought to have a positive
impact, gross of taxes, around EUR 100m on statutory financial statement and
c. 11bps on SII ratio;
Unipol: Unipol had c. EUR 1.3bn in cash and cash equivalents at the end of Q1-18.
After dividends and the sale of Arca, cash and cash equivalents would have
been around EUR 2bn, while NFP c. EUR 600m.
Conclusion & Action: The business plan target achievement is in progress. We
expect a new business plan in H1-19. According to our view, the merger with Unipol
is on the cards sooner or later. Neutral reiterated.
UnipolSai
Italy | Insurance
INSURANCE UnipolSai (Neutral) Q1-18 CC feedback
Analyser 14 May 2018
Analyst(s)
Enrico Esposti, CIIA
+39 02 4344 4022
Neutral
2.18
closing price as of 11/05/2018
2.10
-3.8%Upside/Downside Potential
Target Price unchanged
Recommendation unchanged
Target price: EUR
Share price: EUR
Reuters/Bloomberg US.MI/US IM
Market capitalisation (EURm) 6,252
Current N° of shares (m) 2,865
Free float 27%
Daily avg. no. trad. sh. 12 mth 6,309
Daily avg. trad. vol. 12 mth (m) 18,134.41
Price high/low 12 months 1.85 / 2.25
Abs Perfs 1/3/12 mths (%) 7.81/8.94/-0.37
Key financials (EUR) 12/17 12/18e 12/19e
Life Gross premiums (m) 3,713 3,787 3,863
Non-Life Gross prem.(m) 7,355 7,558 7,792
Total Net Revenues (m) 11,988 12,408 12,710
EBIT (m) 760 784 781
Net Profit (adj.) (m) 504 523 520
Shareholders Equity (m) 5,869 5,068 5,192
ANAV (m) 5,178 4,263 4,387
ROE (adj.) (%) 8.7 9.9 10.5
Combined ratio (%) 97.2 96.3 96.5
Solvency Ratio 216.4% 168.0% 171.1%
P/E (adj.) 11.1 12.0 12.0
P/BV 1.0 1.2 1.2
P/ANAV 1.1 1.5 1.4
P/EbV 1.0 1.4 1.4
Dividend Yield 6.6% 6.4% 5.9%
EPS (adj.) 0.18 0.18 0.18
BVPS 2.05 1.77 1.81
ANAVPS 1.81 1.49 1.53
EbVPS 1.87 1.54 1.58
DPS 0.15 0.14 0.13
Shareholders
Unipol Gruppo Finanziario S.p.A. 73%;
1.80
1.90
2.00
2.10
2.20
2.30
2.40
Apr 17 May 17 Jun 17 Jul 17 Aug 17 Sep 17 Oct 17 Nov 17 Dec 17 Jan 18 Feb 18 Mar 18 Apr 18 May 18
vvdsvdvsdy
UNIPOLSAI Stoxx Insurance (Rebased)
Source: Factset
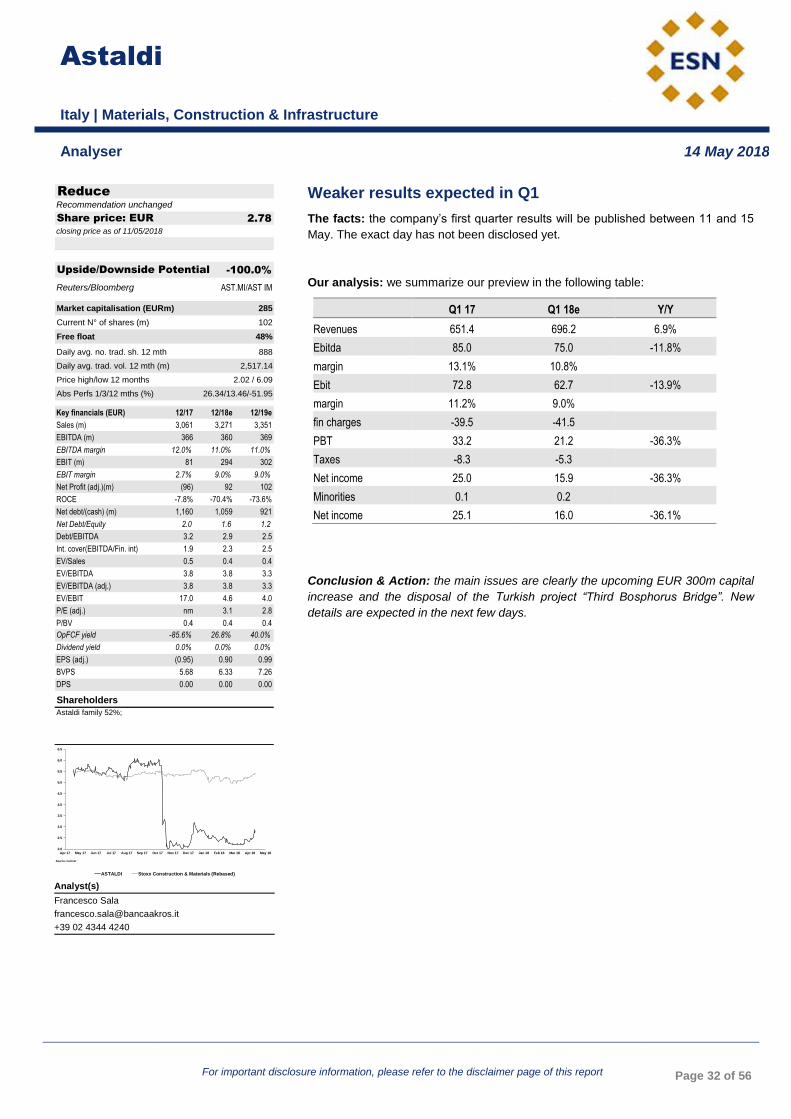
Astaldi
For important disclosure information, please refer to the disclaimer page of this report Page 32 of 56
Weaker results expected in Q1
The facts: the company’s first quarter results will be published between 11 and 15
May. The exact day has not been disclosed yet.
Our analysis: we summarize our preview in the following table:
Q1 17 Q1 18e Y/Y
Revenues 651.4 696.2 6.9%
Ebitda 85.0 75.0 -11.8%
margin 13.1% 10.8%
Ebit 72.8 62.7 -13.9%
margin 11.2% 9.0%
fin charges -39.5 -41.5
PBT 33.2 21.2 -36.3%
Taxes -8.3 -5.3
Net income 25.0 15.9 -36.3%
Minorities 0.1 0.2
Net income 25.1 16.0 -36.1%
Conclusion & Action: the main issues are clearly the upcoming EUR 300m capital
increase and the disposal of the Turkish project “Third Bosphorus Bridge”. New
details are expected in the next few days.
Astaldi
Italy | Materials, Construction & Infrastructure
MATERIALS, CONSTRUCTION & INFRASTRUCTURE Astaldi (Reduce) Conference call feedback: no material news emerged
Analyser 14 May 2018
Analyst(s)
Francesco Sala
+39 02 4344 4240
Reduce
2.78
closing price as of 11/05/2018
-100.0%Upside/Downside Potential
Recommendation unchanged
Share price: EUR
Reuters/Bloomberg AST.MI/AST IM
Market capitalisation (EURm) 285
Current N° of shares (m) 102
Free float 48%
Daily avg. no. trad. sh. 12 mth 888
Daily avg. trad. vol. 12 mth (m) 2,517.14
Price high/low 12 months 2.02 / 6.09
Abs Perfs 1/3/12 mths (%) 26.34/13.46/-51.95
Key financials (EUR) 12/17 12/18e 12/19e
Sales (m) 3,061 3,271 3,351
EBITDA (m) 366 360 369
EBITDA margin 12.0% 11.0% 11.0%
EBIT (m) 81 294 302
EBIT margin 2.7% 9.0% 9.0%
Net Profit (adj.)(m) (96) 92 102
ROCE -7.8% -70.4% -73.6%
Net debt/(cash) (m) 1,160 1,059 921
Net Debt/Equity 2.0 1.6 1.2
Debt/EBITDA 3.2 2.9 2.5
Int. cover(EBITDA/Fin. int) 1.9 2.3 2.5
EV/Sales 0.5 0.4 0.4
EV/EBITDA 3.8 3.8 3.3
EV/EBITDA (adj.) 3.8 3.8 3.3
EV/EBIT 17.0 4.6 4.0
P/E (adj.) nm 3.1 2.8
P/BV 0.4 0.4 0.4
OpFCF yield -85.6% 26.8% 40.0%
Dividend yield 0.0% 0.0% 0.0%
EPS (adj.) (0.95) 0.90 0.99
BVPS 5.68 6.33 7.26
DPS 0.00 0.00 0.00
Shareholders
Astaldi family 52%;
2.0
2.5
3.0
3.5
4.0
4.5
5.0
5.5
6.0
6.5
Apr 17 May 17 Jun 17 Jul 17 Aug 17 Sep 17 Oct 17 Nov 17 Dec 17 Jan 18 Feb 18 Mar 18 Apr 18 May 18
vvdsvdvsdy
ASTALDI Stoxx Construction & Materials (Rebased)
Source: Factset

Atlantia
For important disclosure information, please refer to the disclaimer page of this report Page 33 of 56
Sound results in Q1
The facts: the company published its Q1 18 results on Friday before market
closing.
Our analysis: the company’s results showed a sound growth in revenues on the
back of higher tariffs and a better traffic; traffic on Italian motorways was up 1.0%
y/y in Q1 and 1.8% y/y on Italian airports.
Q1 17 Q1 18 Y/Y Q1 18e
Total revenues 1,296 1,336 3.1% 1,322
o/w Italian motor 849 873 2.8% 872
o/w Foreign motor 159 156 -1.9% 156
o/w airports 236 254 7.6% 241
o/w Other 58 60 3.4% 60
EBITDA 785 797 1.5% 803
% revenues 60.6% 59.7%
60.8%
EBIT 494 506 2.4% 511
PBT 371 384 3.5% 383
Net profit 176 217 23.3% 230
The company said it expected earnings growth in full year 2018.
Conclusion & Action: the results were good and the traffic performance remain
sound. After the model roll over and we increased our target price to EUR 31.0/sh.
Accumulate confirmed.
Atlantia
Italy | Materials, Construction & Infrastructure
MATERIALS, CONSTRUCTION & INFRASTRUCTURE Atlantia (Accumulate) Weaker results expected in Q1
Analyser 14 May 2018
Analyst(s)
Francesco Sala
+39 02 4344 4240
Accumulate
28.17
closing price as of 11/05/2018
31.00
28.50
10.0%Upside/Downside Potential
from Target Price: EUR
Recommendation unchanged
Target price: EUR
Share price: EUR
Reuters/Bloomberg ATL.MI/ATL IM
Market capitalisation (EURm) 23,262
Current N° of shares (m) 826
Free float 52%
Daily avg. no. trad. sh. 12 mth 1,886
Daily avg. trad. vol. 12 mth (m) 39,009.81
Price high/low 12 months 24.13 / 28.40
Abs Perfs 1/3/12 mths (%) 4.88/15.26/16.50
Key financials (EUR) 12/16 12/17e 12/18e
Sales (m) 5,484 5,978 6,115
EBITDA (m) 3,378 3,654 3,832
EBITDA margin 61.6% 61.1% 62.7%
EBIT (m) 2,315 2,453 2,537
EBIT margin 42.2% 41.0% 41.5%
Net Profit (adj.)(m) 936 976 1,036
ROCE 4.5% 4.9% 5.1%
Net debt/(cash) (m) 11,677 10,588 9,659
Net Debt/Equity 1.2 1.0 0.9
Debt/EBITDA 3.5 2.9 2.5
Int. cover(EBITDA/Fin. int) 6.3 7.2 8.5
EV/Sales 5.9 5.8 5.7
EV/EBITDA 9.5 9.4 9.1
EV/EBITDA (adj.) 9.5 9.4 9.1
EV/EBIT 13.9 14.0 13.8
P/E (adj.) 19.6 22.3 22.5
P/BV 2.5 2.9 3.0
OpFCF yield -2.9% 9.3% 8.5%
Dividend yield 3.4% 3.8% 4.1%
EPS (adj.) 1.13 1.18 1.25
BVPS 8.76 9.13 9.49
DPS 0.97 1.07 1.14
Shareholders
Sintonia 30%; Investco 8%; Blackrock 5%; Fondazione CRT
5%;
22
23
24
25
26
27
28
29
apr 17 mag 17 giu 17 lug 17 ago 17 set 17 ott 17 nov 17 dic 17 gen 18 feb 18 mar 18 apr 18 mag 18
vvdsvdvsdy
ATLANTIA Stoxx Construction & Materials (Rebased)
Source: Factset

Saint Gobain
For important disclosure information, please refer to the disclaimer page of this report Page 34 of 56
Sika: knock and the door will be opened
The facts: Saint-Gobain announced Friday that an agreement has been reached
settling the litigation between Saint-Gobain, SWH (Burkard family) and SIKA AG.
Our analysis: The agreement enables each party to save face. Saint-Gobain is not
able to take immediate control of SIKA, but gets the consolation prize (10% stake
capped at this level for four years, then at 12.75% for the subsequent two years). In
exchange (see our forthcoming report), the group has carried out an excellent
transaction. Saint-Gobain generates a capital gain of EUR600m (i.e. EUR1 per
share) between the acquisition price of the 16.97% stake (CHF3.22bn), and the sale
of 6.97% to SIKA for CHF2,080m, which shows a 45% premium to SIKA’s market
value.
Conclusion & Action: We have trimmed our IV to EUR53.5 based on a normalised
2020 EBIT of EUR3.671bn post recurring restructuring charges (vs. EUR3.700bn
previously). Our intrinsic value includes the 10% stake in SIKA. At its market value,
i.e. EUR1,719m, (CHF2,065m) this shows a latent capital gain of CHF925m
(EUR769m and EUR1.4 per share) based on the weighted cost price. Saint-Gobain,
whose earnings sequence disappointed between 2012 and 2015, has started a
sustained recovery supported by robust demand in US and the pick-up in
rehabilitation in France and the return to inflation, which is essential for the Building
merchants activity.
Saint Gobain
France | Materials, Construction & Infrastructure
MATERIALS, CONSTRUCTION & INFRASTRUCTURE Saint Gobain (Buy) Sound results in Q1
Analyser 14 May 2018
Analyst(s)
Jean-Christophe Lefèvre-Moulenq
+33 1 53 48 80 65
Buy
45.25
closing price as of 11/05/2018
53.50
53.60
18.2%Upside/Downside Potential
from Target Price: EUR
Recommendation unchanged
Target price: EUR
Share price: EUR
Reuters/Bloomberg SGOB.PA/SGO FP
Market capitalisation (EURm) 25,046
Current N° of shares (m) 554
Free float 84%
Daily avg. no. trad. sh. 12 mth 1,650
Daily avg. trad. vol. 12 mth (m) 101,482.31
Price high/low 12 months 42.35 / 51.37
Abs Perfs 1/3/12 mths (%) 5.04/6.40/-10.25
Key financials (EUR) 12/16 12/17e 12/18e
Sales (m) 39,093 40,810 41,994
EBITDA (m) 3,998 4,234 4,486
EBITDA margin 10.2% 10.4% 10.7%
EBIT (m) 2,818 3,028 3,224
EBIT margin 7.2% 7.4% 7.7%
Net Profit (adj.)(m) 1,398 1,631 1,606
ROCE 6.7% 7.4% 7.4%
Net debt/(cash) (m) 5,644 5,955 6,991
Net Debt/Equity 0.3 0.3 0.3
Debt/EBITDA 1.4 1.4 1.6
Int. cover(EBITDA/Fin. int) 7.4 9.5 9.3
EV/Sales 0.9 0.8 0.8
EV/EBITDA 8.3 8.1 7.5
EV/EBITDA (adj.) 8.3 8.1 7.5
EV/EBIT 11.8 11.3 10.5
P/E (adj.) 17.7 15.7 15.6
P/BV 1.3 1.4 1.3
OpFCF yield 1.9% 4.5% 4.4%
Dividend yield 2.8% 2.9% 3.1%
EPS (adj.) 2.50 2.92 2.90
BVPS 33.79 33.36 35.95
DPS 1.26 1.30 1.40
Shareholders
Wendel 3%; Blackrock 6%; Employees 7%; treasury stock
0.40%;
42
43
44
45
46
47
48
49
50
51
52
Apr 17 May 17 Jun 17 Jul 17 Aug 17 Sep 17 Oct 17 Nov 17 Dec 17 Jan 18 Feb 18 Mar 18 Apr 18 May 18
vvdsvdvsdy
SAINT GOBAIN Stoxx Construction & Materials (Rebased)
Source: Factset

Arnoldo Mondadori Editore
For important disclosure information, please refer to the disclaimer page of this report Page 35 of 56
Earnings downgrade
The facts: We are updating our Sales and EBITDA figures (see flash note) of the
Italian magazines activities assuming an overall decline of over 10% driven by a
circulation decline of 16% and advertising by 6%. This compares with previous
decline for those activities of 3% of which circulation -9% and advertising +4% which
were supposedly to be helped by the growth of recently acquired online Banzai
activities. The estimate assumes a 30% marginal EBITDA or some EUR 9m partly
offset by loss making disposals and/or restructuring actions. Other Mondadori’s
activities estimates have been confirmed but books retail for which we have
assumed no EBITDA growth for the current year.
New forecasts have reduced 2018e and 2019e EPS by 13/12% with a small impact
also on net debt forecasts due to the lower profitability. We remind to investors that
with EUR 140m net debt in 2019e we are still lower the company’s business plan
guidance, the reason being the historical over-performance of the company on this
item. In the table below we have summarised Akros forecasts vs. company’s
business plan.
Q1’18e results should report trends in line with our full revised expectations with
solid/stable Books’ performance, a material decline in Italian magazines, a decline in
the French magazine operations and stable retail business (see flash note). The
lower adjusted EBITDA is then offset by lower non-recurring restructuring charges
and lower financial costs following the recently negotiated better terms on the debt
lines.
Conclusion & Action: We have now reached the conclusion that a deal in France
to combine their magazines assets with those of other players to extract a sizeable
amount of synergies is likely not happening. While a way out to the French
magazine markets is still possible maybe with an outright disposal, the company is
now left with the very solid Italian books operations but also with the French and
Italian magazine operating in a structural declining environment. As such, we have
revised the estimates on the Italian operations to reflect the current trading
environment and updated our SOP (see flash note) which is likely the best tool
given the now reduced visibility on the company’s free cash flow generation. In our
SOP, we have maintained 8x EV/EBITDA for the books divisions while we are now
applying 4x EV/EBITDA to the magazines activities from previously 5x. The resulting
FV is of EUR 1.6 which replaces our previous price target of EUR 2. NEUTRAL
rating confirmed.
Arnoldo Mondadori Editore
Italy | Media
MEDIA Arnoldo Mondadori Editore (Neutral) Sika: knock and the door will be opened
Analyser 14 May 2018
Analyst(s)
Andrea Bonfà
+39 02 4344 4269
Neutral
1.61
closing price as of 11/05/2018
1.60
2.00
-0.7%Upside/Downside Potential
from Target Price: EUR
Recommendation unchanged
Target price: EUR
Share price: EUR
Reuters/Bloomberg MOED.MI/MN IM
Market capitalisation (EURm) 421
Current N° of shares (m) 261
Free float 35%
Daily avg. no. trad. sh. 12 mth 613
Daily avg. trad. vol. 12 mth (m) 505.40
Price high/low 12 months 1.53 / 2.58
Abs Perfs 1/3/12 mths (%) -3.82/-20.20/-12.30
Key financials (EUR) 12/16 12/17 12/18e
Sales (m) 1,263 1,268 1,228
EBITDA (m) 94 101 88
EBITDA margin 7.4% 8.0% 7.2%
EBIT (m) 60 62 53
EBIT margin 4.7% 4.8% 4.3%
Net Profit (adj.)(m) 26 27 23
ROCE 8.1% 7.8% 7.8%
Net debt/(cash) (m) 264 189 169
Net Debt/Equity 0.8 0.5 0.5
Debt/EBITDA 2.8 1.9 1.9
Int. cover(EBITDA/Fin. int) 5.3 7.2 8.8
EV/Sales 0.5 0.6 0.6
EV/EBITDA 7.0 8.1 7.7
EV/EBITDA (adj.) 6.0 7.7 6.8
EV/EBIT 11.0 13.3 12.7
P/E (adj.) 12.0 20.5 18.6
P/BV 1.1 1.8 1.3
OpFCF yield 0.8% 11.9% 9.6%
Dividend yield 0.0% 0.0% 0.0%
EPS (adj.) 0.10 0.10 0.09
BVPS 1.09 1.18 1.27
DPS 0.00 0.00 0.00
Shareholders
Fininvest 53%; Silchester International Investors LLP 12%;
Shareholder3 0.00%;
1.4
1.6
1.8
2.0
2.2
2.4
2.6
Apr 17 May 17 Jun 17 Jul 17 Aug 17 Sep 17 Oct 17 Nov 17 Dec 17 Jan 18 Feb 18 Mar 18 Apr 18 May 18
vvdsvdvsdy
ARNOLDO MONDADORI EDITORE FTSE Italy STAR (Rebased)
Source: Factset

Teleperformance
For important disclosure information, please refer to the disclaimer page of this report Page 36 of 56
An interest in Convergys?
The facts: According to US daily, the Wall Street Journal, Convergys has begun a
sales procedure following the departure of its CEO, Andrea Ayers. Sector players
and financials are apparently interested. The share price has jumped +12%.
Our analysis: Convergys is one of Teleperformance’s main rivals in its contact
centre business. The company is listed on the New York stock exchange and is
present in 33 countries with over 150 sites. In 2017, it generated revenues of
USD2.8bn, EBITDA of USD351m, EBIT of USD246m and adjusted net income of
USD187m. It is currently undergoing a tough period with sharp declines in volumes
following difficulties with some of its largest clients. It is expecting revenues to fall by
over 7% in 2018 at constant exchange rates with EPS down by over 10%. The
enterprise value stands at USD2.5bn for a stock market capitalisation of USD2.3bn.
At the current share price, the stock is trading at 7.5x 2018 EBITDA and 10.5x EBIT,
i.e. a discount of around 40% in relation to Teleperformance that we feel is justified
in view of the momentum differential. Financially, this deal would be possible for
Teleperformance even if it required a capital increase (payment in shares?).
Strategically, this transaction would be more surprising. Teleperformance would
definitively strengthen its world No. 1 spot in the sector and become the No. 1 in the
US, but we think there is a risk of a loss of value on some clients that the two groups
share. Moreover, Teleperformance does not usually acquire troubled companies
and wants deals to be EPS accretive immediately.
Conclusion & Action: In the event of a sales process, Teleperformance, as the
leader, has to look at Convergys. However, we think that such a transaction is not
necessarily obvious and, at first glance, the Intelenet project (see our last comment)
looks a better fit and set to generate more synergies, in our view.
Teleperformance
France | Media
MEDIA Teleperformance (Accumulate) Earnings downgrade
Analyser 14 May 2018
Analyst(s)
Emmanuel Chevalier
+33 1 53 48 80 72
Accumulate
135.20
closing price as of 11/05/2018
135.00
-0.1%Upside/Downside Potential
Target Price unchanged
Recommendation unchanged
Target price: EUR
Share price: EUR
Reuters/Bloomberg ROCH.PA/RCF FP
Market capitalisation (EURm) 7,742
Current N° of shares (m) 57
Free float 98%
Daily avg. no. trad. sh. 12 mth 128
Daily avg. trad. vol. 12 mth (m) 11,698.21
Price high/low 12 months 109.75 / 138.40
Abs Perfs 1/3/12 mths (%) 7.13/17.36/17.67
Key financials (EUR) 12/16 12/17e 12/18e
Sales (m) 3,649 4,180 4,297
EBITDA (m) 530 693 723
EBITDA margin 14.5% 16.6% 16.8%
EBIT (m) 339 447 470
EBIT margin 9.3% 10.7% 10.9%
Net Profit (adj.)(m) 255 360 403
ROCE 6.0% 7.8% 8.3%
Net debt/(cash) (m) 1,667 1,442 1,170
Net Debt/Equity 0.9 0.7 0.5
Debt/EBITDA 3.1 2.1 1.6
Int. cover(EBITDA/Fin. int) 13.6 13.3 18.7
EV/Sales 2.0 2.0 2.1
EV/EBITDA 13.5 12.0 12.3
EV/EBITDA (adj.) 12.8 11.6 12.0
EV/EBIT 21.1 18.6 19.0
P/E (adj.) 21.8 19.3 19.5
P/BV 2.9 3.2 3.3
OpFCF yield 4.6% 4.4% 4.7%
Dividend yield 1.0% 1.2% 1.4%
EPS (adj.) 4.38 6.18 6.92
BVPS 33.39 36.85 40.68
DPS 1.29 1.64 1.88
Shareholders
Daniel Julien 1.44%; Treasury Shareholders 0.26%;
100
105
110
115
120
125
130
135
140
Apr 17 May 17 Jun 17 Jul 17 Aug 17 Sep 17 Oct 17 Nov 17 Dec 17 Jan 18 Feb 18 Mar 18 Apr 18 May 18
vvdsvdvsdy
TELEPERFORMANCE Stoxx Media (Rebased)
Source: Factset
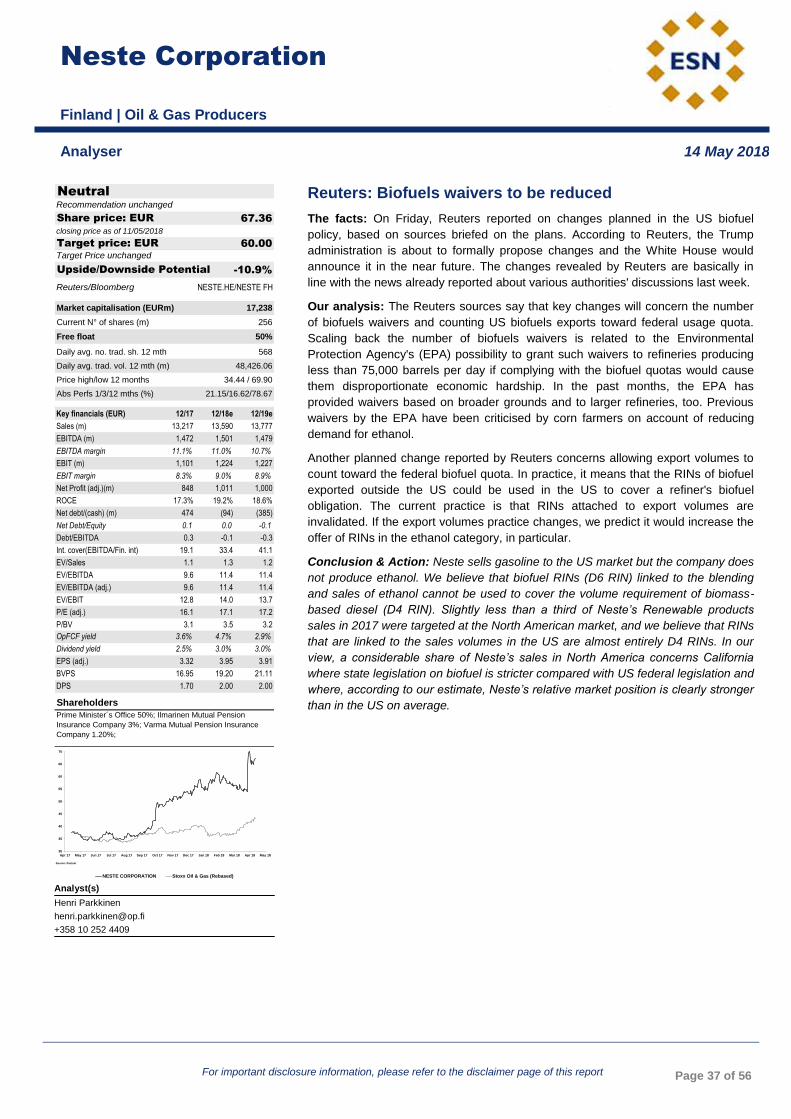
Neste Corporation
For important disclosure information, please refer to the disclaimer page of this report Page 37 of 56
Reuters: Biofuels waivers to be reduced
The facts: On Friday, Reuters reported on changes planned in the US biofuel
policy, based on sources briefed on the plans. According to Reuters, the Trump
administration is about to formally propose changes and the White House would
announce it in the near future. The changes revealed by Reuters are basically in
line with the news already reported about various authorities' discussions last week.
Our analysis: The Reuters sources say that key changes will concern the number
of biofuels waivers and counting US biofuels exports toward federal usage quota.
Scaling back the number of biofuels waivers is related to the Environmental
Protection Agency's (EPA) possibility to grant such waivers to refineries producing
less than 75,000 barrels per day if complying with the biofuel quotas would cause
them disproportionate economic hardship. In the past months, the EPA has
provided waivers based on broader grounds and to larger refineries, too. Previous
waivers by the EPA have been criticised by corn farmers on account of reducing
demand for ethanol.
Another planned change reported by Reuters concerns allowing export volumes to
count toward the federal biofuel quota. In practice, it means that the RINs of biofuel
exported outside the US could be used in the US to cover a refiner's biofuel
obligation. The current practice is that RINs attached to export volumes are
invalidated. If the export volumes practice changes, we predict it would increase the
offer of RINs in the ethanol category, in particular.
Conclusion & Action: Neste sells gasoline to the US market but the company does
not produce ethanol. We believe that biofuel RINs (D6 RIN) linked to the blending
and sales of ethanol cannot be used to cover the volume requirement of biomass-
based diesel (D4 RIN). Slightly less than a third of Neste’s Renewable products
sales in 2017 were targeted at the North American market, and we believe that RINs
that are linked to the sales volumes in the US are almost entirely D4 RINs. In our
view, a considerable share of Neste’s sales in North America concerns California
where state legislation on biofuel is stricter compared with US federal legislation and
where, according to our estimate, Neste’s relative market position is clearly stronger
than in the US on average.
Neste Corporation
Finland | Oil & Gas Producers
OIL & GAS PRODUCERS Neste Corporation (Neutral) An interest in Convergys?
Analyser 14 May 2018
Analyst(s)
Henri Parkkinen
+358 10 252 4409
Neutral
67.36
closing price as of 11/05/2018
60.00
-10.9%Upside/Downside Potential
Target Price unchanged
Recommendation unchanged
Target price: EUR
Share price: EUR
Reuters/Bloomberg NESTE.HE/NESTE FH
Market capitalisation (EURm) 17,238
Current N° of shares (m) 256
Free float 50%
Daily avg. no. trad. sh. 12 mth 568
Daily avg. trad. vol. 12 mth (m) 48,426.06
Price high/low 12 months 34.44 / 69.90
Abs Perfs 1/3/12 mths (%) 21.15/16.62/78.67
Key financials (EUR) 12/17 12/18e 12/19e
Sales (m) 13,217 13,590 13,777
EBITDA (m) 1,472 1,501 1,479
EBITDA margin 11.1% 11.0% 10.7%
EBIT (m) 1,101 1,224 1,227
EBIT margin 8.3% 9.0% 8.9%
Net Profit (adj.)(m) 848 1,011 1,000
ROCE 17.3% 19.2% 18.6%
Net debt/(cash) (m) 474 (94) (385)
Net Debt/Equity 0.1 0.0 -0.1
Debt/EBITDA 0.3 -0.1 -0.3
Int. cover(EBITDA/Fin. int) 19.1 33.4 41.1
EV/Sales 1.1 1.3 1.2
EV/EBITDA 9.6 11.4 11.4
EV/EBITDA (adj.) 9.6 11.4 11.4
EV/EBIT 12.8 14.0 13.7
P/E (adj.) 16.1 17.1 17.2
P/BV 3.1 3.5 3.2
OpFCF yield 3.6% 4.7% 2.9%
Dividend yield 2.5% 3.0% 3.0%
EPS (adj.) 3.32 3.95 3.91
BVPS 16.95 19.20 21.11
DPS 1.70 2.00 2.00
Shareholders
Prime Minister´s Office 50%; Ilmarinen Mutual Pension
Insurance Company 3%; Varma Mutual Pension Insurance
Company 1.20%;
30
35
40
45
50
55
60
65
70
Apr 17 May 17 Jun 17 Jul 17 Aug 17 Sep 17 Oct 17 Nov 17 Dec 17 Jan 18 Feb 18 Mar 18 Apr 18 May 18
vvdsvdvsdy
NESTE CORPORATION Stoxx Oil & Gas (Rebased)
Source: Factset

Luxottica
For important disclosure information, please refer to the disclaimer page of this report Page 38 of 56
SGH increases its distribution in the US
The facts: In Friday’s May 11th
press release, Luxottica said they had signed an
agreement with Bass Pro Outdoor World L.L.C, an American company active in the
outdoor segment.
Our analysis: According to the agreement, Luxottica will open Sunglass Hut retail
stores in approximately 160 Bass Pro Shops and Cabela’s stores in the US. SGH
will be exclusive seller of sunglasses in Bass Pro and Cabela’s locations and e-
commerce platform. The first shop in shop will be opened in May 2018 (full roll-out
by Q3 18).
Bass Pro and Cabela’s shops have approx. 200m annual customers . Expected
sales from the agreement are around USD 100m per year one the stores are
running.
We also learn from the press that Luxottica hasn’t renewed its membership in
Confindustria, Italy’s main industrial lobby. We remind readers that the deal with
Essilor is expected to be finalized by H1 18.
Conclusion & Action: Positive news-flow.
Luxottica
Italy | Personal Goods
PERSONAL GOODS Luxottica (Accumulate) Reuters: Biofuels waivers to be reduced
Analyser 14 May 2018
Analyst(s)
Giada Cabrino, CIIA
+39 02 4344 4092
Accumulate
52.50
closing price as of 11/05/2018
53.30
1.5%Upside/Downside Potential
Target Price unchanged
Recommendation unchanged
Target price: EUR
Share price: EUR
Reuters/Bloomberg LUX.MI/LUX IM
Market capitalisation (EURm) 25,404
Current N° of shares (m) 484
Free float 24%
Daily avg. no. trad. sh. 12 mth 509
Daily avg. trad. vol. 12 mth (m) 18,640.09
Price high/low 12 months 45.35 / 55.10
Abs Perfs 1/3/12 mths (%) 2.42/8.49/-2.87
Key financials (EUR) 12/16 12/17e 12/18e
Sales (m) 9,086 9,157 9,238
EBITDA (m) 1,858 1,942 2,002
EBITDA margin 20.5% 21.2% 21.7%
EBIT (m) 1,345 1,425 1,481
EBIT margin 14.8% 15.6% 16.0%
Net Profit (adj.)(m) 861 992 959
ROCE 11.7% 12.1% 17.8%
Net debt/(cash) (m) 1,177 847 340
Net Debt/Equity 0.2 0.1 0.0
Debt/EBITDA 0.6 0.4 0.2
Int. cover(EBITDA/Fin. int) 110.9 27.7 26.7
EV/Sales 2.9 2.8 2.8
EV/EBITDA 14.1 13.3 13.0
EV/EBITDA (adj.) 14.1 13.3 13.0
EV/EBIT 19.5 18.2 17.6
P/E (adj.) nm 24.9 26.4
P/BV 4.3 3.9 3.7
OpFCF yield 2.5% 2.8% 3.9%
Dividend yield 1.8% 1.9% 2.1%
EPS (adj.) (21.63) 2.05 1.99
BVPS 11.94 13.22 14.20
DPS 0.92 1.00 1.10
Shareholders
Del Vecchio 66%; Giorgio Armani 5%;
44
46
48
50
52
54
56
58
60
apr 17 mag 17 giu 17 lug 17 ago 17 set 17 ott 17 nov 17 dic 17 gen 18 feb 18 mar 18 apr 18 mag 18
vvdsvdvsdy
LUXOTTICA Stoxx Personal Goods (Rebased)
Source: Factset
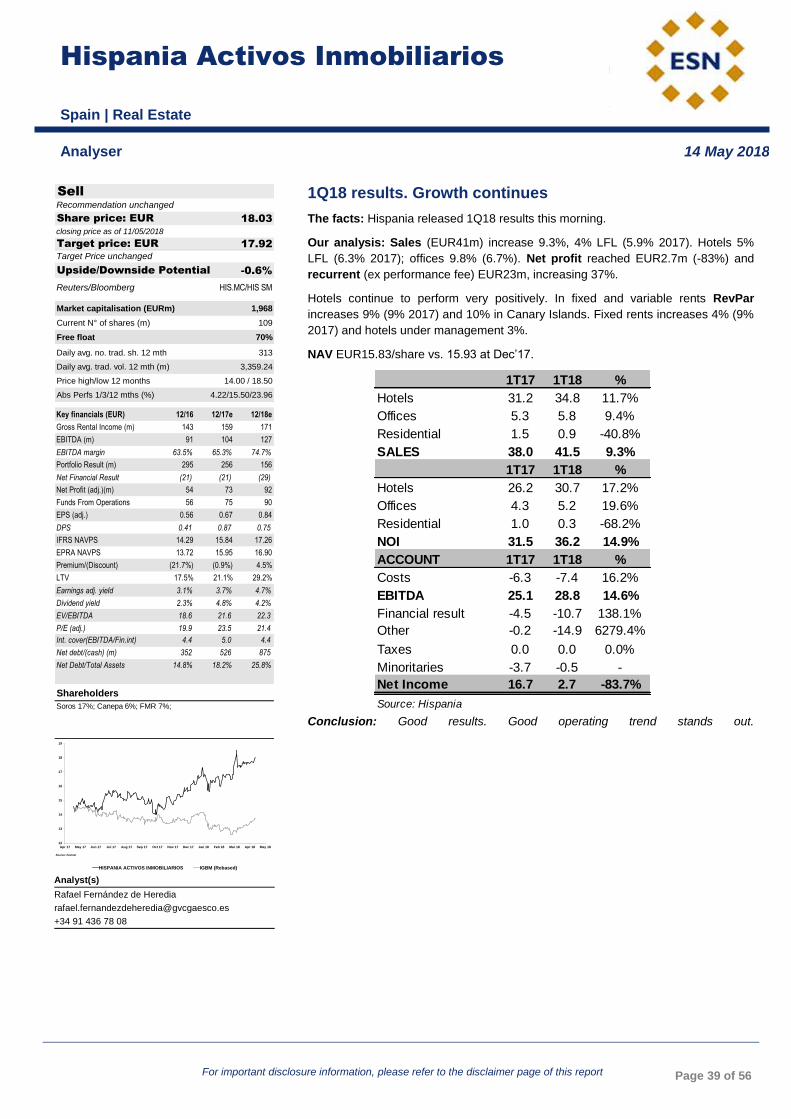
Hispania Activos Inmobiliarios
For important disclosure information, please refer to the disclaimer page of this report Page 39 of 56
1Q18 results. Growth continues
The facts: Hispania released 1Q18 results this morning.
Our analysis: Sales (EUR41m) increase 9.3%, 4% LFL (5.9% 2017). Hotels 5%
LFL (6.3% 2017); offices 9.8% (6.7%). Net profit reached EUR2.7m (-83%) and
recurrent (ex performance fee) EUR23m, increasing 37%.
Hotels continue to perform very positively. In fixed and variable rents RevPar
increases 9% (9% 2017) and 10% in Canary Islands. Fixed rents increases 4% (9%
2017) and hotels under management 3%.
NAV EUR15.83/share vs. 15.93 at Dec’17.
Conclusion: Good results. Good operating trend stands out.
1T17 1T18 %
Hotels 31.2 34.8 11.7%
Offices 5.3 5.8 9.4%
Residential 1.5 0.9 -40.8%
SALES 38.0 41.5 9.3%
1T17 1T18 %
Hotels 26.2 30.7 17.2%
Offices 4.3 5.2 19.6%
Residential 1.0 0.3 -68.2%
NOI 31.5 36.2 14.9%
ACCOUNT 1T17 1T18 %
Costs -6.3 -7.4 16.2%
EBITDA 25.1 28.8 14.6%
Financial result -4.5 -10.7 138.1%
Other -0.2 -14.9 6279.4%
Taxes 0.0 0.0 0.0%
Minoritaries -3.7 -0.5 -
Net Income 16.7 2.7 -83.7%
Source: Hispania
Hispania Activos Inmobiliarios
Spain | Real Estate
REAL ESTATE Hispania Activos Inmobiliarios (Sell) SGH increases its distribution in the US
Analyser 14 May 2018
Analyst(s)
Rafael Fernández de Heredia
+34 91 436 78 08
Sell
18.03
closing price as of 11/05/2018
17.92
-0.6%Upside/Downside Potential
Target Price unchanged
Recommendation unchanged
Target price: EUR
Share price: EUR
Reuters/Bloomberg HIS.MC/HIS SM
Market capitalisation (EURm) 1,968
Current N° of shares (m) 109
Free float 70%
Daily avg. no. trad. sh. 12 mth 313
Daily avg. trad. vol. 12 mth (m) 3,359.24
Price high/low 12 months 14.00 / 18.50
Abs Perfs 1/3/12 mths (%) 4.22/15.50/23.96
Key financials (EUR) 12/16 12/17e 12/18e
Gross Rental Income (m) 143 159 171
EBITDA (m) 91 104 127
EBITDA margin 63.5% 65.3% 74.7%
Portfolio Result (m) 295 256 156
Net Financial Result (21) (21) (29)
Net Profit (adj.)(m) 54 73 92
Funds From Operations 56 75 90
EPS (adj.) 0.56 0.67 0.84
DPS 0.41 0.87 0.75
IFRS NAVPS 14.29 15.84 17.26
EPRA NAVPS 13.72 15.95 16.90
Premium/(Discount) (21.7%) (0.9%) 4.5%
LTV 17.5% 21.1% 29.2%
Earnings adj. yield 3.1% 3.7% 4.7%
Dividend yield 2.3% 4.8% 4.2%
EV/EBITDA 18.6 21.6 22.3
P/E (adj.) 19.9 23.5 21.4
Int. cover(EBITDA/Fin.int) 4.4 5.0 4.4
Net debt/(cash) (m) 352 526 875
Net Debt/Total Assets 14.8% 18.2% 25.8%
Shareholders
Soros 17%; Canepa 6%; FMR 7%;
12
13
14
15
16
17
18
19
Apr 17 May 17 Jun 17 Jul 17 Aug 17 Sep 17 Oct 17 Nov 17 Dec 17 Jan 18 Feb 18 Mar 18 Apr 18 May 18
vvdsvdvsdy
HISPANIA ACTIVOS INMOBILIARIOS IGBM (Rebased)
Source: Factset

lar España
For important disclosure information, please refer to the disclaimer page of this report Page 40 of 56
Good 1Q18 results
The facts: LAR’s retail activity continues to grow at a good rhythm, occupancy in
projects improves and NAV increases 1% not including the dividend (vs. -2%). Asset
rotation takes at an attractive return, as do new investments. The next milestone is
the sale of logistic assets.
Our analysis: Sales increase 8% (EUR20m), EBITDA 27% (8% in recurrent terms)
and deferred performance fee (EUR17m) is offset by the revaluation of assets
(EUR21m). Net profit increased strongly despite the higher financial costs. The
FFO pre-performance fee reached EUR12m (+11%) and recurrent drops 12% due
to higher financial costs.
Occupancy reached 93.7% (95.1% in 2017). In retail, occupancy reached 94.3%
(93.4% Dec’17), in offices 64.9% (21% M. Espinola) and logistics 100% occupied.
Within the retail activity gross rentals increase 2.4%, renewed rentals 9%, NOI
+5% LFL (4.7% in 2017), with LFL occupancy increasing 1.9% (3.1% in 2017) and
incentives dropping 6%. Sales in shopping centres increase 3.9% (3.3% Dec’17;
1.9% sector) and footfall rises 1.7% (2.7% Dec’17; 0.1% sector). The rotation rate of
tenancies is 5%.
LTV 33% and financial cost 2.2%. Of the projects we highlight the 80% presales in
Lagasca, 98% of Vida Nova’s Surface already rented and in 3Q18 construction
should be completed. In Palmas Altas 63% is pre-rented and is expected to open in
1Q19. A quarterly valuation of projects is expected. At 1Q18 NAV increases by 2%.
Conclusion: We maintain our positive outlook in a stock that also has an attractive
dividend policy.
1T17 1T18 %
Shopping Centres 15.5 18.1 17.0%
Offices 1.7 0.6 -66.1%
Logistics 1.4 1.4 -1.8%
SALES 18.6 20.1 8.1%
EBITDA 12.1 15.4 27.3%
Performance fee -17.9 -
EBITDA 12.1 -2.5 -120.7%
Revaluation 21.4 -
Operating Result 12.1 18.9 56.2%
Financial result -1.3 -3.4 161.5%
Other -0.3 -0.2 -
Net Income 10.5 15.3 45.7%
Source: Lar España
lar España
Spain | Real Estate
REAL ESTATE lar España (Buy) 1Q18 results. Growth continues
Analyser 14 May 2018
Analyst(s)
Rafael Fernández de Heredia
+34 91 436 78 08
Buy
9.48
closing price as of 11/05/2018
9.97
5.2%Upside/Downside Potential
Target Price unchanged
Recommendation unchanged
Target price: EUR
Share price: EUR
Reuters/Bloomberg LAREF.PK/LRE SM
Market capitalisation (EURm) 886
Current N° of shares (m) 93
Free float 56%
Daily avg. no. trad. sh. 12 mth 185
Daily avg. trad. vol. 12 mth (m) 1,141.67
Price high/low 12 months 7.79 / 9.87
Abs Perfs 1/3/12 mths (%) -3.27/9.72/17.91
Key financials (EUR) 12/16 12/17e 12/18e
Gross Rental Income (m) 62 79 85
EBITDA (m) 18 41 52
EBITDA margin 27.8% 52.6% 61.8%
Portfolio Result (m) 88 92
Net Financial Result (14) (13) (17)
Net Profit (adj.)(m) 4 29 36
Funds From Operations 27 37 37
EPS (adj.) 0.05 0.31 0.38
DPS 0.33 0.50 1.11
IFRS NAVPS 8.97 9.75 10.29
EPRA NAVPS 9.20 9.97 10.51
Premium/(Discount) (21.6%) (8.9%) (7.9%)
LTV 32.9% 36.0% 39.3%
Earnings adj. yield 0.5% 3.3% 4.1%
Dividend yield 3.5% 5.3% 11.7%
EV/EBITDA 58.4 32.8 29.4
P/E (adj.) nm 28.3 24.6
Int. cover(EBITDA/Fin.int) 1.3 3.6 3.2
Net debt/(cash) (m) 420 535 657
Net Debt/Total Assets 32.0% 35.1% 38.4%
Occupancy Rate 83.0% 82.3% 79.8%
Shareholders
Franklin Templeton 15%; Pimco 20%; Brandes 5%; Grupo Lar
6%;
6.5
7.0
7.5
8.0
8.5
9.0
9.5
10.0
Apr 17 May 17 Jun 17 Jul 17 Aug 17 Sep 17 Oct 17 Nov 17 Dec 17 Jan 18 Feb 18 Mar 18 Apr 18 May 18
vvdsvdvsdy
LAR España IGBM (Rebased)
Source: Factset

Exprivia
For important disclosure information, please refer to the disclaimer page of this report Page 41 of 56
Q1 2018 Pre: ITALTEL enters the consolidation perimeter
The facts: Q1 2018 preview (publication on May 14).
Our analysis: Q1 2018 will see the full entry of Italtel into Exprivia’s consolidation
perimeter (line by line in the P&L), as the deal was finalized in the last days of 2017
and was already included in the December 31 balance sheet (total debt EUR 223m
including EUR 164m NFP of Italtel and EUR 25m cash outlay for the acquisition).
We don’t have comparable figures for Italtel on a quarterly basis in 2017; in the full
year the company generated EUR 430m revenues, EUR 20m adjusted EBITDA
(before EUR 5.2m exceptional costs) and EUR 10.5m net loss. We would expect
mid-single digit revenue growth in FY 2018 thanks to the step-up in the business
from Open Fiber, only partially offset by a reduction in investments by TIM. We note
that OF recently awarded Italtel a multi-year contract worth EUR 200m (vs. EUR
23m revenues generated last year).
On an underlying basis, we expect XPR to post a mid-single-digit revenue growth
taking into account the exit speed of Q4 last year against the tough comp base of
Q1 2017 (BPO contracts at full steam). Given the NWC seasonality, we expect net
debt only slightly improving Q/Q.
Exprivia: Q1 2018 Preview (EUR m)
Q1 2017a Q1 2018
XPR XPR Y/Y ITALTEL Group
Sales Revenues 35.9 37.3 4.0% 100 137
Total Turnover 36.8 38.1 3.6% 100 138
EBITDA adj 3.03 3.2 4.9% 4.0 7.2
margin 8.2% 8.4% 0.1% 4.0% 5.2%
EBITDA 3.03 3.2 4.9% 5.0 8.2
EBIT 1.87 1.8 -2.1% 0.5 2.3
Margin 5.1% 4.8% -0.3% 0.5% 1.7%
EBT 1.55 nm nm na na
Net Income 0.89 nm nm na na
Net Debt (Cash) 42.0 57.0 35.7% 162 219
Source: Company data, BANCA AKROS estimates
Outlook: We note that the business plan originally included a 5% organic growth in
the years 2017 and 2018, accelerating to +10% in 2019/2020. We still have to
include the contribution of Italtel in our estimates, pending the first official disclosure
with Q1 and the presentation of an integrated business plan.
Conclusion & Action: We have a positive view on the stock, based on the
undemanding stand-alone market ratio, the good underlying economic performance
and the expected value creation from the Italtel deal.
Exprivia
Italy | Software & Computer Services
SOFTWARE & COMPUTER SERVICES Exprivia (Accumulate) Good 1Q18 results
Analyser 14 May 2018
Analyst(s)
Andrea Devita, CFA
+39 02 4344 4031
Accumulate
1.48
closing price as of 11/05/2018
1.80
22.0%Upside/Downside Potential
Target Price unchanged
Recommendation unchanged
Target price: EUR
Share price: EUR
Reuters/Bloomberg XPR.MI/XPR IM
Market capitalisation (EURm) 77
Current N° of shares (m) 52
Free float 47%
Daily avg. no. trad. sh. 12 mth 606
Daily avg. trad. vol. 12 mth (m) 835.78
Price high/low 12 months 1.10 / 2.11
Abs Perfs 1/3/12 mths (%) 8.21/3.94/18.84
Key financials (EUR) 12/17 12/18e 12/19e
Sales (m) 161 165 171
EBITDA (m) 12 18 19
EBITDA margin 7.5% 11.2% 11.4%
EBIT (m) 7 13 14
EBIT margin 4.0% 7.7% 8.0%
Net Profit (adj.)(m) (0) 6 7
ROCE 3.6% 6.7% 11.5%
Net debt/(cash) (m) 34 34 27
Net Debt/Equity 0.4 0.4 0.3
Debt/EBITDA 2.8 1.9 1.4
Int. cover(EBITDA/Fin. int) 3.1 10.2 12.9
EV/Sales 0.8 0.8 0.7
EV/EBITDA 10.6 6.9 6.1
EV/EBITDA (adj.) 10.6 6.9 6.1
EV/EBIT 19.8 10.1 8.6
P/E (adj.) nm 12.8 11.1
P/BV 1.0 0.9 0.9
OpFCF yield 4.8% -0.4% 11.2%
Dividend yield 0.0% nm 2.0%
EPS (adj.) (0.00) 0.12 0.13
BVPS 1.46 1.57 1.68
DPS 0.00 0.00 0.03
Shareholders
Abaco Spa 47%; Own Shares 7%;
1.0
1.2
1.4
1.6
1.8
2.0
2.2
Apr 17 May 17 Jun 17 Jul 17 Aug 17 Sep 17 Oct 17 Nov 17 Dec 17 Jan 18 Feb 18 Mar 18 Apr 18 May 18
vvdsvdvsdy
EXPRIVIA FTSE Italy SmallCaps (Rebased)
Source: Factset

Rovio Entertainment
For important disclosure information, please refer to the disclaimer page of this report Page 42 of 56
Rovio
Q1 2017a
EURm OP Cons. OP Cons. Diff.
Sales
Games 62.6 0 0 56.6 0 260 0 #DIV/0!
Brand licensing 6.5 0 0 9.7 0 26 0 #DIV/0!
Other 0.0 0 0 0.0 0 0.0
Sales 69.1 67.3 0 66.3 0 286 279 2%
EBIT
Games 8.0 0 0 8.6 0 33.0 0 #DIV/0!
Brand licensing 0.2 0 0 -0.9 0 1.4 0 #DIV/0!
Other -2.8 0 0 -2.4 0 -10.1 0 #DIV/0!
EBIT 5.4 6.4 0 5.3 0 24.3 27.1 -10%
EBIT margin 7.8 % 9.5 % # 8.0 % # 8.5 % 9.7 %
EPS 0.05 0.08 # 0.05 # 0.51 0.25 104%
DPS 0.00 0.00 # 0.00 # 0.07 0.09 -21%
Source: OP and Factset
Q1 2018e 2018e
Q1pre: Eyes on ARPPU trend and user acquisition costs
The facts: Rovio reports its Q1 figures on Thursday, 17 May, at 7.30 am CET. The
company estimates its full-year sales in 2018 to total EUR 260–300m and the EBIT
margin to be 9–11% (2017: 10.6%). The company expects user acquisition costs in
2018 to account for 30% of the sales of the Games business and anticipates sales
of the Brand Licensing business to decrease by 40% in 2018. In addition, Rovio has
announced it will invest EUR 10–15m in Hatch Entertainment Oy which develops a
platform for streaming games.
Our analysis: In terms of Rovio's outlook, the Games business plays a key role. In
2019, we expect the Angry Birds 2 movie to have a positive impact on the Brand
Licensing business and to reduce the user acquisition (UA) costs of the Games
business. In our forecasts for 2018, the UA costs are in line with Rovio's guidance
and distribution channel costs (Apple and Google) represent 30% of the Games
business sales. Other costs are relatively fixed. In consequence, timing of UA costs
may result in significant quarterly EBIT variation. We expect the UA costs to go up
from Q4 but to remain below the level of Q3 2017.
In Rovio's Games business, the reduction in the number of active users has been
offset by the rise in the average revenue per paying user (ARPPU). Rovio has
continued its active updates in TOP 5 games, releasing approximately 4 updates
during Q1 (Q4: 3.6 updates). Updates introduce new features in games, and we
believe this will spur ARPPU in Q1. We forecast the Q1 ARPPU in TOP 5 games to
be EUR 36.20 (Q4: EUR 35.60). We anticipate the number of paying users in Q1 to
be flat on Q4 (447,000). In our opinion, the popular hit game Fortnite is not directly
competing with Rovio's main game genre or user base.
Conclusion & Action: Our forecasts go down due to rising UA costs and falling
Brand Licensing revenue. Our target price is based on the average price indications
of the peer group’s 2018–2019 EV/EBITDA and P/E multiples. In the Games
business, quarterly variation can be great and visibility into the business in the short
term is challenging. Due to downgraded forecasts, our target price falls to EUR 8.00
(prev. EUR 9.00). We reiterate our Buy recommendation.
Rovio Entertainment
Finland | Software & Computer Services
SOFTWARE & COMPUTER SERVICES Rovio Entertainment (Buy) Q1 2018 Pre: ITALTEL enters the consolidation perimeter
Analyser 14 May 2018
Analyst(s)
Hannu Rauhala
+358 10 252 4392
Buy
5.00
closing price as of 11/05/2018
8.00
9.00
60.0%Upside/Downside Potential
from Target Price: EUR
Recommendation unchanged
Target price: EUR
Share price: EUR
Reuters/Bloomberg ROVIO.HE/ROVIO FH
Market capitalisation (EURm) 390
Current N° of shares (m) 78
Free float 100%
Daily avg. no. trad. sh. 12 mth 606
Daily avg. trad. vol. 12 mth (m) 479.42
Abs Perfs 1/3/12 mths (%) 3.07/-45.44/
Key financials (EUR) 12/17 12/18e 01/19e
Sales (m) 297 295 331
EBITDA (m) 60 49 73
EBITDA margin 20.3% 16.6% 22.0%
EBIT (m) 31 28 55
EBIT margin 10.6% 9.6% 16.8%
Net Profit (adj.)(m) 26 23 46
ROCE 54.4% 61.6% -40.2%
Net debt/(cash) (m) (93) (117) (160)
Net Debt/Equity -0.7 -0.8 -0.8
Debt/EBITDA -1.5 -2.4 -2.2
Int. cover(EBITDA/Fin. int) high high high
EV/Sales 2.1 0.9 0.7
EV/EBITDA 10.1 5.5 3.1
EV/EBITDA (adj.) 10.1 5.5 3.1
EV/EBIT 19.4 9.5 4.1
P/E (adj.) 27.5 16.7 8.5
P/BV 5.1 2.5 2.0
OpFCF yield 5.6% 8.2% 12.4%
Dividend yield 1.8% 1.8% 3.5%
EPS (adj.) 0.33 0.30 0.59
BVPS 1.77 1.98 2.47
DPS 0.09 0.09 0.18
Shareholders
Trema International holdings B.V. 0.41%; Silavano
Investments S.Á.R.L. 0.03%; Varma Mutual Pension
Insurance Company 0.03%;
4
5
6
7
8
9
10
11
12
Aug 17 Sep 17 Oct 17 Nov 17 Dec 17 Jan 18 Feb 18 Mar 18 Apr 18 May 18
vvdsvdvsdy
ROVIO ENTERTAINMENT OMXS All (Rebased)
Source: Factset

ENAV
For important disclosure information, please refer to the disclaimer page of this report Page 43 of 56
Steady results expected in Q1
The facts: Enav is due to publish its first quarter results on May 14th
Our analysis: we summarize our preview in the following table:
Q1 17 Q1 18e Y/Y
Total revenues 176.4 176.2 -0.1%
EBITDA 28.7 28.8 0.2%
margin 16.3% 16.3%
EBIT -2.9 -3.4 nm
margin -1.7% -1.9%
PBT -3.1 -4.6 nm
Net Profit -4.2 -5.1 nm
We expect steady results both in terms of revenues and margins. The increase in
service units recorded in Q1 18, up 7.6% y/y, was offset by a much more
unfavourable “balance”, we expect a negative balance of EUR 4m vs. a positive one
of EUR 6.3m in Q1 17.
Conclusion & Action: we expect the first quarter results to show the company’s
resilience. Recommendation and target confirmed.
ENAV
Italy | Support Services
SUPPORT SERVICES ENAV (Accumulate) Q1pre: Eyes on ARPPU trend and user acquisition costs
Analyser 14 May 2018
Analyst(s)
Francesco Sala
+39 02 4344 4240
Accumulate
4.51
closing price as of 11/05/2018
4.80
6.4%Upside/Downside Potential
Target Price unchanged
Recommendation unchanged
Target price: EUR
Share price: EUR
Reuters/Bloomberg ENAV.MI/ENAV IM
Market capitalisation (EURm) 2,443
Current N° of shares (m) 542
Free float 47%
Daily avg. no. trad. sh. 12 mth 762
Daily avg. trad. vol. 12 mth (m) 3,293.62
Price high/low 12 months 3.63 / 4.70
Abs Perfs 1/3/12 mths (%) 1.39/11.58/16.96
Key financials (EUR) 12/17 12/18e 12/19e
Sales (m) 882 892 894
EBITDA (m) 284 290 293
EBITDA margin 32.2% 32.5% 32.7%
EBIT (m) 147 158 159
EBIT margin 16.6% 17.7% 17.8%
Net Profit (adj.)(m) 101 110 111
ROCE 8.4% 9.1% 9.1%
Net debt/(cash) (m) 117 108 116
Net Debt/Equity 0.1 0.1 0.1
Debt/EBITDA 0.4 0.4 0.4
Int. cover(EBITDA/Fin. int) 96.8 107.5 117.1
EV/Sales 2.9 2.9 2.9
EV/EBITDA 9.0 8.8 8.7
EV/EBITDA (adj.) 9.0 8.8 8.7
EV/EBIT 17.5 16.1 16.1
P/E (adj.) 24.1 22.3 22.1
P/BV 2.2 2.2 2.1
OpFCF yield 4.0% 4.7% 4.1%
Dividend yield 4.1% 4.3% 4.5%
EPS (adj.) 0.19 0.20 0.20
BVPS 2.08 2.09 2.10
DPS 0.19 0.19 0.20
Shareholders
Mef 53%;
3.6
3.8
4.0
4.2
4.4
4.6
4.8
Apr 17 May 17 Jun 17 Jul 17 Aug 17 Sep 17 Oct 17 Nov 17 Dec 17 Jan 18 Feb 18 Mar 18 Apr 18 May 18
vvdsvdvsdy
ENAV FTSE Italy All Share (Rebased)
Source: Factset
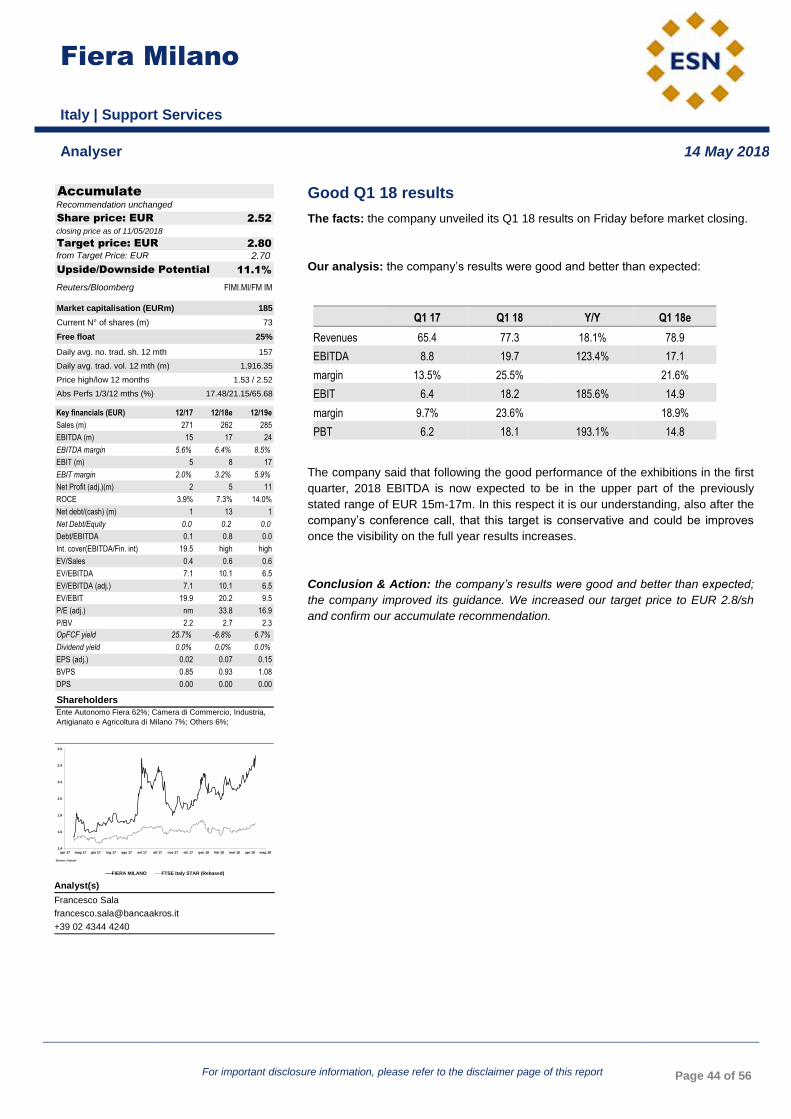
Fiera Milano
For important disclosure information, please refer to the disclaimer page of this report Page 44 of 56
Good Q1 18 results
The facts: the company unveiled its Q1 18 results on Friday before market closing.
Our analysis: the company’s results were good and better than expected:
Q1 17 Q1 18 Y/Y Q1 18e
Revenues 65.4 77.3 18.1% 78.9
EBITDA 8.8 19.7 123.4% 17.1
margin 13.5% 25.5%
21.6%
EBIT 6.4 18.2 185.6% 14.9
margin 9.7% 23.6%
18.9%
PBT 6.2 18.1 193.1% 14.8
The company said that following the good performance of the exhibitions in the first
quarter, 2018 EBITDA is now expected to be in the upper part of the previously
stated range of EUR 15m-17m. In this respect it is our understanding, also after the
company’s conference call, that this target is conservative and could be improves
once the visibility on the full year results increases.
Conclusion & Action: the company’s results were good and better than expected;
the company improved its guidance. We increased our target price to EUR 2.8/sh
and confirm our accumulate recommendation.
Fiera Milano
Italy | Support Services
SUPPORT SERVICES Fiera Milano (Accumulate) Steady results expected in Q1
Analyser 14 May 2018
Analyst(s)
Francesco Sala
+39 02 4344 4240
Accumulate
2.52
closing price as of 11/05/2018
2.80
2.70
11.1%Upside/Downside Potential
from Target Price: EUR
Recommendation unchanged
Target price: EUR
Share price: EUR
Reuters/Bloomberg FIMI.MI/FM IM
Market capitalisation (EURm) 185
Current N° of shares (m) 73
Free float 25%
Daily avg. no. trad. sh. 12 mth 157
Daily avg. trad. vol. 12 mth (m) 1,916.35
Price high/low 12 months 1.53 / 2.52
Abs Perfs 1/3/12 mths (%) 17.48/21.15/65.68
Key financials (EUR) 12/17 12/18e 12/19e
Sales (m) 271 262 285
EBITDA (m) 15 17 24
EBITDA margin 5.6% 6.4% 8.5%
EBIT (m) 5 8 17
EBIT margin 2.0% 3.2% 5.9%
Net Profit (adj.)(m) 2 5 11
ROCE 3.9% 7.3% 14.0%
Net debt/(cash) (m) 1 13 1
Net Debt/Equity 0.0 0.2 0.0
Debt/EBITDA 0.1 0.8 0.0
Int. cover(EBITDA/Fin. int) 19.5 high high
EV/Sales 0.4 0.6 0.6
EV/EBITDA 7.1 10.1 6.5
EV/EBITDA (adj.) 7.1 10.1 6.5
EV/EBIT 19.9 20.2 9.5
P/E (adj.) nm 33.8 16.9
P/BV 2.2 2.7 2.3
OpFCF yield 25.7% -6.8% 6.7%
Dividend yield 0.0% 0.0% 0.0%
EPS (adj.) 0.02 0.07 0.15
BVPS 0.85 0.93 1.08
DPS 0.00 0.00 0.00
Shareholders
Ente Autonomo Fiera 62%; Camera di Commercio, Industria,
Artigianato e Agricoltura di Milano 7%; Others 6%;
1.4
1.6
1.8
2.0
2.2
2.4
2.6
apr 17 mag 17 giu 17 lug 17 ago 17 set 17 ott 17 nov 17 dic 17 gen 18 feb 18 mar 18 apr 18 mag 18
vvdsvdvsdy
FIERA MILANO FTSE Italy STAR (Rebased)
Source: Factset

Besi
For important disclosure information, please refer to the disclaimer page of this report Page 45 of 56
Reporting troubles at KNS, but outlook stays strong
The facts: Besi’s competitor Kulicke & Soffa (KNS) only reported preliminary 2Q
fiscal 2018 revenues last week, as at the end of the fiscal quarter, it discovered
“certain unauthorized transactions by a senior finance employee of. KNS” and has
undertaken an investigation of these transactions with the assistance of outside
advisors.
Our analysis: The unauthorized transactions, involved “certain warranty accruals in
prior periods that have been accounted for incorrectly and therefore misstated”.
KNS’s board has therefore determined that the Company’s previously issued
consolidated financial statements for the full fiscal year ended September 30, 2017
can no longer be relied upon.
Although no material effects are expected, this is a material set back and the share
price shed 7.5% last Friday, which seems very moderate. The preliminary numbers
that were reported: revenues of USD 222m and net income of USD 36m were better
than expected and also the outlook for fiscal Q3 of revenues of USD 255-270m was
better than consensus.
While in the press release phrasing on the prospects was positive, in the earnings
call (without Q&A) CEO Mr. Fusen Chen said it is expecting “another very strong
revenue year“ which confirms the picture that Besi painted as well. Gross margins
are expected to be ~45% in the coming quarters (in line with expectations). Overall
IC unit growth, drives this growth with especially LED (on which the call was
particularly vocal), automotive and memory (14% of revs) and advanced packaging
providing extra confidence. Given the remarks in the earnings call, we expect that
KNS is making larger inroads into LED, a market that we expect is dominated by
ASMPT and in which Besi does not have much presence.
Conclusion & Action: Although KNS’s results are only preliminary, the remarks in
the earnings call and the outlook in the press release confirm the strong market
picture that Besi painted as well. We believe these should moderate the doubts that
were raised by the lowered VLSI market growth expectation reported in Besi’s press
release. We have an Accumulate rating on Besi and a Price target of EUR 38.50.
Besi
Netherlands | Technology Hardware & Equipment
TECHNOLOGY HARDWARE & EQUIPMENT Besi (Accumulate) Good Q1 18 results
Analyser 14 May 2018
Analyst(s)
Edwin de Jong
+312 0 5508569
Accumulate
31.40
closing price as of 11/05/2018
38.50
22.6%Upside/Downside Potential
Target Price unchanged
Recommendation unchanged
Target price: EUR
Share price: EUR
Reuters/Bloomberg BESI.AS/BESI NA
Market capitalisation (EURm) 2,356
Current N° of shares (m) 75
Free float 73%
Daily avg. no. trad. sh. 12 mth 466
Daily avg. trad. vol. 12 mth (m) 12,716.60
Price high/low 12 months 22.63 / 61.65
Abs Perfs 1/3/12 mths (%) -24.11/-12.17/32.98
Key financials (EUR) 12/17 12/18e 12/19e
Sales (m) 593 676 676
EBITDA (m) 233 271 268
EBITDA margin 39.3% 40.1% 39.6%
EBIT (m) 209 246 245
EBIT margin 35.3% 36.4% 36.3%
Net Profit (adj.)(m) 173 210 209
ROCE 76.0% 87.9% 92.6%
Net debt/(cash) (m) (248) (281) (292)
Net Debt/Equity -0.6 -0.6 -0.6
Debt/EBITDA -1.1 -1.0 -1.1
EV/Sales 4.0 3.1 3.1
EV/EBITDA 10.1 7.7 7.8
EV/EBITDA (adj.) 10.1 7.7 7.8
EV/EBIT 11.3 8.4 8.5
P/E (adj.) 16.5 11.7 11.8
P/BV 6.6 5.2 5.2
OpFCF yield 6.0% 8.8% 9.3%
Dividend yield 7.4% 8.9% 8.8%
EPS (adj.) 2.12 2.69 2.67
BVPS 5.32 6.04 6.00
DPS 2.32 2.79 2.77
Shareholders
Goldman Sachs 3%; Darlin 5%; Via Finis 3%; Kempen Oranje
Participaties 5%; JP Morgan 5%; UBS 3%; LSV 3%;
15
20
25
30
35
40
45
50
55
60
65
Apr 17 May 17 Jun 17 Jul 17 Aug 17 Sep 17 Oct 17 Nov 17 Dec 17 Jan 18 Feb 18 Mar 18 Apr 18 May 18
vvdsvdvsdy
BESI
Stoxx Telecom Equipment(Rebased)
Source: Factset
$nomcompagnie2$
For important disclosure information, please refer to the disclaimer page of this report Page 46 of 56
Wind Tre Q1 2018: another weak quarter pending Iliad’s entry
The facts: Wind Tre published its Q1 2018 results.
Our analysis: the performance of Wind Tre in Q1 2018 was again weak, as the
service revenue trend remained in the -7% range while EBITDA decline (at constant
accounting principle) deteriorated by 2pp Q/Q in spite of increasing synergies from
the merger (EUR 204m Opex to date, including EU 37m in Q1 2018 and EUR 270m
annual run rate vs. a target of EUR 490m by 2020, along with EUR 210m in capex).
The mobile customer base decreased by further 0.3m in Q1 (-0.3m in Q4, -1.7m in
the LTM) to 29.2m and ARPU was down by 2% Y/Y to EUR 10.8. Wind continues to
stress the “highly competitive market”, the reduction in legacy SMS services and the
impact of new “roam like at home” regulation. Mobile internet was just flattish Y/Y as
data ARPU increased by below 1% in spite of consumption up by 51%
(4.4GB/month) but the data users were slightly down Y/Y. In fixed, revenues were
basically stable thanks to growth in CPE, while services declined as the company
focussed on direct connections and ARPU was down by 3.9% Y/Y (to EUR 27).
Broadband customers were up by around 30K in Q1 (-12K in Q4 2017) and 20% is
now on FttX (70% of new fixed customers on fiber).
Wind Tre FY 2017 results (EUR m)
Q4 2016 Q 4 2017 Y/Y Q1 2017 Q1 2018 Y/Y
Total revenues 1,749 1,556 -11.0% 1,548 1,410 -8.9% Total Service 1,382 1,287 -6.9% 1,313 1,220 -7.1% Other 367 269 -26.7% 235 190 -19.1% Total Mobile 1,440 1,248 -13.3% 1,253 1,115 -11.0% ow mobile svcs 1,103 1,014 -8.1% 1,043 961 -7.9% Total Fixed 309 307 -0.6% 295 294 -0.3% ow fixed svcs 279 273 -2.2% 270 259 -4.1% Opex -1,138 -964 -15.3% -1,031 -920 -10.8% EBITDA 611 592 -3.1% 517 490 -5.2% Margin 34.9% 38.0% 3.1% 33.4% 34.8% 1.4% Capex -1,172 -1,257 7.3% -240 -205 -14.6% EBITDA-Capex -561 -665 18.5% 277 285 2.9%
Source: Company data,
Outlook. Wind Tre provided a strategy update and its approach to face the new
entrant in the Italian market. Iliad will likely determine a decline of mobile revenues
in the next few years (-2.3% CAGR in 2017/19) and the management admits the
impact on its customer base will be higher than on competitors'. The focus will be in
any case on value rather than volumes. The fight plan is based on the pillars of a)
fixed-mobile convergent offers, b) a strong handset range and c) a "dense
distribution footprint". Wind Tre will also step-up investments in 2018, up to EUR
1.5bn (+20%) to improve coverage. Total investments will in any case decline going
forward to around EUR 1bn in 2021 (EUR 6bn cumulated 2017/21). In this scenario,
EBITDA should be protected by efficiency actions and the full materialization of the
EUR 700m annual synergies coming from the Wind Tre integration.
Conclusion & Action: the results and the messages from the conference call are
consistent with the view of a very competitive market pending the entry of Iliad,
Wind is focussing on value, margins and cash flow.
Italian Telecommunications
TELECOMMUNICATIONS Reporting troubles at KNS, but outlook stays strong
Analyser 14 May 2018
---------- Stoxx Telecommunications, ___ DJ Stoxx TMI rebased on sector
Analyst(s)
Andrea Devita, CFA
+39 02 4344 4031
260
270
280
290
300
310
320
330
340
Apr 17 May 17 Jun 17 Jul 17 Aug 17Sep 17 Oct 17 Nov 17Dec 17 Jan 18 Feb 18 Mar 18 Apr 18 May 18
vvdsvdvsdy
Masmovil
For important disclosure information, please refer to the disclaimer page of this report Page 47 of 56
Not a strategic investment for ACS
The facts: ACS released 1Q18 results last week. During the CC the company shed
more light regarding its position in Masmovil. MAS will release results this morning.
Our analysis: According to ACS, MAS is among the short term divestments. We
recall that ACS has a bond that following the earn-out (linked to Yoigo’s results),
changed from hybrid to a traditional convertible bond of EUR120-80m at
EUR41.67/sh (4.8m shares and until 30th June 2021 can be converted with cash
interests.
Thanks to the MAS’ revaluation (+445.9% in three years; +136.7% in 12m and
32% YTD) ACS updated the book value of the convertible with a substantially
positive impact. In fact, just in 1Q18 the BV increased from EUR436m to
EUR571m. If the bond is converted ahead of the deadline ACS would become the
second main shareholder, behind Providence with around 14% stake if we consider
the conversion of the rest of the bonds (Providence, incentive plan for
management).
The case of Providence (EUR165m, conversion price EUR22/sh, between 23
December 2018 until 2024) differs from ACS’. Providence placed its stake (holds
76%) in January 2018. The operation placed 2.8m shares directed to qualified
investors (vs. 2.2m initially considered), i.e. 14% capital (EUR245m). This move
took place at an average EUR87.75/share (vs. EUR116/share current trading price)
at a 5% discount vs. the previous closing price. In light of the strong demand (>50
institutional investors) during the survey period, Providence decided to place more
shares. Following the operation, Providence is still the main shareholder with
27% stake (including convertibles), thus is not obliged to launch a takeover
bid if bonds are converted. In our opinion this is the main reason behind the place
as well as the earnings achieved thanks to MAS’ trading performance.
However, according John Hahn, Senior Managing Director of Providence: “the
partial sale today is due to the Company’s extraordinary performance last year and
the rise in the share price. We remain committed with the Company and its
management team, and believe Masmovil will continue to generate substantial
value”. On the other hand, the attractive interest rate of the convertible bond
(6.35%, EUR10.5m annual interest with potential share exchange at EUR22/sh) as
well as MAS’ successful commercial offer and healthy financial situation with deep-
in-the-money convertible bonds, thus possible conversions may not take place in
the short term. Therefore, we believe Providence has the vocation to stay in the
short/medium term.
Conclusion: The statements made by ACS are not surprising as MAS does not
form part of the company’s core activity. Our post-money fair value is currently
under revision. We include Providence and ACS’ converting bonds in 2019
and 2021, respectively.
Masmovil
Spain | Telecommunications
TELECOMMUNICATIONS Masmovil (Accumulate) Wind Tre Q1 2018: another weak quarter pending Iliad’s entry
Analyser 14 May 2018
Analyst(s)
Eduardo Garcia Arguelles
+34 914 367 810
Accumulate
116.00
closing price as of 11/05/2018
90.00
-22.4%Upside/Downside Potential
Target Price unchanged
Recommendation unchanged
Target price: EUR
Share price: EUR
Reuters/Bloomberg MAS.MC/MAS SM
Market capitalisation (EURm) 2,663
Current N° of shares (m) 23
Free float 41%
Daily avg. no. trad. sh. 12 mth 58
Daily avg. trad. vol. 12 mth (m) 7,219.83
Price high/low 12 months 51.89 / 129.60
Abs Perfs 1/3/12 mths (%) -3.33/21.09/136.73
Key financials (EUR) 12/17 12/18e 12/19e
Sales (m) 1,351 1,405 1,603
EBITDA (m) 213 261 318
EBITDA margin 15.7% 18.6% 19.8%
EBIT (m) 92 138 183
EBIT margin 6.8% 9.8% 11.4%
Net Profit (adj.)(m) 97 91 132
ROCE 9.8% 11.4% 15.5%
Net debt/(cash) (m) 519 394 133
Net Debt/Equity 1.7 0.9 0.2
Debt/EBITDA 2.4 1.5 0.4
Int. cover(EBITDA/Fin. int) 0.9 13.2 23.6
EV/Sales 1.5 2.0 1.9
EV/EBITDA 9.4 10.6 9.7
EV/EBITDA (adj.) 8.5 10.6 9.7
EV/EBIT 21.6 20.2 16.8
P/E (adj.) 15.9 27.3 22.4
P/BV 5.1 5.4 4.2
OpFCF yield -0.5% 2.3% 4.7%
Dividend yield 0.0% 0.0% 0.0%
EPS (adj.) 5.52 4.26 5.18
BVPS 17.32 21.40 27.50
DPS 0.00 0.00 0.00
Shareholders
Providence 18%; Onchena 17%; Wilmington 10%;
40
50
60
70
80
90
100
110
120
130
Apr 17 May 17 Jun 17 Jul 17 Aug 17 Sep 17 Oct 17 Nov 17 Dec 17 Jan 18 Feb 18 Mar 18 Apr 18 May 18
vvdsvdvsdy
MASMOVIL Stoxx Telecommunications (Rebased)
Source: Factset
Acciona
For important disclosure information, please refer to the disclaimer page of this report Page 48 of 56
Good 1Q18 results
The facts: Results leaning on higher volumes in energy and better margins in
construction. The negative surprise comes from the contract in Sydney where
Acciona is claiming AUD700m due to differences regarding the reach of the
contract. Acciona maintains its target including working capital (EUR200-250m vs.
estimated EUR291m).
Our analysis: Generation: Sales +8% and EBITDA +7.3% (2.5% 2017) due to
the higher production (15%; Spain: 14%; International 16%), lower prices (-6%;
Spain -4% and -8% international), and stable margins (62.3% vs. 62.6% 1Q17).
235MW installed during the last year (+3%); 589MW under construction. EBITDA
ex-energy increases 7% (EUR100m) mainly due to construction where margins
improve (6.2% vs. 5.4% 1Q17), but not in the portfolio (-1% vs. Dec’17).
Other activities: Moderate growth in Bestinver (+5% EBITDA) with flat Assets
under management (EUR6,071m vs. EUR6,058m). Transmediterranea still included
in results awaiting the approval of the sale. Real estate (EUR-3m) pending new
housing developments.
Debt: EUR5,374m, growing 2% vs. Dec’17 (EUR5,224m). Negative impact from
working capital (EUR291m) in line with our full year forecasts. New syndicated loan
for EUR1,300m at 5 years and 1.56% fixed cost. Debt at set rates represents 60%
of the total.
Asset sales: The sale of the Transmed deal is expected in 1H18 and thermosolar
was completed yesterday. Working capital: EUR-291m with EUR-74m impact
proceeding from the contract in Sydney. The EUR200-250m target for 2018 remains
(vs. EUR291m estimated) although subject to the payment calendar of the
mentioned contract. The reason for the dispute is the reach of the contract. Targets:
EBITDA growth average digit vs. our estimated +6%. Capex EUR900m (vs.
EUR1.1bn). ND/EBITDA ratio around 4x (4.2x estimated).
Conclusion: We maintain our estimates and positive outlook.
SALES 1T17 1T18 %
Infraestructuras 1,066.0 1,063.0 -0.3%
Energy 463.0 519.0 12.1%
Other 128.0 130.0 1.6%
Adjustments -24.0 -32.0 33.3%
TOTAL 1,634.0 1,680.0 2.8%
EBITDA 1T17 1T18 %
Infraestructuras 86.0 90.0 4.7%
Energy 208.0 220.0 5.8%
Other 7.0 11.0 57.1%
Adjustments -1.0 -1.0 0.0%
TOTAL 301.0 320.0 6.3%
RESULTS ACCOUNT 1T17 1T18 %
Amortisations/Prov -156.0 -157.0 0.6%
Operating Result 146.0 164.0 12.3%
Financial result -81.0 -61.0 -24.7%
Other 33.0 0.0 -100.0%
Taxes/Minorities -38.0 -42.0 10.5%
Net Income 60.0 61.0 1.7%
Source: Acciona
Acciona
Spain | Utilities
UTILITIES Acciona (Buy) Not a strategic investment for ACS
Analyser 14 May 2018
Analyst(s)
Rafael Fernández de Heredia
+34 91 436 78 08
Buy
67.14
closing price as of 11/05/2018
86.40
28.7%Upside/Downside Potential
Target Price unchanged
Recommendation unchanged
Target price: EUR
Share price: EUR
Reuters/Bloomberg ANA.MC/ANA SM
Market capitalisation (EURm) 3,844
Current N° of shares (m) 57
Free float 46%
Daily avg. no. trad. sh. 12 mth 168
Daily avg. trad. vol. 12 mth (m) 16,721.60
Price high/low 12 months 59.82 / 85.87
Abs Perfs 1/3/12 mths (%) 1.82/-0.42/-14.69
Key financials (EUR) 12/17 12/18e 12/19e
Sales (m) 7,254 6,738 7,070
EBITDA (m) 1,274 1,186 1,286
EBITDA margin 17.6% 17.6% 18.2%
EBIT (m) 720 575 644
EBIT margin 9.9% 8.5% 9.1%
Net Profit (adj.)(m) 233 222 243
ROCE 6.4% 5.5% 6.0%
Net debt/(cash) (m) 5,224 5,030 5,282
Net Debt/Equity 1.3 1.2 1.3
Debt/EBITDA 4.1 4.2 4.1
Int. cover(EBITDA/Fin. int) 3.9 3.8 3.7
EV/Sales 1.1 1.2 1.2
EV/EBITDA 6.2 6.8 6.5
EV/EBITDA (adj.) 6.2 6.8 6.5
EV/EBIT 11.0 14.0 12.9
P/E (adj.) 16.7 17.3 15.8
P/BV 1.0 1.1 1.1
OpFCF yield 9.1% 8.4% 17.6%
Dividend yield 4.5% 4.6% 4.7%
EPS (adj.) 4.07 3.88 4.24
BVPS 65.67 60.18 61.89
DPS 3.00 3.09 3.18
Shareholders
Familia Entrecanales 54%;
55
60
65
70
75
80
85
90
Apr 17 May 17 Jun 17 Jul 17 Aug 17 Sep 17 Oct 17 Nov 17 Dec 17 Jan 18 Feb 18 Mar 18 Apr 18 May 18
vvdsvdvsdy
ACCIONA Stoxx Utilities (Rebased)
Source: Factset

EDP
For important disclosure information, please refer to the disclaimer page of this report Page 49 of 56
CTG launches a voluntary take-over bid on EDP
The facts: CTG as announced on Friday a voluntary take-over bid on EDP’s share
capital. The offering price is EUR 3.26 per share to be paid in cash.
Our analysis: Currently CTG holds, 850,777,024 shares in EDP’s share capital
representing 23.27% of the share capital.
The effectiveness of the Offer will be subject to the fulfilment that represent at least
50% (fifty per cent) of the voting rights in the Target Company plus 1 (one) voting
right.
The offering price represents a premium of approximately 10.8% in relation to the
volume-weighted average price of the shares of the last six months, which is
approximately EUR 2.94 per share.
The offering price represents a premium of 3.4% in relation to Friday’s closing price.
Conclusion & Action: In our opinion the price offered is too low for the offer to
have success.
EDP
Portugal | Utilities
UTILITIES EDP (Accumulate) Good 1Q18 results
Analyser 14 May 2018
Analyst(s)
Helena Barbosa
+351 21 389 6831
Accumulate
3.11
closing price as of 11/05/2018
3.15
1.3%Upside/Downside Potential
Target Price unchanged
Recommendation unchanged
Target price: EUR
Share price: EUR
Reuters/Bloomberg EDP.LS/EDP PL
Market capitalisation (EURm) 11,372
Current N° of shares (m) 3,657
Free float 44%
Daily avg. no. trad. sh. 12 mth 6,740
Daily avg. trad. vol. 12 mth (m) 29,027.61
Price high/low 12 months 2.64 / 3.37
Abs Perfs 1/3/12 mths (%) -1.24/15.74/-4.78
Key financials (EUR) 12/17 12/18e 12/19e
Sales (m) 14,741 14,815 14,889
EBITDA (m) 4,109 3,472 3,594
EBITDA margin 27.9% 23.4% 24.1%
EBIT (m) 2,706 2,048 2,145
EBIT margin 18.4% 13.8% 14.4%
Net Profit (adj.)(m) 1,343 791 863
ROCE 6.4% 4.8% 5.0%
Net debt/(cash) (m) 14,165 14,142 14,064
Net Debt/Equity 1.0 1.0 1.0
Debt/EBITDA 3.4 4.1 3.9
Int. cover(EBITDA/Fin. int) 5.3 5.7 5.9
EV/Sales 1.8 1.8 1.8
EV/EBITDA 6.3 7.7 7.4
EV/EBITDA (adj.) 6.3 7.7 7.4
EV/EBIT 9.6 13.1 12.4
P/E (adj.) 7.9 14.4 13.2
P/BV 1.0 1.1 1.1
OpFCF yield 19.7% 9.5% 10.1%
Dividend yield 6.1% 6.1% 6.1%
EPS (adj.) 0.37 0.22 0.24
BVPS 2.75 2.78 2.82
DPS 0.19 0.19 0.19
Shareholders
China Three Gorges 23%; CNIC Co 3%; Capital Group
Companies 12%; Oppidum 7%; BlackRock 5%; Mubadala
(Abu Dhabi) 4%; BCP Group 2%; Qatar Investment 2%;
2.60
2.70
2.80
2.90
3.00
3.10
3.20
3.30
3.40
abr 17 mai 17 jun 17 jul 17 ago 17 set 17 out 17 nov 17 dez 17 jan 18 fev 18 mar 18 abr 18 mai 18
vvdsvdvsdy
EDP Stoxx Utilities (Rebased)
Source: Factset

EDP Renováveis
For important disclosure information, please refer to the disclaimer page of this report Page 50 of 56
CTG launches mandatory take-over bid
The facts: CTG launched a mandatory take-over bid over EDPR’s shares. The
offer price is EUR 7.3 to be paid in cash.
Our analysis: CTG launched a mandatory take-over bid over EDPR’s shares. The
offer price is EUR 7.3 to be paid in cash.
Conclusion & Action: The offer price is below the market price, so the success of
the offer is very low.
EDP Renováveis
Portugal | Utilities
UTILITIES EDP Renováveis (Neutral) CTG launches a voluntary take-over bid on EDP
Analyser 14 May 2018
Analyst(s)
Helena Barbosa
+351 21 389 6831
Neutral
7.85
closing price as of 11/05/2018
7.10
-9.5%Upside/Downside Potential
Target Price unchanged
Recommendation unchanged
Target price: EUR
Share price: EUR
Reuters/Bloomberg EDPR.LS/EDPR PL
Market capitalisation (EURm) 6,843
Current N° of shares (m) 872
Free float 14%
Daily avg. no. trad. sh. 12 mth 257
Daily avg. trad. vol. 12 mth (m) 1,576.19
Price high/low 12 months 6.56 / 8.10
Abs Perfs 1/3/12 mths (%) -2.00/13.94/11.83
Key financials (EUR) 12/17 12/18e 12/19e
Sales (m) 1,866 1,887 2,021
EBITDA (m) 1,341 1,355 1,452
EBITDA margin 71.9% 71.8% 71.9%
EBIT (m) 829 818 890
EBIT margin 44.4% 43.3% 44.0%
Net Profit (adj.)(m) 247 236 291
ROCE 4.6% 4.4% 4.8%
Net debt/(cash) (m) 3,541 3,550 3,426
Net Debt/Equity 0.5 0.4 0.4
Debt/EBITDA 2.6 2.6 2.4
Int. cover(EBITDA/Fin. int) 4.5 4.5 4.8
EV/Sales 5.7 6.1 5.6
EV/EBITDA 8.0 8.5 7.8
EV/EBITDA (adj.) 8.0 8.5 7.8
EV/EBIT 12.9 14.0 12.8
P/E (adj.) 24.6 29.1 23.5
P/BV 1.0 1.1 1.0
OpFCF yield -3.3% 2.6% 4.8%
Dividend yield 0.6% 0.8% 0.9%
EPS (adj.) 0.28 0.27 0.33
BVPS 7.25 7.46 7.73
DPS 0.05 0.06 0.07
Shareholders
EDP 83%; Sun Life Financial 3%;
6.0
6.2
6.4
6.6
6.8
7.0
7.2
7.4
7.6
7.8
8.0
8.2
abr 17 mai 17 jun 17 jul 17 ago 17 set 17 out 17 nov 17 dez 17 jan 18 fev 18 mar 18 abr 18 mai 18
vvdsvdvsdy
EDP RENOVÁVEIS Stoxx Utilities (Rebased)
Source: Factset

Page 51 of 56
European Coverage of the Members of ESN
A ero space & D efense M em(*) Bper BAK Kemira OPG Campari BAK
Airbus Se CIC Bpi CBI Kws Saat EQB Coca Cola Hbc Ag IBG
Dassault Aviation CIC Caixabank GVC Lanxess EQB Corbion NIBC
Latecoere CIC Commerzbank EQB Linde EQB Danone CIC
Leonardo BAK Credem BAK Siegfried Holding Ag EQB Ebro Foods GVC
Lisi CIC Credit Agrico le Sa CIC Symrise Ag EQB Enervit BAK
M tu Aero Engines EQB Creval BAK Tikkurila OPG Fleury M ichon CIC
Ohb Se EQB Deutsche Bank EQBElectro nic & Electrical
EquipmentM em(*) Forfarmers NIBC
Rheinmetall EQB Deutsche Pfandbriefbank EQB Euromicron Ag EQB Heineken NIBC
Safran CIC Eurobank IBG Neways Electronics NIBC Hkscan OPG
Thales CIC Intesa Sanpaolo BAK Pkc Group OPG La Doria BAK
A lternat ive Energy M em(*) Liberbank GVC Rexel CIC Lanson-Bcc CIC
Daldrup & Soehne EQB M ediobanca BAK Vaisala OPG Laurent Perrier CIC
Siemens Gamesa Re GVC M erkur Bank EQB Viscom EQB Ldc CIC
Sif Group NIBC National Bank Of Greece IBG F inancial Services M em(*) Lucas Bols NIBC
Solaria GVC Natixis CIC Amundi CIC M assimo Zanetti BAK
A uto mo biles & P arts M em(*) Nordea OPG Anima BAK Naturex CIC
Bittium Corporation OPG Piraeus Bank IBG Athex Group IBG Olvi OPG
Bmw EQB Poste Italiane BAK Azimut BAK Orsero BAK
Brembo BAK Procredit Holding EQB Banca Farmafactoring BAK Pernod Ricard CIC
Continental EQB Rothschild & Co CIC Banca Generali BAK Raisio OPG
Daimler Ag EQB Societe Generale CIC Banca Ifis BAK Refresco Group NIBC
Elringklinger EQB Ubi Banca BAK Banca Sistema BAK Remy Cointreau CIC
Ferrari BAK Unicredit BAK Bb Biotech EQB Suedzucker EQB
Fiat Chrysler Automobiles BAK B asic R eso urces M em(*) Bolsas Y M ercados Espanoles Sa GVC Takeaway.Com NIBC
Hella Gmbh & Co. Kgaa EQB Acerinox GVC Capman OPG Telepizza GVC
Indelb BAK Altri CBI Cir BAK Vapiano EQB
Kamux OPG Arcelormittal GVC Comdirect EQB Vidrala GVC
Landi Renzo BAK Corticeira Amorim CBI Corestate Capital Holding S.A. EQB Vilmorin CIC
Leoni EQB Ence GVC Corp. Financiera Alba GVC Viscofan GVC
Nokian Tyres OPG Europac GVC Digital M agics BAK Vranken Pommery M onopole CIC
Norma Group EQB M etka IBG Dobank BAK Wessanen NIBC
Piaggio BAK M etsä Board OPG D ws EQB F o o d & D rug R etailers M em(*)
Pwo EQB M ytilineos IBG Eq OPG Ahold Delhaize NIBC
Schaeff ler EQB Outokumpu OPG Eurazeo CIC Carrefour CIC
Sogefi BAK Ramada CBI Eyemaxx Real Estate EQB Casino Guichard-Perrachon CIC
Stabilus EQB Semapa CBI Ferratum EQB Ceconomy Ag EQB
Stern Groep NIBC Ssab OPG Ffp CIC Dia GVC
Volkswagen EQB Stora Enso OPG Finecobank BAK Jeronimo M artins CBI
B anks M em(*) Surteco EQB Grenke EQB Kesko OPG
Aareal Bank EQB The Navigator Company CBI Hypoport Ag EQB M arr BAK
Aktia OPG Tubacex GVC M lp EQB M etro Ag EQB
Alpha Bank IBG Upm-Kymmene OPG Ovb Holding Ag EQB Sligro NIBC
Banca Carige BAK C hemicals M em(*) Patrizia EQB Sonae CBI
Banca M ps BAK Air Liquide CIC Rallye CIC
Banco Sabadell GVC Arkema CIC Tip Tamburi Investment Partners BAK
Banco Santander GVC Avantium NIBC Unipol Gruppo Finanziario BAK
Bankia GVC Brenntag EQB Wendel CIC
Bankinter GVC Fuchs Petro lub EQB F o o d & B everage M em(*)
Bbva GVC Holland Colours NIBC Acomo NIBC
Bcp CBI Imcd NIBC Atria OPG
ESN Analyser

Page 52 of 56
General Industria ls M em(*) Orio la-Kd OPG Talgo GVC Salini Impregilo BAK
2G Energy EQB Orion OPG Technotrans EQB Sias BAK
Aalberts NIBC Orpea CIC Valmet OPG Sonae Industria CBI
Accell Group NIBC Pihlajalinna OPG Wacker Neuson Se EQB Srv OPG
Ahlstrom OPG Recordati BAK Wärtsilä OPG Tarkett CIC
Arcadis NIBC Silmaasema OPG Zardoya Otis GVC Thermador Groupe CIC
Aspo OPG Terveystalo OPG Industria l T ranspo rtat io n M em(*) Titan Cement IBG
Cembre BAK H o useho ld Go o ds M em(*) Bollore CIC Trevi BAK
Huhtamäki OPG De Longhi BAK Ctt CBI Uponor OPG
Kendrion NIBC Elica BAK Logwin EQB Vicat CIC
Nedap NIBC Fila BAK Insurance M em(*) Vinci CIC
Pöyry OPG M aisons Du M onde CIC Allianz EQB Volkerwessels NIBC
Prelios BAK Philips Lighting NIBC Axa CIC Yit OPG
Saf-Holland EQB Industria l Engineering M em(*) Banca M edio lanum BAK M edia M em(*)
Serge Ferrari Group CIC Accsys Technologies NIBC Catto lica Assicurazioni BAK Alma M edia OPG
Tkh Group NIBC Aixtron EQB Generali BAK Arnoldo M ondadori Editore BAK
General R etailers M em(*) Alstom CIC Hannover Re EQB Atresmedia GVC
Beter Bed Holding NIBC Ansaldo Sts BAK M apfre Sa GVC Axel Springer EQB
Elumeo Se EQB Biesse BAK M unich Re EQB Brill NIBC
Fielmann EQB Caf GVC Sampo OPG Cairo Communication BAK
Fnac Darty CIC Cargotec Corp OPG Talanx Group EQB Cofina CBI
Folli Fo llie Group IBG Carraro BAK Unipolsai BAK Cts Eventim EQB
Fourlis Holdings IBG Cnh Industrial BAKM aterials, C o nstruct io n &
InfrastructureM em(*) Digital Bros BAK
Grandvision NIBC Danieli BAK Abertis GVC Gedi Gruppo Editoriale BAK
Hornbach Holding EQB Datalogic BAK Acs GVC Gl Events CIC
Inditex GVC Deutz Ag EQB Aena GVC Impresa CBI
Jumbo IBG Duerr EQB Aeroports De Paris CIC Io l BAK
Ovs BAK Emak BAK Astaldi BAK Ipsos CIC
Rapala OPG Envipco NIBC Atlantia BAK Jcdecaux CIC
Stockmann OPG Exel Composites OPG Boskalis Westminster NIBC Lagardere CIC
Takkt Ag EQB Fincantieri BAK Buzzi Unicem BAK M 6-M etropole Television CIC
Tokmanni OPG Gea Group EQB Caverion OPG M ediaset BAK
Unieuro BAK Gesco EQB Cramo OPG M ediaset Espana GVC
Windeln.De EQB Heidelberger Druck EQB Eiffage CIC Notorious Pictures BAK
Yoox Net-A-Porter BAK Ima BAK Ellaktor IBG Nrj Group CIC
Zalando EQB Indus Holding Ag EQB Eltel OPG Publicis CIC
H ealthcare M em(*) Interpump BAK Ezentis GVC Rcs M ediagroup BAK
4Sc EQB Koenig & Bauer EQB Fcc GVC Relx NIBC
Abivax NIBC Kone OPG Ferrovial GVC Rtl Group EQB
Advicenne NIBC Konecranes OPG Heidelberg Cement Ag CIC Sanoma OPG
Amplifon BAK Krones Ag EQB Heijmans NIBC Solocal Group CIC
Bayer EQB M anitou CIC Imerys CIC Spir Communication CIC
Biotest EQB M anz Ag EQB Lafargeholcim CIC Syzygy Ag EQB
Diasorin BAK M ax Automation Ag EQB Lehto OPG Teleperformance CIC
El.En. BAK M etso Corporation OPG Lemminkäinen OPG Tf1 CIC
Epigenomics Ag EQB Outotec OPG M aire Tecnimont BAK Ubisoft CIC
Genfit CIC Pfeiffer Vacuum EQB M ota Engil CBI Vivendi CIC
Gerresheimer Ag EQB Ponsse OPG Obrascon Huarte Lain GVC Wolters Kluwer NIBC
Guerbet CIC Prima Industrie BAK Ramirent OPG Xing Ag EQB
Heidelberg Pharma EQB Prysmian BAK Royal Bam Group NIBC
Korian CIC Schaltbau Holding Ag EQB Sacyr GVC
M erck EQB Smt Scharf Ag EQB Saint Gobain CIC

Page 53 of 56
Oil & Gas P ro ducers M em(*) Hispania Activos Inmobiliarios GVC Lassila & Tikanoja OPG I Grandi Viaggi BAK
Eni BAK Igd BAK Openjobmetis BAK Iberso l CBI
Galp Energia CBI Lar España GVC Rai Way BAK Int. A irlines Group GVC
Gas Plus BAK M erlin Properties GVCT echno lo gy H ardware &
EquipmentM em(*) Intralo t IBG
Hellenic Petro leum IBG Realia GVC Asm International NIBC Kotipizza OPG
M aurel Et Prom CIC Technopolis OPG Asml NIBC M elia Hotels International GVC
M otor Oil IBG Wcm Ag EQB Besi NIBC Nh Hotel Group GVC
Neste Corporation OPG So ftware & C o mputer Services M em(*) Ericsson OPG Opap IBG
Qgep CBI Affecto OPG Gigaset EQB Snaitech BAK
Repsol GVC Akka Technologies CIC Nokia OPG Snowworld NIBC
Total CIC Alten CIC Roodmicrotec NIBC Sodexo CIC
Oil Services M em(*) Altran CIC S&T Ag EQB Sonae Capital CBI
Bourbon CIC Assystem CIC Slm Solutions EQB Trigano CIC
Cgg CIC Atos CIC Stmicroelectronics BAK Utilit ies M em(*)
Fugro NIBC Axway Software CIC Suess M icrotec EQB Acciona GVC
Rubis CIC Basware OPG Teleste OPG Acea BAK
Saipem BAK Comptel OPG Va-Q-Tec EQB Albioma CIC
Sbm Offshore NIBC Ctac NIBC T eleco mmunicat io ns M em(*) Direct Energie CIC
Technipfmc Plc CIC Digia Plc OPG 1&1 Drillisch Ag EQB Edp CBI
Tecnicas Reunidas GVC Econocom CIC Acotel BAK Edp Renováveis CBI
Tenaris BAK Esi Group CIC Bouygues CIC Enagas GVC
Vallourec CIC Exprivia BAK Deutsche Telekom EQB Endesa GVC
Vopak NIBC F-Secure OPG Dna OPG Enel BAK
P erso nal Go o ds M em(*) Gft Technologies EQB Elisa OPG Erg BAK
Adidas EQB Ict Group NIBC Euskaltel GVC Eydap IBG
Adler M odemaerkte EQB Indra Sistemas GVC Freenet EQB Falck Renewables BAK
Amer Sports OPG Nemetschek Se EQB Iliad CIC Fortum OPG
Basicnet BAK Neurones CIC Kpn Telecom NIBC Gas Natural Fenosa GVC
Cie Fin. Richemont CIC Nexus Ag EQB M asmovil GVC Hera BAK
Geox BAK Novabase CBI Nos CBI Iberdro la GVC
Gerry Weber EQB Ordina NIBC Orange CIC Iren BAK
Hermes Intl. CIC Psi Software Ag EQB Ote IBG Italgas BAK
Hugo Boss EQB Reply BAK Retelit BAK Public Power Corp IBG
Kering CIC Rib Software EQB Tele Columbus EQB Red Electrica De Espana GVC
Luxottica BAK Rovio Entertainment OPG Telecom Italia BAK Ren CBI
Lvmh CIC Scout24 EQB Telefonica GVC Snam BAK
M arimekko OPG Seven Principles Ag EQB Telefonica Deutschland EQB Terna BAK
M oncler BAK Sii CIC Telia OPG
Puma EQB Software Ag EQB Tiscali BAK
Safilo BAK Sopra Steria Group CIC United Internet EQB
Salvatore Ferragamo BAK Tieto OPG Vodafone BAK
Sarantis IBG Tomtom NIBC T ravel & Leisure M em(*)
Swatch Group CIC Suppo rt Services M em(*) Accor CIC
Technogym BAK Amadeus GVC Aegean Airlines IBG
Tod'S BAK Asiakastieto Group OPG Air France Klm CIC
R eal Estate M em(*) Batenburg NIBC Autogrill BAK
Adler Real Estate EQB Cellnex Telecom GVC Beneteau CIC
Beni Stabili BAK Dpa NIBC Compagnie Des Alpes CIC
Citycon OPG Ei Towers BAK Elior CIC
Demire EQB Enav BAK Europcar CIC
Deutsche Euroshop EQB Fiera M ilano BAK Finnair OPG
Grivalia IBG Inwit BAK Gamenet BAK
LEGEND: BAK: Banca Akros; CIC: CM CIC Market Solutions; CBI: Caixa-Banco de Investimento; GVC: GVC Gaesco Beksa, SV, SA; EQB: equinet bank; IBG: Investment Bank of Greece, NIBC: NIBC Bank N.V: OPG: OP Corporate Bank:;as of 4
th April 2018

Page 54 of 56
List of ESN Analysts (**)
Artur Amaro CBI +351 213 89 6822 [email protected] Konstantinos Manolopoulos IBG +30 210 817 3388 [email protected]
Stefan Augustin EQB +49-69-58997-430 [email protected] Katharina Mayer EQB +49 69 58997-432 [email protected]
Helena Barbosa CBI +351 21 389 6831 [email protected] Fanny Meindre, PhD CIC +33 1 53 48 80 84 [email protected]
Winfried Becker EQB +49 69 58997-416 [email protected] Marietta Miemietz CFA EQB +49-69-58997-439 [email protected]
Javier Bernat GVC +34 91 436 7816 jav [email protected] Dustin Mildner EQB +49 69 58997-438 [email protected]
Dimitris Birbos IBG +30 210 81 73 392 [email protected] Henri Parkkinen OPG +358 10 252 4409 [email protected]
Agnès Blazy CIC +33 1 53 48 80 67 [email protected] Victor Peiro Pérez GVC +34 91 436 7812 [email protected]
Rafael Bonardell GVC +34 91 436 78 71 [email protected] Alexandre Plaud CIC +33 1 53 48 80 90 [email protected]
Andrea Bonfà BAK +39 02 4344 4269 [email protected] Francis Prêtre CIC +33 4 78 92 02 30 [email protected]
Jean-Baptiste Bouchet CIC +33 1 53 48 80 69 [email protected] Francesco Previtera BAK +39 02 4344 4033 francesco.prev [email protected]
Christian Bruns EQB +49 69 58997 415 [email protected] Jari Raisanen OPG +358 10 252 4504 [email protected]
Giada Cabrino, CIIA BAK +39 02 4344 4092 [email protected] Hannu Rauhala OPG +358 10 252 4392 [email protected]
Niclas Catani OPG +358 10 252 8780 [email protected] Matias Rautionmaa OPG +358 10 252 4408 [email protected]
Pierre Chedeville CIC +33 1 53 48 80 97 [email protected] Eric Ravary CIC +33 1 53 48 80 71 [email protected]
Emmanuel Chevalier CIC +33 1 53 48 80 72 [email protected] Iñigo Recio Pascual GVC +34 91 436 7814 [email protected]
David Da Maia CIC +33 1 53 48 89 36 [email protected] John David Roeg NIBC +31 (0)20 550 86 46 [email protected]
Edwin de Jong NIBC +312 0 5508569 [email protected] Jean-Luc Romain CIC +33 1 53 48 80 66 [email protected]
Martijn den Drijver NIBC +312 0 5508636 [email protected] Vassilis Roumantzis IBG +30 2108173394 [email protected]
Christian Devismes CIC +33 1 53 48 80 85 [email protected] Zafer Rüzgar EQB +49 69 58 99 74 12 [email protected]
Andrea Devita, CFA BAK +39 02 4344 4031 [email protected] Antti Saari OPG +358 10 252 4359 [email protected]
Enrico Esposti, CIIA BAK +39 02 4344 4022 [email protected] Paola Saglietti BAK +39 02 4344 4287 [email protected]
Rafael Fernández de Heredia GVC +34 91 436 78 08 [email protected] Francesco Sala BAK +39 02 4344 4240 [email protected]
Gabriele Gambarova BAK +39 02 43 444 289 [email protected] Tim Schuldt, CFA EQB +49 69 5899 7433 [email protected]
Eduardo Garcia Arguelles GVC +34 914 367 810 [email protected] Cengiz Sen EQB +4969 58997 435 [email protected]
Alexandre Gérard CIC +33 1 53 48 80 93 [email protected] Pekka Spolander OPG +358 10 252 4351 [email protected]
Philipp Häßler, CFA EQB +49 69 58997 414 [email protected] Kimmo Stenvall OPG +358 10 252 4561 [email protected]
Simon Heilmann EQB +49 69 58 997 413 [email protected] Natalia Svyrou-Svyriadi IBG +30 210 81 73 384 [email protected]
Dr. Knud Hinkel, CFA EQB + 49 69 58997 419 [email protected] Manuel Tanzer, CFA EQB +49 69 58997-418 [email protected]
Ebrahim Homani CIC +33 1 53 48 80 87 [email protected] Luigi Tramontana BAK +39 02 4344 4239 [email protected]
Carlos Jesus CBI +351 21 389 6812 [email protected] Johan van den Hooven NIBC +312 0 5508518 [email protected]
Mark Josefson EQB +4969-58997-437 [email protected] Dylan van Haaften NIBC +312 0 611915485 [email protected]
Jean-Christophe Lefèvre-Moulenq CIC +33 1 53 48 80 65 [email protected] Sebastian Winkler NIBC +31 6 21 16 17 94 [email protected]
João Miguel Lourenço CBI +35 121 389 6841 [email protected]
(**) excluding: strategists, macroeconomists, heads of research not covering specific stocks, credit analysts, technical analysts
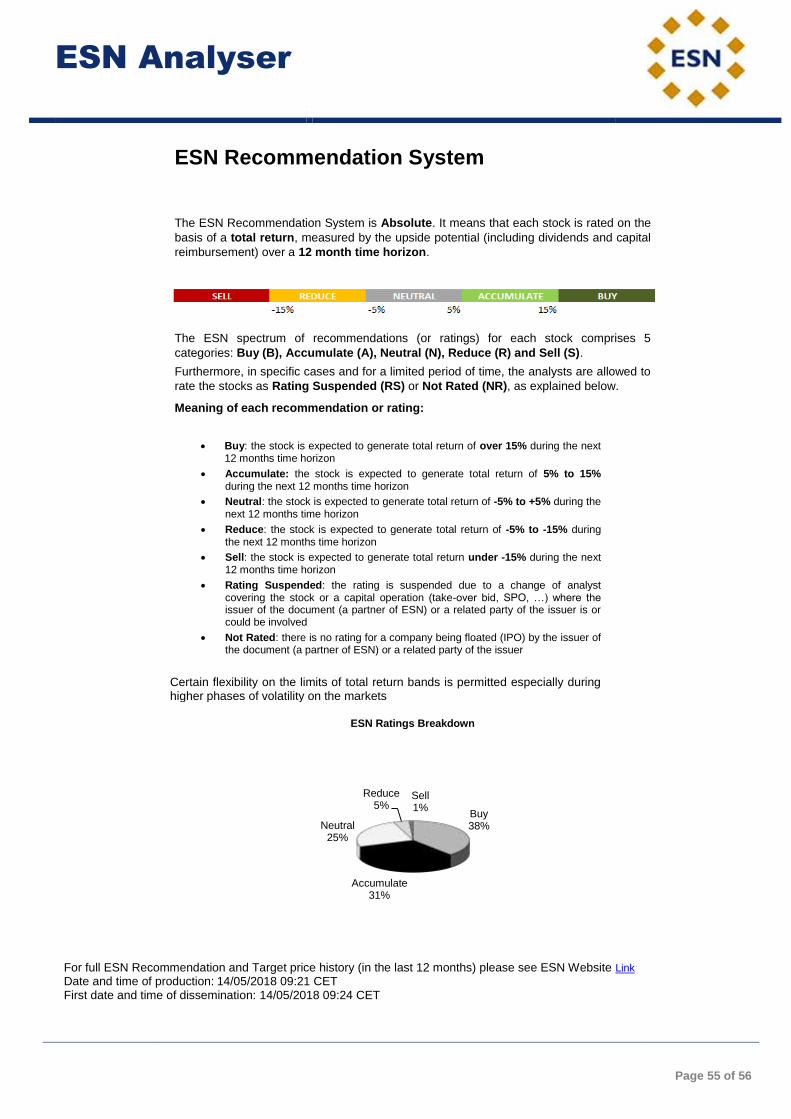
Page 55 of 56
ESN Recommendation System
The ESN Recommendation System is Absolute. It means that each stock is rated on the
basis of a total return, measured by the upside potential (including dividends and capital
reimbursement) over a 12 month time horizon.
The ESN spectrum of recommendations (or ratings) for each stock comprises 5
categories: Buy (B), Accumulate (A), Neutral (N), Reduce (R) and Sell (S).
Furthermore, in specific cases and for a limited period of time, the analysts are allowed to
rate the stocks as Rating Suspended (RS) or Not Rated (NR), as explained below.
Meaning of each recommendation or rating:
Buy: the stock is expected to generate total return of over 15% during the next 12 months time horizon
Accumulate: the stock is expected to generate total return of 5% to 15% during the next 12 months time horizon
Neutral: the stock is expected to generate total return of -5% to +5% during the next 12 months time horizon
Reduce: the stock is expected to generate total return of -5% to -15% during the next 12 months time horizon
Sell: the stock is expected to generate total return under -15% during the next 12 months time horizon
Rating Suspended: the rating is suspended due to a change of analyst covering the stock or a capital operation (take-over bid, SPO, …) where the issuer of the document (a partner of ESN) or a related party of the issuer is or could be involved
Not Rated: there is no rating for a company being floated (IPO) by the issuer of the document (a partner of ESN) or a related party of the issuer
Certain flexibility on the limits of total return bands is permitted especially during higher phases of volatility on the markets
ESN Ratings Breakdown
For full ESN Recommendation and Target price history (in the last 12 months) please see ESN Website Link
Date and time of production: 14/05/2018 09:21 CET First date and time of dissemination: 14/05/2018 09:24 CET
Buy38%
Accumulate31%
Neutral25%
Reduce5%
Sell1%
ESN Analyser

Page 56 of 56
Disclaimer: These reports have been prepared and issued by the Members of European Securities Network LLP (‘ESN’). ESN, its Members and their affiliates (and any director, officer or employee thereof), are neither liable for the proper and complete transmission of these reports nor for any delay in their receipt. Any unauthorised use, disclosure, copying, distribution, or taking of any action in reliance on these reports is strictly prohibited. The views and expressions in the reports are expressions of opinion and are given in good faith, but are subject to change without notice. These reports may not be reproduced in whole or in part or passed to third parties without permission. The information herein was obtained from various sources. ESN, its Members and their affiliates (and any director, officer or employee thereof) do not guarantee their accuracy or completeness, and neither ESN, nor its Members, nor its Members’ affiliates (nor any director, officer or employee thereof) shall be liable in respect of any errors or omissions or for any losses or consequential losses arising from such errors or omissions. Neither the information contained in these reports nor any opinion expressed constitutes an offer, or an invitation to make an offer, to buy or sell any securities or any options, futures or other derivatives related to such securities (‘related investments’). These reports are prepared for the clients of the Members of ESN only. They do not have regard to the specific investment objectives, financial situation and the particular needs of any specific person who may receive any of these reports. Investors should seek financial advice regarding the appropriateness of investing in any securities or investment strategies discussed or recommended in these reports and should understand that statements regarding future prospects may not be realised. Investors should note that income from such securities, if any, may fluctuate and that each security’s price or value may rise or fall. Accordingly, investors may receive back less than originally invested. Past performance is not necessarily a guide to future performance. Foreign currency rates of exchange may adversely affect the value, price or income of any security or related investment mentioned in these reports. In addition, investors in securities such as ADRs, whose value are influenced by the currency of the underlying security, effectively assume currency risk. ESN, its Members and their affiliates may submit a pre-publication draft (without mentioning neither the recommendation nor the target price/fair value) of its reports for review to the Investor Relations Department of the issuer forming the subject of the report, solely for the purpose of correcting any inadvertent material inaccuracies. Like all members employees, analysts receive compensation that is impacted by overall firm profitability For further details about the analyst certification, the specific risks of the company and about the valuation methods used to determine the price targets included in this report/note, please refer to the specific disclaimer pages prepared by the ESN Members. In the case of a short note please refer to the latest relevant published research on single stock or contact the analyst named on the front of the report/note for detailed information on the valuation methods, earning estimates and risks. A full description of all the organisational and administrative measures taken by the Members of ESN to manage interest and conflicts of interest are available on the website of the Members or in the local disclaimer of the Members or contacting directly the Members. Research is available through the ESN Members sales representative. ESN will provide periodic updates on companies or sectors based on company-specific developments or announcements, market conditions or any other publicly available information. Unless agreed in writing with an ESN Member, this research is intended solely for internal use by the recipient. Neither this document nor any copy of it may be taken or transmitted into Australia, Canada or Japan or distributed, directly or indirectly, in Australia, Canada or Japan or to any resident thereof. This document is for distribution in the U.K. Only to persons who have professional experience in matters relating to investments and fall within article 19(5) of the financial services and markets act 2000 (financial promotion) order 2005 (the “order”) or (ii) are persons falling within article 49(2)(a) to (d) of the order, namely high net worth companies, unincorporated associations etc. (all such persons together being referred to as “relevant persons”). This document must not be acted on or relied upon by persons who are not relevant persons. Any investment or investment activity to which this document relates is available only to relevant persons and will be engaged in only with relevant persons. The distribution of this document in other jurisdictions or to residents of other jurisdictions may also be restricted by law, and persons into whose possession this document comes should inform themselves about, and observe, any such restrictions. By accepting this report you agree to be bound by the foregoing instructions. You shall indemnify ESN, its Members and their affiliates (and any director, officer or employee thereof) against any damages, claims, losses, and detriments resulting from or in connection with the unauthorized use of this document. For disclosure upon “conflicts of interest” on the companies under coverage by all the ESN Members, on the “interests” and “conflicts” of the analysts and on each “company recommendation history”, please visit the ESN website (http://www.esnpartnership.eu/research_and_database_access/insite)
or refer to the local disclaimer of the Members, or contact directly the Member www.bancaakros.it regulated by the CONSOB - Commissione Nazionale per le Società e la Borsa
www.caixabi.pt regulated by the CMVM - Comissão do Mercado de Valores Mobiliários
www.cmcicms.com regulated by the AMF - Autorité des marchés financiers
www.equinet-ag.de regulated by the BaFin - Bundesanstalt für Finanzdienstleistungsaufsicht
www.ibg.gr regulated by the HCMC - Hellenic Capital Market Commission
www.nibc.com regulated by the AFM - Autoriteit Financiële Markten
www.op.fi regulated by the Financial Supervision Authority
www.valores.gvcgaesco.es regulated by CNMV - Comisión Nacional del Mercado de Valores
Members of ESN (European Securities Network LLP)
Banca Akros S.p.A. Viale Eginardo, 29 20149 MILANO Italy Phone: +39 02 43 444 389 Fax: +39 02 43 444 302
GVC Gaesco Beka, SV, SA C/ Marques de Villamagna 3 28001 Madrid Spain
Phone: +34 91 436 7813
Caixa-Banco de Investimento Avenida João XXI, 63 1000-300 Lisboa Portugal Phone: +351 21 313 73 00 Fax: +351 21 389 68 98
CM - CIC Market Solutions 6, avenue de Provence 75441 Paris Cedex 09 France
Phone: +33 1 53 48 81 93
equinet Bank AG Gräfstraße 97 60487 Frankfurt am Main Germany Phone:+49 69 – 58997 – 212 Fax:+49 69 – 58997 – 299
OP Corporate Bank plc P.O.Box 308 Teollisuuskatu 1, 00013 Helsinki Finland Phone: +358 10 252 011 Fax: +358 10 252 2703
NIBC Bank N.V. Gustav Mahlerlaan 348 P.O.Box 235 1082 ME Amsterdam The Netherlands Phone: +31 20 550 8500 Fax: +31 20 626 8064
Investment Bank of Greece 32 Aigialeias Str & Paradissou, 151 25 Maroussi, Greece
Phone: +30 210 81 73 383