esgデータブック - marui...t 0 0.02 0.01 0.21 nox 排出量 nox emissions グループ group t...
TRANSCRIPT
最終更新日:2019年6月29日
データ範囲:丸井グループ連結(単体を使用する場合バウンダリに記載)
2019年3月期 データレビュー
環境
気候変動
GHG排出量
・今期のGHG排出量は51万1267t-CO2となり5期連続で減少し、前期比97%
・Scope3は体験・ECを基軸としたビジネス転換により、生産に伴う排出量が削減され1.2万t-CO2減少し、前期比97%
・排出係数の低い電力会社の選定および省エネの推進によりScope1+2も1,763t-CO2減少し、前期比98%
エネルギー使用量
・店舗の閉鎖および省エネの推進によりエネルギーの約8割を占める電力量が減少し、前期比98%
・2018年9月より再生可能エネルギーの導入を開始し、21,837GJ導入(電力に占める再生可能エネルギー構成約1%)
今後、2019年度20%、2025年度70%、2030年度100%の導入を目指す。
エネルギーコスト
・世の中総体のエネルギー調整費の高騰などにより、一般電力単価が上昇し、前期に対し約2.7億円増加
再生可能エネルギー導入トライアルは1店舗で約半年の為、ほぼ影響は受けず。
資源と廃棄物
廃棄物排出量
・廃棄物総排出量は1万4419トン(前期比99%)となり、2期連続して減少
廃棄物分別の徹底及び廃棄ルールの強化により、リサイクル量が増加し、リサイクル率は2P上昇し59%
・食品廃棄物総排出量は、食品カテゴリーの拡大に伴い14%増加し、2,550トン。全体の排出量の約18%の構成
・プラスチック廃棄物総排出量は1,427トン。リサイクル率68%(前期比+3P)により
最終処分量は31トン減少し475トン
サプライチェーン(CSR調達)
現地ミーティング実施済お取引先さま数
・2019年3月期、新たなお取引さまとの現地ミーティングを12社、累計69社実施
これによりプライベートブランドにおける現地ミーティングは100%完了
・改善アドバイス項目数は11社全51項目。主に消防設備など労働環境の整備および安心・安全な商品の供給について。
法令・人権・公正な取引に抵触する改善依頼項目はございませんでした。
グリーンボンド期中報告
グリーンボンド充当合計金額
・2018年10月発行グリーンボンドの2019年3月期 充当金額は3.5億円。再充当額9.8億を加味し、残高86億円
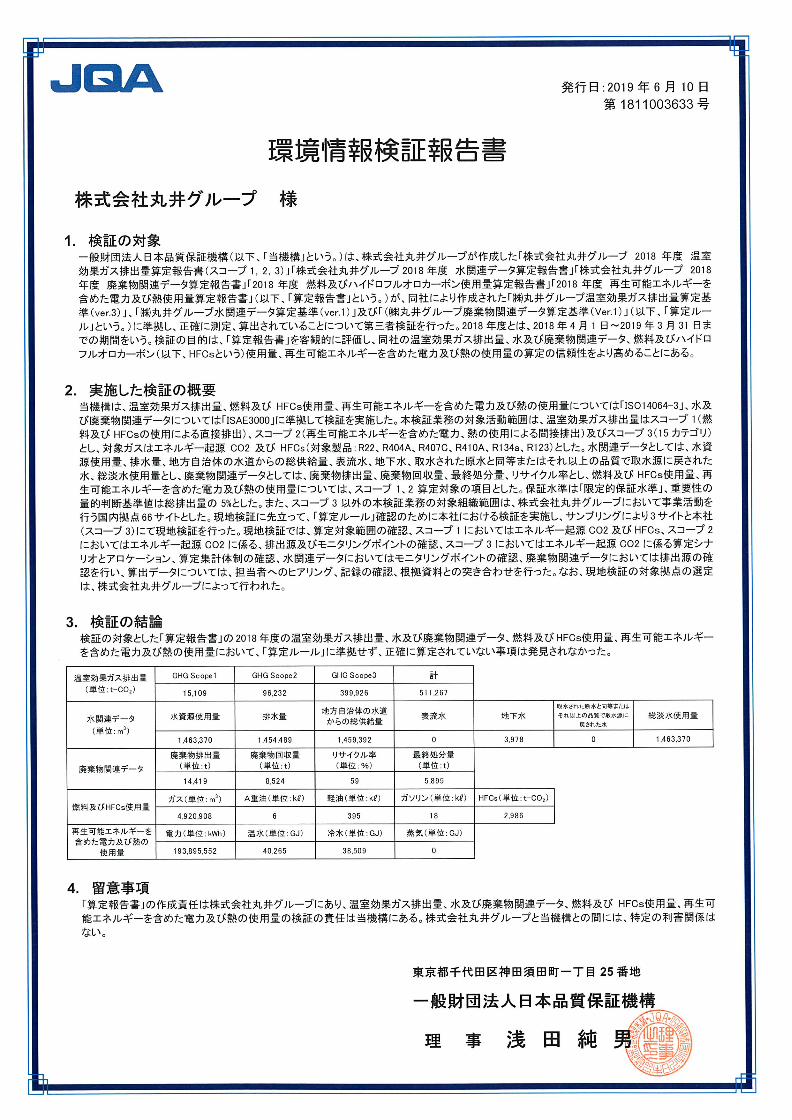
第三者検証
・GHG排出量/廃棄物排出量/水資源使用量など14項目のデータは外部の第三者である一般財団法人
日本品質保証機構(JQA)さまより検証を受けています。
株式会社丸井グループ
ESGデータブック
最終更新日:2019年6月29日
データ範囲:丸井グループ連結(単体を使用する場合バウンダリに記載)
2019年3月期 データレビュー
社会
社員
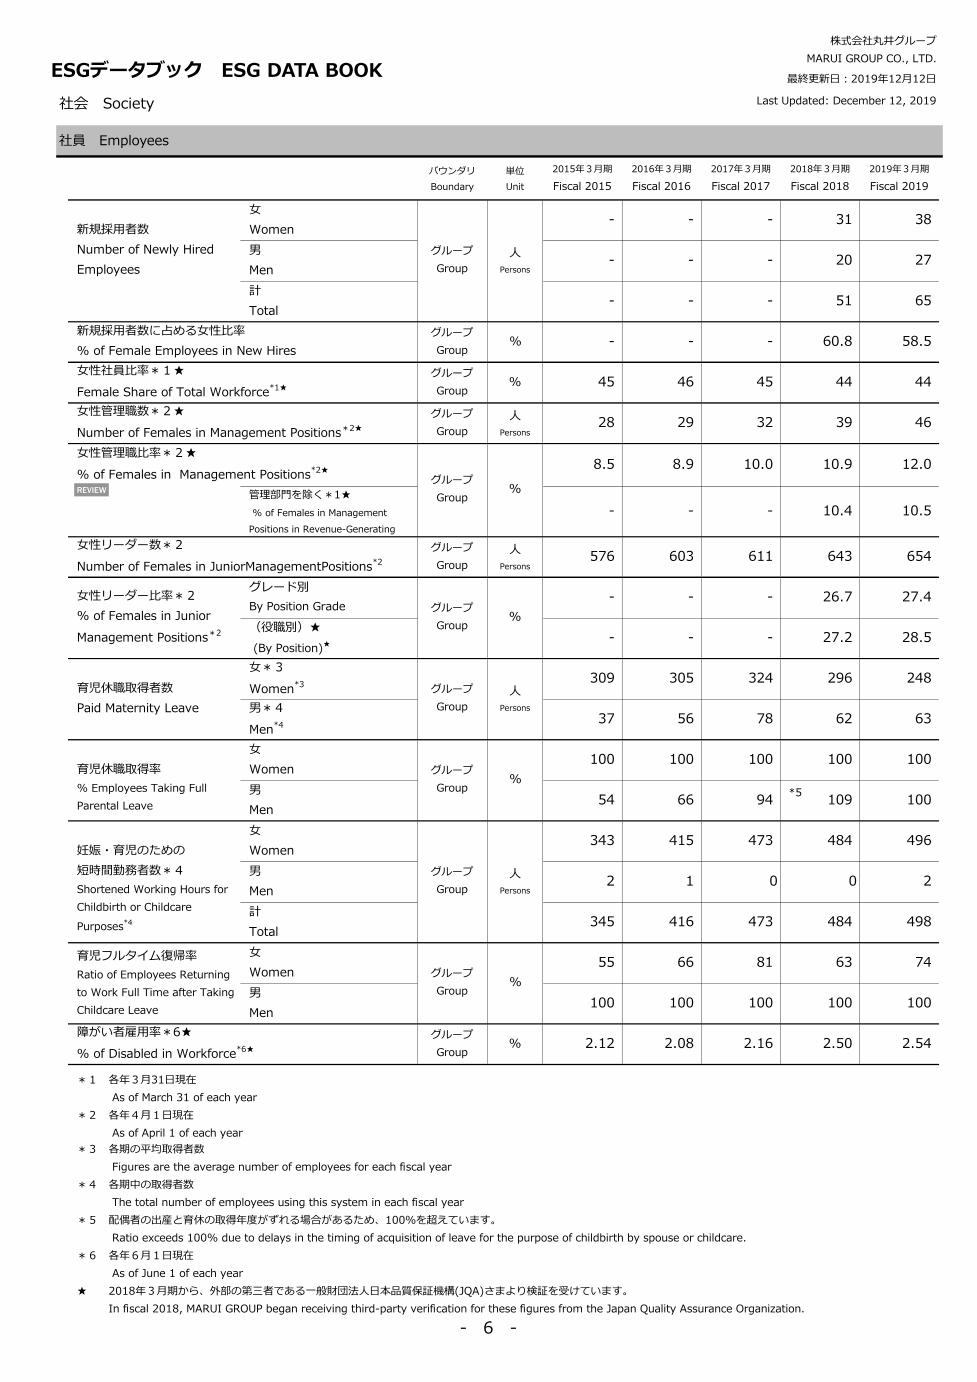
女性管理職比率
・2016年4月施行の「女性活躍推進法」を踏まえ、女性活躍推進に向けた行動計画を策定
2021年3月期までに女性管理職比率17%以上を目標に掲げ、取り組みを推進。2019年3月期は12%と4期連続向上
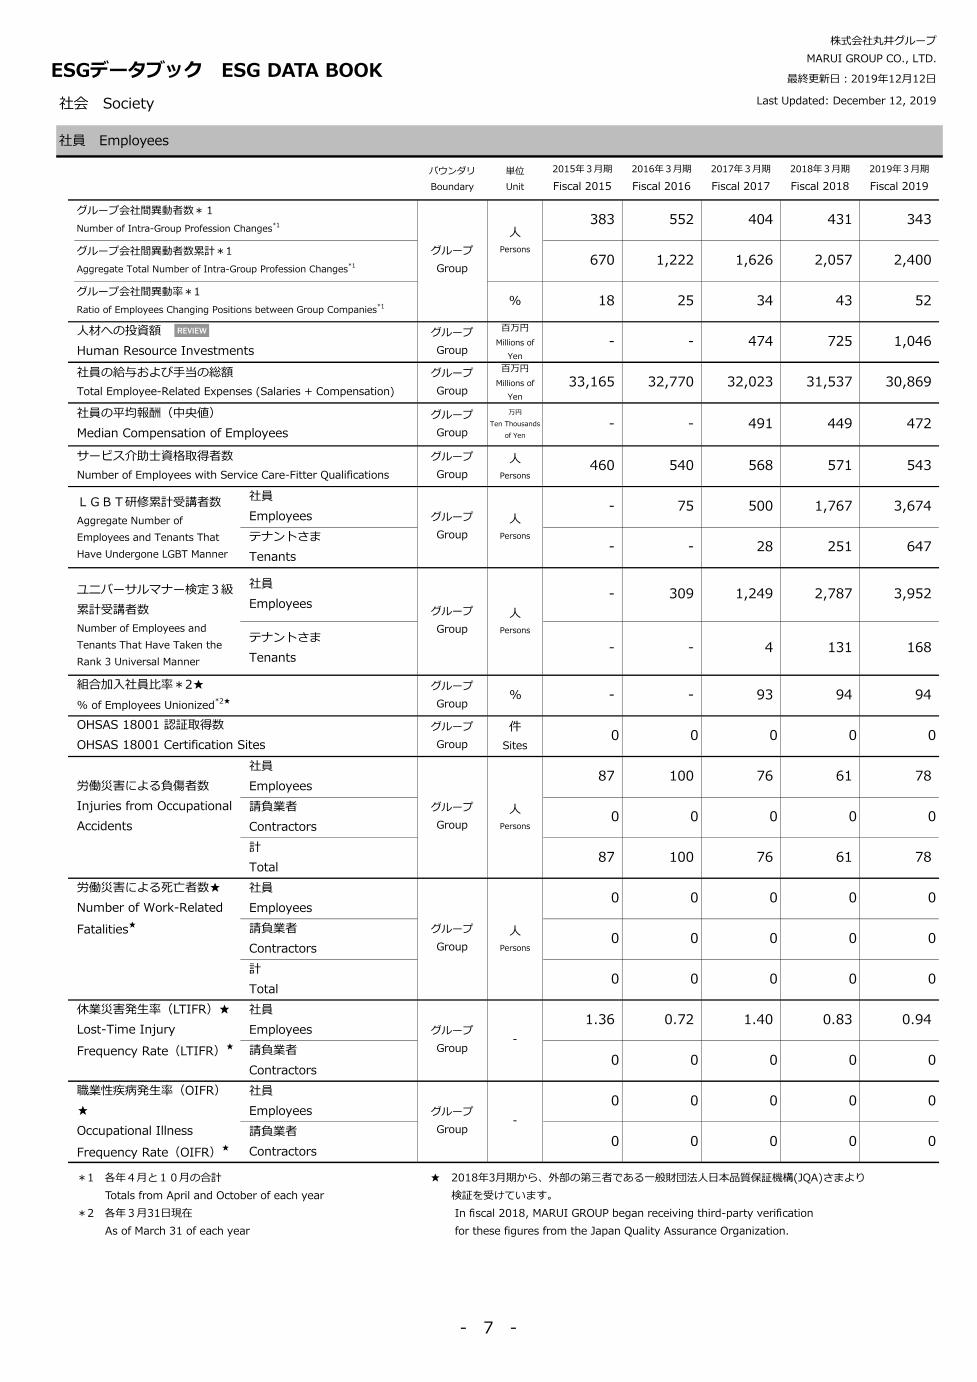
人材への投資額
・人材育成が新たな成長の重要基盤ととらえ、次世代育成プログラムおよび自ら手を挙げ参加する研修・会議等
を推進したことにより3.2億円増加。全社員の約8割にあたる累計4,743 名の社員が自ら手を挙げ参画
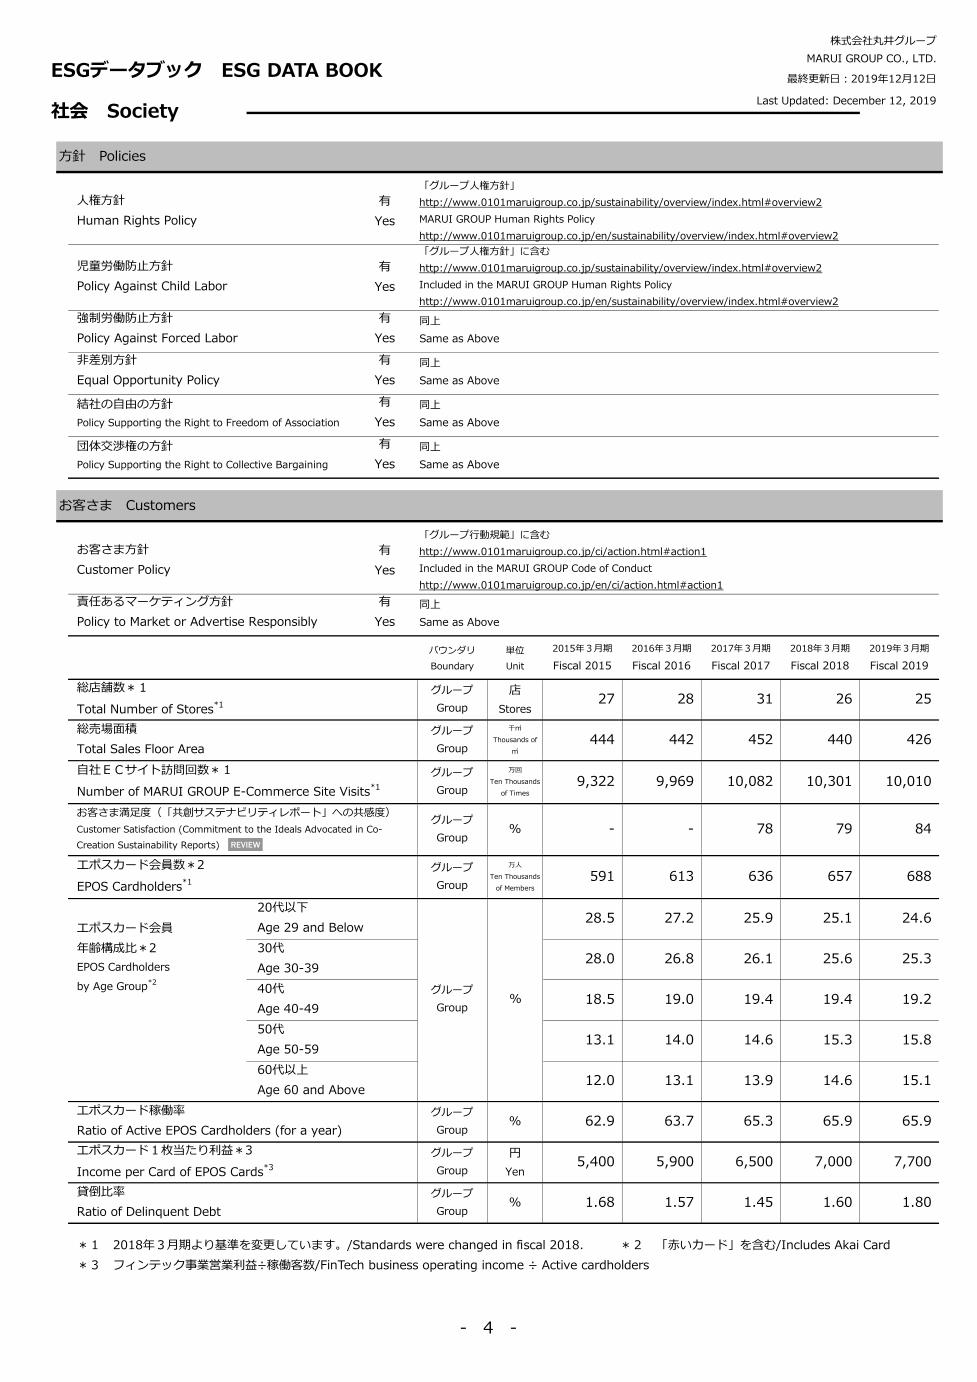
お客さま満足度
・共創サステナビリティレポート発行後、エポスカード会員にメールアンケートにて共感度を5段階で計測
「とても共感する」「共感する」の合計は84%となり前期比5ポイント上昇
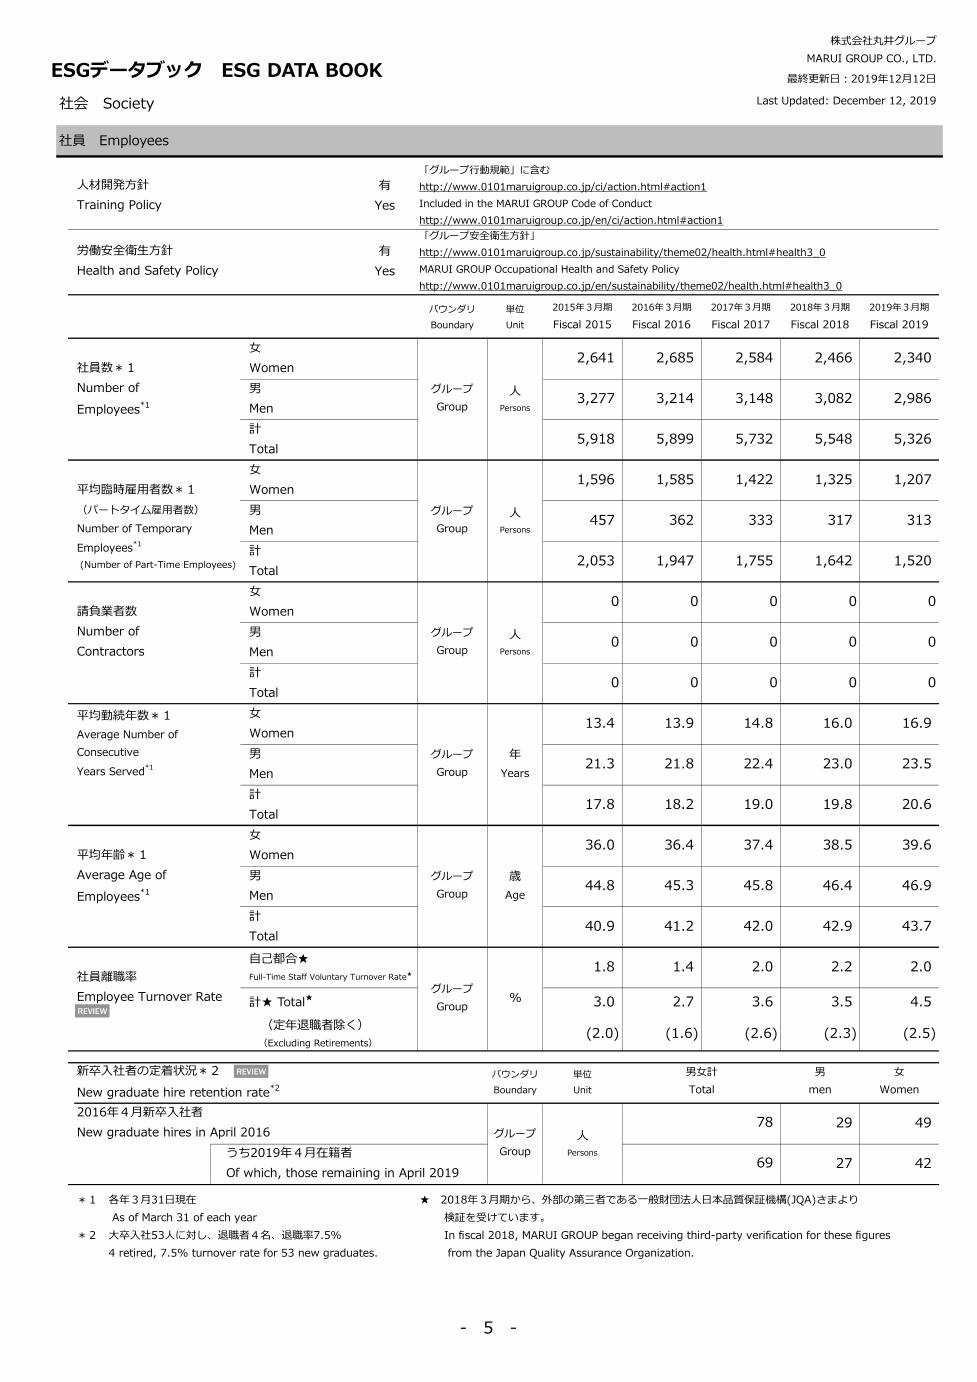
社員離職率
・定年退職者を含めない社員離職率は2.5%と前期比0.2ポイント上昇。
・新卒入社者の定着状況(3年定着率)は2016年4月入社78名に対し2019年4月在籍者69名。定着率88.4%
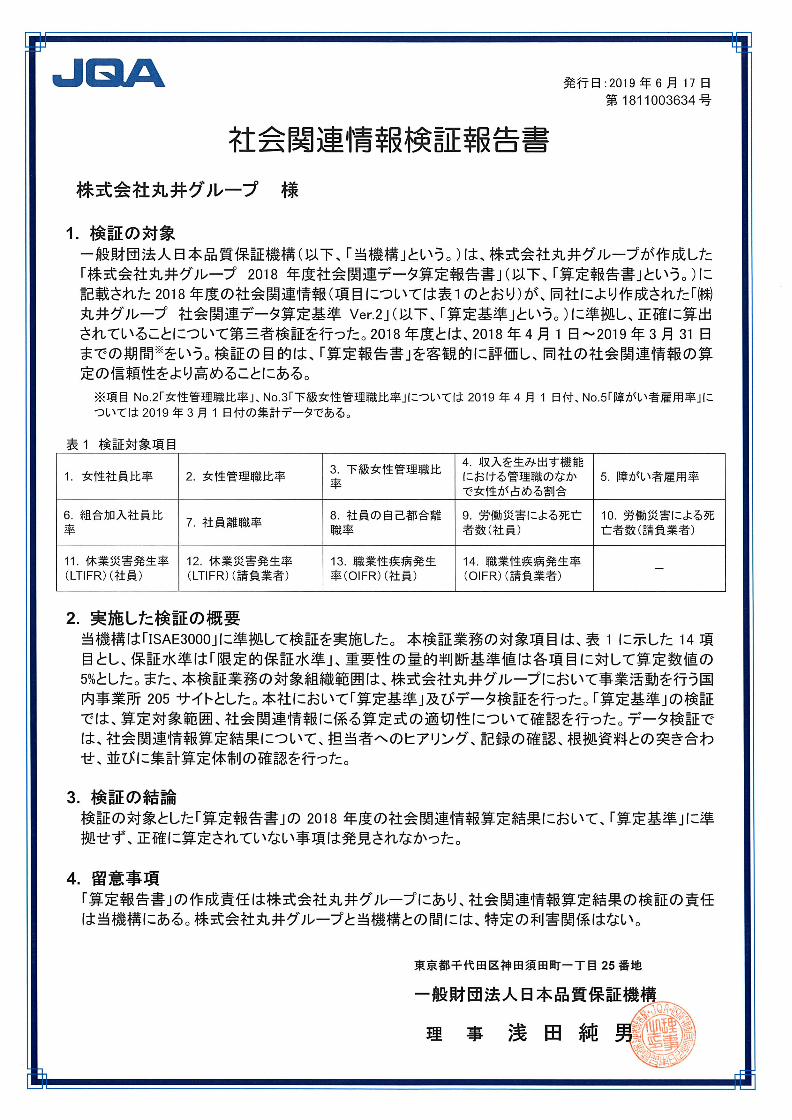
第三者検証
・社員離職率、休業災害発生率(LTIFR)、職業性疾病発生率(OIFR)など14項目のデータは
外部の第三者である一般財団法人日本品質保証機構(JQA)さまより検証を受けています。
ガバナンス
コンプライアンス
役員報酬・クローバック制度等
・役員報酬と株式価値との連動性をより明確にし、中長期的な企業価値向上へ向け、中長期インセンティブの割合を高め、
ESG関連の評価指標を導入する新たな役員報酬制度へ改定。対象取締役等に重大な不正・違反行為等が発生した場合、
当該対象取締役等に対し、交付予定株式の受益権の没収(マルス)、交付した株式等相当の金銭の返還請求(クローバック)
ができる制度を設定。
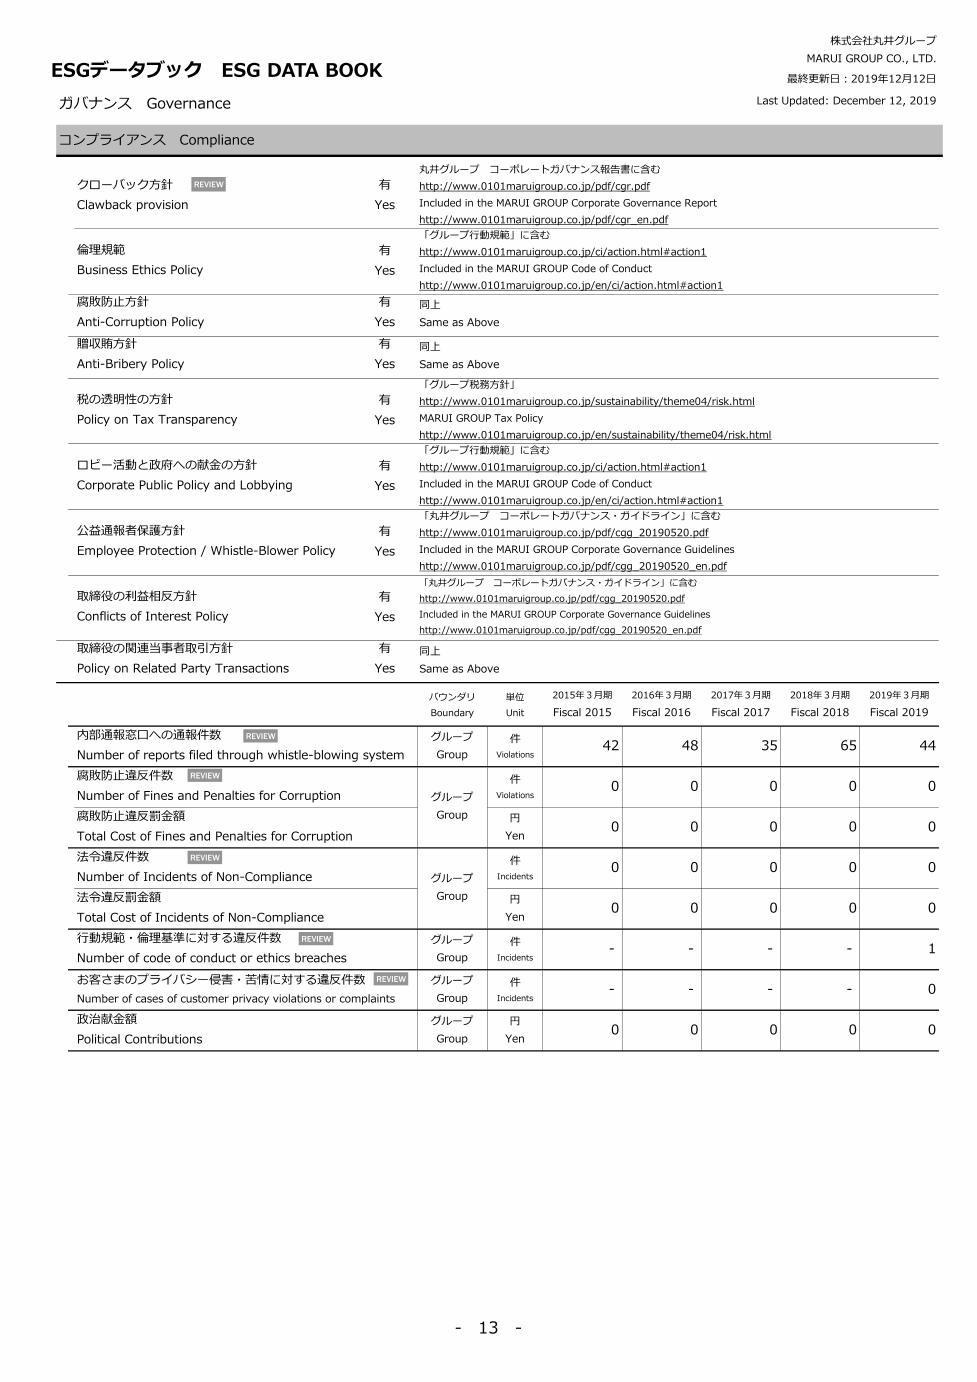
内部通報窓口への通報件数 44件(前期65件)
・組織的または個人的な法令違反行為や不正行為等の抑制と是正を図ることを目的に、社員に限定せず
お取引先さまも含めた、丸井グループホットライン(内部通報制度)を設置。当制度は社内規定に基づき運用し、
通報窓口を丸井グループ監査部および社外の弁護士事務所に設け、通報者に対し不利益な取扱いを行わない規定を制定
2019年3月期 44件を受付。法令違反や不正の通報はなく、通報者保護を前提に調査を実施し対応しております。
腐敗防止違反件数 0件(前期同様) 行動規範違反件数 1件(前期0件)
法令違反件数 0件(前期同様) お客さまのプライバシー侵害・苦情件数 0件
株式会社丸井グループ
ESGデータブック

最終更新日:2019年12月12日
気候変動 Climate Change
有
Yes
バウンダリ
Boundary
単位
Unit
2015年3月期
Fiscal 2015
2016年3月期
Fiscal 2016
2017年3月期
Fiscal 2017
2018年3月期
Fiscal 2018
2019年3月期
Fiscal 2019
12,580 14,434 14,920 13,818 15,109
98,637 89,179 103,264 99,286 96,232
530,595 509,070 489,439 412,256 399,926
641,811 612,683 607,623 525,360 511,267
12,580 12,382 12,418 12,445 12,123
98,637 89,179 103,264 99,286 96,232
111,216 101,561 115,682 111,731 108,355
グループ
Group- 22.9 20.7 19.4 14.9 12.4
- - 1,087 962 2,247
- - 1,415 411 739
- - 2,502 1,373 2,986
グループ
Group
型数
Items1 1 9 29 81
GJ 2,004,392 1,964,100 1,995,137 1,989,179 1,933,139
(千kWh
Thousands
of kWh)
(201,042) (197,001) (200,114) (199,521) (193,896)
GJ 0 0 0 91 21,837
(千kWh
Thousands
of kWh)
0 0 0 (9) (2,190)
235,538 232,092 234,880 228,687 221,441
8,383 8,073 10,291 15,196 15,768
102,282 100,833 101,144 94,650 107,134
2,350,595 2,305,099 2,341,454 2,327,713 2,277,481
グループ
Group- 83.8 77.8 74.9 66.0 55.3
再生可能エネルギー使用量
Renewable Energy Used
CO2直接排出量
Direct CO2 Emissions
グループ
Group
グループ
Groupt-CO2
t-CO2
CO2間接排出量
Indirect CO2 Emissions
計
Total
製品カーボンフットプリント
Product Carbon Footprint
グループ
Group
CO2排出量★
CO2 Emissions★
HFC直接排出量
Direct HFC Emissions
HCFC直接排出量
Direct HCFC Emissions
計
Total
HFC・HCFC排出量★
HFC and HCFC Emisssions
★
GHG排出量原単位 (連結営業利益当たり)
GHG Emissions per Unit (Operating Income per Unit)
GJ
エネルギー使用量★
Energy Consumption★
ガス使用量
Natural Gas Used
軽油・A重油・ガソリン使用量
Diesel,Heavy Oil A and Gasoline Usage
温水・冷水使用量
Water Usage by Air-Conditioning Equipment
計
Total
電力使用量
Electricity Used
エネルギー原単位(連結営業利益当たり)
Energy Consumption per Unit (Operating Income per Unit)
株式会社丸井グループ
MARUI GROUP CO., LTD.
ESGデータブック ESG DATA BOOK
有
Yes
環境方針
Environmental Policy
「グループ環境方針」
http://www.0101maruigroup.co.jp/sustainability/theme03/environment_01.html#environment1
MARUI GROUP Environmental Policy
http://www.0101maruigroup.co.jp/en/sustainability/theme03/environment_01.html#environment1
「グループ環境方針」に含む
http://www.0101maruigroup.co.jp/sustainability/theme03/environment_01.html#environment1
Included in the MARUI GROUP Environmental Policy
http://www.0101maruigroup.co.jp/en/sustainability/theme03/environment_01.html#environment1
気候変動方針
Policy on Climate Change
GHG排出量★
GHG Emissions★
環境 Environment
Last Updated: December 12, 2019
GHG Scope 1
グループ
Groupt-CO2
GHG Scope 2
GHG Scope 3
計
Total
★ 2018年3月期から、外部の第三者である一般財団法人日本品質保証機構(JQA)さまより検証を受けています。
In fiscal 2018, MARUI GROUP began receiving third-party verification for these figures from the Japan Quality Assurance Organization.
REVIEW
REVIEW
- 1 -
最終更新日:2019年12月12日
環境 Environment Last Updated: December 12, 2019
気候変動 Climate Change
バウンダリ
Boundary
単位
Unit
2015年3月期
Fiscal 2015
2016年3月期
Fiscal 2016
2017年3月期
Fiscal 2017
2018年3月期
Fiscal 2018
2019年3月期
Fiscal 2019
グループ
Group
千kWh
Thousands
of kWh
78 387 395 386 2,574
グループ
Group
百万円
Millions of
Yen
- - 3,685 3,844 4,112
グループ
Group- - - A- A- A
グループ
Group
件
Sites0 0 0 0 0
資源と廃棄物 Resources and Waste
有
Yes
有
Yes
有
Yes
生物多様性方針
Biodiversity Policy
有
Yes
バウンダリ
Boundary
単位
Unit
2015年3月期
Fiscal 2015
2016年3月期
Fiscal 2016
2017年3月期
Fiscal 2017
2018年3月期
Fiscal 2018
2019年3月期
Fiscal 2019
単体:丸井
Non-consolidated:
MARUI
t 1,706 1,682 1,704 1,522 1,407
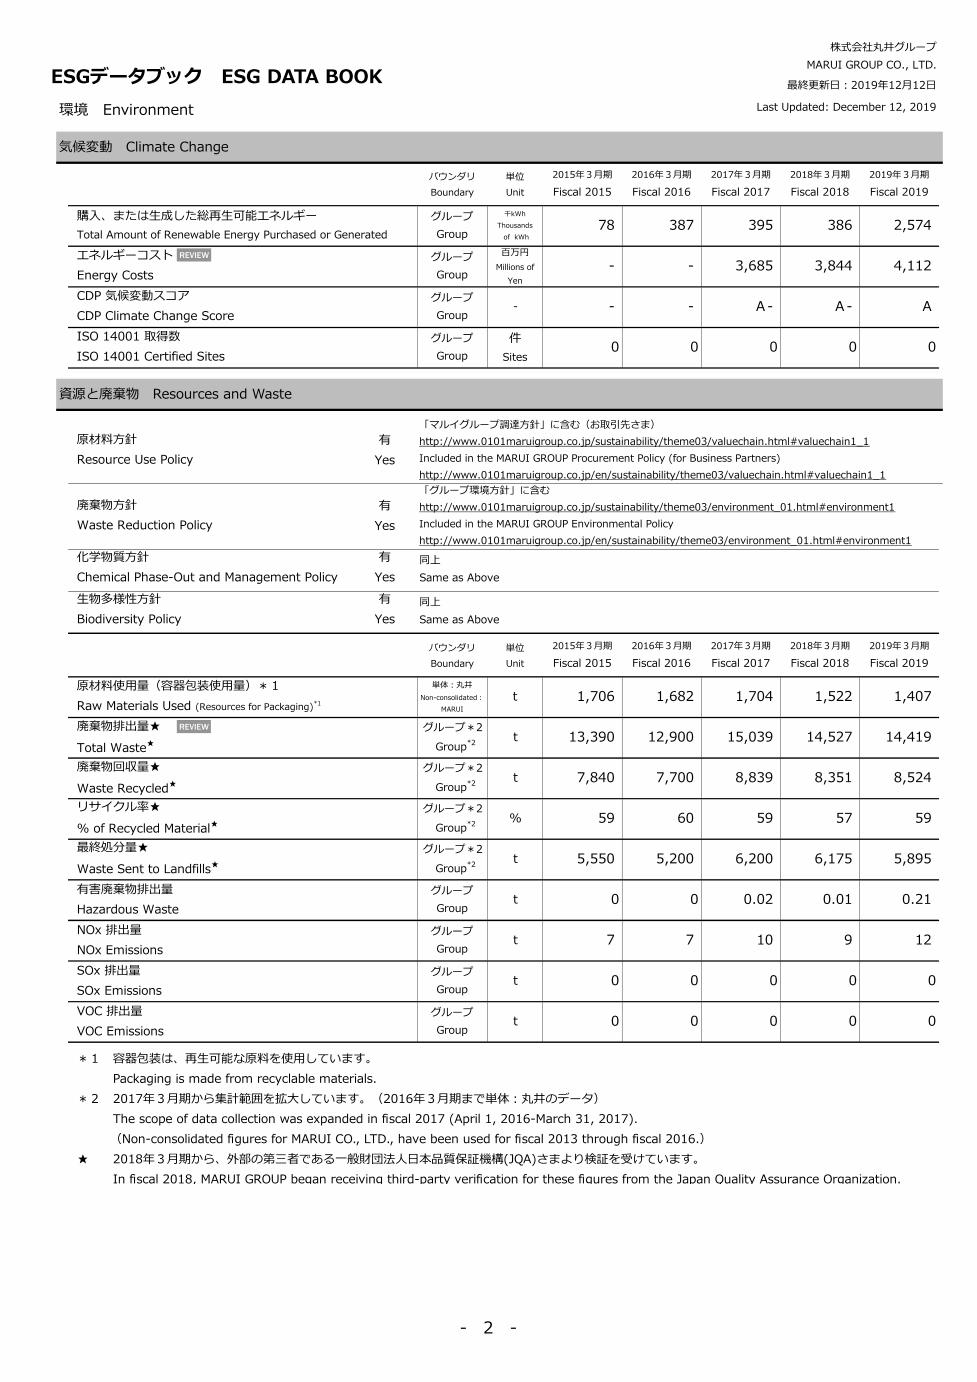
廃棄物排出量★
Total Waste★
グループ*2
Group*2t 13,390 12,900 15,039 14,527 14,419
廃棄物回収量★
Waste Recycled★
グループ*2
Group*2t 7,840 7,700 8,839 8,351 8,524
グループ*2
Group*2% 59 60 59 57 59
グループ*2
Group*2t 5,550 5,200 6,200 6,175 5,895
有害廃棄物排出量
Hazardous Waste
グループ
Groupt 0 0 0.02 0.01 0.21
NOx 排出量
NOx Emissions
グループ
Groupt 7 7 10 9 12
SOx 排出量
SOx Emissions
グループ
Groupt 0 0 0 0 0
VOC 排出量
VOC Emissions
グループ
Groupt 0 0 0 0 0
株式会社丸井グループ
MARUI GROUP CO., LTD.
同上
Same as Above
同上
Same as Above
廃棄物方針
Waste Reduction Policy
エネルギーコスト
Energy Costs
ISO 14001 取得数
ISO 14001 Certified Sites
原材料方針
Resource Use Policy
化学物質方針
Chemical Phase-Out and Management Policy
最終処分量★
Waste Sent to Landfills★
リサイクル率★
% of Recycled Material★
原材料使用量(容器包装使用量)*1
Raw Materials Used (Resources for Packaging)*1
購入、または生成した総再生可能エネルギー
Total Amount of Renewable Energy Purchased or Generated
「グループ環境方針」に含む
http://www.0101maruigroup.co.jp/sustainability/theme03/environment_01.html#environment1
Included in the MARUI GROUP Environmental Policy
http://www.0101maruigroup.co.jp/en/sustainability/theme03/environment_01.html#environment1
CDP 気候変動スコア
CDP Climate Change Score
「マルイグループ調達方針」に含む(お取引先さま)
http://www.0101maruigroup.co.jp/sustainability/theme03/valuechain.html#valuechain1_1
Included in the MARUI GROUP Procurement Policy (for Business Partners)
http://www.0101maruigroup.co.jp/en/sustainability/theme03/valuechain.html#valuechain1_1
*1 容器包装は、再生可能な原料を使用しています。
Packaging is made from recyclable materials.
*2 2017年3月期から集計範囲を拡大しています。(2016年3月期まで単体:丸井のデータ)
The scope of data collection was expanded in fiscal 2017 (April 1, 2016-March 31, 2017).
(Non-consolidated figures for MARUI CO., LTD., have been used for fiscal 2013 through fiscal 2016.)
★ 2018年3月期から、外部の第三者である一般財団法人日本品質保証機構(JQA)さまより検証を受けています。
In fiscal 2018, MARUI GROUP began receiving third-party verification for these figures from the Japan Quality Assurance Organization.
ESGデータブック ESG DATA BOOK
REVIEW
REVIEW
- 2 -
最終更新日:2019年12月12日
環境 Environment Last Updated: December 12, 2019
水 Water
有
Yes
バウンダリ
Boundary
単位
Unit
2015年3月期
Fiscal 2015
2016年3月期
Fiscal 2016
2017年3月期
Fiscal 2017
2018年3月期
Fiscal 2018
2019年3月期
Fiscal 2019
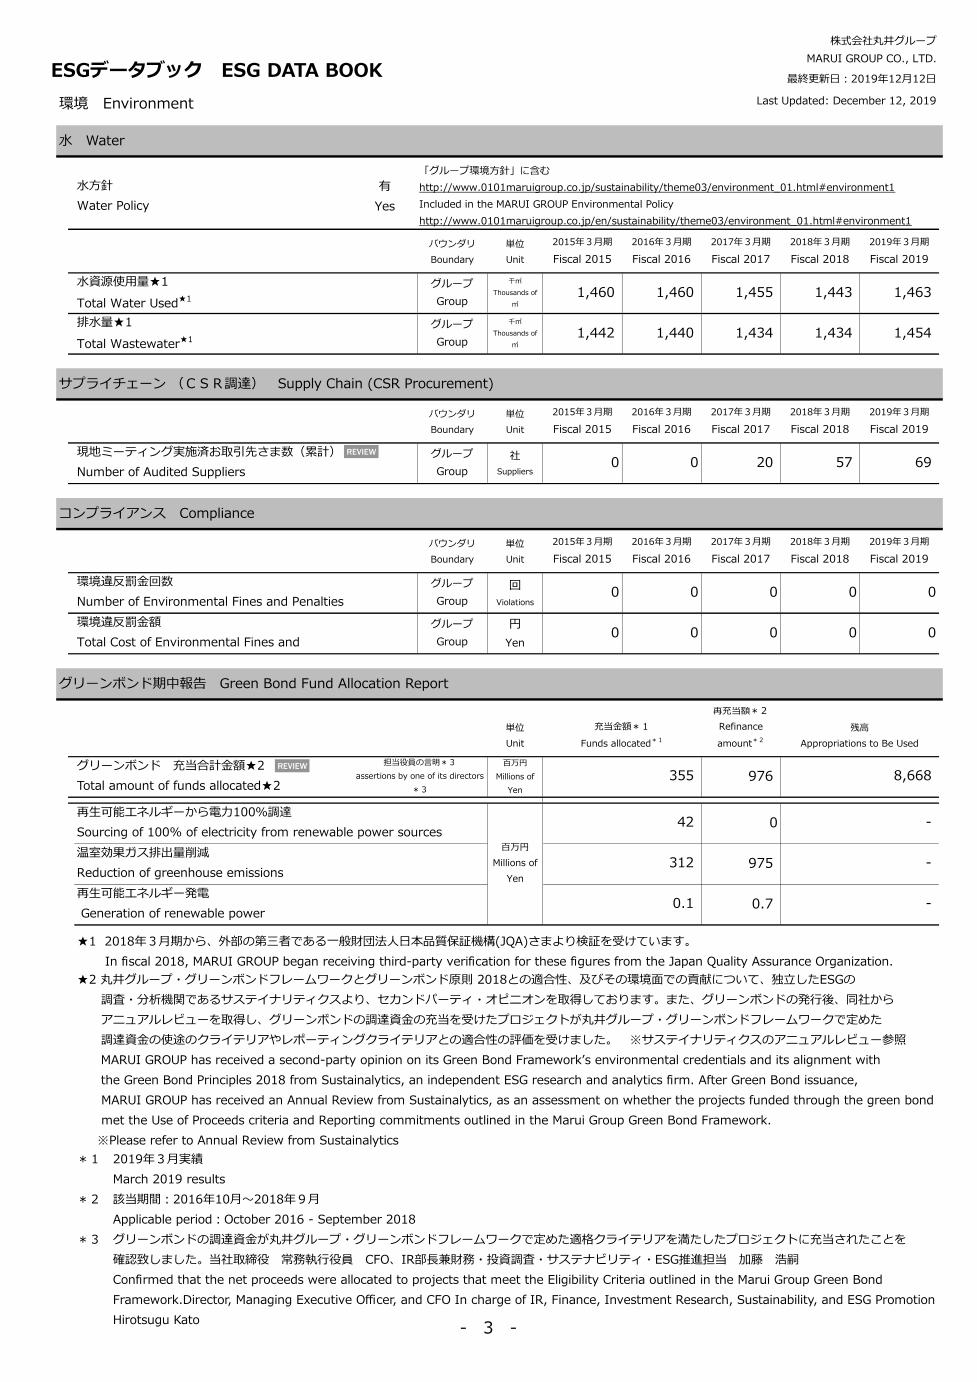
水資源使用量★1
Total Water Used★1
グループ
Group
千㎥
Thousands of
㎥
1,460 1,460 1,455 1,443 1,463
排水量★1
Total Wastewater★1
グループ
Group
千㎥
Thousands of
㎥
1,442 1,440 1,434 1,434 1,454
サプライチェーン (CSR調達) Supply Chain (CSR Procurement)
バウンダリ
Boundary
単位
Unit
2015年3月期
Fiscal 2015
2016年3月期
Fiscal 2016
2017年3月期
Fiscal 2017
2018年3月期
Fiscal 2018
2019年3月期
Fiscal 2019
グループ
Group
社
Suppliers0 0 20 57 69
コンプライアンス Compliance
バウンダリ
Boundary
単位
Unit
2015年3月期
Fiscal 2015
2016年3月期
Fiscal 2016
2017年3月期
Fiscal 2017
2018年3月期
Fiscal 2018
2019年3月期
Fiscal 2019
グループ
Group
回
Violations0 0 0 0 0
グループ
Group
円
Yen0 0 0 0 0
グリーンボンド期中報告 Green Bond Fund Allocation Report
単位
Unit
再充当額*2
Refinance
amount*2
百万円
Millions of
Yen
976
0
975
0.7
再生可能エネルギーから電力100%調達
Sourcing of 100% of electricity from renewable power sources
★2 丸井グループ・グリーンボンドフレームワークとグリーンボンド原則 2018との適合性、及びその環境面での貢献について、独立したESGの
調査・分析機関であるサステイナリティクスより、セカンドパーティ・オピニオンを取得しております。また、グリーンボンドの発行後、同社から
アニュアルレビューを取得し、グリーンボンドの調達資金の充当を受けたプロジェクトが丸井グループ・グリーンボンドフレームワークで定めた
調達資金の使途のクライテリアやレポーティングクライテリアとの適合性の評価を受けました。 ※サステイナリティクスのアニュアルレビュー参照
MARUI GROUP has received a second-party opinion on its Green Bond Framework’s environmental credentials and its alignment with
the Green Bond Principles 2018 from Sustainalytics, an independent ESG research and analytics firm. After Green Bond issuance,
MARUI GROUP has received an Annual Review from Sustainalytics, as an assessment on whether the projects funded through the green bond
met the Use of Proceeds criteria and Reporting commitments outlined in the Marui Group Green Bond Framework.
※Please refer to Annual Review from Sustainalytics
残高
Appropriations to Be Used
8,668
-
-
-
充当金額*1
Funds allocated*1
355
42
312
0.1
百万円
Millions of
Yen
グリーンボンド 充当合計金額★2
Total amount of funds allocated★2
担当役員の言明*3
assertions by one of its directors
*3
環境違反罰金額
Total Cost of Environmental Fines and
水方針
Water Policy
「グループ環境方針」に含む
http://www.0101maruigroup.co.jp/sustainability/theme03/environment_01.html#environment1
Included in the MARUI GROUP Environmental Policy
http://www.0101maruigroup.co.jp/en/sustainability/theme03/environment_01.html#environment1
現地ミーティング実施済お取引先さま数(累計)
Number of Audited Suppliers
環境違反罰金回数
Number of Environmental Fines and Penalties
株式会社丸井グループ
MARUI GROUP CO., LTD.
ESGデータブック ESG DATA BOOK
温室効果ガス排出量削減
Reduction of greenhouse emissions
再生可能エネルギー発電
Generation of renewable power
★1 2018年3月期から、外部の第三者である一般財団法人日本品質保証機構(JQA)さまより検証を受けています。
In fiscal 2018, MARUI GROUP began receiving third-party verification for these figures from the Japan Quality Assurance Organization.
*1 2019年3月実績
March 2019 results
*2 該当期間:2016年10月~2018年9月
Applicable period:October 2016 - September 2018
*3 グリーンボンドの調達資金が丸井グループ・グリーンボンドフレームワークで定めた適格クライテリアを満たしたプロジェクトに充当されたことを
確認致しました。当社取締役 常務執行役員 CFO、IR部長兼財務・投資調査・サステナビリティ・ESG推進担当 加藤 浩嗣
Confirmed that the net proceeds were allocated to projects that meet the Eligibility Criteria outlined in the Marui Group Green Bond
Framework.Director, Managing Executive Officer, and CFO In charge of IR, Finance, Investment Research, Sustainability, and ESG Promotion
Hirotsugu Kato
REVIEW
REVIEW
- 3 -
最終更新日:2019年12月12日
Last Updated: December 12, 2019
方針 Policies
有
Yes
有
Yes
有
Yes
有
Yes
有
Yes
有
Yes
お客さま Customers
有
Yes
有
Yes
バウンダリ
Boundary
単位
Unit
2015年3月期
Fiscal 2015
2016年3月期
Fiscal 2016
2017年3月期
Fiscal 2017
2018年3月期
Fiscal 2018
2019年3月期
Fiscal 2019
グループ
Group
店
Stores27 28 31 26 25
グループ
Group
千㎡
Thousands of
㎡
444 442 452 440 426
グループ
Group
万回
Ten Thousands
of Times
9,322 9,969 10,082 10,301 10,010
グループ
Group% - - 78 79 84
グループ
Group
万人
Ten Thousands
of Members
591 613 636 657 688
28.5 27.2 25.9 25.1 24.6
28.0 26.8 26.1 25.6 25.3
18.5 19.0 19.4 19.4 19.2
13.1 14.0 14.6 15.3 15.8
12.0 13.1 13.9 14.6 15.1
グループ
Group% 62.9 63.7 65.3 65.9 65.9
グループ
Group
円
Yen5,400 5,900 6,500 7,000 7,700
グループ
Group% 1.68 1.57 1.45 1.60 1.80
50代
Age 50-59
60代以上
Age 60 and Above
エポスカード稼働率
Ratio of Active EPOS Cardholders (for a year)
エポスカード1枚当たり利益*3
Income per Card of EPOS Cards*3
貸倒比率
Ratio of Delinquent Debt
同上
Same as Above
責任あるマーケティング方針
Policy to Market or Advertise Responsibly
40代
Age 40-49
非差別方針
Equal Opportunity Policy
強制労働防止方針
Policy Against Forced Labor
児童労働防止方針
Policy Against Child Labor
同上
Same as Above
同上
Same as Above
「グループ人権方針」に含む
http://www.0101maruigroup.co.jp/sustainability/overview/index.html#overview2
Included in the MARUI GROUP Human Rights Policy
http://www.0101maruigroup.co.jp/en/sustainability/overview/index.html#overview2
人権方針
Human Rights Policy
「グループ人権方針」
http://www.0101maruigroup.co.jp/sustainability/overview/index.html#overview2
MARUI GROUP Human Rights Policy
http://www.0101maruigroup.co.jp/en/sustainability/overview/index.html#overview2
株式会社丸井グループ
MARUI GROUP CO., LTD.
社会 Society
エポスカード会員
年齢構成比*2
EPOS Cardholders
by Age Group*2
お客さま満足度(「共創サステナビリティレポート」への共感度)
Customer Satisfaction (Commitment to the Ideals Advocated in Co-
Creation Sustainability Reports)
団体交渉権の方針
Policy Supporting the Right to Collective Bargaining
「グループ行動規範」に含む
http://www.0101maruigroup.co.jp/ci/action.html#action1
Included in the MARUI GROUP Code of Conduct
http://www.0101maruigroup.co.jp/en/ci/action.html#action1
同上
Same as Above
総店舗数*1
Total Number of Stores*1
お客さま方針
Customer Policy
同上
Same as Above
総売場面積
Total Sales Floor Area
20代以下
Age 29 and Below
グループ
Group%
30代
Age 30-39
結社の自由の方針
Policy Supporting the Right to Freedom of Association
*1 2018年3月期より基準を変更しています。/Standards were changed in fiscal 2018. *2 「赤いカード」を含む/Includes Akai Card
*3 フィンテック事業営業利益÷稼働客数/FinTech business operating income ÷ Active cardholders
エポスカード会員数*2
EPOS Cardholders*1
自社ECサイト訪問回数*1
Number of MARUI GROUP E-Commerce Site Visits*1
ESGデータブック ESG DATA BOOK
REVIEW
- 4 -
最終更新日:2019年12月12日
社会 Society Last Updated: December 12, 2019
社員 Employees
有
Yes
有
Yes
バウンダリ
Boundary
単位
Unit
2015年3月期
Fiscal 2015
2016年3月期
Fiscal 2016
2017年3月期
Fiscal 2017
2018年3月期
Fiscal 2018
2019年3月期
Fiscal 2019
女
Women2,641 2,685 2,584 2,466 2,340
男
Men3,277 3,214 3,148 3,082 2,986
計
Total5,918 5,899 5,732 5,548 5,326
女
Women1,596 1,585 1,422 1,325 1,207
男
Men457 362 333 317 313
計
Total2,053 1,947 1,755 1,642 1,520
女
Women0 0 0 0 0
男
Men0 0 0 0 0
計
Total0 0 0 0 0
女
Women13.4 13.9 14.8 16.0 16.9
男
Men21.3 21.8 22.4 23.0 23.5
計
Total17.8 18.2 19.0 19.8 20.6
女
Women36.0 36.4 37.4 38.5 39.6
男
Men44.8 45.3 45.8 46.4 46.9
計
Total40.9 41.2 42.0 42.9 43.7
1.8 1.4 2.0 2.2 2.0
3.0 2.7 3.6 3.5 4.5
(2.0) (1.6) (2.6) (2.3) (2.5)
バウンダリ
Boundary
単位
Unit
男女計
Total
男
men
女
Women
29 49
27 42
株式会社丸井グループ
MARUI GROUP CO., LTD.
平均臨時雇用者数*1
(パートタイム雇用者数)
Number of Temporary
Employees*1
(Number of Part-Time Employees)
グループ
Group
人
Persons
人
Persons
グループ
Group
グループ
Group
平均勤続年数*1
Average Number of
Consecutive
Years Served*1
78
69
★ 2018年3月期から、外部の第三者である一般財団法人日本品質保証機構(JQA)さまより
検証を受けています。
In fiscal 2018, MARUI GROUP began receiving third-party verification for these figures
from the Japan Quality Assurance Organization.
%計★ Total★
(定年退職者除く)
(Excluding Retirements)
人
Persons
グループ
Group
年
Years
グループ
Group
歳
Age
新卒入社者の定着状況*2
New graduate hire retention rate*2
2016年4月新卒入社者
New graduate hires in April 2016
請負業者数
Number of
Contractors
平均年齢*1
Average Age of
Employees*1
うち2019年4月在籍者
Of which, those remaining in April 2019
*1 各年3月31日現在
As of March 31 of each year
*2 大卒入社53人に対し、退職者4名、退職率7.5%
4 retired, 7.5% turnover rate for 53 new graduates.
グループ
Group
人
Persons
社員離職率
Employee Turnover Rate
自己都合★
Full-Time Staff Voluntary Turnover Rate★
グループ
Group
社員数*1
Number of
Employees*1
労働安全衛生方針
Health and Safety Policy
人材開発方針
Training Policy
「グループ行動規範」に含む
http://www.0101maruigroup.co.jp/ci/action.html#action1
Included in the MARUI GROUP Code of Conduct
http://www.0101maruigroup.co.jp/en/ci/action.html#action1
「グループ安全衛生方針」
http://www.0101maruigroup.co.jp/sustainability/theme02/health.html#health3_0
MARUI GROUP Occupational Health and Safety Policy
http://www.0101maruigroup.co.jp/en/sustainability/theme02/health.html#health3_0
ESGデータブック ESG DATA BOOK
REVIEW
REVIEW
- 5 -
最終更新日:2019年12月12日
社会 Society Last Updated: December 12, 2019
社員 Employees
バウンダリ
Boundary
単位
Unit
2015年3月期
Fiscal 2015
2016年3月期
Fiscal 2016
2017年3月期
Fiscal 2017
2018年3月期
Fiscal 2018
2019年3月期
Fiscal 2019
女
Women- - - 31 38
男
Men- - - 20 27
計
Total- - - 51 65
グループ
Group% - - - 60.8 58.5
グループ
Group% 45 46 45 44 44
グループ
Group
人
Persons28 29 32 39 46
8.5 8.9 10.0 10.9 12.0
- - - 10.4 10.5
グループ
Group
人
Persons576 603 611 643 654
- - - 26.7 27.4
- - - 27.2 28.5
女*3
Women*3309 305 324 296 248
男*4
Men*437 56 78 62 63
女
Women100 100 100 100 100
男
Men54 66 94 109 100
女
Women343 415 473 484 496
男
Men2 1 0 0 2
計
Total345 416 473 484 498
女
Women55 66 81 63 74
男
Men100 100 100 100 100
グループ
Group% 2.12 2.08 2.16 2.50 2.54
人
Persons
新規採用者数
Number of Newly Hired
Employees
グループ
Group
株式会社丸井グループ
MARUI GROUP CO., LTD.
グループ
Group
人
Persons
女性管理職比率*2★
% of Females in Management Positions*2★
育児休職取得者数
Paid Maternity Leave
(役職別)★
(By Position)★
グループ
Group
女性管理職数*2★
Number of Females in Management Positions*2★
*1 各年3月31日現在
As of March 31 of each year
*2 各年4月1日現在
As of April 1 of each year
*3 各期の平均取得者数
Figures are the average number of employees for each fiscal year
*4 各期中の取得者数
The total number of employees using this system in each fiscal year
*5 配偶者の出産と育休の取得年度がずれる場合があるため、100%を超えています。
Ratio exceeds 100% due to delays in the timing of acquisition of leave for the purpose of childbirth by spouse or childcare.
*6 各年6月1日現在
As of June 1 of each year
★ 2018年3月期から、外部の第三者である一般財団法人日本品質保証機構(JQA)さまより検証を受けています。
In fiscal 2018, MARUI GROUP began receiving third-party verification for these figures from the Japan Quality Assurance Organization.
女性リーダー数*2
Number of Females in JuniorManagementPositions*2
%
女性リーダー比率*2
% of Females in Junior
Management Positions*2
%
グループ
Group
グループ
Group
人
Persons
グループ
Group
育児フルタイム復帰率
Ratio of Employees Returning
to Work Full Time after Taking
Childcare Leave
妊娠・育児のための
短時間勤務者数*4
Shortened Working Hours for
Childbirth or Childcare
Purposes*4
グレード別
By Position Grade
障がい者雇用率*6★
% of Disabled in Workforce*6★
女性社員比率*1★
Female Share of Total Workforce*1★
%
新規採用者数に占める女性比率
% of Female Employees in New Hires
育児休職取得率
% Employees Taking Full
Parental Leave
管理部門を除く*1★
% of Females in Management
Positions in Revenue-Generating
グループ
Group%
ESGデータブック ESG DATA BOOK
*5
REVIEW
- 6 -
最終更新日:2019年12月12日
社会 Society Last Updated: December 12, 2019
社員 Employees
バウンダリ
Boundary
単位
Unit
2015年3月期
Fiscal 2015
2016年3月期
Fiscal 2016
2017年3月期
Fiscal 2017
2018年3月期
Fiscal 2018
2019年3月期
Fiscal 2019
383 552 404 431 343
670 1,222 1,626 2,057 2,400
% 18 25 34 43 52
グループ
Group
百万円
Millions of
Yen
- - 474 725 1,046
グループ
Group
百万円
Millions of
Yen
33,165 32,770 32,023 31,537 30,869
グループ
Group
万円
Ten Thousands
of Yen
- - 491 449 472
グループ
Group
人
Persons460 540 568 571 543
社員
Employees- 75 500 1,767 3,674
テナントさま
Tenants- - 28 251 647
社員
Employees- 309 1,249 2,787 3,952
テナントさま
Tenants- - 4 131 168
グループ
Group% - - 93 94 94
グループ
Group
件
Sites0 0 0 0 0
社員
Employees87 100 76 61 78
請負業者
Contractors0 0 0 0 0
計
Total87 100 76 61 78
社員
Employees0 0 0 0 0
請負業者
Contractors0 0 0 0 0
計
Total0 0 0 0 0
社員
Employees1.36 0.72 1.40 0.83 0.94
請負業者
Contractors0 0 0 0 0
社員
Employees0 0 0 0 0
請負業者
Contractors0 0 0 0 0
グループ会社間異動者数*1
Number of Intra-Group Profession Changes*1
グループ
Group
グループ
Group
グループ会社間異動率*1
Ratio of Employees Changing Positions between Group Companies*1
ユニバーサルマナー検定3級
累計受講者数
Number of Employees and
Tenants That Have Taken the
Rank 3 Universal Manner
LGBT研修累計受講者数
Aggregate Number of
Employees and Tenants That
Have Undergone LGBT Manner
グループ
Group
グループ
Group
*1 各年4月と10月の合計
Totals from April and October of each year
*2 各年3月31日現在
As of March 31 of each year
★ 2018年3月期から、外部の第三者である一般財団法人日本品質保証機構(JQA)さまより
検証を受けています。
In fiscal 2018, MARUI GROUP began receiving third-party verification
for these figures from the Japan Quality Assurance Organization.
グループ
Group
-
-
人材への投資額
Human Resource Investments
組合加入社員比率*2★
% of Employees Unionized*2★
サービス介助士資格取得者数
Number of Employees with Service Care-Fitter Qualifications
社員の給与および手当の総額
Total Employee-Related Expenses (Salaries + Compensation)
人
Persons
株式会社丸井グループ
MARUI GROUP CO., LTD.
労働災害による死亡者数★
Number of Work-Related
Fatalities★
職業性疾病発生率(OIFR)
★
Occupational Illness
Frequency Rate(OIFR)★
休業災害発生率(LTIFR)★
Lost-Time Injury
Frequency Rate(LTIFR)★
労働災害による負傷者数
Injuries from Occupational
Accidents
人
Persons
人
Persons
グループ
Group
グループ
Group
人
Persons
人
Persons
社員の平均報酬(中央値)
Median Compensation of Employees
OHSAS 18001 認証取得数
OHSAS 18001 Certification Sites
グループ会社間異動者数累計*1
Aggregate Total Number of Intra-Group Profession Changes*1
ESGデータブック ESG DATA BOOK
REVIEW
- 7 -
最終更新日:2019年12月12日
社会 Society Last Updated: December 12, 2019
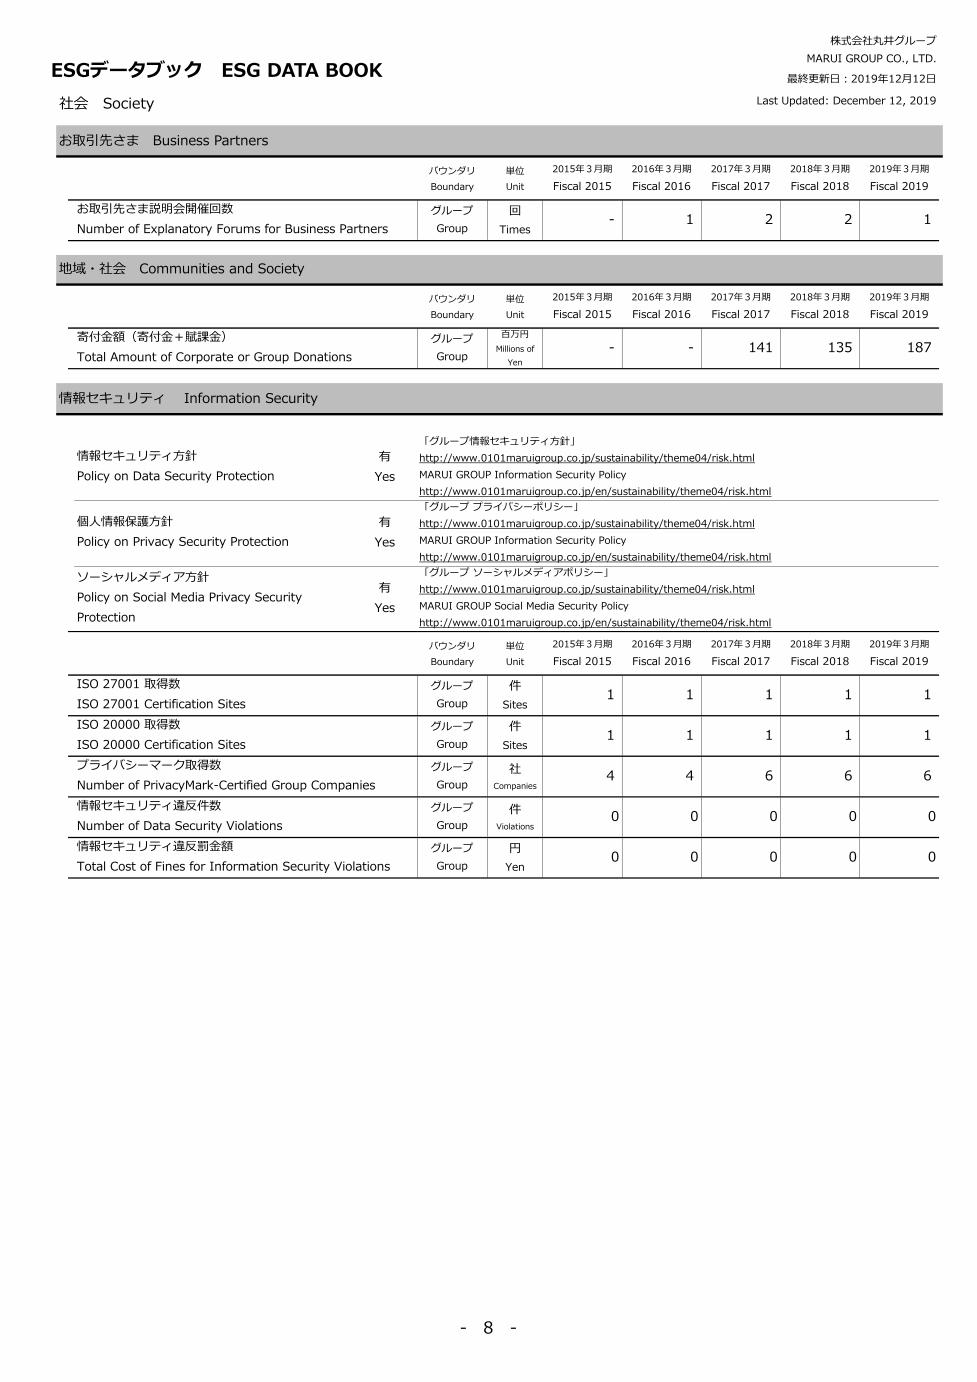
お取引先さま Business Partners
バウンダリ
Boundary
単位
Unit
2015年3月期
Fiscal 2015
2016年3月期
Fiscal 2016
2017年3月期
Fiscal 2017
2018年3月期
Fiscal 2018
2019年3月期
Fiscal 2019
グループ
Group
回
Times- 1 2 2 1
バウンダリ
Boundary
単位
Unit
2015年3月期
Fiscal 2015
2016年3月期
Fiscal 2016
2017年3月期
Fiscal 2017
2018年3月期
Fiscal 2018
2019年3月期
Fiscal 2019
グループ
Group
百万円
Millions of
Yen
- - 141 135 187
情報セキュリティ Information Security
有
Yes
有
Yes
有
Yes
バウンダリ
Boundary
単位
Unit
2015年3月期
Fiscal 2015
2016年3月期
Fiscal 2016
2017年3月期
Fiscal 2017
2018年3月期
Fiscal 2018
2019年3月期
Fiscal 2019
グループ
Group
件
Sites1 1 1 1 1
グループ
Group
件
Sites1 1 1 1 1
グループ
Group
社
Companies4 4 6 6 6
グループ
Group
件
Violations0 0 0 0 0
グループ
Group
円
Yen0 0 0 0 0
「グループ ソーシャルメディアポリシー」
http://www.0101maruigroup.co.jp/sustainability/theme04/risk.html
MARUI GROUP Social Media Security Policy
http://www.0101maruigroup.co.jp/en/sustainability/theme04/risk.html
株式会社丸井グループ
MARUI GROUP CO., LTD.
ISO 27001 取得数
ISO 27001 Certification Sites
ソーシャルメディア方針
Policy on Social Media Privacy Security
Protection
プライバシーマーク取得数
Number of PrivacyMark-Certified Group Companies
個人情報保護方針
Policy on Privacy Security Protection
「グループ プライバシーポリシー」
http://www.0101maruigroup.co.jp/sustainability/theme04/risk.html
MARUI GROUP Information Security Policy
http://www.0101maruigroup.co.jp/en/sustainability/theme04/risk.html
情報セキュリティ違反罰金額
Total Cost of Fines for Information Security Violations
情報セキュリティ違反件数
Number of Data Security Violations
お取引先さま説明会開催回数
Number of Explanatory Forums for Business Partners
地域・社会 Communities and Society
寄付金額(寄付金+賦課金)
Total Amount of Corporate or Group Donations
情報セキュリティ方針
Policy on Data Security Protection
「グループ情報セキュリティ方針」
http://www.0101maruigroup.co.jp/sustainability/theme04/risk.html
MARUI GROUP Information Security Policy
http://www.0101maruigroup.co.jp/en/sustainability/theme04/risk.html
ISO 20000 取得数
ISO 20000 Certification Sites
ESGデータブック ESG DATA BOOK
- 8 -
最終更新日:2019年12月12日
Last Updated: December 12, 2019
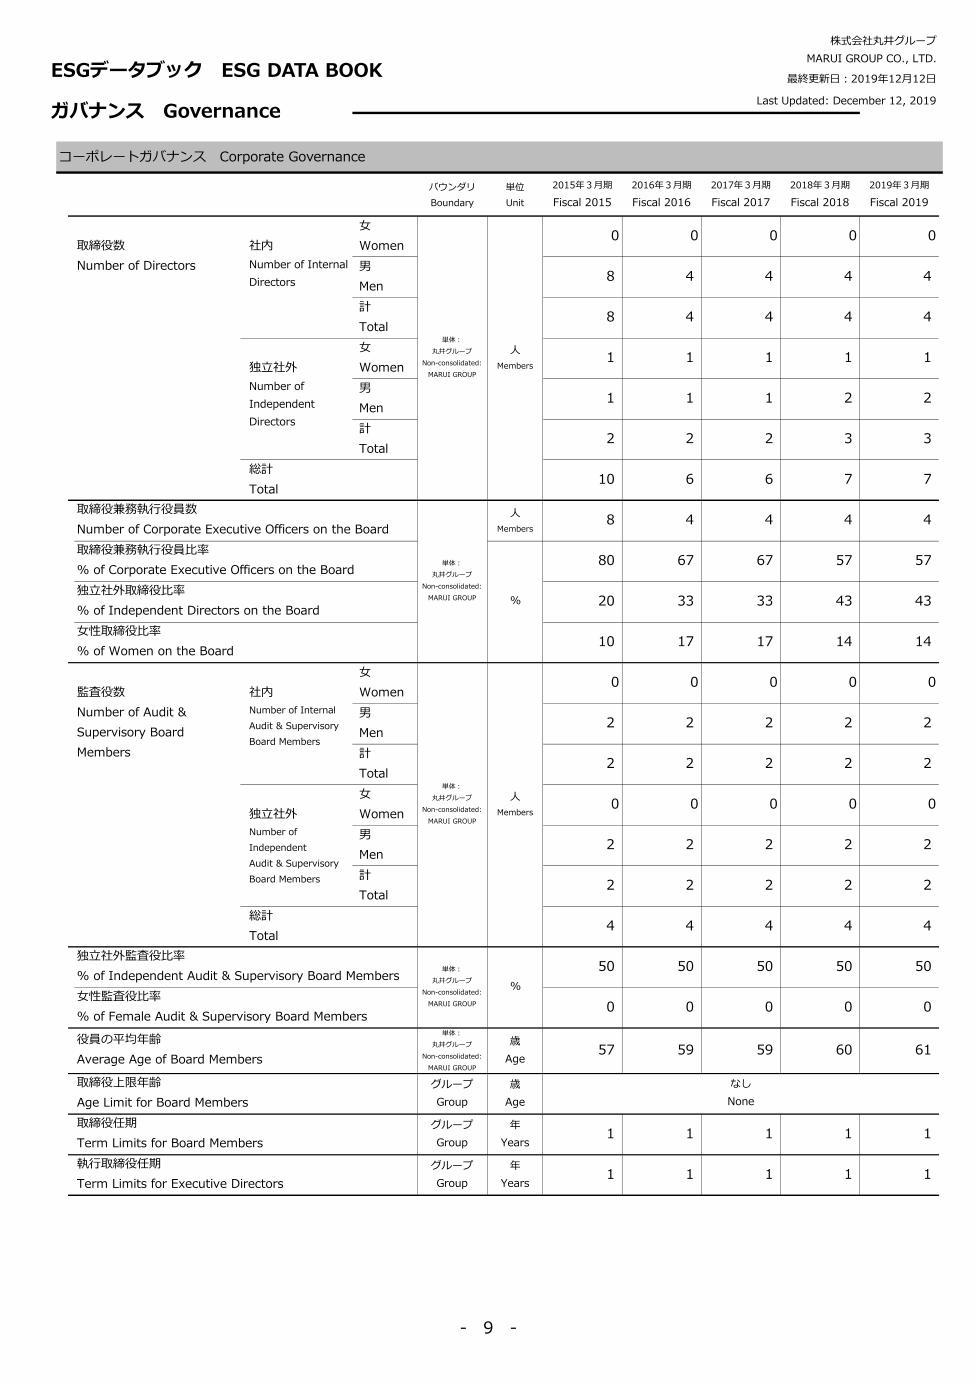
コーポレートガバナンス Corporate Governance
バウンダリ
Boundary
単位
Unit
2015年3月期
Fiscal 2015
2016年3月期
Fiscal 2016
2017年3月期
Fiscal 2017
2018年3月期
Fiscal 2018
2019年3月期
Fiscal 2019
女
Women0 0 0 0 0
男
Men8 4 4 4 4
計
Total8 4 4 4 4
女
Women1 1 1 1 1
男
Men1 1 1 2 2
計
Total2 2 2 3 3
総計
Total10 6 6 7 7
人
Members8 4 4 4 4
80 67 67 57 57
20 33 33 43 43
10 17 17 14 14
女
Women0 0 0 0 0
男
Men2 2 2 2 2
計
Total2 2 2 2 2
女
Women0 0 0 0 0
男
Men2 2 2 2 2
計
Total2 2 2 2 2
総計
Total4 4 4 4 4
50 50 50 50 50
0 0 0 0 0
単体:
丸井グループ
Non-consolidated:
MARUI GROUP
歳
Age57 59 59 60 61
グループ
Group
歳
Age
グループ
Group
年
Years1 1 1 1 1
グループ
Group
年
Years1 1 1 1 1
単体:
丸井グループ
Non-consolidated:
MARUI GROUP
女性取締役比率
% of Women on the Board
単体:
丸井グループ
Non-consolidated:
MARUI GROUP
執行取締役任期
Term Limits for Executive Directors
取締役兼務執行役員比率
% of Corporate Executive Officers on the Board
株式会社丸井グループ
MARUI GROUP CO., LTD.
なし
None
ガバナンス Governance
取締役任期
Term Limits for Board Members
%
%
取締役数
Number of Directors
社内
Number of Internal
Directors
社内
Number of Internal
Audit & Supervisory
Board Members
単体:
丸井グループ
Non-consolidated:
MARUI GROUP
人
Members独立社外
Number of
Independent
Audit & Supervisory
Board Members
女性監査役比率
% of Female Audit & Supervisory Board Members
独立社外取締役比率
% of Independent Directors on the Board
役員の平均年齢
Average Age of Board Members
監査役数
Number of Audit &
Supervisory Board
Members
取締役上限年齢
Age Limit for Board Members
単体:
丸井グループ
Non-consolidated:
MARUI GROUP
独立社外監査役比率
% of Independent Audit & Supervisory Board Members
人
Members独立社外
Number of
Independent
Directors
取締役兼務執行役員数
Number of Corporate Executive Officers on the Board
ESGデータブック ESG DATA BOOK
- 9 -
最終更新日:2019年12月12日
ガバナンス Governance Last Updated: December 12, 2019
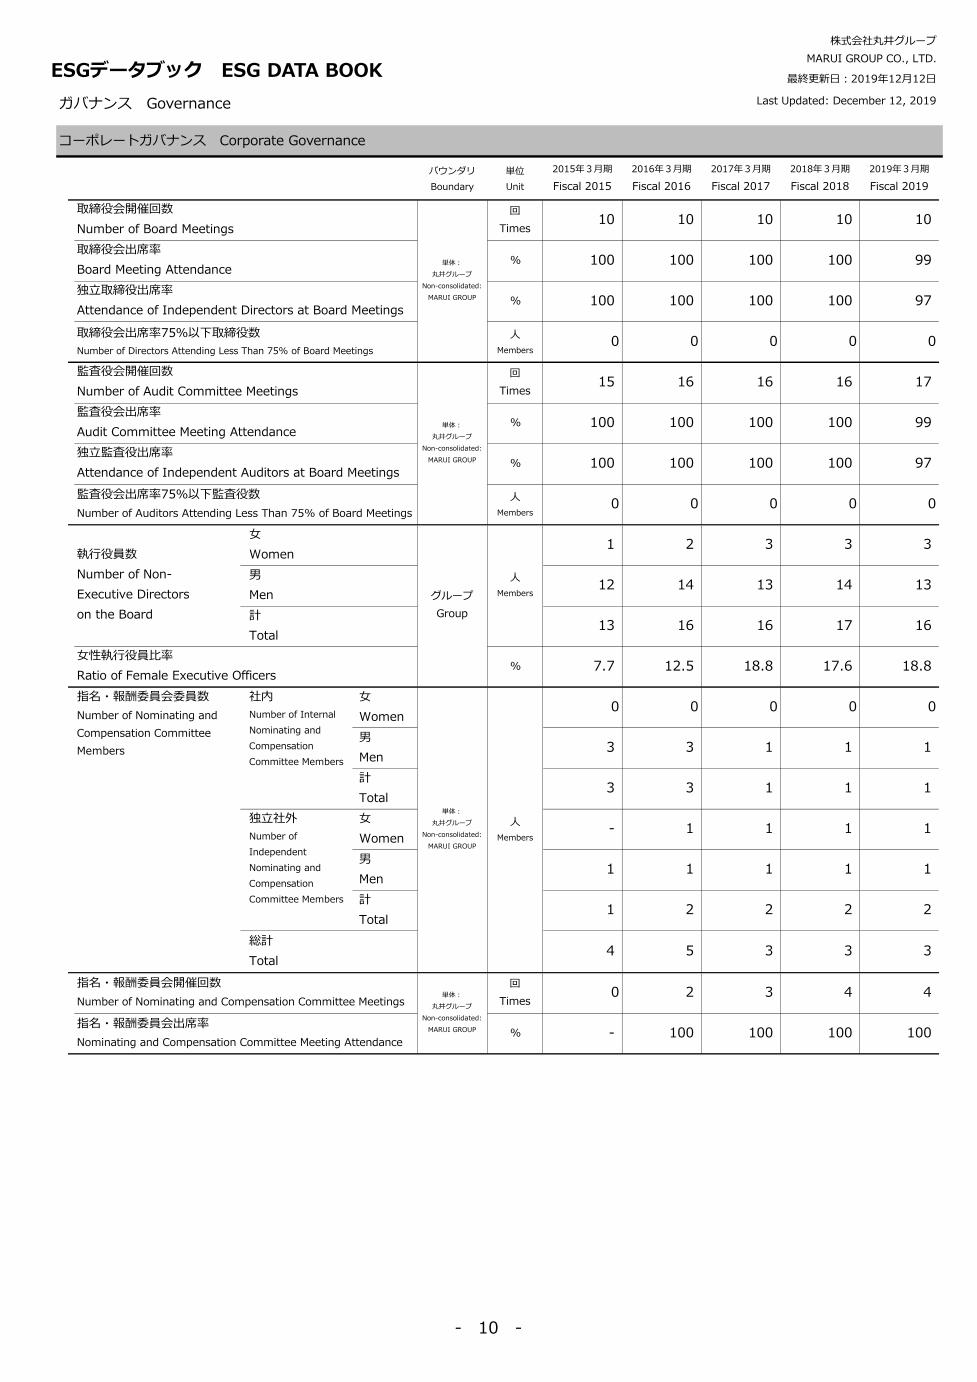
コーポレートガバナンス Corporate Governance
バウンダリ
Boundary
単位
Unit
2015年3月期
Fiscal 2015
2016年3月期
Fiscal 2016
2017年3月期
Fiscal 2017
2018年3月期
Fiscal 2018
2019年3月期
Fiscal 2019
回
Times10 10 10 10 10
% 100 100 100 100 99
% 100 100 100 100 97
人
Members0 0 0 0 0
回
Times15 16 16 16 17
% 100 100 100 100 99
% 100 100 100 100 97
人
Members0 0 0 0 0
女
Women1 2 3 3 3
男
Men12 14 13 14 13
計
Total13 16 16 17 16
% 7.7 12.5 18.8 17.6 18.8
女
Women0 0 0 0 0
男
Men3 3 1 1 1
計
Total3 3 1 1 1
女
Women- 1 1 1 1
男
Men1 1 1 1 1
計
Total1 2 2 2 2
総計
Total4 5 3 3 3
回
Times0 2 3 4 4
% - 100 100 100 100
取締役会出席率
Board Meeting Attendance
独立社外
Number of
Independent
Nominating and
Compensation
Committee Members
社内
Number of Internal
Nominating and
Compensation
Committee Members
指名・報酬委員会開催回数
Number of Nominating and Compensation Committee Meetings
指名・報酬委員会出席率
Nominating and Compensation Committee Meeting Attendance
指名・報酬委員会委員数
Number of Nominating and
Compensation Committee
Members
人
Members
単体:
丸井グループ
Non-consolidated:
MARUI GROUP
人
Members
女性執行役員比率
Ratio of Female Executive Officers
単体:
丸井グループ
Non-consolidated:
MARUI GROUP
執行役員数
Number of Non-
Executive Directors
on the Board
独立取締役出席率
Attendance of Independent Directors at Board Meetings
取締役会出席率75%以下取締役数
Number of Directors Attending Less Than 75% of Board Meetings
株式会社丸井グループ
MARUI GROUP CO., LTD.
グループ
Group
独立監査役出席率
Attendance of Independent Auditors at Board Meetings
監査役会出席率75%以下監査役数
Number of Auditors Attending Less Than 75% of Board Meetings
単体:
丸井グループ
Non-consolidated:
MARUI GROUP
取締役会開催回数
Number of Board Meetings
単体:
丸井グループ
Non-consolidated:
MARUI GROUP
監査役会開催回数
Number of Audit Committee Meetings
監査役会出席率
Audit Committee Meeting Attendance
ESGデータブック ESG DATA BOOK
- 10 -
最終更新日:2019年12月12日
ガバナンス Governance Last Updated: December 12, 2019
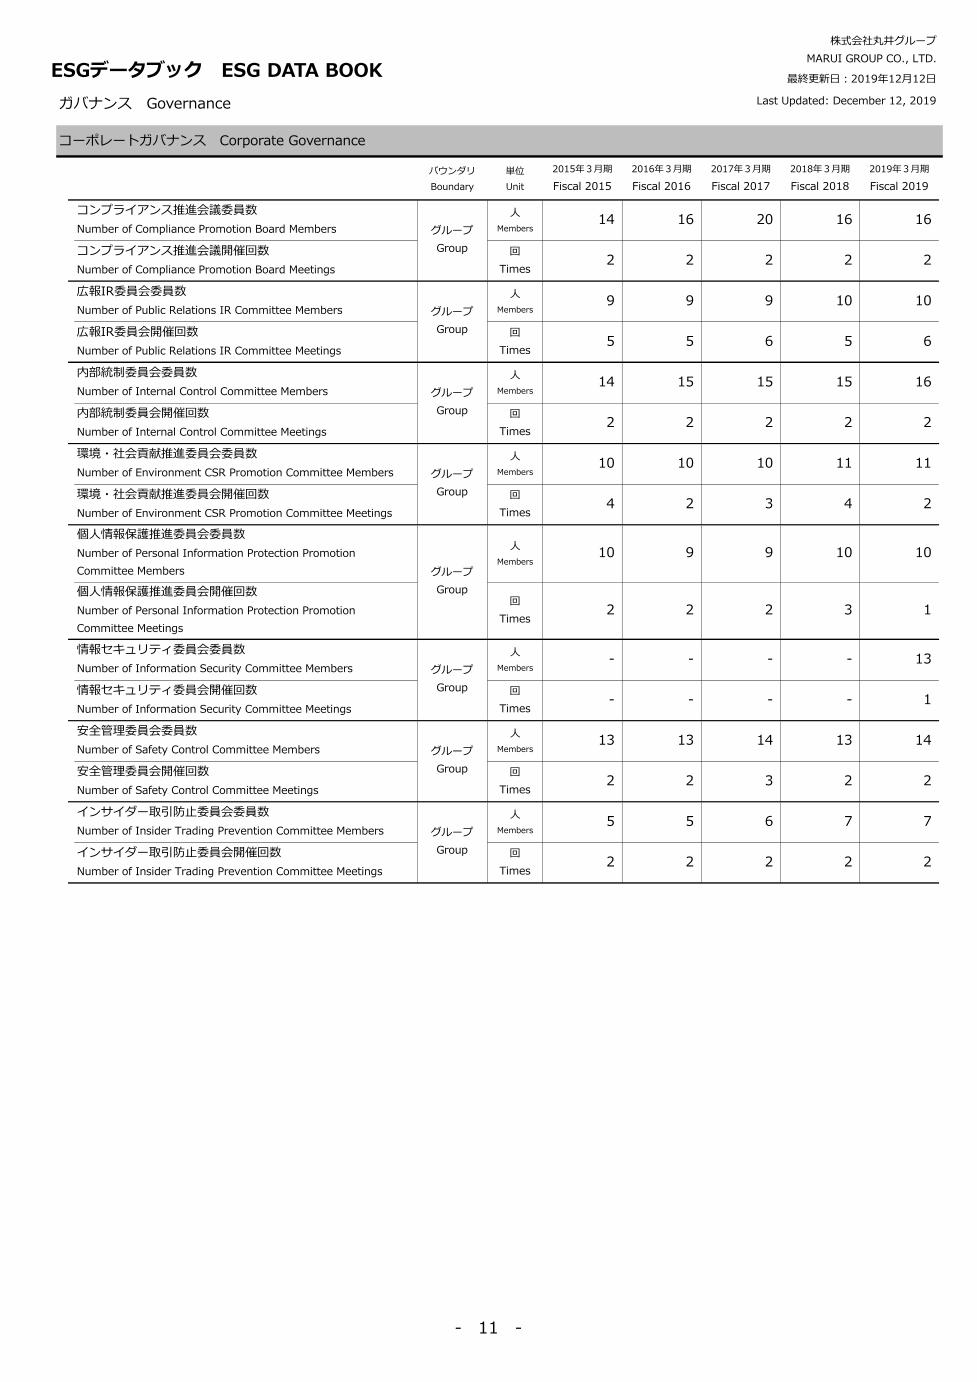
コーポレートガバナンス Corporate Governance
バウンダリ
Boundary
単位
Unit
2015年3月期
Fiscal 2015
2016年3月期
Fiscal 2016
2017年3月期
Fiscal 2017
2018年3月期
Fiscal 2018
2019年3月期
Fiscal 2019
人
Members14 16 20 16 16
回
Times2 2 2 2 2
人
Members9 9 9 10 10
回
Times5 5 6 5 6
人
Members14 15 15 15 16
回
Times2 2 2 2 2
人
Members10 10 10 11 11
回
Times4 2 3 4 2
人
Members10 9 9 10 10
回
Times2 2 2 3 1
人
Members- - - - 13
回
Times- - - - 1
人
Members13 13 14 13 14
回
Times2 2 3 2 2
人
Members5 5 6 7 7
回
Times2 2 2 2 2
グループ
Group
広報IR委員会開催回数
Number of Public Relations IR Committee Meetings
内部統制委員会委員数
Number of Internal Control Committee Members
内部統制委員会開催回数
Number of Internal Control Committee Meetings
環境・社会貢献推進委員会委員数
Number of Environment CSR Promotion Committee Members
環境・社会貢献推進委員会開催回数
Number of Environment CSR Promotion Committee Meetings
個人情報保護推進委員会委員数
Number of Personal Information Protection Promotion
Committee Members
個人情報保護推進委員会開催回数
Number of Personal Information Protection Promotion
Committee Meetings
コンプライアンス推進会議委員数
Number of Compliance Promotion Board Members
コンプライアンス推進会議開催回数
Number of Compliance Promotion Board Meetings
安全管理委員会開催回数
Number of Safety Control Committee Meetings
インサイダー取引防止委員会委員数
Number of Insider Trading Prevention Committee Members
インサイダー取引防止委員会開催回数
Number of Insider Trading Prevention Committee Meetings
グループ
Group
安全管理委員会委員数
Number of Safety Control Committee Members
情報セキュリティ委員会開催回数
Number of Information Security Committee Meetings
株式会社丸井グループ
MARUI GROUP CO., LTD.
グループ
Group
グループ
Group
広報IR委員会委員数
Number of Public Relations IR Committee Members
ESGデータブック ESG DATA BOOK
グループ
Group
情報セキュリティ委員会委員数
Number of Information Security Committee Members
グループ
Group
グループ
Group
グループ
Group
- 11 -

最終更新日:2019年12月12日
ガバナンス Governance Last Updated: December 12, 2019
報酬 Compensation
バウンダリ
Boundary
単位
Unit
2015年3月期
Fiscal 2015
2016年3月期
Fiscal 2016
2017年3月期
Fiscal 2017
2018年3月期
Fiscal 2018
2019年3月期
Fiscal 2019
0 0 84 84 84
0 0 8 9 9
0 0 9 9 9
0 0 102 102 102
173 165 149 148 156
27 22 0 0 0
0 0 15 16 17
0 0 16 16 17
200 187 182 181 191
34 35 34 34 35
0 0 0 0 0
0 0 0 0 0
0 0 0 0 0
34 35 34 34 35
33 37 44 54 49
0 0 0 0 0
0 0 0 0 0
0 0 0 0 0
33 37 44 54 49
株主権 Shareholder Rights
なし
None
会計監査 Accounting Audits
バウンダリ
Boundary
単位
Unit
2015年3月期
Fiscal 2015
2016年3月期
Fiscal 2016
2017年3月期
Fiscal 2017
2018年3月期
Fiscal 2018
2019年3月期
Fiscal 2019
監査費
Audit Fees100 93 96 95 98
1 1 1 1 1
101 94 97 97 100
単体:
丸井グループ
Non-consolidated:
MARUI GROUP
百万円
Millions of
Yen
非監査費
Non-Audit Fees
会計監査人への報酬
Compensation of
Accounting Auditors
買収防衛策
Anti-Takeover Measures
計
Total
* 子会社を除く
Excludes subsidiaries
社外役員報酬
Compensation of External
Directors and External Audit &
Supervisory Board Members
CEO報酬
Compensation of Chief
Executive Officer
基本報酬
Base Salary
単体:
丸井グループ
Non-consolidated:
MARUI GROUP
百万円
Millions of
Yen
業績連動賞与
Bonuses
百万円
Millions of
Yen
ストックオプション
Stock Options
業績連動賞与
Bonuses
基本報酬
Base Salary
単体:
丸井グループ
Non-consolidated:
MARUI GROUP
百万円
Millions of
Yen
ストックオプション
Stock Options
業績連動賞与
Bonuses
業績連動型株式報酬
Other Compensation
計
Total
業績連動型株式報酬
Other Compensation
計
Total
計
Total
監査役報酬
(社外監査役を除く)
Compensation of Audit &
Supervisory Board
Members
(Excluding External Audit &
Supervisory Board Members)
株式会社丸井グループ
MARUI GROUP CO., LTD.
基本報酬
Base Salary
単体:
丸井グループ
Non-consolidated:
MARUI GROUP
基本報酬*
Base Salary*
単体:
丸井グループ
Non-consolidated:
MARUI GROUP
百万円
Millions of
Yen
ストックオプション
Stock Options
業績連動賞与
Bonuses
業績連動型株式報酬
Other Compensation
計
Total
取締役報酬
(社外取締役を除く)
Compensation of Directors
(Excluding External
Directors)
ESGデータブック ESG DATA BOOK
業績連動型株式報酬
Other Compensation
- 12 -
最終更新日:2019年12月12日
ガバナンス Governance Last Updated: December 12, 2019
クローバック方針
Clawback provision
有
Yes
有
Yes
有
Yes
有
Yes
有
Yes
有
Yes
有
Yes
有
Yes
有
Yes
バウンダリ
Boundary
単位
Unit
2015年3月期
Fiscal 2015
2016年3月期
Fiscal 2016
2017年3月期
Fiscal 2017
2018年3月期
Fiscal 2018
2019年3月期
Fiscal 2019
グループ
Group
件
Violations42 48 35 65 44
件
Violations0 0 0 0 0
円
Yen0 0 0 0 0
件
Incidents0 0 0 0 0
円
Yen0 0 0 0 0
グループ
Group
件
Incidents- - - - 1
グループ
Group
件
Incidents- - - - 0
グループ
Group
円
Yen0 0 0 0 0
法令違反罰金額
Total Cost of Incidents of Non-Compliance
腐敗防止違反件数
Number of Fines and Penalties for Corruption
政治献金額
Political Contributions
取締役の関連当事者取引方針
Policy on Related Party Transactions
取締役の利益相反方針
Conflicts of Interest Policy
ロビー活動と政府への献金の方針
Corporate Public Policy and Lobbying
公益通報者保護方針
Employee Protection / Whistle-Blower Policy
行動規範・倫理基準に対する違反件数
Number of code of conduct or ethics breaches
同上
Same as Above
「グループ行動規範」に含む
http://www.0101maruigroup.co.jp/ci/action.html#action1
Included in the MARUI GROUP Code of Conduct
http://www.0101maruigroup.co.jp/en/ci/action.html#action1
同上
Same as Above
「グループ税務方針」
http://www.0101maruigroup.co.jp/sustainability/theme04/risk.html
MARUI GROUP Tax Policy
http://www.0101maruigroup.co.jp/en/sustainability/theme04/risk.html
腐敗防止方針
Anti-Corruption Policy
倫理規範
Business Ethics Policy
内部通報窓口への通報件数
Number of reports filed through whistle-blowing system
お客さまのプライバシー侵害・苦情に対する違反件数
Number of cases of customer privacy violations or complaints
「グループ行動規範」に含む
http://www.0101maruigroup.co.jp/ci/action.html#action1
Included in the MARUI GROUP Code of Conduct
http://www.0101maruigroup.co.jp/en/ci/action.html#action1
「丸井グループ コーポレートガバナンス・ガイドライン」に含む
http://www.0101maruigroup.co.jp/pdf/cgg_20190520.pdf
Included in the MARUI GROUP Corporate Governance Guidelines
http://www.0101maruigroup.co.jp/pdf/cgg_20190520_en.pdf
グループ
Group
グループ
Group
同上
Same as Above
「丸井グループ コーポレートガバナンス・ガイドライン」に含む
http://www.0101maruigroup.co.jp/pdf/cgg_20190520.pdf
Included in the MARUI GROUP Corporate Governance Guidelines
http://www.0101maruigroup.co.jp/pdf/cgg_20190520_en.pdf
税の透明性の方針
Policy on Tax Transparency
贈収賄方針
Anti-Bribery Policy
腐敗防止違反罰金額
Total Cost of Fines and Penalties for Corruption
法令違反件数
Number of Incidents of Non-Compliance
コンプライアンス Compliance
株式会社丸井グループ
MARUI GROUP CO., LTD.
丸井グループ コーポレートガバナンス報告書に含む
http://www.0101maruigroup.co.jp/pdf/cgr.pdf
Included in the MARUI GROUP Corporate Governance Report
http://www.0101maruigroup.co.jp/pdf/cgr_en.pdf
ESGデータブック ESG DATA BOOK
REVIEW
REVIEW
REVIEW
REVIEW
REVIEW
REVIEW
- 13 -
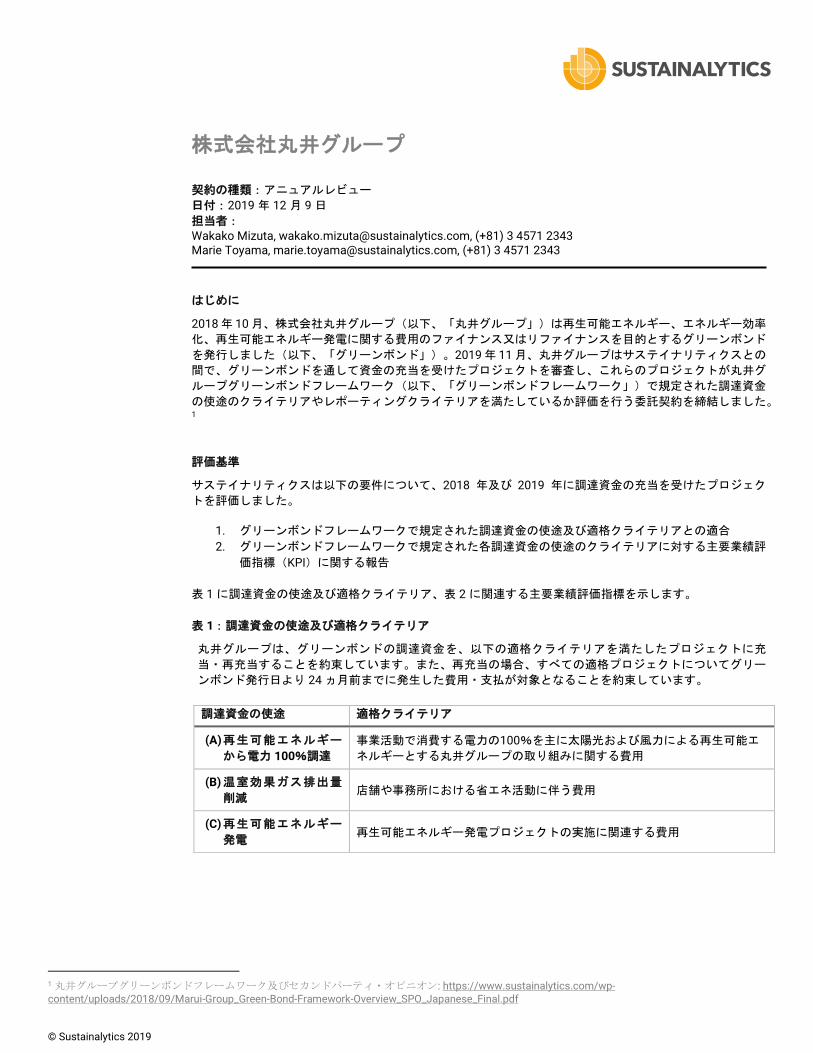
© Sustainalytics 2019
株式会社丸井グループ
契約の種類:アニュアルレビュー
日付:2019 年 12 月 9 日
担当者: Wakako Mizuta, [email protected], (+81) 3 4571 2343 Marie Toyama, [email protected], (+81) 3 4571 2343
はじめに
2018年 10月、株式会社丸井グループ(以下、「丸井グループ」)は再生可能エネルギー、エネルギー効率
化、再生可能エネルギー発電に関する費用のファイナンス又はリファイナンスを目的とするグリーンボンド
を発行しました(以下、「グリーンボンド」)。2019年 11月、丸井グループはサステイナリティクスとの
間で、グリーンボンドを通して資金の充当を受けたプロジェクトを審査し、これらのプロジェクトが丸井グ
ループグリーンボンドフレームワーク(以下、「グリーンボンドフレームワーク」)で規定された調達資金
の使途のクライテリアやレポーティングクライテリアを満たしているか評価を行う委託契約を締結しました。1
評価基準
サステイナリティクスは以下の要件について、2018 年及び 2019 年に調達資金の充当を受けたプロジェク
トを評価しました。
1. グリーンボンドフレームワークで規定された調達資金の使途及び適格クライテリアとの適合
2. グリーンボンドフレームワークで規定された各調達資金の使途のクライテリアに対する主要業績評
価指標(KPI)に関する報告
表 1 に調達資金の使途及び適格クライテリア、表 2 に関連する主要業績評価指標を示します。
表 1:調達資金の使途及び適格クライテリア
丸井グループは、グリーンボンドの調達資金を、以下の適格クライテリアを満たしたプロジェクトに充
当・再充当することを約束しています。また、再充当の場合、すべての適格プロジェクトについてグリー
ンボンド発行日より 24 ヵ月前までに発生した費用・支払が対象となることを約束しています。
1 丸井グループグリーンボンドフレームワーク及びセカンドパーティ・オピニオン: https://www.sustainalytics.com/wp-content/uploads/2018/09/Marui-Group_Green-Bond-Framework-Overview_SPO_Japanese_Final.pdf
調達資金の使途 適格クライテリア
(A) 再生可能エネルギー
から電力 100%調達
事業活動で消費する電力の100%を主に太陽光および風力による再生可能エ
ネルギーとする丸井グループの取り組みに関する費用
(B) 温室効果ガス排出量
削減 店舗や事務所における省エネ活動に伴う費用
(C) 再生可能エネルギー
発電 再生可能エネルギー発電プロジェクトの実施に関連する費用
アニュアルレビュー 株式会社丸井グループ
2
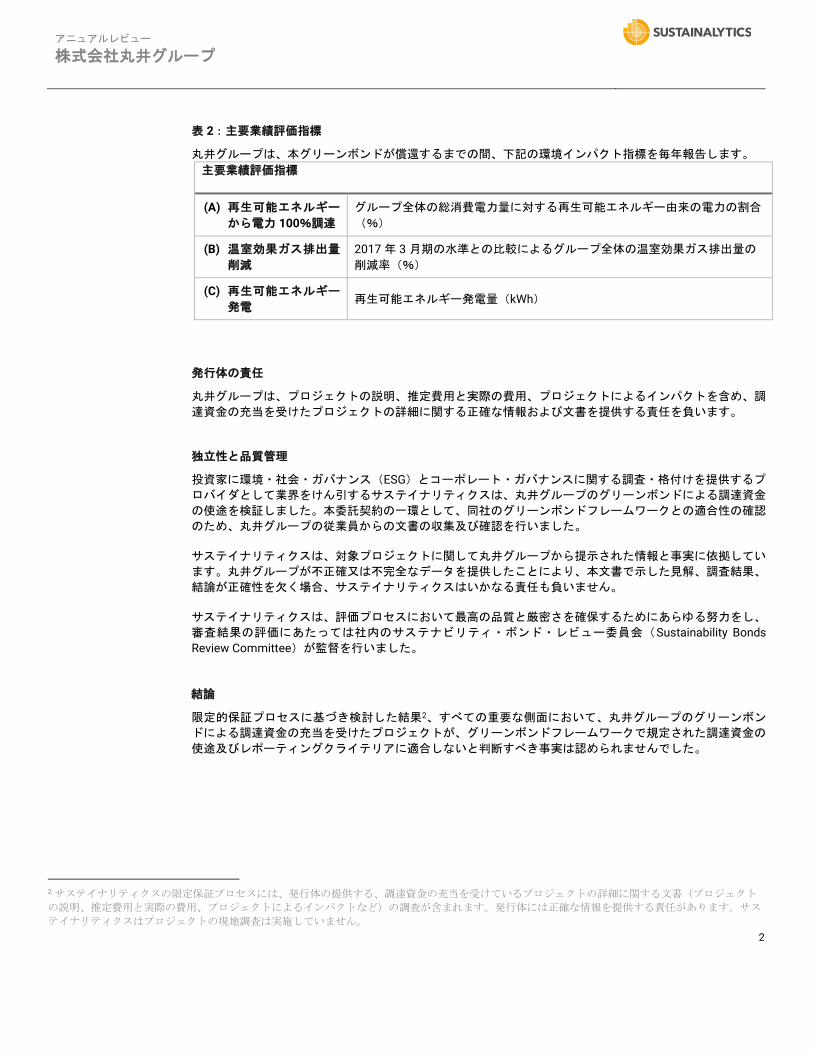
表 2:主要業績評価指標
丸井グループは、本グリーンボンドが償還するまでの間、下記の環境インパクト指標を毎年報告します。 主要業績評価指標
(A) 再生可能エネルギー
から電力 100%調達
グループ全体の総消費電力量に対する再生可能エネルギー由来の電力の割合
(%)
(B) 温室効果ガス排出量
削減
2017 年 3 月期の水準との比較によるグループ全体の温室効果ガス排出量の
削減率(%)
(C) 再生可能エネルギー
発電 再生可能エネルギー発電量(kWh)
発行体の責任
丸井グループは、プロジェクトの説明、推定費用と実際の費用、プロジェクトによるインパクトを含め、調
達資金の充当を受けたプロジェクトの詳細に関する正確な情報および文書を提供する責任を負います。
独立性と品質管理
投資家に環境・社会・ガバナンス(ESG)とコーポレート・ガバナンスに関する調査・格付けを提供するプ
ロバイダとして業界をけん引するサステイナリティクスは、丸井グループのグリーンボンドによる調達資金
の使途を検証しました。本委託契約の一環として、同社のグリーンボンドフレームワークとの適合性の確認
のため、丸井グループの従業員からの文書の収集及び確認を行いました。
サステイナリティクスは、対象プロジェクトに関して丸井グループから提示された情報と事実に依拠してい
ます。丸井グループが不正確又は不完全なデータを提供したことにより、本文書で示した見解、調査結果、
結論が正確性を欠く場合、サステイナリティクスはいかなる責任も負いません。
サステイナリティクスは、評価プロセスにおいて最高の品質と厳密さを確保するためにあらゆる努力をし、
審査結果の評価にあたっては社内のサステナビリティ・ボンド・レビュー委員会(Sustainability Bonds
Review Committee)が監督を行いました。
結論
限定的保証プロセスに基づき検討した結果2、すべての重要な側面において、丸井グループのグリーンボン
ドによる調達資金の充当を受けたプロジェクトが、グリーンボンドフレームワークで規定された調達資金の
使途及びレポーティングクライテリアに適合しないと判断すべき事実は認められませんでした。
2 サステイナリティクスの限定保証プロセスには、発行体の提供する、調達資金の充当を受けているプロジェクトの詳細に関する文書(プロジェクト
の説明、推定費用と実際の費用、プロジェクトによるインパクトなど)の調査が含まれます。発行体には正確な情報を提供する責任があります。サス
テイナリティクスはプロジェクトの現地調査は実施していません。
アニュアルレビュー 株式会社丸井グループ
3
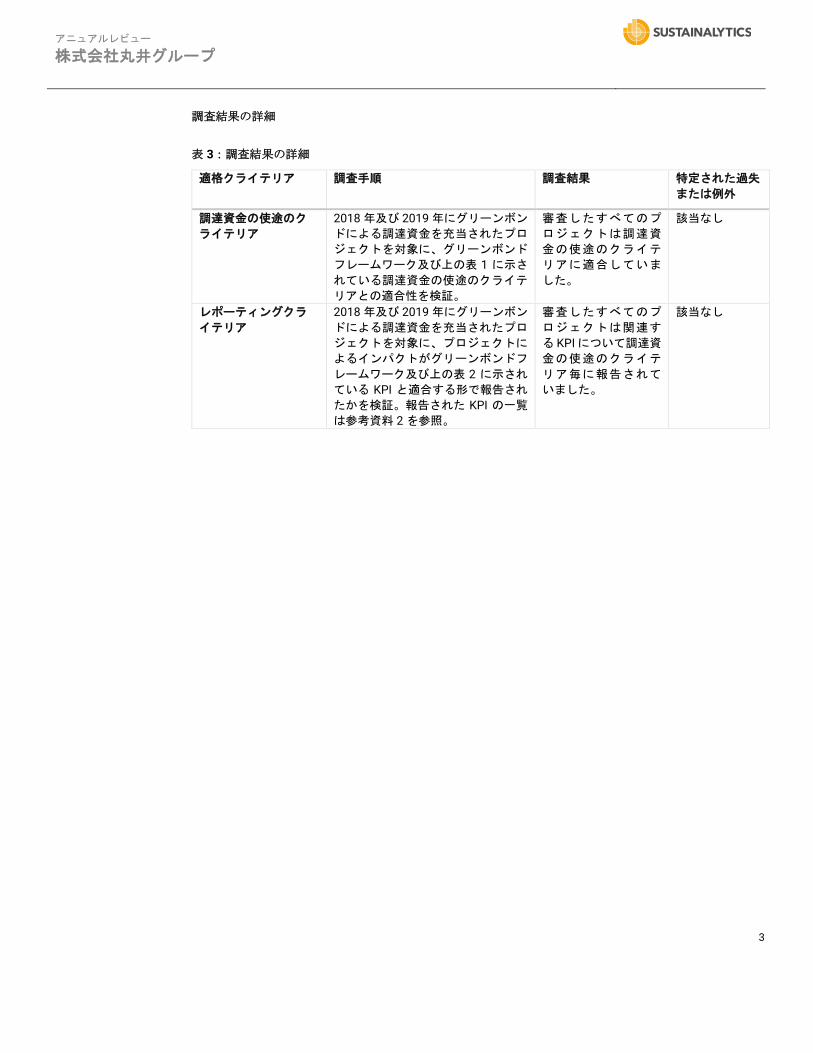
調査結果の詳細
表 3:調査結果の詳細
適格クライテリア 調査手順 調査結果 特定された過失
または例外
調達資金の使途のク
ライテリア
2018 年及び 2019 年にグリーンボン
ドによる調達資金を充当されたプロ
ジェクトを対象に、グリーンボンド
フレームワーク及び上の表 1 に示さ
れている調達資金の使途のクライテ
リアとの適合性を検証。
審査したすべてのプ
ロジェクトは調達資
金の使途のクライテ
リアに適合していま
した。
該当なし
レポーティングクラ
イテリア
2018 年及び 2019 年にグリーンボン
ドによる調達資金を充当されたプロ
ジェクトを対象に、プロジェクトに
よるインパクトがグリーンボンドフ
レームワーク及び上の表 2 に示され
ている KPI と適合する形で報告され
たかを検証。報告された KPI の一覧
は参考資料 2 を参照。
審査したすべてのプ
ロジェクトは関連す
る KPIについて調達資
金の使途のクライテ
リア毎に報告されて
いました。
該当なし
アニュアルレビュー 株式会社丸井グループ
4
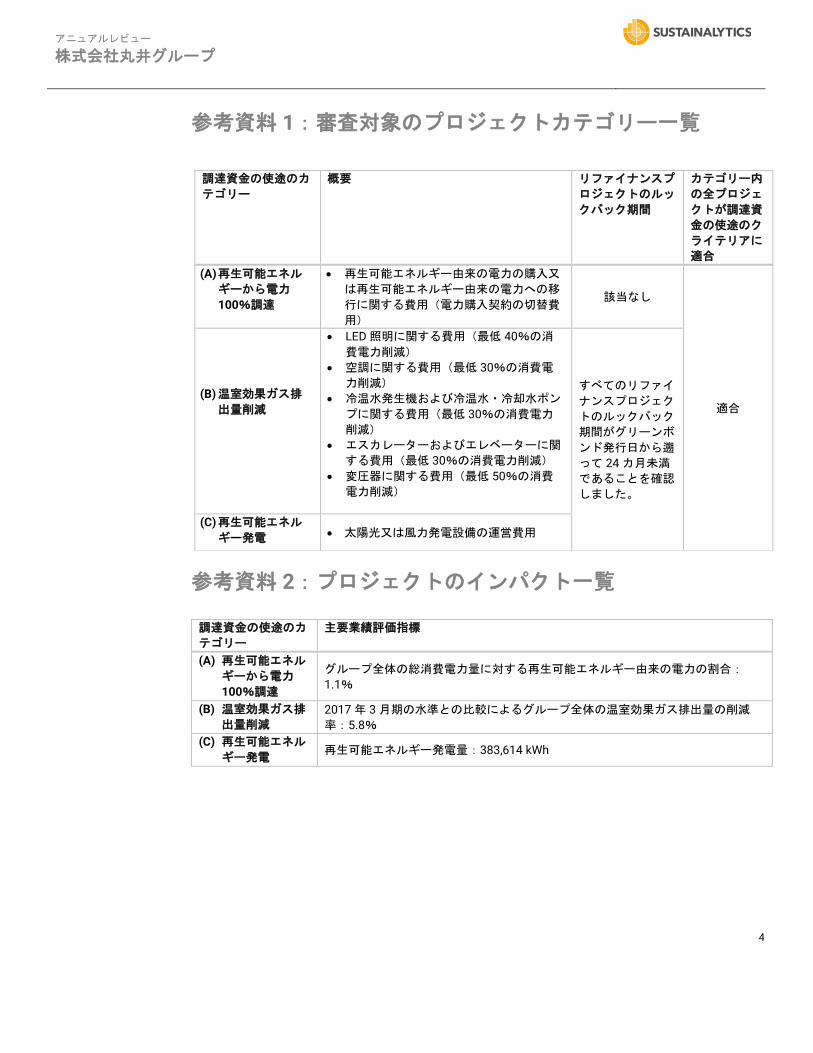
参考資料 1:審査対象のプロジェクトカテゴリー一覧
参考資料 2:プロジェクトのインパクト一覧
調達資金の使途のカ
テゴリー
主要業績評価指標
(A) 再生可能エネル
ギーから電力
100%調達
グループ全体の総消費電力量に対する再生可能エネルギー由来の電力の割合:
1.1%
(B) 温室効果ガス排
出量削減
2017 年 3 月期の水準との比較によるグループ全体の温室効果ガス排出量の削減
率:5.8%
(C) 再生可能エネル
ギー発電 再生可能エネルギー発電量:383,614 kWh
調達資金の使途のカ
テゴリー
概要 リファイナンスプ
ロジェクトのルッ
クバック期間
カテゴリー内
の全プロジェ
クトが調達資
金の使途のク
ライテリアに
適合
(A) 再生可能エネル
ギーから電力
100%調達
• 再生可能エネルギー由来の電力の購入又
は再生可能エネルギー由来の電力への移
行に関する費用(電力購入契約の切替費
用)
該当なし
適合
(B) 温室効果ガス排
出量削減
• LED 照明に関する費用(最低 40%の消
費電力削減)
• 空調に関する費用(最低 30%の消費電
力削減)
• 冷温水発生機および冷温水・冷却水ポン
プに関する費用(最低 30%の消費電力
削減)
• エスカレーターおよびエレベーターに関
する費用(最低 30%の消費電力削減)
• 変圧器に関する費用(最低 50%の消費
電力削減)
すべてのリファイ
ナンスプロジェク
トのルックバック
期間がグリーンボ
ンド発行日から遡
って 24 カ月未満
であることを確認
しました。
(C) 再生可能エネル
ギー発電 • 太陽光又は風力発電設備の運営費用
アニュアルレビュー 株式会社丸井グループ
5
免責事項
© Sustainalytics 2019 無断複写・複製・転載を禁ず
本書に記載された情報の知的財産権は、独占的にサステイナリティクスに帰属します。サステイナリティク
スの書面による明示的な同意がない限り、本成果物のいかなる部分も、電子的、機械的、写真複製、録音等
の形態・方法を問わず、複製し、流通させ、他の情報と組み合わせ、二次的著作物の作成に使用し、その方
法にかかわらず提供し、第三者の閲覧に供し、または公開することはできません。
本書の情報は、現状有姿にて発行体から提供された情報に基づいたものであり、したがってサステイナリテ
ィクスは、本成果物に記載された情報の完全性、正確性、適時性について保証するものではなく、誤謬や欠
落について何ら責任を負わず、また本成果物の内容や、本成果物およびそこに記載された情報の利用によっ
て生じた損害について、いかなる形の賠償責任も認めることはありません。第三者への言及は、かかる第三
者に所有権があることを適切に表示するためのものであり、その後援または推奨を意味するものではありま
せん。
本成果物に記載されたいかなる内容も、明示または黙示を問わず、企業への投資、プロジェクトの選択、ま
たは何らかの種類の商取引の実施の適否に関するサステイナリティクスの表明または保証と解釈されるべき
ではありません。また(該当する司法管轄区域において定義された)「投資助言」として、または発行体の
財務業績、金融債務、もしくは信用力の評価として解釈されるべきではありません。
発行体は、自らが確約した内容の確実な遵守とその証明、履行、および監視について全責任を負います。
英語版と翻訳版の間に矛盾もしくは 不一致が 生じた場合は英語版が優先するものとします。
アニュアルレビュー 株式会社丸井グループ
6
サステイナリティクスについて
サステイナリティクスは、環境・社会・ガバナンス(ESG)とコーポレート・ガバナンスに関する調査、格
付け及び分析を行う独立系機関であり、責任投資(RI)戦略の策定と実施について世界中の投資家をサポー
トしています。サステイナリティクスは世界各地に 13 のオフィスを展開し、機関投資家のパートナーとし
て、ESG に関する情報や調査結果を投資プロセスに組み込むサポートを提供しています。今日、30 か国に
おいて多国籍企業、金融機関及び政府機関に至る様々な発行体が弊社にグリーンボンドやサステナビリティ
ボンドに関するセカンドパーティ・オピニオンを依頼しています。サステイナリティクスは Climate Bonds
Standard Board により検証機関としての認証を受け、フレームワークの策定や検証において様々なステー
クホルダーを支援しています。サステイナリティクスは 2015 年に、Global Capital 社により「最も優れた
SRI・グリーンボンドリサーチ・格付企業」に選出され、2018 年と 2019 年には「もっとも印象的なセカン
ドパーティ・オピニオン機関」として表彰を受けました。2018 年には、Climate Bonds Initiative 及び
Environmental Finance 誌によって「最大の外部レビュー機関」に指定され、2019 年には Climate Bonds
Initiative により「気候ボンドのレビューにおける最大の認証機関」に選ばれました。また、サステイナリ
ティクスは 2018 年に一般社団法人環境金融研究機構から「サステナブルファイナンスアワード特別賞」を
受賞し、2019 年にはジャパン・グリーンボンド・アワードのジャパン・グリーンコントリビューター部門
で環境大臣賞を受賞しております。
詳しくは、www.sustainalytics.com をご参照、又は
[email protected] にご連絡下さい。