ese 150 – lab 09: operating system basics
TRANSCRIPT

ESE 150 – Lab 09: Operating System Basics
ESE150 – Lab 09 Page 1 of 18
LAB 09
Today’s Lab has the following objectives: 1. Learn how to remotely log into Eniac Linux server 2. Learn some of the basics of process management on the Linux Operating System
Background:
OPERATING SYSTEMS We learned in lecture that a CPU can really only execute one task or instruction (like ADD or SUBTRACT, etc) at a time. The Operating System is a program that runs on a CPU with the job of managing the CPU’s time. It schedules programs that user’s would like run for time on the CPU, essentially its main job is to keep the CPU busy. Another aspect of the OS is to protect access to the hardware that surrounds the CPU (like input and output devices – keyboards, mice, etc.) so that programs don’t have direct access to the hardware, but instead ask the OS for permission to access it. This also lends itself to “virtualizing” the CPU and its hardware so that each program that runs on the CPU believes it is the only program running on the CPU at any given time. Before the personal computer existed, before Mac OS and Windows came into being, an operating system named UNIX was written to manage large computers at AT&T Bell Laboratories in the 1970s that became a model for modern operating systems (like Windows and Mac OSX). In the 1990’s an operating system named Linux was invented modeled very heavily on the UNIX operating system. Today Linux and its decedents (like the Android operating system) is the most widely used and distributed operating system of all time. For that reason it is the focus of today’s lab as we attempt to learn some basics about Operating Systems. The Linux operating system is organized like a NUT with many layers! Inside is something called the “Kernel” and on the outside is something called the “Shell”, both of these are programs, and they have different functions. The Kernel is the lowest level and is the part of the OS that deals directly with the hardware: CPU, Memory, I/O Devices (keyboard, harddrive, etc). If an application would like to work with the CPU, it goes through the Kernel, obtaining permission in a sense, to do so.

ESE 150 – Lab 09: Operating System Basics
ESE150 – Lab 09 Page 2 of 18
The “Shell” is an application that allows users to type in commands to work with the operating system. While the user can’t interact directly with the Kernel, it can go through the shell to gain access to the CPU. Today’s Linux Operating Systems typically include a GUI, which is also an application that allows users to interact with the OS through graphical means. While a GUI has its uses, working with the Linux shell can be a bit more powerful, and it is the level at which we will work today. [Optional: For a fanciful description of using the shell rather than a GUI, you can see Neal Stephenson’s “In the beginning was the command line…” essay http://www.cryptonomicon.com/beginning.html ] The SHELL and a process In the shell, we can start and stop programs, interact with the filesystem (to copy/delete/create files), interact with the network, and I/O devices as well (through the kernel). The shell requires us to remember basic commands to do all of these things as there is no GUI, everything must be typed into the shell to get the OS to work with us. Recall that ultimately, we want a CPU to run a program (a set of instructions to accomplish some task – say encode or playback an MP3 file!). When a program is actually running on an operating system it is typically referred to as a “process” (aka a running program). When we start or stop a process we are asking the shell to perform a “job” for us, so processes are sometimes referred to as a “job” in Linux. One of the main roles of the operating system is to give all of the “processes” a user wishes to run “at the same time” access to the CPU and the hardware connected to the machine. This delicate balancing act, often referred to as “scheduling” is one of the most important jobs of an operating system, and typically this scheduling task is handled in the kernel of the OS. So a user starts a “job” or process in the shell, and then the kernel is responsible for letting it run on the CPU and letting all the other processes share time on the CPU. We’ll investigate a bit of this in today’s lab so you get a feel for the main role of the operating system. Some Useful Resources Here are some useful links that list and explain common Linux commands. Feel free to review the websites to get more experience operating in the Linux environment.
1. https://maker.pro/education/basic-linux-commands-for-beginners a. Provides more background and lists common commands.
2. https://www.pcsteps.com/5010-basic-linux-commands-terminal/ a. Provides useful tips and tricks for using Linux (i.e. Copy and paste). Breaks down
commands by tasks.

ESE 150 – Lab 09: Operating System Basics
ESE150 – Lab 09 Page 3 of 18
Prelab: Part 1: SSH into ENIAC ENIAC is the name of the server running in SEAS that all engineering students have access to. The S drive that you are already familiar with is the home directory of your account on ENIAC. To remotely access ENIAC from a personal computer, we will use SSH: Secure Socket Shell. You can read more about SSH and its history here: http://docstore.mik.ua/orelly/networking_2ndEd/ssh/ch01_01.htm SSH is often run from a unix-based command line. If your personal computer is unix-based (Mac or Linux), you can use the following instructions to log into the ENIAC:
1. Open a terminal window 2. Type the following command, replacing PENNKEY with your PennKey
ssh [email protected] 3. If prompted, type ‘y’ to add to known hosts. When prompted, enter your password 4. You should see a welcome message:

ESE 150 – Lab 09: Operating System Basics
ESE150 – Lab 09 Page 4 of 18
If your personal computer is running Windows, there are lots of SSH clients that are easy to download and run. A popular one is called PuTTY:
1. Download PuTTY from their website: http://www.chiark.greenend.org.uk/~sgtatham/putty/download.html
2. Open the .exe file once the download is complete 3. Enter the hostname in the form [email protected], replacing it with your actual
PennKey
4. Select “Open.” If prompted, select ‘Yes’ on the popup, and then enter your password 5. You should see the welcome message:
Now you have remote access to the ENIAC computer.
ESE 150 – Lab 09: Operating System Basics
ESE150 – Lab 09 Page 5 of 18
Part 2: Writing, compiling, and monitoring a small C program • Learn the structure of a basic C program • Learn about Linux processes and use a basic tool to monitor them called: ps
This section assumes you have read the background up above. If you haven’t please do now! 1. Create a folder on the filesystem and change:
a. At the “prompt” type in the following commands to create a folder called ese150_lab9 and then a subfolder within it called ex1 mkdir ese150_lab9
cd ese150_lab9 mkdir ex1 cd ex1 2. Use the “nano” editor to create a simple C program
a. At the prompt, type in the following command to create a new file called ex1.c: nano ex1.c
b. Type in the following C program to the editor: #include <stdio.h> int main () { char name[50] ; printf ("Please enter your name: " ) ; scanf ("%s", name) ; printf ("Welcome to my program %s \n", name) ; }
c. Once you have entered it all, press <ctrl> X, i. Answer “Y” to the question
ii. Keep the file name the same (ex1.c) and press <enter> iii. Your file will now be saved to the filesystem
3. Compile your new C-program as follows:
a. Type in the following command: gcc ex1.c –o ex1
b. This invokes a “compiler” which converts your program written in the C-language into the Assembly and machine code that the computer you are working on truly understands. When it is complete, it will create a file called: “ex1” that you can run!

ESE 150 – Lab 09: Operating System Basics
ESE150 – Lab 09 Page 6 of 18
4. Run your C-program as follows: a. Type in the following command:
./ex1 i. If you get an error saying “Permission Denied,” run the command: chmod +x
ex1 b. Congratulations, you’ve just run your first “process” on the Linux OS c. Submit your program as part of the lab.
5. Let’s examine our process in some greater detail: a. Open up another terminal window (ssh in again, as in Part I) b. Position both terminal windows next to one another (so you can see what the other window
is doing) c. In your original terminal window, run your program again (as in step 4)
i. BUT DON’T type in your name ii. Let the program “wait” for your input while we examine the process
d. In the new terminal window, type in the following command: ps –u PENNKEY
e. This command will output a listing similar to this:
USER PID %CPU %MEM VSZ RSS TTY STAT START TIME COMMAND tfarmer 10089 0.0 0.0 16988 6640 pts/436 Ss 20:58 0:00 -bash tfarmer 10432 0.0 0.0 16888 6388 pts/445 Ss 22:14 0:00 -bash tfarmer 11372 0.0 0.0 4072 652 pts/460 S+ 22:15 0:00 ./ex1
If it doesn’t show the STAT column, use: env PS_FORMAT=DefBSD ps -u PENNKEY The “env PS_FORMAT=DefBSD” prefix tells the command you want a particular format for the output.
f. This command “ps” shows you all the programs running on the machine you’re working on that you have launched. Examine the “command” column and look in your list for “./ex1” (that’s the process you have launched in the other shell window)
g. Look first at the number under the “PID” column. This number is called the process ID. When a program becomes a process and is run by the OS, it is assigned a unique process ID. Once the process ends, the number may be reused, but while it’s running, the number is unique. Write down the process ID of your “ex1” process (in my example that’s 11372)
h. Next, examine the “STAT” field that is the state of your process at the time when you ran the “ps” command. A process can have the following statuses on a Linux system:
D uninterruptible sleep (usually IO) R running or runnable (on run queue) S interruptible sleep (waiting for an event to complete) T stopped, either by a job control signal or because it is being traced W paging (not valid since the 2.6.xx kernel) X dead (should never be seen)
Z defunct ("zombie") process, terminated but not reaped by its parent

ESE 150 – Lab 09: Operating System Basics
ESE150 – Lab 09 Page 7 of 18
i. The above list may also be combined with the following:
< high-priority (not nice to other users) N low-priority (nice to other users) L has pages locked into memory (for real-time and custom IO) s is a session leader l is multi-threaded (using CLONE_THREAD, like NPTL pthreads do) + is in the foreground process group
j. In our example, your process will have the state: “S+” meaning that the process appears to be sleeping (meaning that it’s not asking the CPU to compute anything on its behalf, instead it’s waiting for the user to entire their name!). But it’s in what’s known as “interruptible” sleep. As discussed in lecture, if the OS needed to perform another task, it could “suspend” your “ex1” process and switch over to another one that needs some time on the CPU. The “+” symbol next to the “S” indicates that the process is running in the shell in the foreground, as opposed to the background (imagine a program like a defragmenter running in the background).
k. Recall that we started our program in the shell. In Linux, all processes are “started” by another process. We can see which “process” started “ex1” by running “ps” in the following way: ps -f -o pid,args --forest (Note: “pid,args” should be the literal characters. This is not something you should be substituting with numbers from your process id.)
l. This will output a “process hierarchy” or “tree” something like the following:
PID COMMAND 35640 -bash 11372 \_ ./ex1 (You will likely see a second bash shell. It’s a tree, so there can be many leaves if you have many things running.)
m. This tells us that the “parent” process (the one that started my “ex1”) has the process ID: 35640, and it also tells me it was a “bash” shell that started it. Which makes sense, the shell we’re running (bash) is itself a process. A “child” of that process is my program: ex1
n. When the Linux OS is given control over the CPU, there is a single user that runs all the programs (like starting up the GUI, turning on the network, etc), called “root.” The user “root” is the superuser of the system (the all powerful administrator). Root basically is the operating system itself! If you type in command: ps –fu root You’ll see all the processes that “root” is running right now. In fact, you can see the processes started by “all” the users on a Linux system by typing in ps -au
ESE 150 – Lab 09: Operating System Basics
ESE150 – Lab 09 Page 8 of 18
You can scroll back up and look for process “1” that’s the first process the OS runs when it first comes on. You can learn a lot about Linux if you follow this path of how programs are started!
o. Submit a screenshot of your program running (when you used ps) & EXPLAIN what your showing, e.g. what process started your process, etc.
6. Sending a signal to a process
a. When a shell starts a process on Linux, it needs, on occasion, to send a signal to it, in fact that’s how the OS communicates with your process. The signal can be something like…”hey, I’m going to interrupt you…” or “its time for you to end”. We can use a program to send a signal to our process manually. This program is delightfully called: “kill”
b. Typing the following will send a signal to your process telling it to end immediately: kill -9 35640 Here, you must replace the number 35640, with your “ex1” process ID for this to work. Notice that in your other terminal (where the program was running), it now indicates that the program was killed. You can actually write your programs to receive and handle different signals from the OS, sort of like putting a backdoor into your program! Maybe you can make your running program give you status! Google “trap and signal” programming if you are interested!
7. Show your ps screenshot to a TA for your prelab checkoff.
Note: once typing at the Linux shell, you can use the man command (short for manual) to get more information on any Linux command. For example “man ps”. In this case it may prompt you for the manual section. Choose 1.

ESE 150 – Lab 09: Operating System Basics
ESE150 – Lab 09 Page 9 of 18
Lab Procedure: Lab – Section 1: Real time monitoring of a process and process priority • Learn how to use a monitoring process called: htop • Learn how to change the priority of a process using “nice” • Learn how to run a program in the foreground and background of the shell 1. The monitor at your workstation is connected to two computers, a Windows machine and a Linux
machine. If it is not already on the screen, switch the monitor’s source to display the Linux machine. a. Login to the Linux machine using your seas username and password b. Open up a Linux terminal (use the “start” menu to find the terminal) c. The Linux terminal will open up the “BASH” shell by default; when it is awaiting your
commands, the “prompt” should look something like this: tfarmer@plus:~>
d. The “prompt” above tells you your “username”, the machine’s name (plus in the case above) and the directory on the machine you are working in: “~” is an abbreviation for your personal home folder on the Linux machine
2. Create a new program with an infinite loop a. Change to the directory where you were working in prelab
cd ~/ese150_lab9 b. Create a new folder for this program:
mkdir ex2 (this creates a folder named: ex2 under ese150_lab9) cd ex2
c. Create a new C-program in the nano editor, by typing: nano ex2.c
d. In the editor, type or copy/paste the following code: #include <stdio.h> int main () { int i = 0 ; printf ("Starting Example #2 Program...\n") ; while (1) { i=i+1 ; } }
e. The program above will loop “forever” adding 1 to a variable i for all eternity J f. Save the program, compile it (using commands similar to those from the previous section),
and run it as follows: ./ex2
3. Monitor the process in the other terminal window (as you did in the last section):
ESE 150 – Lab 09: Operating System Basics
ESE150 – Lab 09 Page 10 of 18
a. Look at the process by issuing the command: ps –u
b. It should return a list of your processes, but something like this: USER PID %CPU %MEM VSZ RSS TTY STAT START TIME COMMAND tfarmer 6750 100 0.0 4068 652 pts/445 R+ 00:40 0:02 ./ex2
c. Look for your “ex2” process: the one shown above has process # 6750 d. Examine the “STAT” column and notice this process is by no means sleeping! It is in a
running state, in fact look at the “%CPU” column, it is at 100%! i. Your ex2 process is keeping the CPU busy 100% of the time, this isn’t actually good.
But your program has an infinite loop within it, so it is not possible for the CPU to put it to sleep. Eventually, it will begin slowing the machine down considerably!
4. Monitor the process in “real time” • “ps” shows you a snapshot of your process at the time when you run ps • Often, it is useful to see your process changing its status in real time • There is a utility known as “top” and another more improved version called “htop” a. In the terminal not running your “ex2”, type the following command:
htop
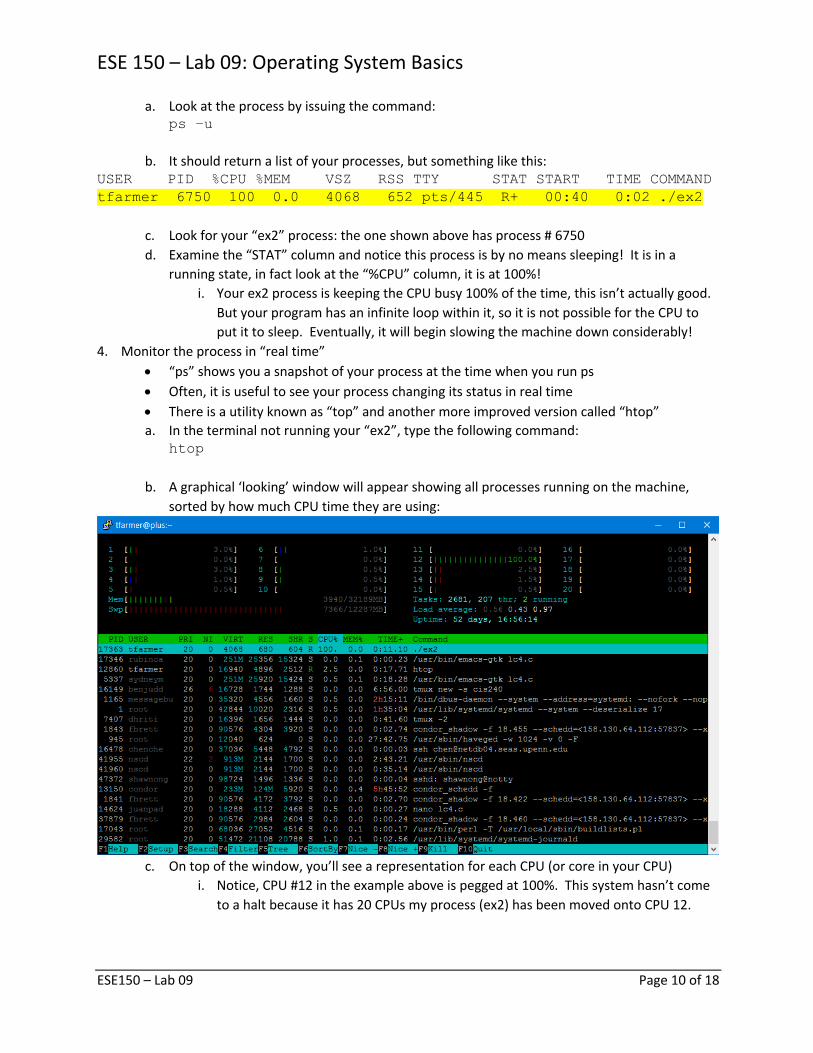
b. A graphical ‘looking’ window will appear showing all processes running on the machine, sorted by how much CPU time they are using:
c. On top of the window, you’ll see a representation for each CPU (or core in your CPU)
i. Notice, CPU #12 in the example above is pegged at 100%. This system hasn’t come to a halt because it has 20 CPUs my process (ex2) has been moved onto CPU 12.
ESE 150 – Lab 09: Operating System Basics
ESE150 – Lab 09 Page 11 of 18
d. You’ll notice your process (ex2) is at the top of the list. This list is ordered by CPU % usage. Processes using the most CPU time are on the top of the list
e. In the other window, where ex2 is running, press <ctrl> C i. This sends a signal to your process to STOP and it will end
f. In the HTOP window, you’ll see your process fall off the list, and the CPU will get back to normal!
g. Some other things to notice about HTOP: i. On the top, you can see how many “tasks” or “processes” are running on all your
CPUs (2,681 in the example shown). ii. You can also see the throughput of the CPU
iii. You can even see how many processes are ACTUALLY running---only 2 iv. You can see how long the system has been turned on! (uptime)
h. The menu along the bottom of the screen lets you send signals to processes using keystrokes (instead of using the command kill)
i. In the terminal not displaying htop, re-run ex2 as follows: ./ex2 i. Once ex2 reappears in the htop window, use the up and down arrow keys to
navigate to highlight it ii. Press the button that sends a kill signal, and press enter
iii. You should see in the other terminal that ex2 has been terminated! 5. Changing the priority of a process
• As discussed in lecture, the operating system can use several algorithms to schedule time for processes on a CPU
• One algorithm is simply “round robin,” giving each process that is running a little time on the CPU and rotating through the list of processes that require time
• Another is by assigning a “priority” to each process and then letting processes with the highest priority run on the CPU before lower priority processes, or perhaps letting them run longer on the CPU.
• In Linux you have some control over the priority of your process, this control is called a processes “niceness”.
a. In one window, keep your “htop” utility running b. In the other terminal window, start your program ex2 c. Your process should quickly reach 100% CPU time
i. But look also at the column labeled: “PRI” and “NI” ii. PRI means priority. By default all programs you run from the shell get the priority of
“20” in Linux. This # can range from 0 to 39. A user cannot set this value directly, the kernel assigns this to running processes. In the following steps, it will become clearer which priority values mean more execution time: having a higher number or a lower number for priority.
iii. NI indicates the “niceness” of a process. By default all programs get a niceness of 0. They can range from 0 to 19. This is a value a user can set for any process they own.
iv. The Priority of a process is calculated by adding 20 + NI d. Next in the terminal where ex2 is running, press the button <ctrl> Z

ESE 150 – Lab 09: Operating System Basics
ESE150 – Lab 09 Page 12 of 18
i. Quickly look over to the “htop” window, notice your processes state is changing! ii. Its no longer taking up 100% of the CPU
iii. You’ll notice its status is now “T” – you have manually suspended your process iv. Now, type the command: bg v. This will start your process back up and run it in the background. Notice that
because it is now running in the background, you can still type into the terminal e. Alter the “niceness” of your running program by typing:
renice –n 19 –p (fill in your processes number here) Look carefully at htop, at the Priority field and the Nice field. Does it add up?
f. Start another instance of your process, but with a different priority using the NICE command:
nice -18 ./ex2 & (the & starts your process in the background) • Look carefully at the htop and compare the processes priority. • Also look at the CPU’s status, notice the OS assigned your processes to two free
CPUs Start yet another instance of your process: nice -16 ./ex2 & Continue this process (lowering the niceness value each time) until you fill up all your CPUs (or run out of niceness levels). What happens when all your CPUs are filled and two processes have the same priority? Who wins? Which priority is better to have (gets more runtime)? A high or low #?
• Take a screenshot of your HTOP command (press <print screen>) • Save your screenshot for submission with the lab. You will also need to
submit an explanation of how this htop output reflects the different niceness values
• Try “re-nicing” a process to a lower priority (ie, higher niceness) using the renice command (see step e)
g. Lastly, kill all of your “ex2” programs; there should be many of them running. You can do this via the kill command (discussed in prelab), or by using the HTOP program to send them a KILL signal.
h. Stop the htop program (you can simply use Ctrl+C or you can use the kill command in the other terminal window.)

ESE 150 – Lab 09: Operating System Basics
ESE150 – Lab 09 Page 13 of 18
Lab – Section 2: Monitoring Process Concurrency • Observe how programs run concurrently on your computer 1. Create a directory pi under ese150_lab9 and change to that directory. Type the following into the window that was running ex2:
cd .. (this brings you one folder up: ese150_lab9) mkdir pi (this creates a folder named: pi under ese150_lab9) cd . (this changes to the new directory)
2. Copy over pi.c from ~ese150/lab9: cp ~ese150/lab9/pi.c . 3. Read through the pi.c code. [hint: you can bring it up in an editor like nano as you did on earlier
parts; or you can use a command like more pi.c to browse through it on a terminal.] The program iteratively estimates pi, periodically printing out its current estimate. a. note what it prints at each reporting interval b. note the default label is set to the pid c. note options to control label, reporting interval, and iterations
4. Compile the pi program: gcc –o pi pi.c 5. Restart htop in a separate window 6. Run the program to see what it does: ./pi 7. Run the program twice in series: ./pi ; ./pi
The semicolon tells the shell that the first command has ended and what follows is another command to be executed after the first command completes.
8. Capture a screen shot of the output from running the above command. 9. From htop and from the printed output, how do you know that the processes for the two executions
of pi run in series? 10. Run the program in background: ./pi &
The ampersand tells the shell to start the command and run it in background, immediately returning to process another command. If you don’t try typing anything while it is running behavior will look largely the same as when you ran pi without the ampersand
11. Run two instances of pi simultaneously: ./pi & ./pi & Here we see the real utility of the &; the second pi is started while the first pi is running.
12. Capture a screen shot of the output from running the above command while both pi processes are running. a. It may be necessary to quit htop to capture its output at specific point in time
13. Based on both what you see on htop and what you see on the console output: a. Explain how you can tell that the instances of pi are running simultaneously. b. Are the processes running on the same or different processors? Explain how you can tell.

ESE 150 – Lab 09: Operating System Basics
ESE150 – Lab 09 Page 14 of 18
Lab – Section 3: Monitoring the memory consumption of a process • Learn how to use “ps” to see if there is a memory leak in a program
• Memory primer: When a program starts on an OS, it is given a small segment of the computer’s
RAM to work with. RAM is sometimes called “physical” memory as it is a physical chip inside the system and is finite in quantity.
• Remember that the job of an OS is to “virtualize” the hardware, so that each process or program thinks it is the only one running on the CPU and has access and use of all the memory available to the CPU.
• If a program goes beyond the amount of physical memory the OS has given it, the OS can provide it more memory, called “virtual memory” (as opposed to “physical” memory). Virtual memory is the idea of using a small piece of the hard drive (not RAM, but the actual slow hard drive) to act as if it is RAM! This type of memory is considerably slower, but your program won’t notice a difference…it will just run slower.
• In this section, we’ll see if we can write a program that will “exhaust” the amount of physical RAM that a program gets to have access to, and see what happens when it does.
• When you write a program in C, you can ask the OS for more memory to store information, using a function called: “malloc()” which stands for “memory allocator”. If the OS has the space, it will give you the memory, if it does not, it will simply tell your program that there is no memory left.
• Normally a good programmer will return the memory that the memory allocator has provided to it using a function called “free().” If a programmer forgets to do this, the program begins to run out of memory, as there isn’t any more left! We call this a memory leak.
• In this section, we’ll also see how to monitor a process and see if it is “leaking” memory.
1. Create a new program that requests memory from the OS…in a way that is out of control a. Create a new folder ex3 under ese150_lab9 and change to that directory. b. Create a new C-program in the nano editor, by typing:
nano ex3.c c. In the editor, type or copy/paste the following code:
#include <stdio.h> #include <stdlib.h> #include <unistd.h> #define SIZE 100000 int main () { int *a, *b, *c ; int totalloc=0; printf ("Starting Example #3 Program...\n") ; while (1) { // request memory from the OS
ESE 150 – Lab 09: Operating System Basics
ESE150 – Lab 09 Page 15 of 18
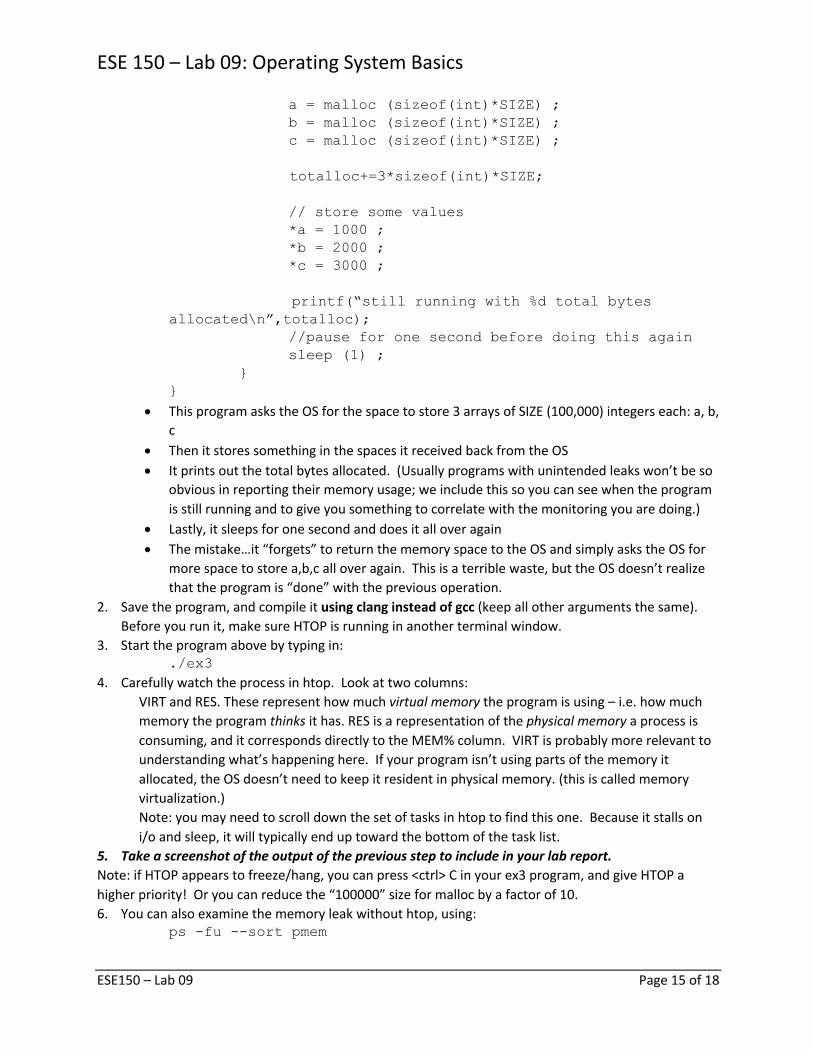
a = malloc (sizeof(int)*SIZE) ; b = malloc (sizeof(int)*SIZE) ; c = malloc (sizeof(int)*SIZE) ; totalloc+=3*sizeof(int)*SIZE; // store some values *a = 1000 ; *b = 2000 ; *c = 3000 ; printf(“still running with %d total bytes allocated\n”,totalloc); //pause for one second before doing this again sleep (1) ; } }
• This program asks the OS for the space to store 3 arrays of SIZE (100,000) integers each: a, b, c
• Then it stores something in the spaces it received back from the OS • It prints out the total bytes allocated. (Usually programs with unintended leaks won’t be so
obvious in reporting their memory usage; we include this so you can see when the program is still running and to give you something to correlate with the monitoring you are doing.)
• Lastly, it sleeps for one second and does it all over again • The mistake…it “forgets” to return the memory space to the OS and simply asks the OS for
more space to store a,b,c all over again. This is a terrible waste, but the OS doesn’t realize that the program is “done” with the previous operation.
2. Save the program, and compile it using clang instead of gcc (keep all other arguments the same). Before you run it, make sure HTOP is running in another terminal window.
3. Start the program above by typing in: ./ex3
4. Carefully watch the process in htop. Look at two columns: VIRT and RES. These represent how much virtual memory the program is using – i.e. how much memory the program thinks it has. RES is a representation of the physical memory a process is consuming, and it corresponds directly to the MEM% column. VIRT is probably more relevant to understanding what’s happening here. If your program isn’t using parts of the memory it allocated, the OS doesn’t need to keep it resident in physical memory. (this is called memory virtualization.) Note: you may need to scroll down the set of tasks in htop to find this one. Because it stalls on i/o and sleep, it will typically end up toward the bottom of the task list.
5. Take a screenshot of the output of the previous step to include in your lab report. Note: if HTOP appears to freeze/hang, you can press <ctrl> C in your ex3 program, and give HTOP a higher priority! Or you can reduce the “100000” size for malloc by a factor of 10. 6. You can also examine the memory leak without htop, using:
ps -fu --sort pmem

ESE 150 – Lab 09: Operating System Basics
ESE150 – Lab 09 Page 16 of 18
Lab – Section 4: Observe Process Virtualization • Use the skills and understanding you have developed in the previous sections of the lab to
observe processes interleaving on processor cores With multiple physical process cores, our modern machines can often run each of the active processes on a physical core. Nonetheless, the machines are still capable of supporting more active processes than physical processor cores. Unix also allows us to connect the output of one running program (process) to the input of another using the pipe construct (denoted with a vertical bar |). This is often a useful way to compose programs. It is also a way to run several processes simultaneously.
1. Copy over count.c, add1.c, and endpipe.c from ~ese150/lab9: cp ~ese150/lab9/count.c . (similar for the other 3)
2. Compile the three simple programs (using gcc) so you get executables count, add1, and endpipe 3. count.c outputs values form 0 to a provided command-line argument.
Try: ./count 10 Take a look at the code in count.c.
4. add1.c simply adds 1 to its inputs. Try: ./count 10 | ./add1 This pipes the output of count to add1. Take a look at the code in add1.c; in addition to adding 1, it prints out some progress code on stderr (an output stream that is not being piped to the next program, so will typically show up on your console).
5. endpipe.c prints out its value with some more formatting Try: ./count 10 | ./add1 | ./endpipe Take a look at the code in endpipe.c.
6. You can make the pipe longer by including more add1 routines: Try: ./count 10 | ./add1 | ./add1 | ./endpipe
7. By generalizing this, you can create arbitrarily long pipelines with any number of add1’s in the middle. In particular, this lets you start many processes running simultaneously. By looking at the outputs showing which process is running when, you can see when each process performs an operation.
8. Create a large chain with more processes (add1’s) than there are processors on your computer (try for twice as many).
9. By monitoring the output, collect evidence that all the processes are running simultaneously, even though there are more processes than processors. That is, you want to collect evidence that shows that the processes are not just being assigned to a single processor and running from start to finish, but rather multiple processes are sharing a single processor core and are being swapped in and out of that core to allow the set of processes in the pipeline to make progress simultaneously.
a. This may require a large count to give processes time to start and run.

ESE 150 – Lab 09: Operating System Basics
ESE150 – Lab 09 Page 17 of 18
b. For convenience, you may want to put your unix command line(s) in a file that you can edit with an editor and then use the source command to have it run the unix commands from the file. E.g. If you want to have 4 ./add1’s in your command to be run, make a file called script.sh, and paste the following command into it:
./count 10 | ./add1 | ./add1 | ./add1 | ./add1 | ./endpipe Then, save the script file, and run it in the terminal using the following command: source script.sh
10. Run your experiment and capture evidence of process interleaving. (part of your design task is to identify how you will be able to collect such evidence.)
11. Include your evidence in your lab report and explain how it demonstrates interleaving of processes.
Exit Checkoff: explain your experiment and your collected evidence to your TA and explain how this demonstrates process interleaving on the processor cores.

ESE 150 – Lab 09: Operating System Basics
ESE150 – Lab 09 Page 18 of 18
Postlab 1. Remotely log in to eniac as in prelab
a. Run ps –aux to determine the number processes currently in the system. i. Scan the full output just to get a sense of what’s running
ii. Use ps –aux | wc to actually get a count. wc is the word count command; with no arguments the first number it reports is the number of lines; since ps lists one process per line, this gives you the count.
b. Run nproc to determine the number of processors on eniac. c. Estimate the average number of processes per processor on eniac. d. Run ps –aur to determine the number of processes actually running at an instance in
time (again you will probably want to use the |wc trick to get the count). e. Use who (and |wc) to determine the number of users currently logged in to eniac. f. Estimate the number of users per processor.
2. Assume you have a 1 GHz processor. Assume an mp3 encoder needs 1,000 cycles per sample, and you want to sample data at 44KHz. What fraction of the processor’s compute capacity does the mp3 encoding task require?
HOW TO TURN IN THE LAB
• Submit a PDF document to the designated canvas assignment containing: o Screenshots, code, and descriptions/explanations where asked
§ Bolded and italicized o Answers to questions asked in the lab
§ Section 1: 5f, Section 2: 9 and 13, Section 3: 6, Section 4: 11 o Describe your experiment for Section 4 (i.e. step 1), include the evidence collected,
describe how the evidence demonstrates process are sharing processors. o Include Prelab and Postlab o Make sure all items are clearly labeled, screenshots are easy to read, and sections are
clearly outlined.