erwin mcewen & dana a. weiner illinois department of children & family services northwestern...
TRANSCRIPT

STRENGTHENING COMMUNITIES, FAMILIES, AND CHILDREN:
MEASUREMENT, RESOURCE DEVELOPMENT & SYSTEM PLANNING
Erwin McEwen & Dana A. Weiner
Illinois Department of Children & Family Services
Northwestern University
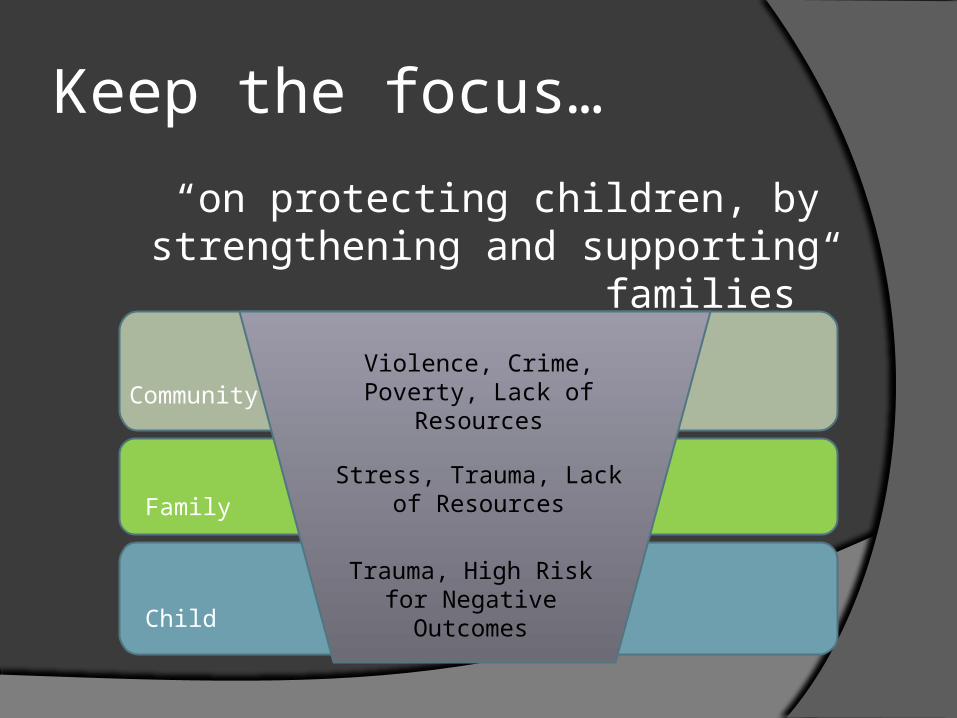
Keep the focus…
“on protecting children, by strengthening and supporting families”
Violence, Crime, Poverty, Lack of Resources
Stress, Trauma, Lack of Resources
Trauma, High Risk for Negative Outcomes
Community
Family
Child
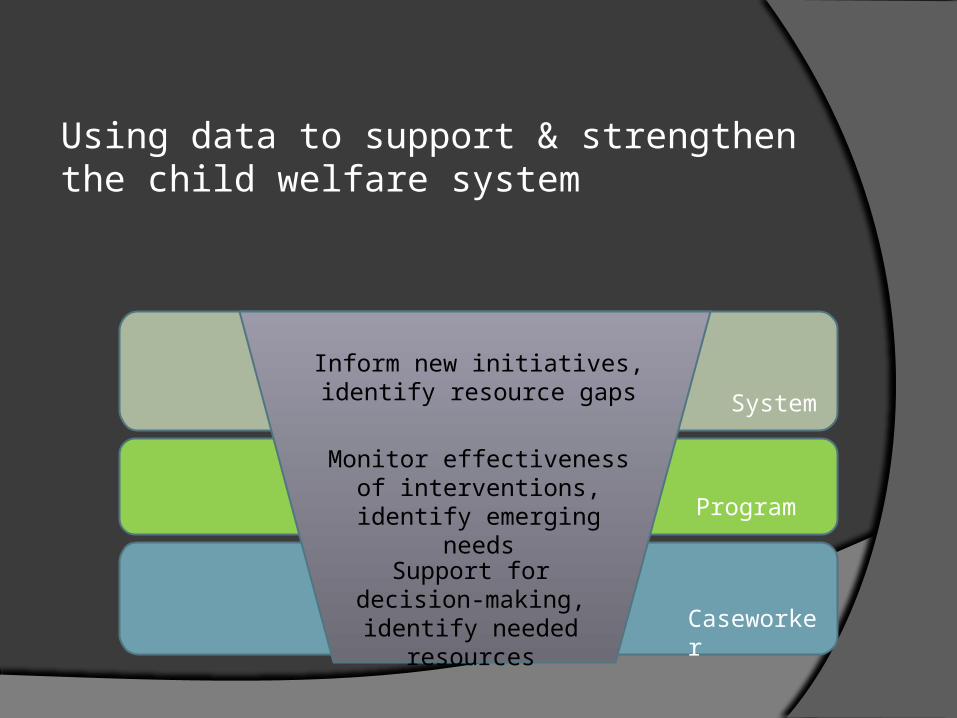
Using data to support & strengthen the child welfare system
Inform new initiatives, identify resource gaps
Monitor effectiveness of interventions, identify
emerging needs
Support for decision-making, identify
needed resources Caseworker
System
Program
Measurement for Transforming of Child Welfare Practice Evaluation considerations
Target/goalsTimingAssessment Strategies
Evaluation Targets/GoalsTargets: Casework level Service Level Agency level System levelGoals: Decision making Determining effectiveness of
interventions Continuous Quality Improvement Planning needed resources
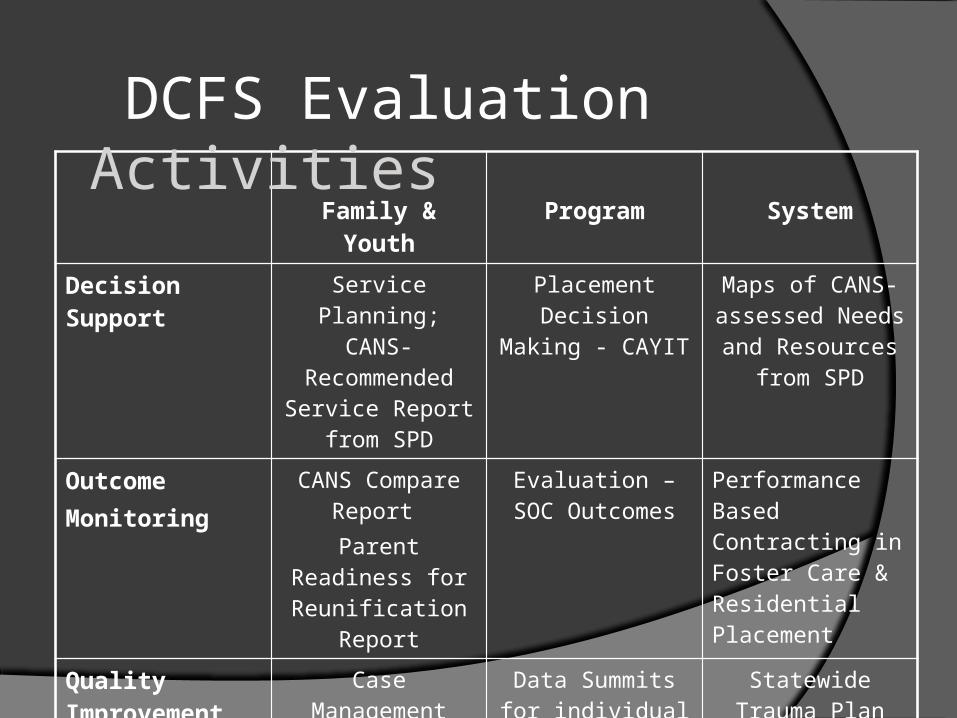
Family & Youth Program System
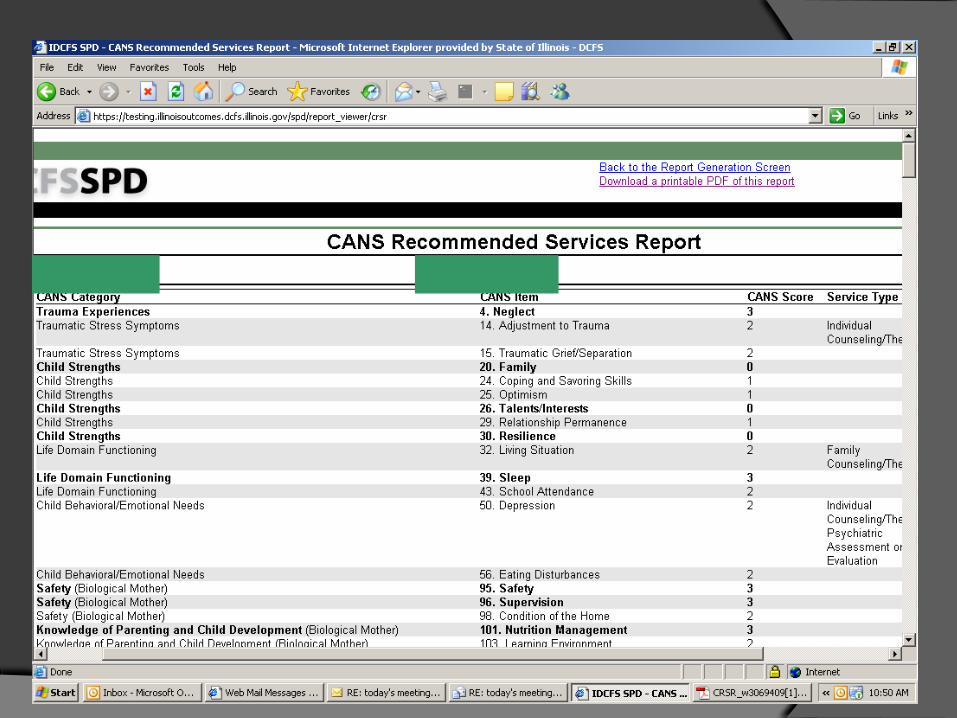
Decision Support Service Planning; CANS-
Recommended Service Report from
SPD
Placement Decision Making - CAYIT
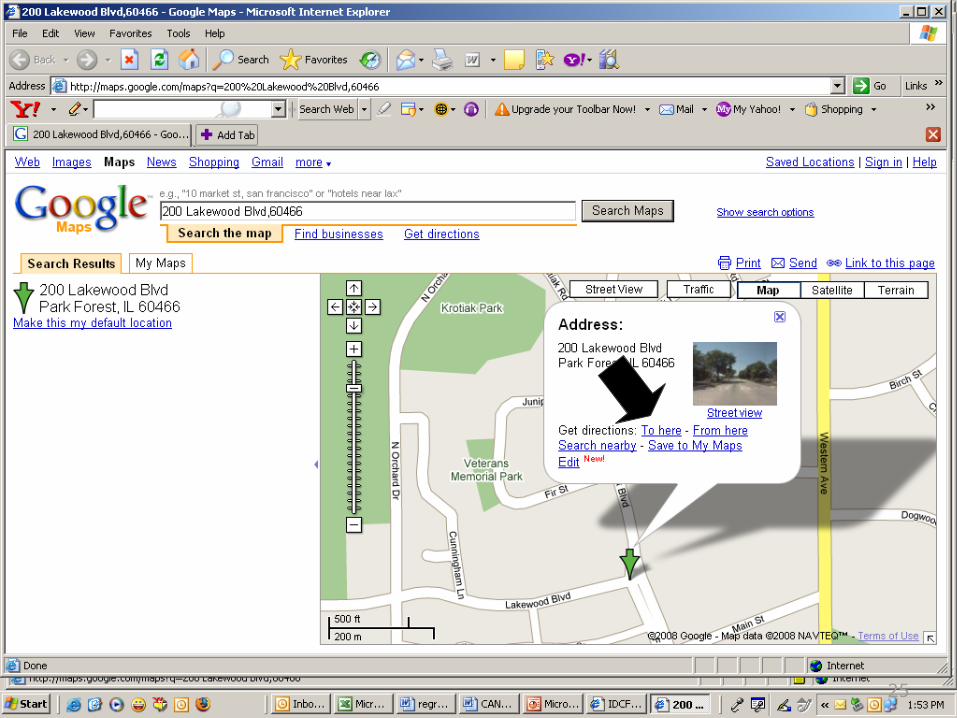
Maps of CANS-assessed Needs and
Resources from SPD
Outcome Monitoring
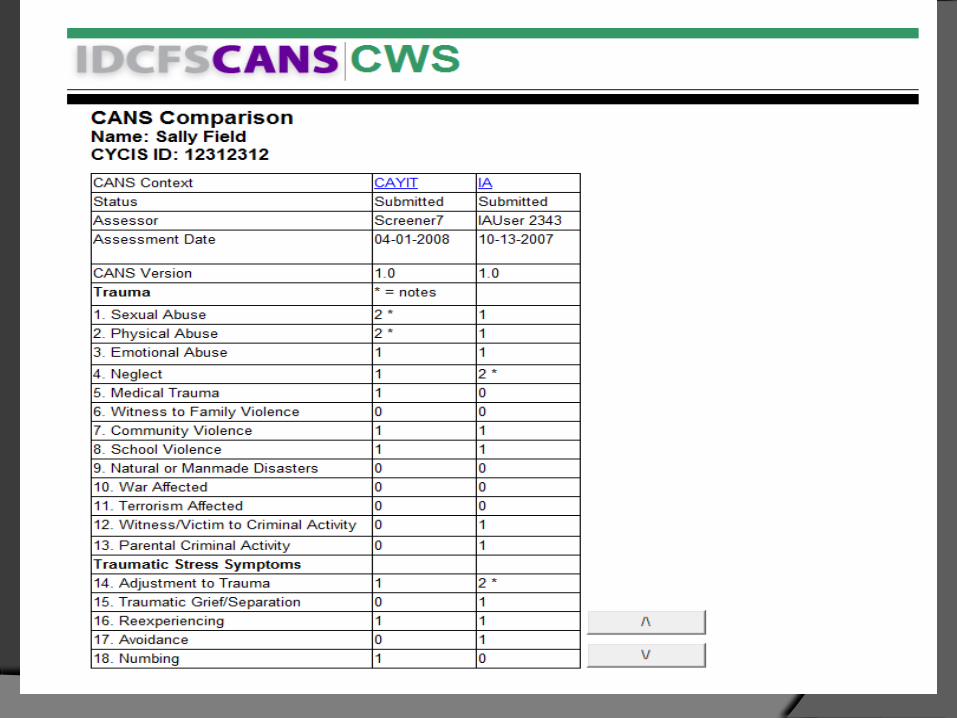
CANS Compare Report
Parent Readiness for Reunification Report
Evaluation – SOC Outcomes
Performance Based Contracting in Foster Care & Residential Placement
Quality Improvement
Case ManagementSupervision
Data Summits for individual programs
– CAYIT, IA
Statewide Trauma Plan
DCFS Evaluation Activities

Timing: Evaluation as an ongoing process Initial assessments The value of adding subsequent
measurementsObserving changePredicting outcomesGuiding treatment planning decisions
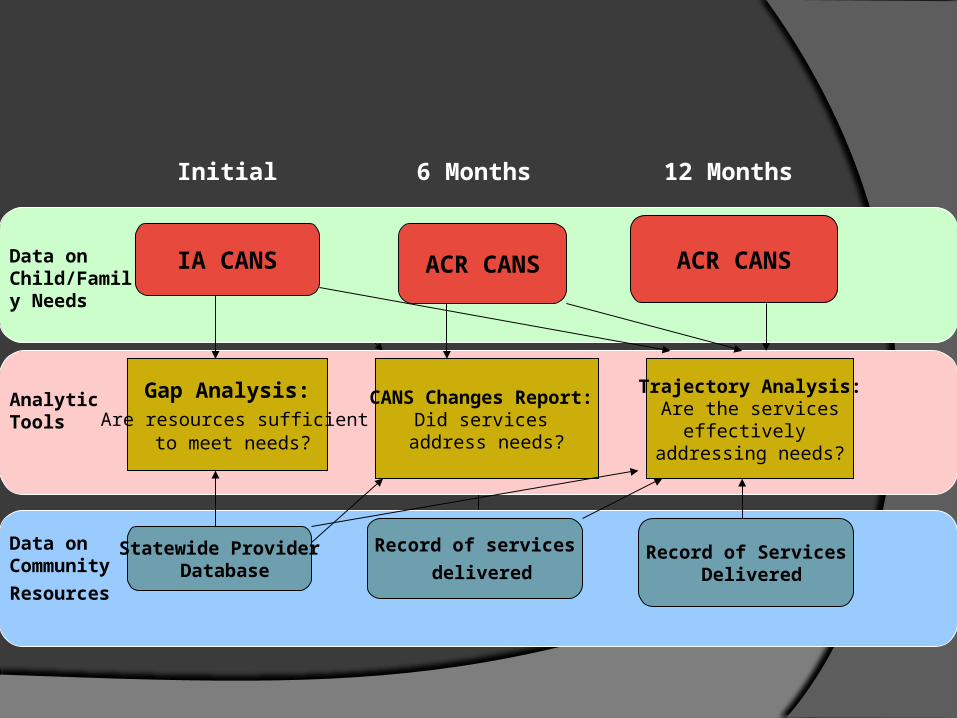
IA CANS
Statewide Provider Database
Gap Analysis: Are resources sufficient
to meet needs?
Initial
Data on Child/Family Needs
Data on Community
Resources
Analytic Tools
6 Months 12 Months
ACR CANS
CANS Changes Report: Did services
address needs?
Record of services
delivered
ACR CANS
Trajectory Analysis: Are the services
effectively addressing needs?
Record of Services Delivered
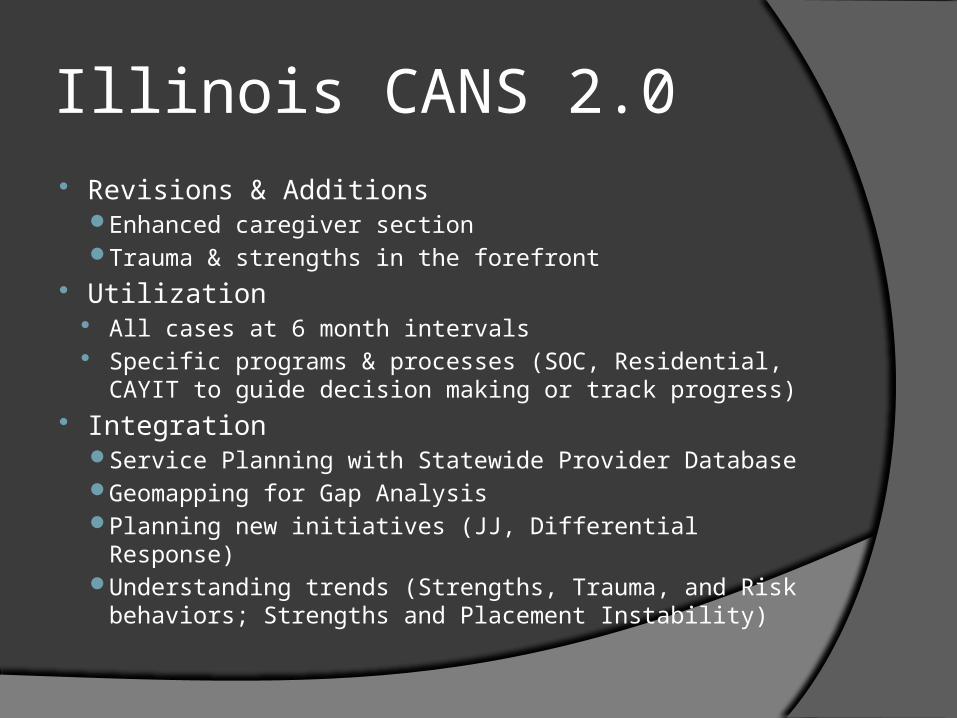
Illinois CANS 2.0 Revisions & Additions
Enhanced caregiver sectionTrauma & strengths in the forefront
Utilization All cases at 6 month intervals Specific programs & processes (SOC, Residential, CAYIT
to guide decision making or track progress) Integration
Service Planning with Statewide Provider DatabaseGeomapping for Gap AnalysisPlanning new initiatives (JJ, Differential Response)Understanding trends (Strengths, Trauma, and Risk
behaviors; Strengths and Placement Instability)

Enhanced Caregiver section incorporates: Strengthening Families protective factors:
1. Parental Resilience
2. Social Connections
3. Knowledge of Parenting and Child Development
4. Concrete Support in Times of Need
5. Social and Emotional Competence of Children
6. Healthy Parent-Child Relationships
Parent /Caregiver Commitment to Permanency Safety items
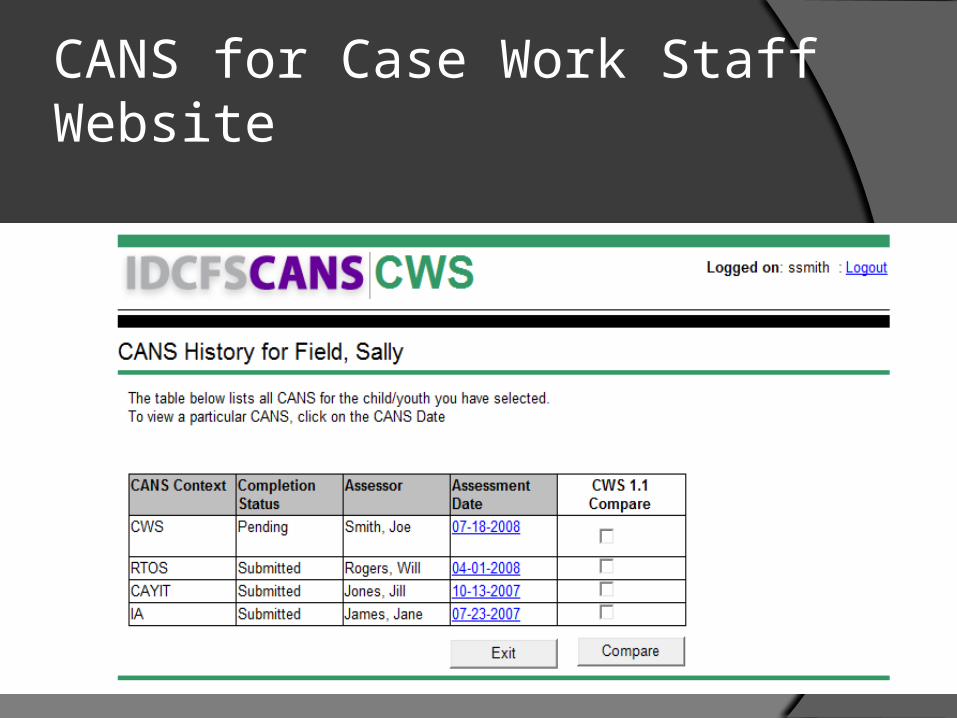
CANS for Case Work Staff Website
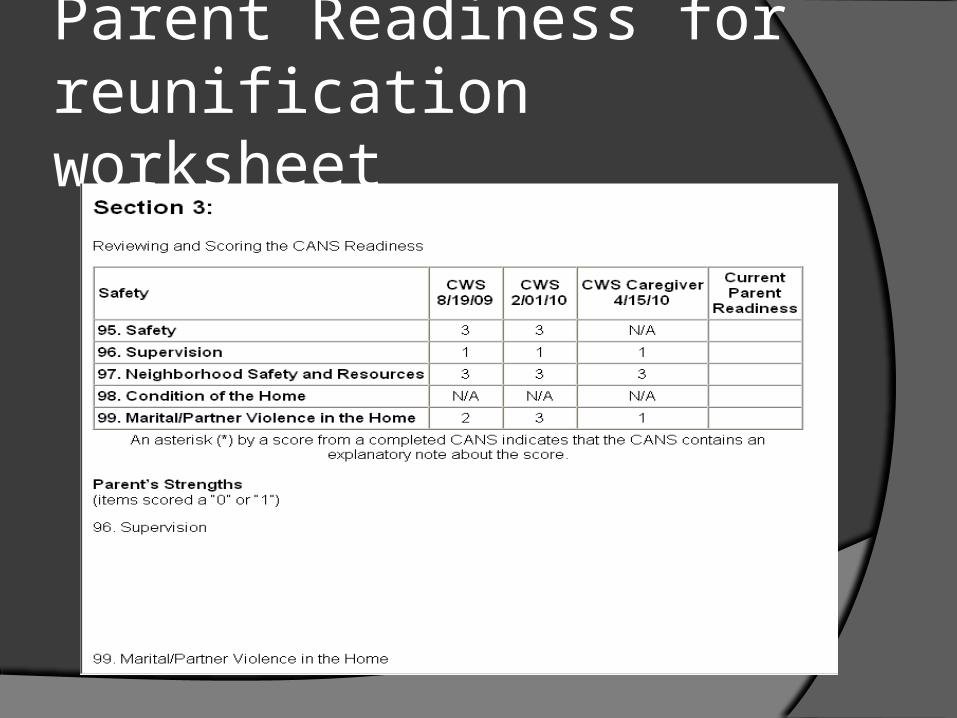
Parent Readiness for reunification worksheet
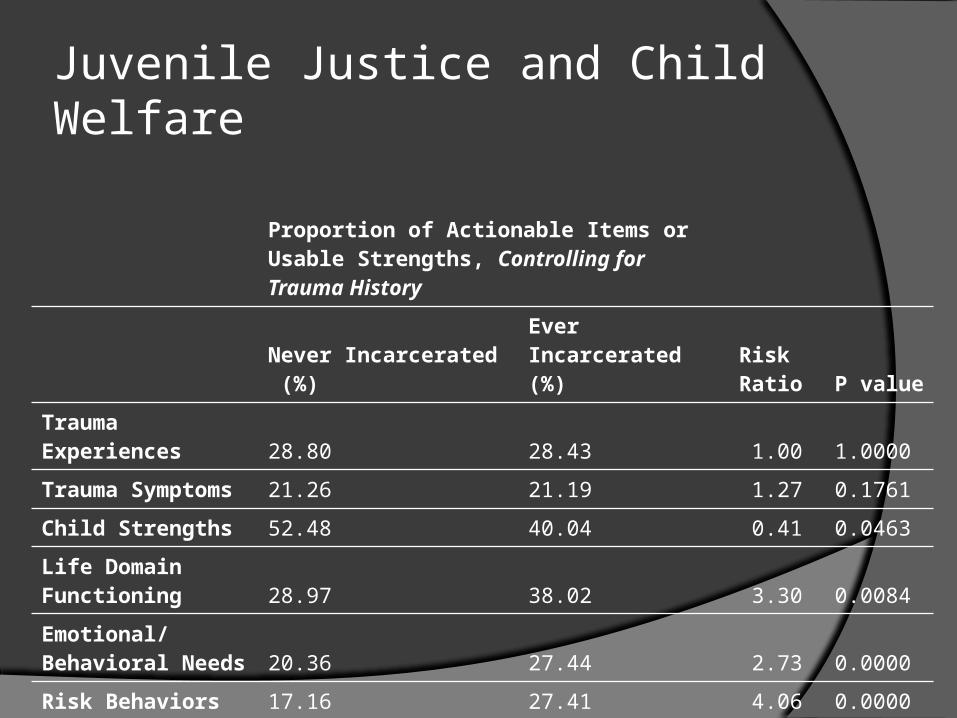
Juvenile Justice and Child Welfare
Proportion of Actionable Items or Usable Strengths, Controlling for Trauma History
Never Incarcerated (%)
Ever Incarcerated (%)
Risk Ratio P value
Trauma Experiences 28.80 28.43 1.00 1.0000
Trauma Symptoms 21.26 21.19 1.27 0.1761
Child Strengths 52.48 40.04 0.41 0.0463
Life Domain Functioning 28.97 38.02 3.30 0.0084
Emotional/Behavioral Needs 20.36 27.44 2.73 0.0000
Risk Behaviors 17.16 27.41 4.06 0.0000
Older Adolescent Items 21.24 27.08 1.87 0.0229
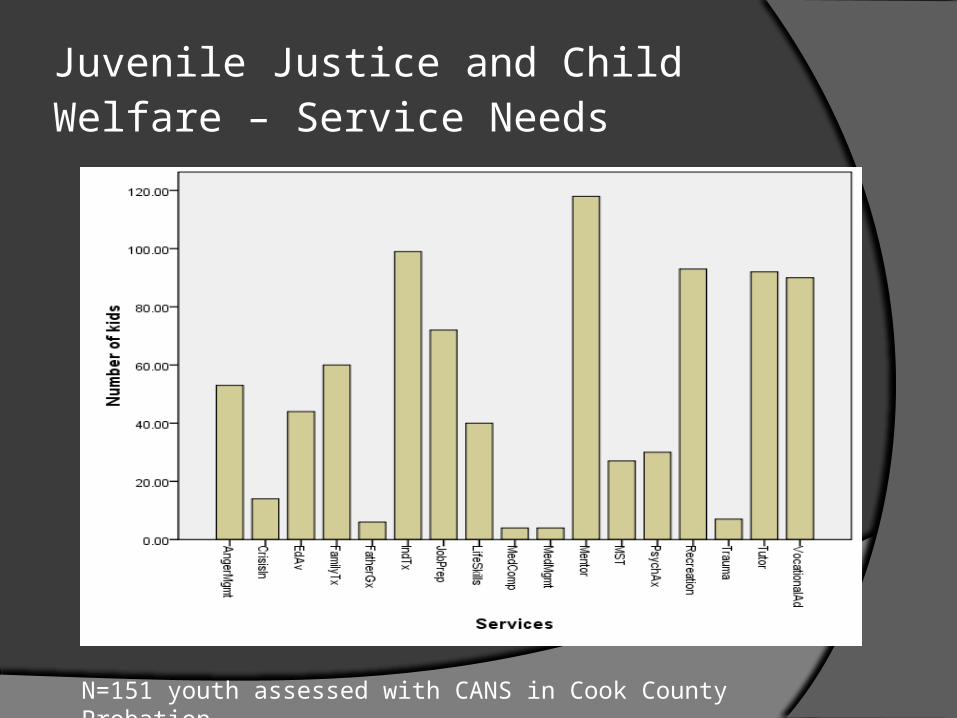
Juvenile Justice and Child Welfare – Service Needs
N=151 youth assessed with CANS in Cook County Probation
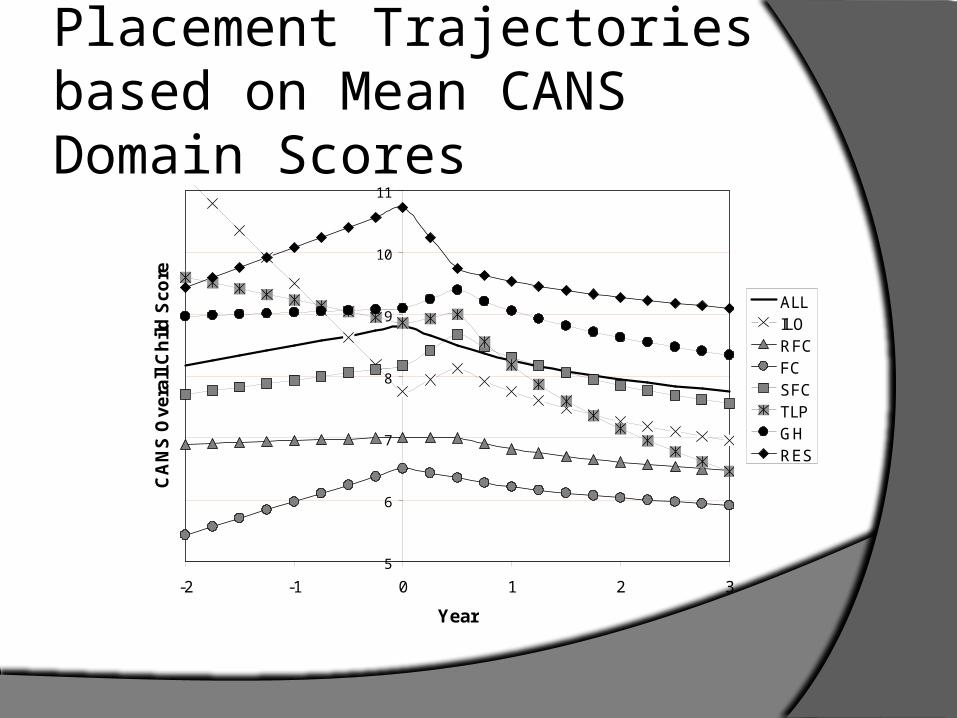
Placement Trajectories based on Mean CANS Domain Scores
5
6
7
8
9
10
11
-2 -1 0 1 2 3
Year
CA
NS
Ov
era
ll C
hil
d S
co
re
ALLILORFCFCSFCTLPGHRES
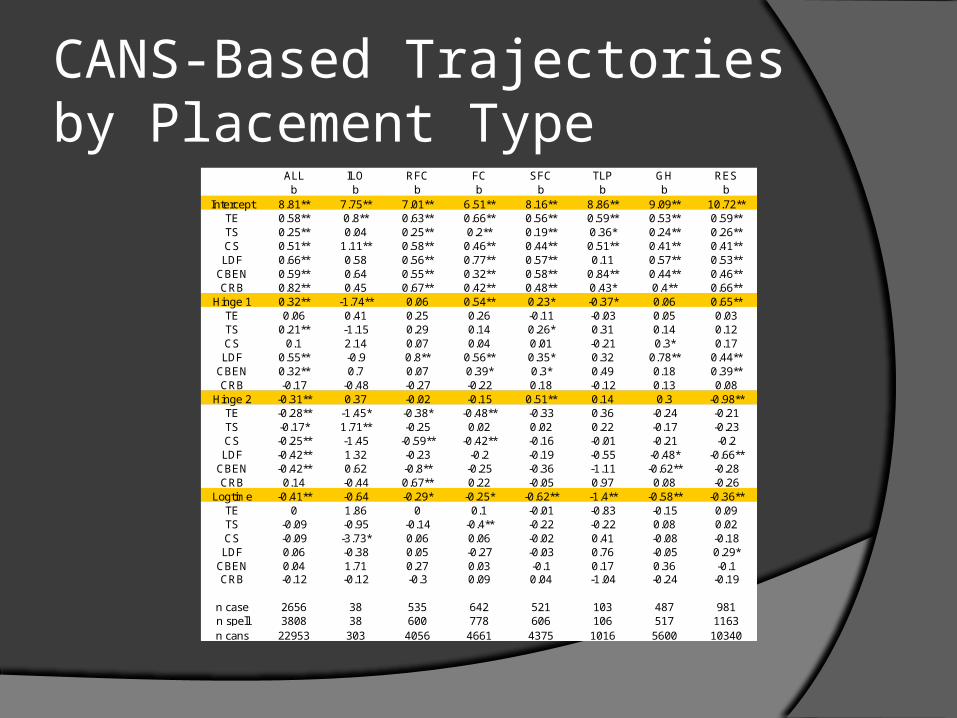
CANS-Based Trajectories by Placement Type
ALL ILO RFC FC SFC TLP GH RESb b b b b b b b
Intercept 8.81** 7.75** 7.01** 6.51** 8.16** 8.86** 9.09** 10.72**TE 0.58** 0.8** 0.63** 0.66** 0.56** 0.59** 0.53** 0.59**TS 0.25** 0.04 0.25** 0.2** 0.19** 0.36* 0.24** 0.26**CS 0.51** 1.11** 0.58** 0.46** 0.44** 0.51** 0.41** 0.41**LDF 0.66** 0.58 0.56** 0.77** 0.57** 0.11 0.57** 0.53**
CBEN 0.59** 0.64 0.55** 0.32** 0.58** 0.84** 0.44** 0.46**CRB 0.82** 0.45 0.67** 0.42** 0.48** 0.43* 0.4** 0.66**
Hinge 1 0.32** -1.74** 0.06 0.54** 0.23* -0.37* 0.06 0.65**TE 0.06 0.41 0.25 0.26 -0.11 -0.03 0.05 0.03TS 0.21** -1.15 0.29 0.14 0.26* 0.31 0.14 0.12CS 0.1 2.14 0.07 0.04 0.01 -0.21 0.3* 0.17LDF 0.55** -0.9 0.8** 0.56** 0.35* 0.32 0.78** 0.44**
CBEN 0.32** 0.7 0.07 0.39* 0.3* 0.49 0.18 0.39**CRB -0.17 -0.48 -0.27 -0.22 0.18 -0.12 0.13 0.08
Hinge 2 -0.31** 0.37 -0.02 -0.15 0.51** 0.14 0.3 -0.98**TE -0.28** -1.45* -0.38* -0.48** -0.33 0.36 -0.24 -0.21TS -0.17* 1.71** -0.25 0.02 0.02 0.22 -0.17 -0.23CS -0.25** -1.45 -0.59** -0.42** -0.16 -0.01 -0.21 -0.2LDF -0.42** 1.32 -0.23 -0.2 -0.19 -0.55 -0.48* -0.66**
CBEN -0.42** 0.62 -0.8** -0.25 -0.36 -1.11 -0.62** -0.28CRB 0.14 -0.44 0.67** 0.22 -0.05 0.97 0.08 -0.26
Logtime -0.41** -0.64 -0.29* -0.25* -0.62** -1.4** -0.58** -0.36**TE 0 1.86 0 0.1 -0.01 -0.83 -0.15 0.09TS -0.09 -0.95 -0.14 -0.4** -0.22 -0.22 0.08 0.02CS -0.09 -3.73* 0.06 0.06 -0.02 0.41 -0.08 -0.18LDF 0.06 -0.38 0.05 -0.27 -0.03 0.76 -0.05 0.29*
CBEN 0.04 1.71 0.27 0.03 -0.1 0.17 0.36 -0.1CRB -0.12 -0.12 -0.3 0.09 0.04 -1.04 -0.24 -0.19
n case 2656 38 535 642 521 103 487 981n spell 3808 38 600 778 606 106 517 1163n cans 22953 303 4056 4661 4375 1016 5600 10340

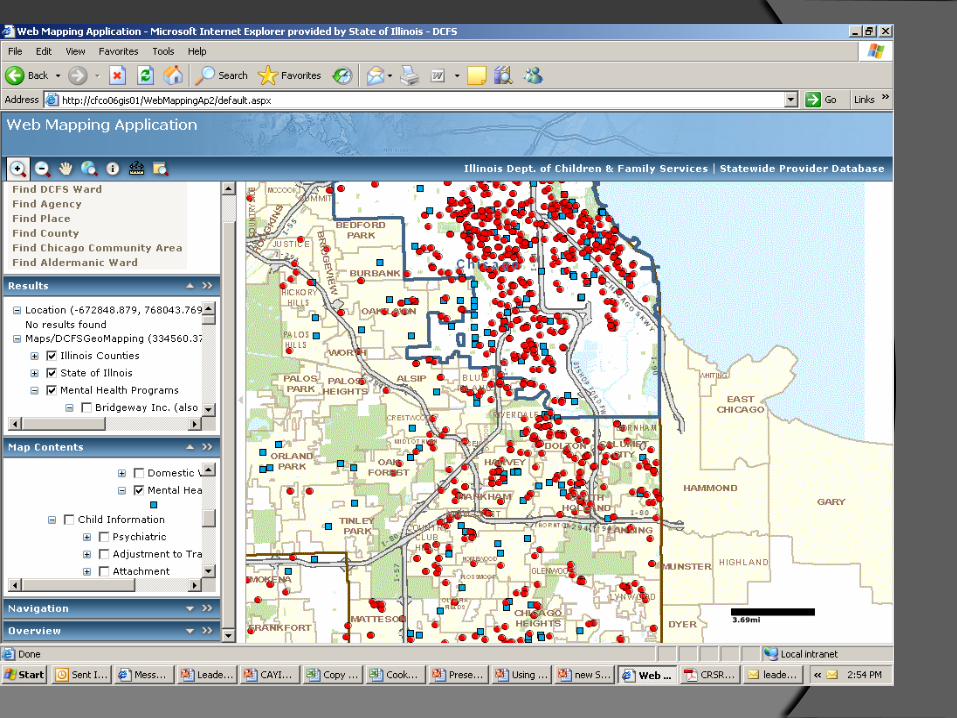
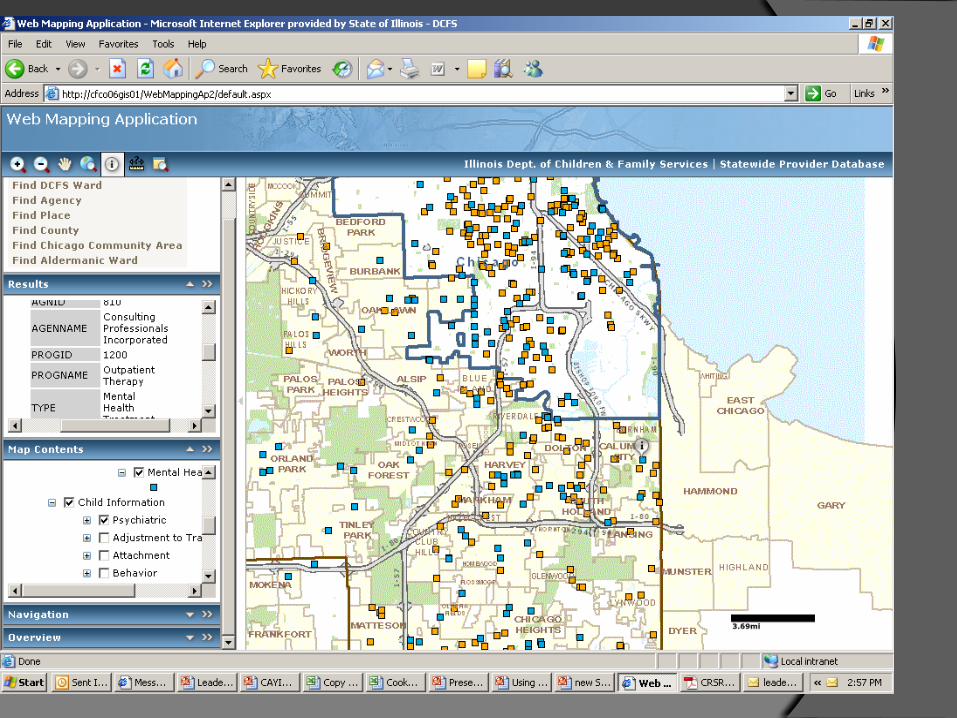
Statewide Provider Database Online Search Tool Geocoded service delivery locations Highly detailed descriptions of programs
and services Broad user base invested in helping to
maintain current data Integrated with CANS, Child Placement
Data, and Geomapping website

19

20


22

24
25

26
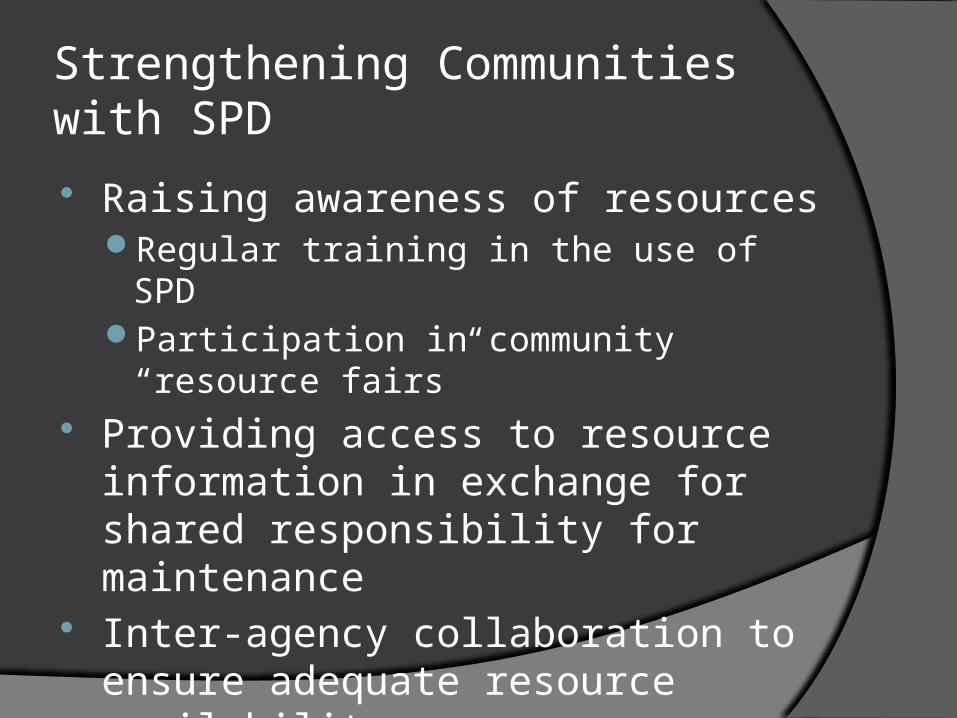
Strengthening Communities with SPD Raising awareness of resources
Regular training in the use of SPDParticipation in community “resource fairs”
Providing access to resource information in exchange for shared responsibility for maintenance
Inter-agency collaboration to ensure adequate resource availability
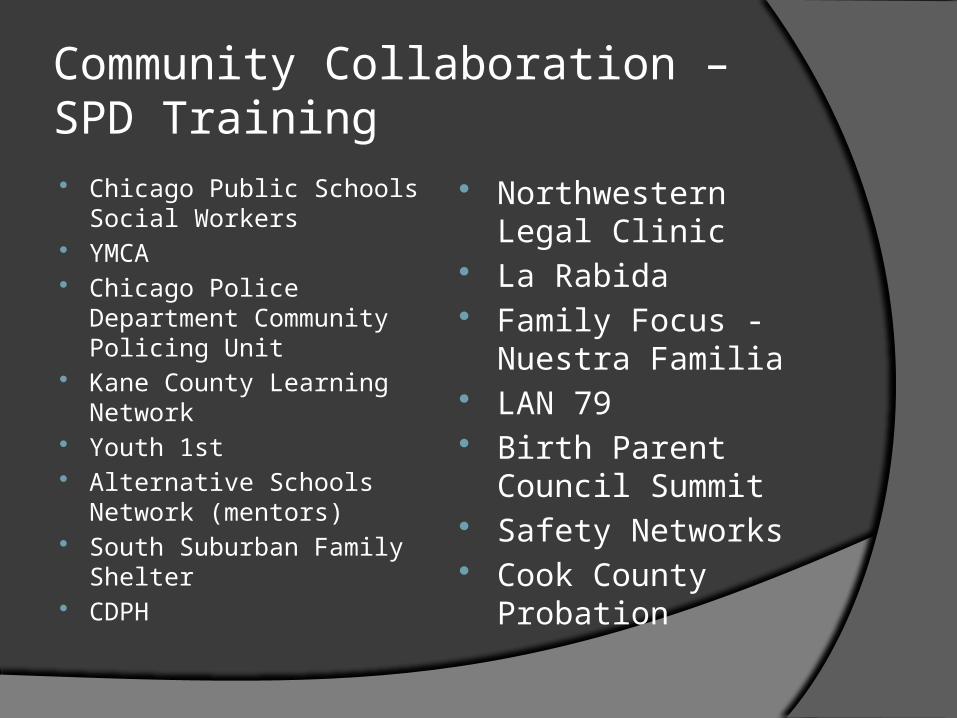
Community Collaboration – SPD Training Chicago Public Schools
Social Workers YMCA Chicago Police Department
Community Policing Unit
Kane County Learning Network
Youth 1st Alternative Schools
Network (mentors) South Suburban Family
Shelter CDPH
Northwestern Legal Clinic
La Rabida Family Focus -
Nuestra Familia LAN 79 Birth Parent Council
Summit Safety Networks Cook County
Probation


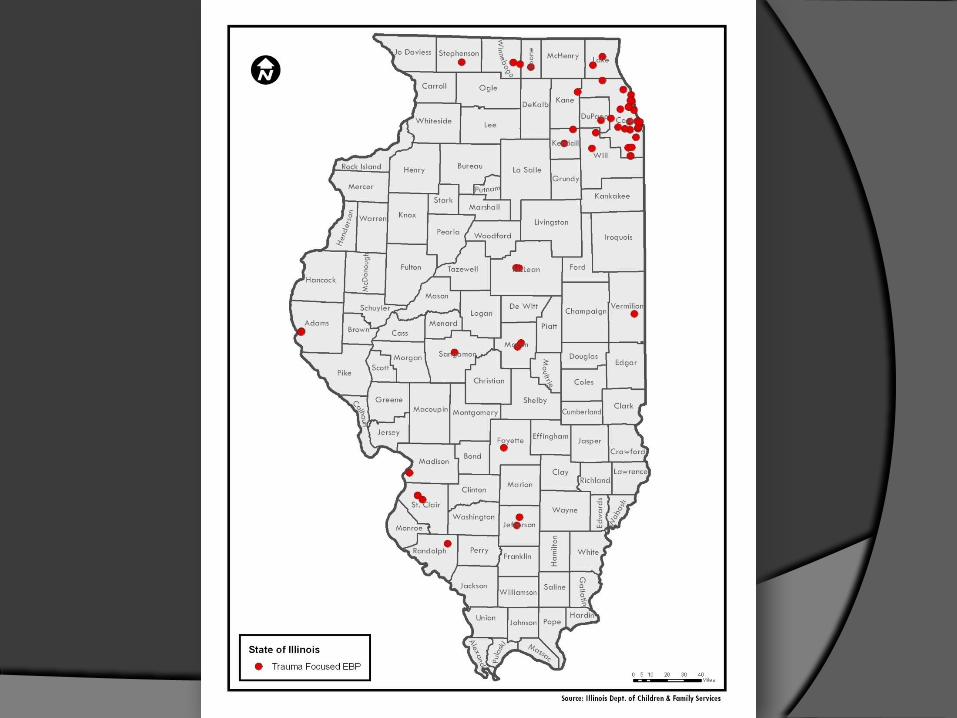
EBP Trained/Certified Staff
EBP Qualification by Type
0
50
100
150
EBP Type
# o
f s
taff
Trained 6 5 26 22 104
Certified 2 5 25 10 41
CPP CADV EMDR SPARCS TFCBT

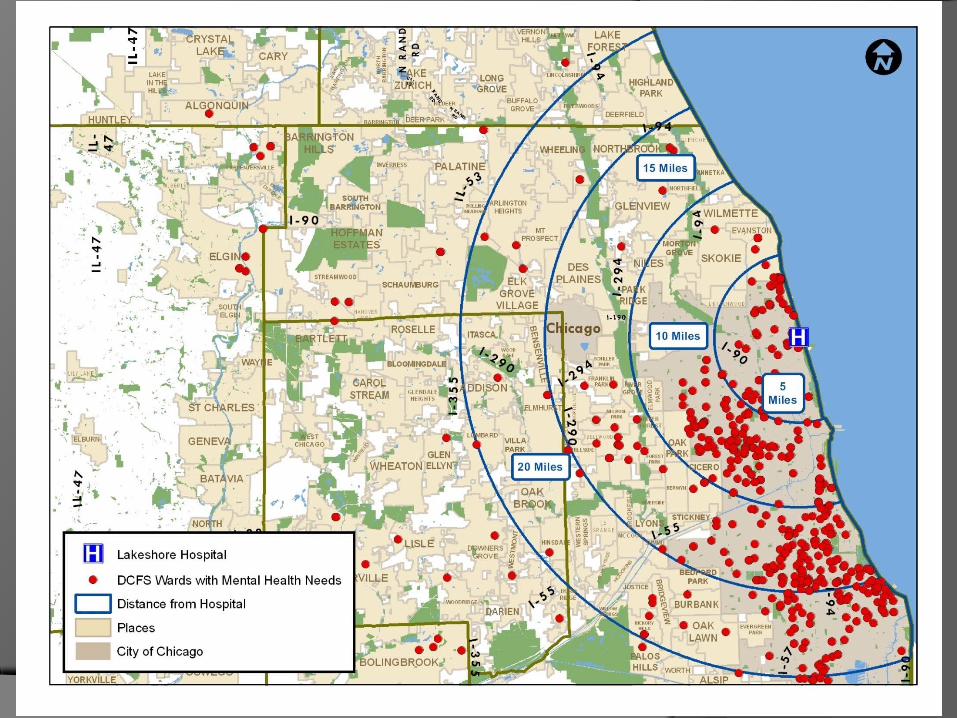
IDCFS Geomapping Website
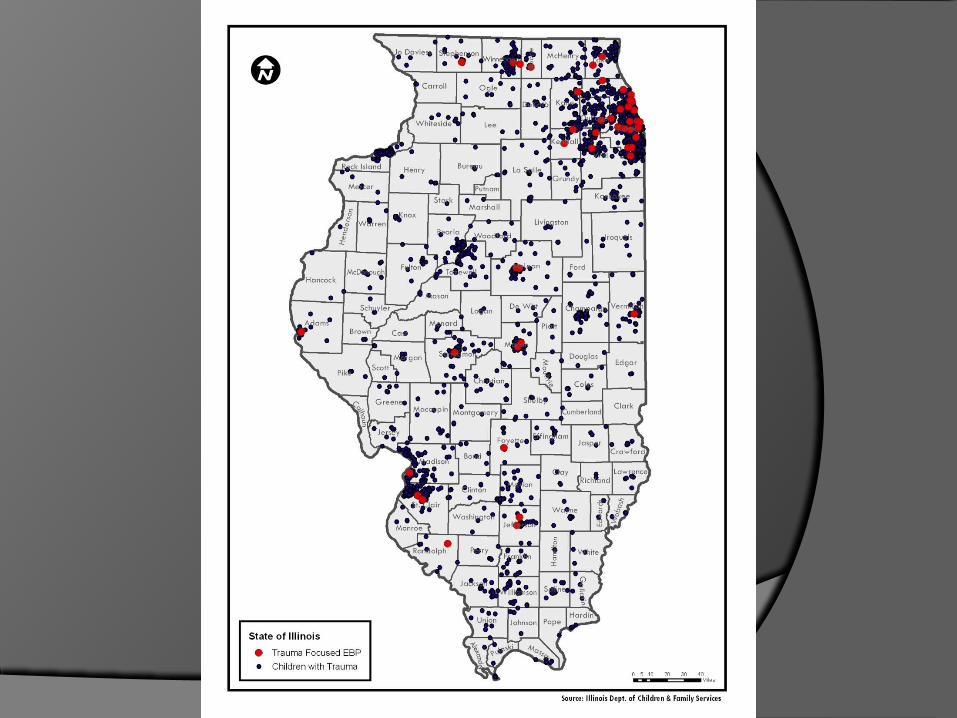


50 Cases PerSquareMile


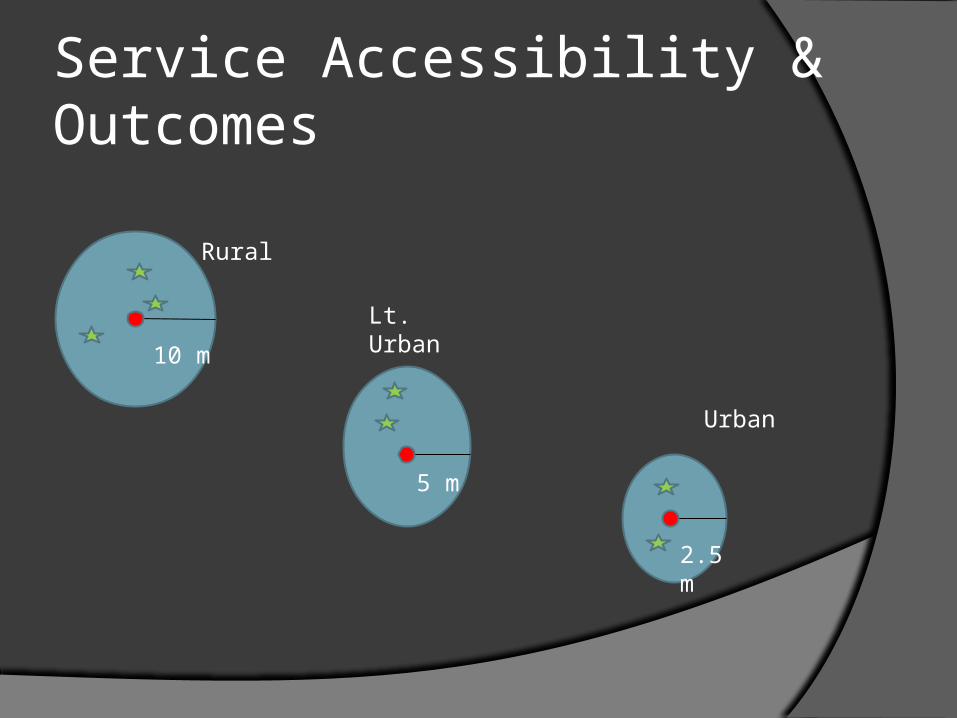
Service Accessibility & Outcomes
Rural
10 m
5 m
2.5 m
Lt. Urban
Urban


Independent variables
Age Clinical characteristics – CANS scale scores
Risk behaviorsEmotional/behavioral needsStrengthsTrauma experiencesTrauma stress symptomsAcculturationLife domain functioning
Service Accessibility
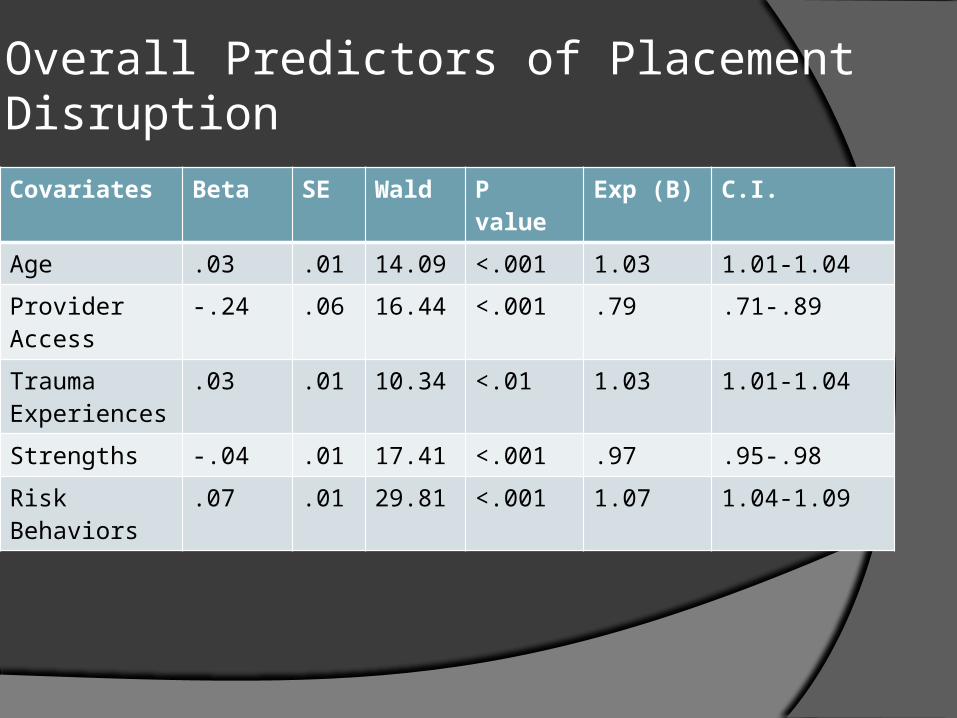
Overall Predictors of Placement DisruptionCovariates Beta SE Wald P value Exp (B) C.I.
Age .03 .01 14.09 <.001 1.03 1.01-1.04
Provider Access
-.24 .06 16.44 <.001 .79 .71-.89
Trauma Experiences
.03 .01 10.34 <.01 1.03 1.01-1.04
Strengths -.04 .01 17.41 <.001 .97 .95-.98
Risk Behaviors
.07 .01 29.81 <.001 1.07 1.04-1.09

Predictors by Land UseCovariates Beta S.E. Wal
dP Value
Exp (B)
C.I.
Rural
Access -.86 .038
5.23 <.05 .42 .20-.88
Risk Behaviors
.14 .03 27.06
<.001 1.15 1.09-1.21
Light Urban
Access -.20 .09 4.47 <.05 .82 .68-.98
Trauma Experiences
.05 .01 16.88
<.001 1.08 1.06-1.13
Functioning .08 .01 35.56
<.001 1.08 1.06-1.13
Urban
Age .04 .01 8.42 <.01 1.04 1.01-1.06
Strengths -.03 .01 5.60 <.05 .97 .95-.99
Risk Behaviors
.06 .02 9.28 <.01 1.06 1.02-1.11
Barriers to CANS implementation Technology keeping pace with
innovation Change in practice requiring an
additional tool Comfort/familiarity with data driven
decision-making
Future Directions
Coordinate between child-serving agencies using child assessment and provider data
Integrate access information, trajectory models, and other tools into contracting approaches to make efficient use of resources
Continue to educate staff on the use of data and new tools to support decision-making