errors and/or omissions, the japanese language version ... · preparation of supplementary...
TRANSCRIPT

0
This document is a summary translation of the Japanese language original version. In the event of any discrepancy,
errors and/or omissions, the Japanese language version shall prevail.
Summary of Consolidated Financial Statements (Japanese Standards)
for the first three quarters of the year ending December 31st, 2014 (Q3 2014YTD)
November 6th, 2014
Listed Company Name Coca-Cola East Japan Co., Ltd. Stock Exchange Tokyo Stock Exchange
Security Code 2580 URL http://www.ccej.co.jp
Representative title Representative Director,
President
Name Calin Dragan
Contact title Senior Executive Officer
Finance Function
Name Asako Aoyama TEL:
03(5575)3859
Scheduled date of submission of Quarterly
Report
November 11th, 2014 Schedule date of start of
dividend payment
―
Preparation of supplementary documents for quarter results None
Quarterly results briefing Yes
(Amounts of less than 1 MM yen are rounded down)
1. Consolidated Financial Results for the first three quarters of the year ending December 31th, 2014
(January 1st, 2014 – September 30th, 2014)
(1) Consolidated Results of Operations (YTD) (Percentages show year-on-year changes)
Net Sales Operating Income Ordinary Income Net Income
MM yen % MM yen % MM yen % MM yen %
Q3 2014 YTD 400,601 62.3 5,732 △29.0 5,985 △26.8 897 △94.2
Q3 2013 YTD 246,786 65.5 8,077 219.2 8,177 212.2 15,481 970.8
(Note) Comprehensive income: Q3 2014 YTD 1,436 MM yen (△91.0%) Q3 2013 YTD 15,964 MM yen (945.9%)
Net income per share Net income per share
(fully diluted)
Yen Yen
Q3 2014 YTD 7.41 7.41
Q3 2013 YTD 220.97 220.84
.
(2) Consolidated Financial Position
Total Assets Net Assets Equity Ratio
MM yen MM Yen %
Q3 2014 YTD 344,354 214,123 62.1
FY2013 314,490 216,191 68.7
(Reference) Shareholders’ equity: Q3 2014 : 213,971 MM yen
FY2013 :216,172MM yen
2.Dividends
Dividend per share
End of Q1 End of Q2 End of Q3 Year-end Annual
Yen Yen Yen Yen yen
FY2013 - 18.00 - 14.00 32.00
FY2014 - 16.00
FY2014(forecast) - 16.00 32.00
(Note) Revisions to the dividend forecast disclosed most recently None
1
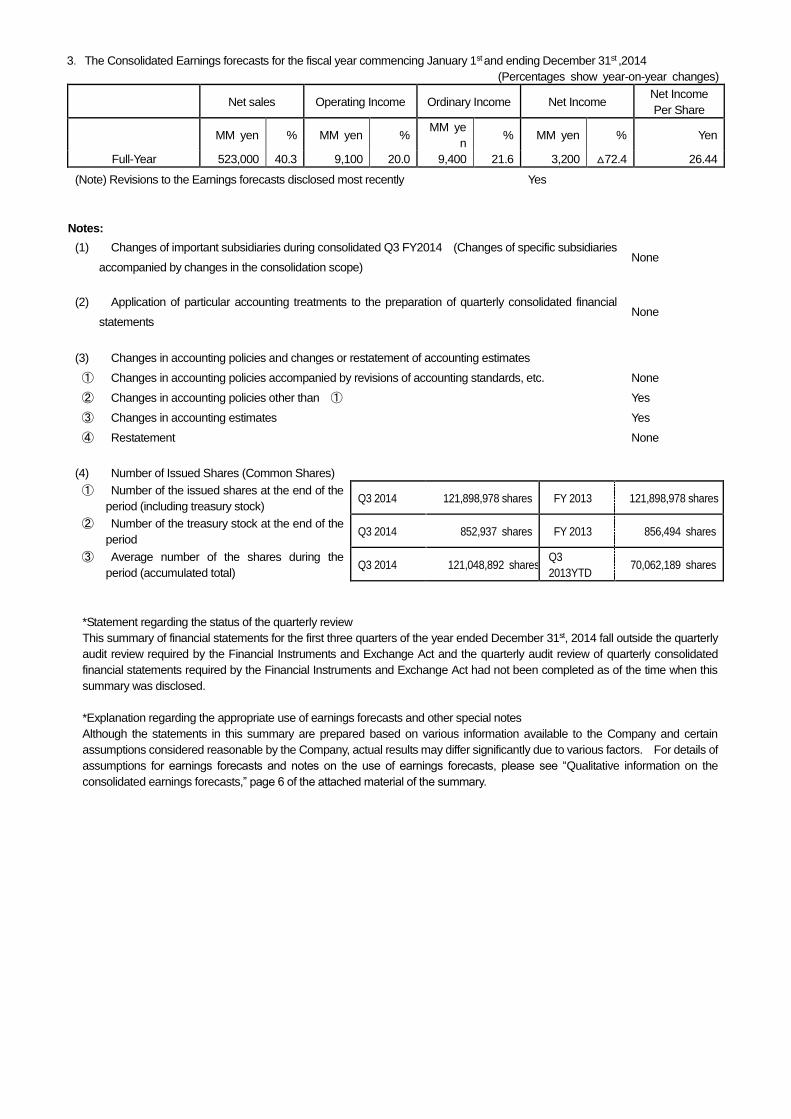
3.The Consolidated Earnings forecasts for the fiscal year commencing January 1st and ending December 31st ,2014
(Percentages show year-on-year changes)
Net sales Operating Income Ordinary Income Net Income Net Income
Per Share
MM yen % MM yen % MM ye
n % MM yen % Yen
Full-Year 523,000 40.3 9,100 20.0 9,400 21.6 3,200 △72.4 26.44
(Note) Revisions to the Earnings forecasts disclosed most recently Yes
Notes:
(1) Changes of important subsidiaries during consolidated Q3 FY2014 (Changes of specific subsidiaries
accompanied by changes in the consolidation scope) None
(2) Application of particular accounting treatments to the preparation of quarterly consolidated financial
statements None
(3) Changes in accounting policies and changes or restatement of accounting estimates
① Changes in accounting policies accompanied by revisions of accounting standards, etc. None
② Changes in accounting policies other than ① Yes
③ Changes in accounting estimates Yes
④ Restatement None
(4) Number of Issued Shares (Common Shares)
① Number of the issued shares at the end of the
period (including treasury stock) Q3 2014 121,898,978 shares FY 2013 121,898,978 shares
② Number of the treasury stock at the end of the
period Q3 2014 852,937 shares FY 2013 856,494 shares
③ Average number of the shares during the
period (accumulated total) Q3 2014 121,048,892 shares
Q3
2013YTD 70,062,189 shares
*Statement regarding the status of the quarterly review
This summary of financial statements for the first three quarters of the year ended December 31st, 2014 fall outside the quarterly
audit review required by the Financial Instruments and Exchange Act and the quarterly audit review of quarterly consolidated
financial statements required by the Financial Instruments and Exchange Act had not been completed as of the time when this
summary was disclosed.
*Explanation regarding the appropriate use of earnings forecasts and other special notes
Although the statements in this summary are prepared based on various information available to the Company and certain
assumptions considered reasonable by the Company, actual results may differ significantly due to various factors. For details of
assumptions for earnings forecasts and notes on the use of earnings forecasts, please see “Qualitative information on the
consolidated earnings forecasts,” page 6 of the attached material of the summary.

1
Contents of the Attached Materials
1. Qualitative information on results for the first three quarters of the year ending December 31st, 2014 ・・・・・・ 2
(1) Qualitative information on the consolidated operating results ・・・・・・・・・・・・・・・・・・・・・・・・・・・・・・・・・・・・・ 2
(2) Qualitative information on the consolidated financial positions ・・・・・・・・・・・・・・・・・・・・・・・・・・・・・・・・・・・・ 7
(3) Qualitative information on the consolidated earnings forecast ・・・・・・・・・・・・・・・・・・・・・・・・・・・・・・・・・・・・・ 8
2. Matters relating to summary information (notes)・・・・・・・・・・・・・・・・・・・・・・・・・・・・・・・・・・・・・・・・・・・・・・・・・・ 10
(1) Changes of important subsidiaries during the consolidated Q3 2014 YTD(accumulated)・・・・・・・・・・・・・・・・・・
10
(2) Application of particular accounting treatments to preparation of quarterly consolidated financial statements 10
(3) Changes in accounting policies and changes or restatement of accounting estimates ・・・・・・・・・・・・・・・・・・・
10
3. Quarterly consolidated financial statements ・・・・・・・・・・・・・・・・・・・・・・・・・・・・・・・・・・・・・・・・・・・・・・・・・・・・・・・ 11
(1) Quarterly consolidated balance sheets ・・・・・・・・・・・・・・・・・・・・・・・・・・・・・・・・・・・・・・・・・・・・・・・・・・・・・・・・ 11
(2) Quarterly consolidated profit and loss statements and comprehensive profit statements・・・・・・・・・・・・・・・・・ 13
Quarterly consolidated profit and loss statement
Consolidated Q3 2014YTD (accumulated)・・・・・・・・・・・・・・・・・・・・・・・・・・・・・・・・・・・・・・・・・・・・・・・・・・・・ 13
Quarterly consolidated comprehensive profit statements
Consolidated Q3 2014YTD (accumulated)・・・・・・・・・・・・・・・・・・・・・・・・・・・・・・・・・・・・・・・・・・・・・・・・・・ 14
(3) Notes relating to Quarterly consolidated financial statements・・・・・・・・・・・・・・・・・・・・・・・・・・・・・・・・・・・・・・・ 15
(Notes relating to assumptions for the going concern)・・・・・・・・・・・・・・・・・・・・・・・・・・・・・・・・・・・・・・・・・・・・・・ 15
(Notes in the event of significant changes in amount of shareholders’ equity)・・・・・・・・・・・・・・・・・・・・・・・・・・・ 15
(Segment information and others) ・・・・・・・・・・・・・・・・・・・・・・・・・・・・・・・・・・・・・・・・・・・・・・・・・・・・・・・・・・・・ 15

2
Coca-Cola East Japan Co., Ltd. (CCEJ) today announced its consolidated financial results
for the nine-month period ended September 30, 2014 (January 1, 2014 to September 30,
2014, hereinafter referred to as year-to-date)
1. Qualitative information on the year-to-date 2014 results
(1) Qualitative information on the consolidated operating results
Key Messages
・ Year-to-date volume growth of 1%, with our fourth consecutive quarter of volume
and value share gains, despite the impact of unseasonal weather in the summer
and a challenging consumer/economic environment after the April 1 consumption
tax increase.
・ Continued synergy capture and cost savings offset by revenue mix pressure as well
as operational delays of new production lines and related higher external
procurement and logistics costs.
・ Revised full-year reported Operating Income estimate of JPY 9.1 billion. Full-year
comparable Operating Income estimate now ¥10.3 billion, even vs. prior year.
・ Legal integration of four legacy bottlers proceeding on plan, integration plan
for ”white” vending businesses approved by Board of Directors.
*For additional details and management discussion of the third quarter and year-to-date
results, please also see our supplemental presentation material posted on our Company
website, which will be used for our earnings telephone conference and webcast on the
evening of November 6, 2014. The webcast is available both live and on demand at
http://www.investor.ccej.co.jp.
Industry Update
The third quarter (July to September, 2014) was characterized by unseasonably cool
summer weather as well as a more challenging macro-economic environment after the April
1 consumption tax increase. As a result, total nonalcoholic ready-to-drink (NARTD)
beverage industry volumes were down, and the industry revenue mix environment was
further impacted by shifts away from vending and other immediate consumption channels as
well as stronger price promotion activity as a result of the weak summer sales volumes. In
this volatile environment, Coca-Cola East Japan achieved continued market share growth
both in terms of volume share and value share.

3
Integration Update
CCEJ, formed after the management integration of the four Kanto and Tokai region
Coca-Cola bottling companies on July 1, 2013, is now Japan’s largest Coca-Cola bottling
company, encompassing one contiguous geographic territory representing one of the most
dynamic and competitive consumer markets in Japan. The integration of CCEJ allows us to
leverage the scale of our expanded size and the related efficiencies of having one optimized
set of functional organizational structures rather than multiple individual businesses running
in separate geographies.
With multiple integration projects and initiatives underway there are many visible signs of
progress to highlight in the third quarter (July 1, 2014 to September 30, 2014), including the
following:
・ Completed the legal integration of seven consolidated subsidiaries (three logistics
companies and four equipment maintenance companies) into one subsidiary
company, Coca-Cola East Japan Products
・ Commissioned one new production line at our Ebina plant
・ Shut down operations at two manufacturing facilities
・ In-house production of new Tokuho tea started
・ Successfully completed bond offering of ¥14 billion
・ On track with development and deployment of ERP system “CokeONE+”
We continue to make progress with the legal integration of multiple subsidiary companies,
including the integration of four production companies at the beginning of this year and
seven logistics and equipment maintenance subsidiaries mid-year. Work toward the legal
integration of our four legacy bottling companies is on track to be completed at the beginning
of 2015, and our Board of Directors approved today the integration of the remaining vending
operating subsidiary companies which handle our products as well as other companies’
products, to be completed by April, 2015. Though in line with our integration plans, the
aggressive pace has resulted in some operational challenges, with businesses having to
adapt to being run functionally rather than by legal entity.
Operating Review
Year-to-date total BAPC (Bottler Actual Physical Cases) sales volume grew 0.6% on a
comparable basis, and we continued to grow both volume and value share in total NARTD
beverages, led by colas, teas, water and coffee. During the third quarter, which is our peak
business season, volume decreased due to unseasonably cool and wet weather, including a
longer-than-usual rainy season, cool temperatures and frequent typhoons. Year-to-date

4
volume growth by channel was led by the drug & discounter (+7%) and convenience store
channels (+6%). The supermarket channel grew slightly, while volume in the vending (-3%)
and eating & drinking (-2%) channels declined, impacted by the poor summer weather and
consumers continuing to adjust to the consumption tax rate hike. For the year-to-date
period, volume of future consumption packages grew faster than the more profitable
immediate consumption packages, up 2% and 1%, respectively.
Year-to-date, sparkling beverage volume was even, with growth in brand Coca-Cola and
Fanta. In the hydration category, unsweetened teas grew 8% and water grew 9%. Sports
drinks volume declined 9% due to the poor summer weather as well as cycling strong
volume performance from the prior year. Unsweetened tea growth was led by Ayataka
green tea and the launch of Karada Sukoyakacha W, our new FOSHU (Food for Specific
Health Use) tea brand. The ilohas water brand continued to perform well and also
benefited from the launch of ilohas sparkling variants in plain and lemon flavors.
Importantly, coffee volume continued to improve sequentially, with 2% growth year to date.
In the third quarter, we delivered our fourth consecutive quarter of volume and value share
gains by strengthening sales promotion activities of newly launched products mainly in the
convenience store channel, however total BAPC sales volume declined 2% on a
comparable basis. Convenience store channel volume grew 10%, driven by growth in
coffee, unsweetened teas and sparkling water. The drug & discounter channel grew 2%,
led by our strong portfolio of unsweetened tea brands. Supermarket (-6%), vending (-6%)
and eating & drinking (-2%) channel performance was impacted by poor weather as well as
a weaker macro-economic environment following the April 1 consumption tax hike.
Third quarter sparkling beverage volume declined 4%, primarily because of soft
performance in the vending channel. In the hydration category, unsweetened tea and
water volumes grew 7% and 10%, respectively. Sports drink volume declined 19% in the
quarter, strongly impacted by the unseasonal summer weather. Karada Sukoyakacha W,
together with Ayataka green tea and our seasonal launch of Barley tea, helped to continue
our strong growth momentum in unsweetened tea. Water volume grew as a result of the
introduction of immediate consumption iLohas Sparkling in plain and lemon flavors. Coffee
volume grew 6% in the quarter, driven by the new products introduced in the second quarter,
with positive performance across all channels, led by vending (+6%), an important sales
channel for our coffee products, convenience stores (+7%) and the drug and discounter
(+7%) channel.

5
Together with our partners at Coca-Cola Japan (CCJC), we have a strong marketing
and innovation calendar planned for the fourth quarter, including aggressive deployment
of hot beverage SKUs for the winter across multiple channels. We have exciting plans
to activate our Coca-Cola TM Winter Campaign for Christmas and the holiday season
with the introduction of a seasonal limited flavor, Coca-Cola Orange, as well as our
Happy Message Bottles campaign starting in November. In the coffee category, we
launched new customer-specific products in October and we are also continuing the
successful Weekly Georgia digital magazine for smartphones as well as a winter version
of the current campaign, The World is Made Up of Someone’s Work. Also, we will
strengthen sales promotion activities for AQUARIUS during the winter for vitamin
functionality and cold prevention.
Financial Review
Reported* Results
Year-To-Date 2014 (January to September)
In Million JPY 2013 2014 % Change
Net Sales 246,786 400,601 +62.3 %
Operating Income 8,077 5,732 -29.0 %
Net Income 15,481 897 -94.2 %
* Reported: CCEJ began operations as an integrated company starting in the third quarter of 2013. As a result, above reported
consolidated financial results for CCEJ are compared against the consolidated results of legacy Coca-Cola Central Japan (CCCJ)
in same term of 2013. As a result, above reported results in 2013 reflect the consolidated results of CCEJ in the third quarter and
consolidated result of the legacy CCCJ for the first and second quarters. Please see our “Comparable” results below which
present results as if the four Kanto and Tokai area Coca-Cola bottlers were integrated as of January 1, 2013 and after excluding
exceptional items such as charges, gains, etc. which are viewed by management as one-time items impacting only the current
period or the comparable period, but not both.
Comparable* Results
Year-To-Date 2014 (January to September)
In Million JPY, except volume
2013
Comparable
2014
Comparable % Change
Volume (BAPC, in thousand) 217,078 218,412 + 0.6%
Net Sales 407,596 400,601 - 1.7%
Operating Income 11,246 6,587 - 41.4%
Net Income 6,323 3,356 - 46.90%
6
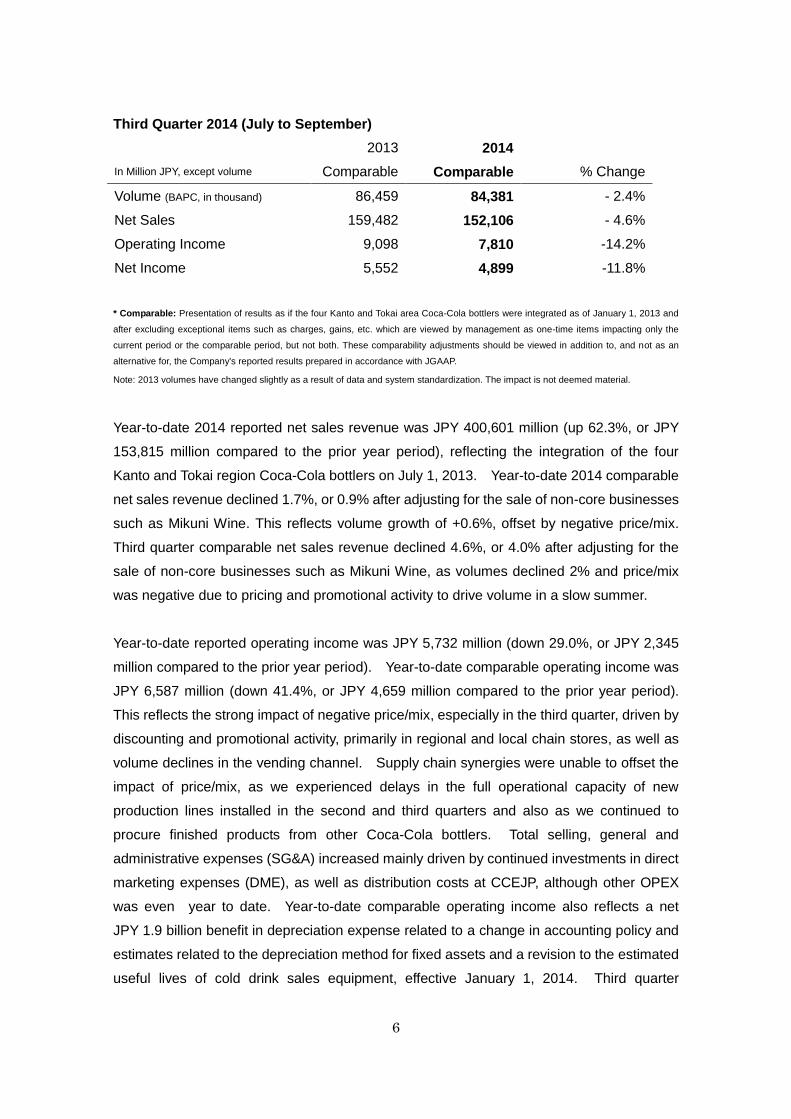
Third Quarter 2014 (July to September)
In Million JPY, except volume
2013
Comparable
2014
Comparable % Change
Volume (BAPC, in thousand) 86,459 84,381 - 2.4%
Net Sales 159,482 152,106 - 4.6%
Operating Income 9,098 7,810 -14.2%
Net Income 5,552 4,899 -11.8%
* Comparable: Presentation of results as if the four Kanto and Tokai area Coca-Cola bottlers were integrated as of January 1, 2013 and
after excluding exceptional items such as charges, gains, etc. which are viewed by management as one-time items impacting only the
current period or the comparable period, but not both. These comparability adjustments should be viewed in addition to, and not as an
alternative for, the Company's reported results prepared in accordance with JGAAP.
Note: 2013 volumes have changed slightly as a result of data and system standardization. The impact is not deemed material.
Year-to-date 2014 reported net sales revenue was JPY 400,601 million (up 62.3%, or JPY
153,815 million compared to the prior year period), reflecting the integration of the four
Kanto and Tokai region Coca-Cola bottlers on July 1, 2013. Year-to-date 2014 comparable
net sales revenue declined 1.7%, or 0.9% after adjusting for the sale of non-core businesses
such as Mikuni Wine. This reflects volume growth of +0.6%, offset by negative price/mix.
Third quarter comparable net sales revenue declined 4.6%, or 4.0% after adjusting for the
sale of non-core businesses such as Mikuni Wine, as volumes declined 2% and price/mix
was negative due to pricing and promotional activity to drive volume in a slow summer.
Year-to-date reported operating income was JPY 5,732 million (down 29.0%, or JPY 2,345
million compared to the prior year period). Year-to-date comparable operating income was
JPY 6,587 million (down 41.4%, or JPY 4,659 million compared to the prior year period).
This reflects the strong impact of negative price/mix, especially in the third quarter, driven by
discounting and promotional activity, primarily in regional and local chain stores, as well as
volume declines in the vending channel. Supply chain synergies were unable to offset the
impact of price/mix, as we experienced delays in the full operational capacity of new
production lines installed in the second and third quarters and also as we continued to
procure finished products from other Coca-Cola bottlers. Total selling, general and
administrative expenses (SG&A) increased mainly driven by continued investments in direct
marketing expenses (DME), as well as distribution costs at CCEJP, although other OPEX
was even year to date. Year-to-date comparable operating income also reflects a net
JPY 1.9 billion benefit in depreciation expense related to a change in accounting policy and
estimates related to the depreciation method for fixed assets and a revision to the estimated
useful lives of cold drink sales equipment, effective January 1, 2014. Third quarter
7
comparable operating income was JPY 7,810 million (down 14.2%, JPY 1,288 million
compared to the prior year period) driven by the decrease in sales volume and mix
deterioration in the quarter, as well as increased expenses related to limited production
capacity of the newly installed production lines and procurement of finished product from
other Coca-Cola bottlers. Total SG&A decreased through a strong focus on OPEX
efficiency in the quarter, which was partly offset by an increase in DME. Third quarter
comparable operating income also reflects a JPY 3 billion benefit in depreciation as a result
of the above change in accounting policy and estimates.
Year-to-date, we reported net income of JPY 897 million (down 94.2%, JPY 14,584 million
compared to the prior year period). This reflects the above-mentioned operating
performance in the year-to-date 2014 period as well cycling extraordinary items from the
prior year period, including a JPY 13 billion one-time gain from negative goodwill and
various integration-related expenses. In addition, year-to-date 2014 net income includes
restructuring costs, primarily related to our employee voluntary separation program in the
first quarter, and quality-related extraordinary expenses due to a limited product recall in the
third quarter.
(2) Qualitative information on the consolidated financial positions
(i) The financial positions at the end of the third quarter are as follows:
Assets at the end of the third quarter were JPY 344,354 million, an increase of JPY 29,863
million from the end of the previous fiscal year. This is mainly due to an increase in current
assets as a result of our focus on bringing more production and logistics volume in-house,
which leads to higher inventory levels of merchandise and finished goods as well as raw
material and supplies. In addition, Accounts Receivable-Trade increased, reflecting the
growth in reported revenue. Fixed assets also increased for sales equipment as we have
been aggressively increasing the installation of coolers as well as new vending machines in
order to drive profitable immediate consumption packaging sales growth. In addition,
Property, Plant and Equipment - Other increased as a result of the introduction in 2014 of
five new production lines, two new in-line PET bottle blowers, and new trucks.
Liabilities at the end of the second quarter were JPY 130,230 million, an increase of JPY
31,931 million from the end of previous fiscal year. This is mainly due to an increase in
short-term borrowing for our working capital and an increase of Accounts Payable-Trade as
a result of ongoing in-housing of production and logistics as well as increase of fixed
liabilities by issuing straight bond.

8
Net assets at the end of the second quarter were JPY 214,123 million, a decrease of JPY
2,067 million. This is primarily a decrease of retained earnings due to the year-to-date
reported net operating income of JPY 897 million was offset by the payment of JPY 3,630
million in dividends in the first and third quarter.
(3)Qualitative information on the consolidated earnings forecast
CCEJ released a downward revision of its full-year 2014 earnings forecast today. The
revised figures on a reported basis can be found in the separate disclosure, “Revision of the
Earnings Forecast for the Fiscal Year Ending December 2014” released today as well as the
cover page of this earnings release. The comparable figures of the revision and reason for
the revisions are as follows.
Revised full year forecast of 2014 (Comparable)
Revenue Operating Income Net Income
Prior forecast (A)
Million JPY
535,800
Million JPY
19,000
Million JPY
12,200
Revised forecast (B) 523,000 10,300 5,900
Amount increase/decrease
(A)-(B)
-12,800 -8,700 -6,300
Rate of increase/decrease
(%)
-2.4 -45.8 -51.6
2013 Full year result
(Comparable)
533,602 10,240 5,693
(Reason for the revision)
As a result of the industry impact of unseasonably cool summer weather and a weaker
consumer environment after the April 1 consumption tax rise as well as ongoing channel
trends, our business experienced greater than expected negative impact to our price/mix.
Although we have delivered incremental supply chain synergies since our inception and in
this fiscal year, we also experienced slower-than-expected commissioning of some new
production lines, delays in the operational integration of our logistics blueprint, lower supply
chain synergies attributable to the slower production volume due to the poor weather,
additional logistics costs due to procurement of finished goods from other bottlers, etc.
These partly offset the benefit from supply chain synergies, and were not enough to offset
the profit decline caused by price/mix deterioration.

9
We have continued to invest in marketing in order to ensure continued volume and value
share gains in the challenging and competitive environment. As a result, DME increased
against the initial estimate. On the other hand, we are saving overall selling, general and
administrative expenses, mainly as a result of reduced personnel costs driven by reductions
in headcount by our voluntary separation programs and also changes in actuarial
assumptions related to pensions.
.
We also report extraordinary losses which includes restructuring costs primarily related to
our employee voluntary separation program, quality-related extraordinary expenses due to a
limited voluntary product recall, etc.

10
2. Matters relating to summary information (notes)
(1) Important change in subsidiaries during the consolidated Q3 FY2014 under review
There is no matter applicable.
(2) Application of accounting treatments specific to preparation of quarterly consolidated financial
statements
There is no matter applicable.
(3) Changes in accounting policies, accounting estimate or restatement
(Change in Accounting Policy and estimates )
Change in the depreciation method, the estimated useful lives, and salvage values of
tangible fixed assets
From the beginning of this fiscal year, the Company changed the depreciation method of its
tangible fixed assets from the declining method to the straight-line method.
Aiming to establish appropriate usage of the cold drink equipment beyond each legacy bottler
territory, the Company introduced new strategies regarding sales equipment in its newly
planned fiscal 2014 annual business plan. By implementing this plan, the Company ensures
that assets will be productive over their entire lives and can maximize usage periods, which
will contribute to generating stable and long-term revenue. Also, for the production
equipment, the Company introduced new strategies regarding supply chain in the annual
business plan. The Company plans to improve and optimize its production capacity beyond
the legacy bottler territories through integrating production subsidiaries and making
large-scale investments in new production equipment. This plan will also enable the
Company to run the assets in an efficient and stable manner over the long run. Considering
the aforementioned benefits, the Company changed the depreciation method of its tangible
fixed assets from the declining method to the straight-line method, which more accurately
reflects the estimated pattern of utilization of the assets.
The Company also extended the estimated useful life of its cold drink sales equipment such
as vending machines and coolers to nine years from a range of five to six years, which more
accurately reflects the estimated useful lives of this significant asset base.
As part of this change, the salvage value of existing tangible fixed assets was adjusted to a
residual value of one JPY per asset for asset-tracking purposes, with the difference written off
during the first quarter. The salvage value write-off for assets without remaining useful lives
had a negative impact on the Company’s first three quarter 2014 reported operating income
1,956, ordinary income 2,363 and profit before tax 2,431 respectively.

11
3. Quarterly Consolidated financial statements
(1)Consolidated balance sheets
(Million yen)
FY2013 Q3 2014 YTD
Assets
Current assets
Cash and deposits 29,901 27,051
Notes and accounts receivable-trade 35,934 40,880
Short-term investment securities 1,505 1,206
Merchandise and finished goods 31,261 32,662
Work in process - 67
Raw materials and supplies 1,931 4,417
Other 20,162 32,937
Allowance for doubtful accounts △ 51 △ 41
Current assets 120,645 139,181
Noncurrent assets
Property, plant and equipment
Buildings and structures, net 37,691 37,664
Sale equipment, net 38,558 47,415
Land 46,759 46,526
Other, net 35,690 39,400
Property, plant and equipment 158,699 171,007
Intangible assets 3,616 3,887
Investments and other assets
Other 31,788 30,549
Allowance for doubtful accounts △ 260 △ 271
Investments and other assets 31,528 30,277
Noncurrent assets 193,844 205,172
Assets 314,490 344,354
Liabilities
Current liabilities
Accounts payable-trade 21,510 23,998
Short-term loans payable - 20,000
Income taxes payable 1,585 2,331
Provision for bonuses 1,264 2,841
Provision for directors' bonuses 131 -
Provision for early contact termination 220 771
Other 36,576 35,219
Current liabilities 61,289 85,162
Noncurrent liabilities
Bonds payable - 14,000
Provision for retirement benefits 17,579 16,058
Provision for directors' retirement benefits 367 2
Provision for environmental measures 359 360
Provision for early contact termination 3,173 2,409
Other 15,529 12,236
Noncurrent liabilities 37,009 45,067
Liabilities 98,299 130,230

12
(Million yen)
FY2013 Q3 2014 YTD
Net assets
Shareholders' equity
Capital stock 6,499 6,499
Capital surplus 143,136 143,134
Retained earnings 67,034 64,300
Treasury stock △ 1,164 △ 1,167
Shareholders' equity 215,507 212,767
Valuation and translation adjustments
Valuation difference on available-for-sale securities 867 1,280
Deferred gains or losses on hedges △ 201 △ 75
Valuation and translation adjustments 665 1,204
Subscription rights to shares 19 151
Net assets 216,191 214,123
Liabilities and net assets 314,490 344,354

13
(2) Consolidated profit and loss statement and comprehensive profit statement
(Consolidated profit and loss statement)
(Million yen)
Q3 2013 YTD Q3 2014 YTD
Net sales 246,786 400,601
Cost of sales 139,005 219,154
Gross profit 107,781 181,446
Selling, general and administrative expenses 99,703 175,714
Operating income 8,077 5,732
Non-operating income
Interest income 56 102
Dividends income 20 132
Equity in earnings of affiliates 190 128
Rent income 207 281
Gain on sales of valueable wastes 160 268
Others 105 126
Non-operating income 741 1,038
Non-operating expenses
Interest expenses 127 292
Rent expenses 54 79
Loss on sales and retirement of noncurrent assets 437 307
Others 21 106
Non-operating expenses 641 785
Ordinary income 8,177 5,985
Extraordinary income
Gain on negative goodwill 12,969 -
Gain on sales of shares of subsidiaries - 69
Insurance income - 100
Gain on sales of noncurrent assets - 89
Others 6 0
Extraordinary income 12,976 258
Extraordinary loss
Loss on sales and retirement of noncurrent assets 71 350
Impairment loss 25 69
Restructuring cost - 1,771
Quality-related costs - 529
Cost of defective work - 373
Integration expenses 1,961 -
Loss on step acquisitions 821 -
Others 15 168
Extraordinary loss 2,894 3,263
Income before income taxes 18,259 2,980
Income taxes-current 3,381 3,748
Income taxes-deferred △ 603 △ 1,665
Income taxes 2,778 2,083
Income before minority interests 15,481 897
Net income 15,481 897

14
(Consolidated comprehensive profit statement)
(Million yen)
Q3 2013 YTD Q3 2014 YTD
Income before minority interests 15,481 897
Other comprehensive income
Valuation difference on available-for-sale securities 484 413
Deferred gains or losses on hedges △ 0 126
Other comprehensive income 483 539
Comprehensive income 15,964 1,436
Comprehensive income attributable to
Comprehensive income attributable to owners of the parent company 15,964 1,436
Comprehensive income attributable to minority interests - -

15
(3)Notes relating to Quarterly consolidated financial statements
(Notes relating to assumptions for the going concern)
None
(Notes in the event of significant changes in amount of shareholders’ equity)
None
(Segment information, etc.)
(Segment Information)
The Group has sole segment of beverage business, thus the description is omitted.