erosion control and revegetation techniques using
TRANSCRIPT

.D ~ , ..r:
Report No. CDOT/CTI-96-4
EROSION CONTROL
AND REVEGETATION TECHNIQUES
USING MECHANICALLY
STABILIZED EARTH SLOPES
COLORADO TRANSPORTATION INSTITUTE
William R. Schiebel Design Engineer
Colorado Department of Transportation
Albert C. Ruckman Consultant in MSB Design and Construction
Denver, Colorado
Robert K. Barrett Manager of Geotechnical Research Colorado Transportation Insti~te
Jeff Rodencal National Sales Manager, Drainage and Erosion Products
Tensar Earth Technolmries. Tn~_
REPORT DOCUMENTATION PAGE FORM APPROVED
OMB NO. 0704-0188
Public ~niDg burden for tills collectioD of information is csIimaIcd to average 1 hour per responsc,including the time for reviewing instructions, searc:biog cxisting data sources,
Ilathcriog and maioraiDing the data nccdcd , and complcting and reviewing thc cOllectiOD of information. Send comments regarding this burden estimate or any other aspect of this
collectioD of information, including suggestions for reducing this burden, to Washington Headquamrs Services, Directorate for Information Opcrations and Repons, 1215 Jefferson
Davis Hil!hwav. Suite 1204 Arlinl!ton V A 2202-4302. and to thc Office of Manal!emcr and Budl!ct Pancrwnrk Rodu"oon ProicctJ07()4.{)188t Washinl!lDn DC 20503.
1. AGENCY USE ONLY (Leave Bialik) 2. REPORT DATE 3. REPORT TYPE AND DATES COVERED
April, 1996 Final Report, 2 years
4. TITLE AND SUBTITLE 5. FUNDING NUMBERS
Erosion Control and Revegetation Techniques Using Mechanically Stabilized Earth Slopes
6. AurHORS(S)
William R. Schiebel, Albert C. Ruckman, Robert K. Barrett, Jeff Rodencal
7. PERFORMING ORGANIZATION NAME(S) AND ADDRESS(S) 8. PERFORMING ORGANIZATION
Colorado Department of Transportation REPORT NUMBER
4201 E. Arkansas Ave. CDOT/CTI-96-4
Denver, Colorado 80222
9. SPONSORlNGIMONlTORING AGENCY NAME(S) AND ADDRESS(S) 10. SPONSORINGIMOl'llTI'ORING
Colorado Department of Transportation AGENCY REPORT NUMBER
4201 E. Arkansas Ave. CDOT/CTI-96-4
Denver. Colorado 80222
11. SUPPLEMENTARY NOTES
Prepared in Cooperation with the u.s. Department of Transportation, Federal
Highway Administration
lla. DISTRIBlmONJAV AlLABILlTY SfATEMENT 12b. DISTRIBUI10N CODE
No Restrictions: This report is available to the public through the National 1 echnica1 T. ~. Serv,;-:e ... . ~ ~ld. VA 22161 ":)1
13. ABSI'RACT (Maximum 200 words)
Revegetation and erosion control techniques on reinforced one-to-one slopes were monitored and reported.
Two 15 foot high embankments were constructed with reinforced one-to-one slopes. These four slopes were each finished with six revegetation test sections. The test section characteristics provided a broad range of aesthetic and economic examples. The test sections were monitored for vegetation success and
eroded material. The study was conducted in a semiarid climate.
It is concluded that: 1. Irrigation commensurate with evapotranspiration rates and precipitation will be necessary in semiarid climates. 2. Slope orientation will have an impact on revegetation success. 3. Any of the studied revegetation test sections offer excellent erosion control. And 4. Vegetated one-to-one can offer the desi~ner an aesthetic and economic alternative to vertical retainin~ walls. 14. SUBJECT TERMS 15. NUMBER OF PAGES
Revegetation Erosion Control Steep slopes
Mechanically Stabilized Geosynthetic Reinforcement 16. PRICE CODE
17. SECUR11TY CLASSIFICATION 18. SECURITY CLASSIFICATION 19. SECURITY CLASSIFICATION 20. LIMITATION OF ABSI'RACT
OF REPORT OF 11DS PAGE OF ABSI'RACT
Unclassified Unclassified Unclassified

ACKNOWLEDGMENTS
Ralph Trapani, CTI President, and Rich Griffin, CDOT Research Coordination Engineer, provided oversight and funding that enabled us to complete this milestone MSB research project.
CDOT Maintenance personnel, under the direction of Al Kline, provided the site, equipment, materials and manpower. This support was critical to the success of this project. We are greatly indebted to them.
Steve Foster and Steve Hieber, CDOT Region 3, were construction supervisors.
Mike Banovich, CDOT Staff Landscape Architect, contributed his knowlege of local conditions, planting requirements, and survey methods by providing crucial technical assistance and recommendations.
Dave Woodham, CDOT Research Engineer, provided important technical expertise and experience in construction and monitoring of weather station systems.
i
CONTENTS
Introduction. . . . . . . . . . . . . . . . . . . . . . . . . . .. . . . . . . . . . . . . . . . . . . . . . . . . . . . . . . . . .. . p. 1
Construction and Materials...................... . . . . . . . . . . . . . . . . . . . . . . . . p. 1
Vegetation ............ . ....... . ....................... .. ................ '" p. 6
Instrumentation and Measurement. .... .. ..... ..... . . . ... . . ... . . . ... ... p. 8
Results and Discussion.................. . . . . . . . . . . . . . . . . . . . . . . . . . . . . . . . . p. 9
Conclusion.. . .. . . . . .. .. .. .. . ............. .... ... . . .. .. . .. . . . .. . ..... . ...... p. 16
Appendix A - Irrigation Schedule ...................................... p.21
ii
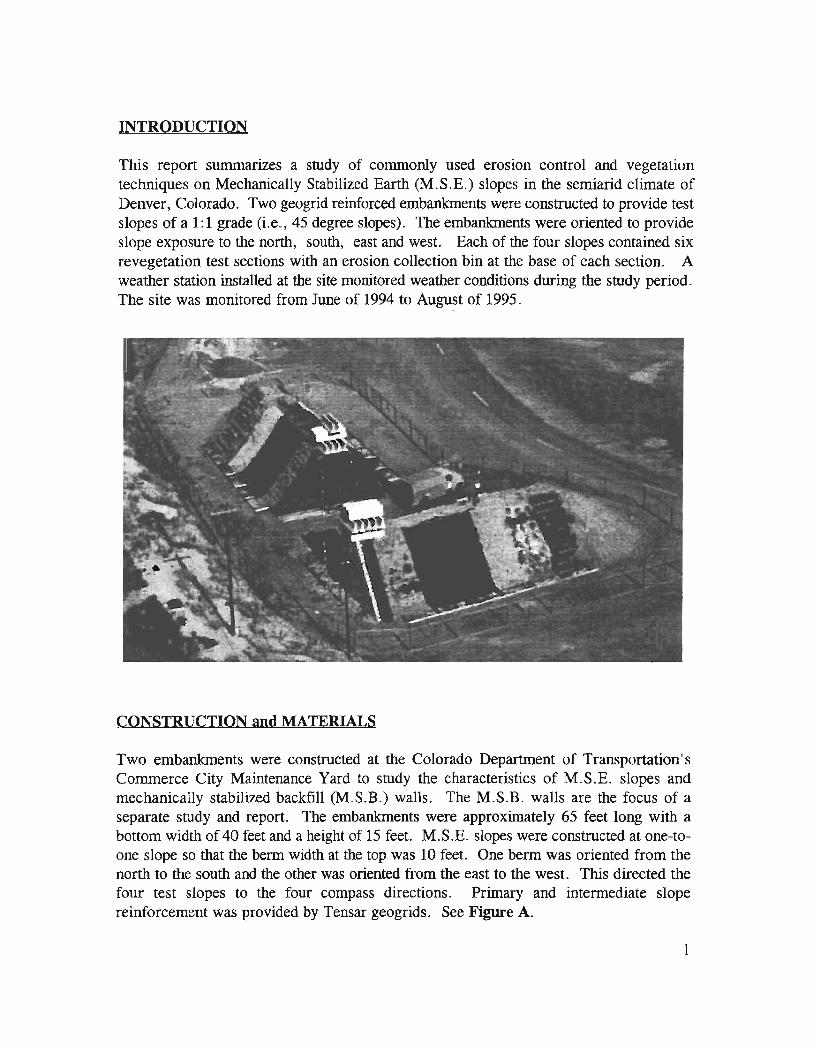
INTRODUCTION
This report summarizes a study of commonly used erosion control and vegetation techniques on Mechanically Stabilized Earth (M.S.E.) slopes in the semiarid climate of Denver, Colorado. Two geogrid reinforced embankments were constructed to provide test slopes of a 1:1 grade (i.e., 45 degree slopes). The embankments were oriented to provide slope exposure to the north, south, east and west. Each of the four slopes contained six revegetation test sections with an erosion collection bin at the base of each section. A weather station installed at the site monitored weather conditions during the study period. The site was monitored from June of 1994 to August of 1995.
CONSTRUCTION and MATERIALS
Two embankments were constructed at the Colorado Department of Transportation's Commerce City Maintenance Yard to study the characteristics of M.S.E. slopes and mechanically stabilized backfill (M.S.B.) walls. The M.S.B. walls are the focus of a separate study and report. The embankments were approximately 65 feet long with a bottom width of 40 feet and a height of 15 feet. M.S.E. slopes were constructed at one-toone slope so that the berm width at the top was 10 feet. One berm was oriented from the north to the south and the other was oriented from the east to the west. This directed the four test slopes to the four compass directions. Primary and intermediate slope reinforcement was provided by Tensar geogrids. See Figure A.
1
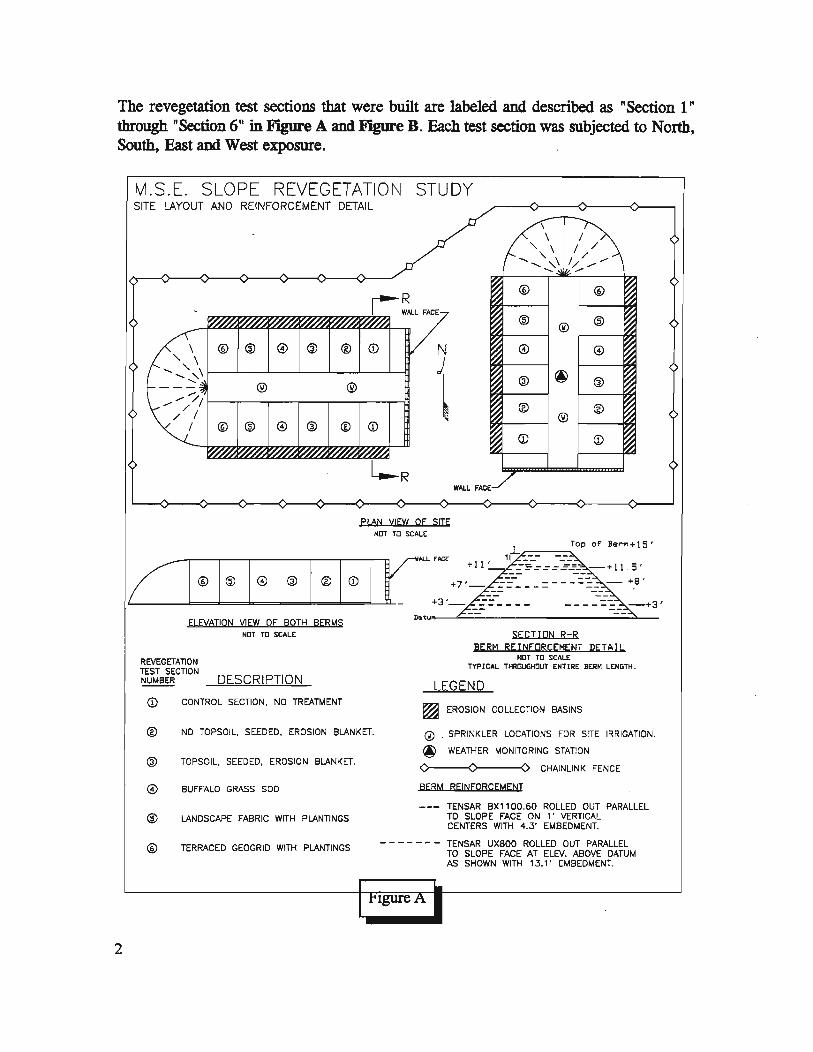
The revegetation test sections that were built are labeled and described as "Section 1 " through "Section 6" in Figure A and Figure B. Each test section was subjected to North, South, East and West exposure.
2
M.S.E. SLOPE REVEGETATIO N STUDY SITE LAYOUT AND REINFORCEMENT DETAIL
-~~
\ @ ® @ @ ® " \ .... " \ .... " r---~) ® ® .... // .... / / /
/ @ ® @ ® ®
~
ELEVATION VIEW OF BOTH BER~S NOT TO SCALE
REVEGETATION TEST SECTION NUMBER DESCRIPTION
CD CONTROL SECTION. NO TREATMENT
I~LL FACE v: CD
1 CD
~
~R
PLAN VIEW OF SITE NOT TO SCALE
~
~
~/ WALL FACE
T \ I /
"\1// .... " \ I / / .... .... ~~/ ........ @ @
® ® ®
@ @ ~
@ ~ ~
® ®
®
CD <D
Top of Be,..M+15 , .r---",
htu._----e.==---_______ =::......_ SECTION R-R
BERM REINfoRCEMENT DETAIL NOT TO SCALE
TYPICAL THROUGHOUT ENTIRE BERM LENGTH.
LEGEND
~ EROSION COLLECTION BASINS
® NO TOPSOIL. SEEDED. EROSION BLANKET. ® . SPRINKLER LOCATIONS FOR SITE IRRIGATION.
~ WEATHER ~ONITORING STATION
® TOPSOIL. SEEDED. EROSION BLANKET.
BUFFALO GRASS SOD
® LANDSCAPE FABRIC WITH PLANnNGS
TERRACED GEOGRID WITH PLANTINGS
o 0 0 CHAIN LINK FENCE
BERM REINfORCEMENT
--- TENSAR BXll00.60 ROLLED OUT PARALLEL TO SLOPE FACE ON l' VERTICAL CENTERS WITH 4.3' EMBEDMENT.
- - - - - - - TENSAR UX800 ROLLED OUT PARALLEL TO SLOPE FACE AT ELEV. ABOVE DATUM AS SHOWN WITH 13. l' EMBEDMENT.
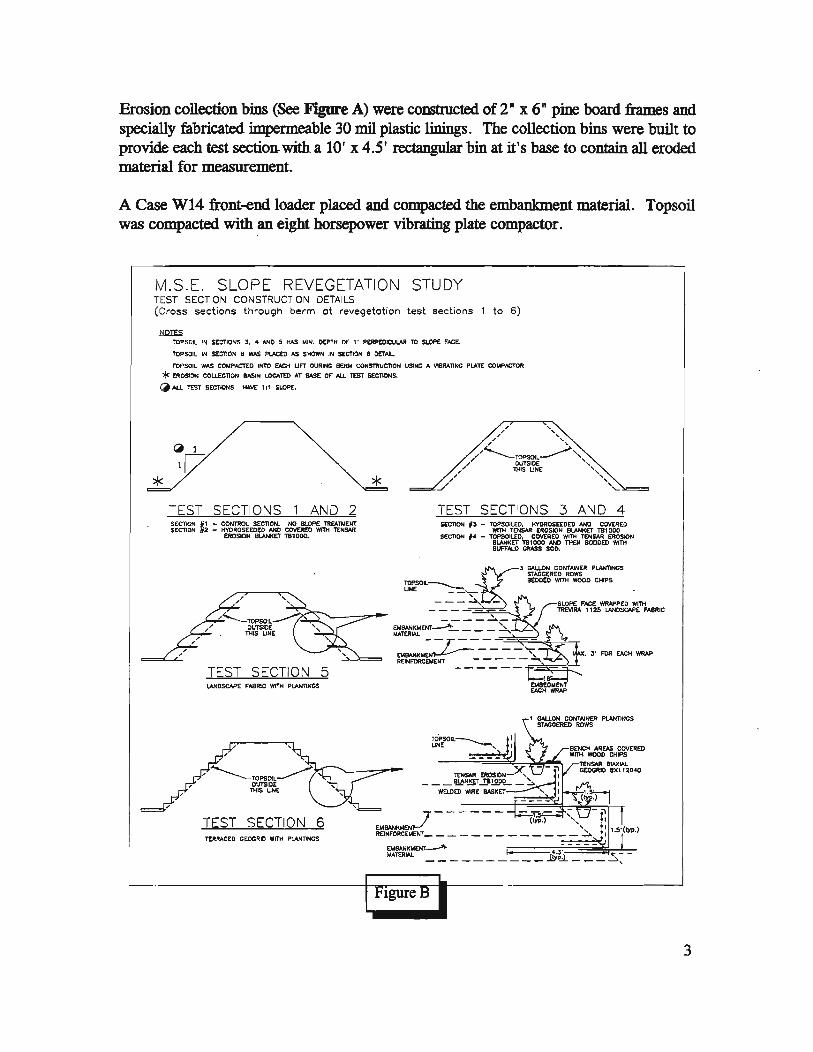
Erosion collection bins (See Figure A) were constructed of 2" x 6" pine board frames and specially fabricated impermeable 30 mil plastic linings. The collection bins were built to provide each test section-with a 10' x 4.5' rectangular bin at it's base to contain all eroded material for measurement.
A Case W14 front-end loader placed and compacted the embankment material. Topsoil was compacted with an eight horsepower vibrating plate compactor.
M.S.E. SLOPE REVEGETATION STUDY TEST SECTION CONSTRUCTION DETAILS (Cross sections through berm at revegetation test sections 1 to 6)
~ TOPSelL IN SECTIONS " 4 AND 5 HAS IIIN. DEPTH OF l ' PERPEDlCUIA~ TO SLOPE FACE.
TOPSOIL IN SECTION 6 WAS PlACED AS SHOWN IN SECTION 6 DETAL
TOPSOil W~ COMPACTED INTO EACH UfT DURING BERM CONSTRUCTION USING A VIBRATING PLAlE COWPACT'OR * EROSI:lN COLLECTION IlASIN LOCATtO AT SASE OF ALL lEST SECTIONS,
~ ALL ':EST SECTIONS HAVE 1:1 SLOPE,
TEST SECTIONS AND 2 SECTION '1 - CONTROl. SEenON, NO SLOPE TlWirMENT SECTION *2 - HYOROSEEOED AND CD'iERED WITH TtNSAR
EROSION BLANKET TB10DD.
TEST SECTION 5 lANDSCAPE FABRIC WITH PLANT1NCS
TEST SECTION 6 TtRRACED CEOCRIO WITH PLANTINGS
TEST SECTIONS 3 AND 4 SECTION Il - TOPSOILED, HYOROSEEDEO AND COYERED
WITH TENSM EROSION BLANKET TB1 DOD SECTION 14 - TOPSOILED, COVERED W"", TENSA. EROSION
BLANKET TB10D0 AND THEN SODDED WITH B_ALe CRASS SOD.
£:,. ~ CONTAINER PL.ANTINCS
STAOOEREO ROWS TOPSOL___ BEDDEO WITH WOOD CHIPS UNE __ '-
- - - ~~-SLOPE FACE WRAPPED WITH - -= = = = ~:. TREVIRA 1125 LANDScAPE FAeRIC
~=£NT~ ____ ~~ DA8AHt<M~~--------~ • 3' FOR EACH WRAP REINFORCEMENT - - - - - ~
------~ DlB£OIIENT EACH WRAP
3
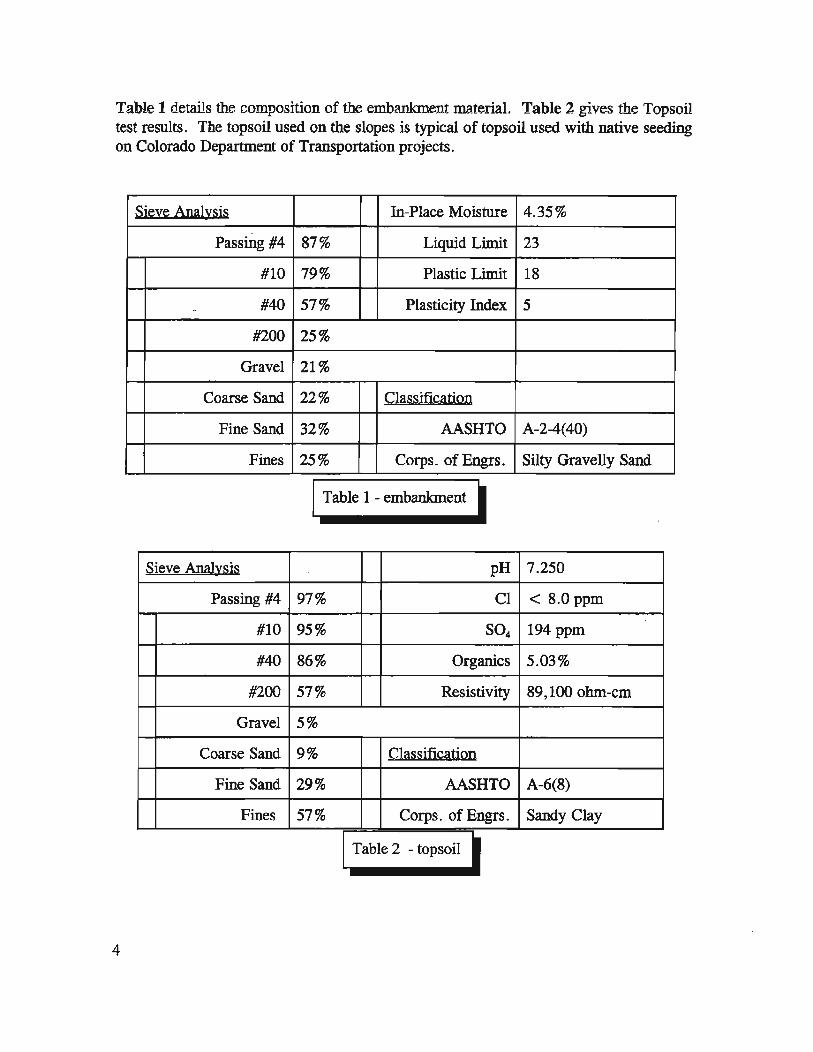
Table 1 details the composition of the embankment material. Table 2 gives the Topsoil test results. The topsoil used on the slopes is typical of topsoil used with native seeding on Colorado Department of Transportation projects.
Sieve Anal~sis In-Place Moisture 4.35%
Passing #4 87% Liquid Limit 23
#10 79% Plastic Limit 18
- #40 57% Plasticity Index 5
#200 25%
Gravel 21%
Coarse Sand 22% Clasliifig:t,iQD
Fine Sand 32% AASHTO A-2-4(40)
Fines 25% Corps. of Engrs. Silty Gravelly Sand
I Table I - embankment I
Sieve Anal~sis pH 7.250
Passing #4 97% CI < 8.0 ppm
#10 95% S04 194 ppm
#40 86% Organics 5.03%
#200 57% Resistivity 89,1000hm-cm
Gravel 5%
Coarse Sand 9% Cla:!sification
Fine Sand 29% AASHTO A-6(8)
Fines 57% Corps. of Engrs. Sandy Clay
Table 2 - topsoil I
4
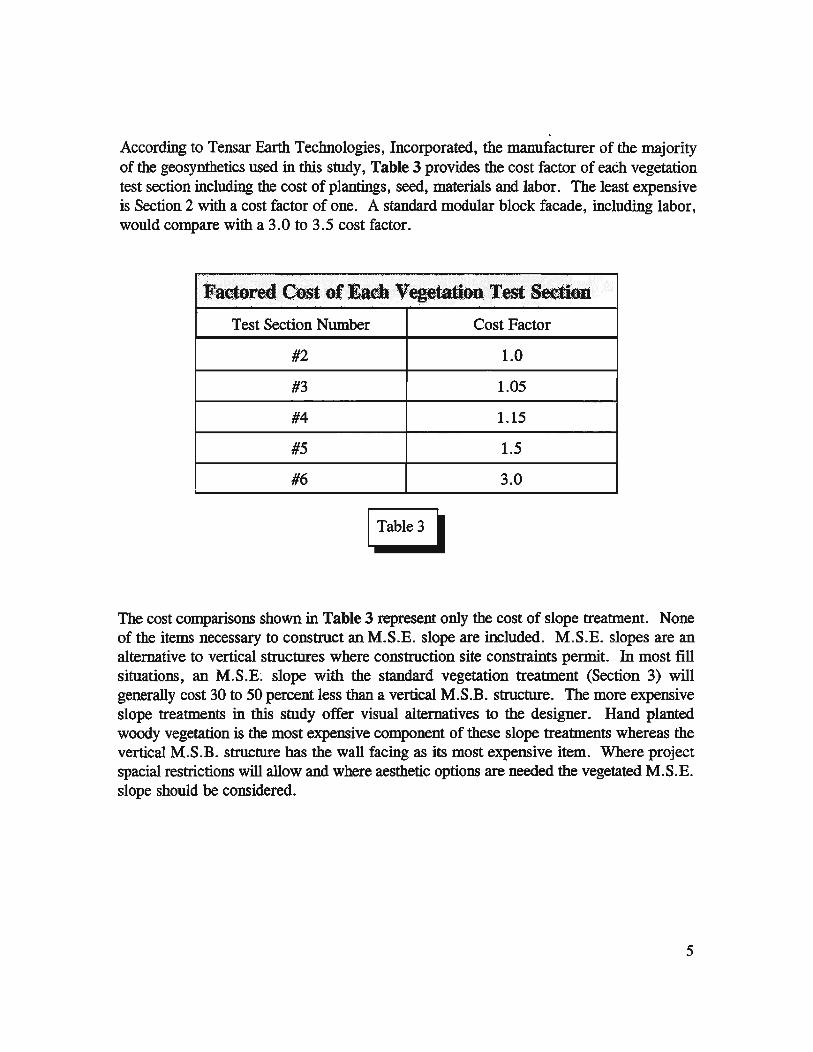
According to Tensar Earth Technologies, Incorporated, the manufacturer of the majority of the geosynthetics used in this study, Table 3 provides the cost factor of each vegetation test section including the cost of plantings, seed, materials and labor. The least expensive is Section 2 with a cost factor of one. A standard modular block facade, including labor, would compare with a 3.0 to 3.5 cost factor .
. F=aetoredCost or Each Vegetation Test SectiOn.
Test Section Number Cost Factor
#2 1.0
#3 1.05
#4 1.15
#5 1.5
#6 3.0
The cost comparisons shown in Table 3 represent only the cost of slope treatment. None of the items necessary to construct an M.S.E. slope are included. M.S.E. slopes are an alternative to vertical structures where construction site constraints permit. In most fill situations, an M.S.K slope with the standard vegetation treatment (Section 3) will generally cost 30 to 50 percent less than a vertical M.S.B. structure. The more expensive slope treatments in this study offer visual alternatives to the designer. Hand planted woody vegetation is the most expensive component of these slope treatments whereas the vertical M.S.B. structure has the wall facing as its most expensive item. Where project spacial restrictions will allow and where aesthetic options are needed the vegetated M.S.E. slope should be considered.
5

VEGETATION
The six revegetation test sections were constructed on the North, South, East and West facing slopes (See Figure A and B above). Following is the vegetation planted on the individual test sections.
Section 1: Control section - No treatment. Section 2: No topsoil, seeded and covered with erosion blanket. See Table 4a and 4b. Section 3: Topsoiled, seeded and covered with erosion blanket. See Table 4a and 4b.
; " ..
S d" aBdj rlilize u d Mj 15 1994 ,"ee' ,·mIX , .. ,': ',' Jr .; .: :; ··rQ;DP· :6'· ., ", ay .: ::', .':: ,,'; .•
COMMON NAME BOTANICAL NAME PLSI ACRES (lbs.)
BLUEGRAMAV.HACHITA BOUTELOUA GRACILIS 1.5
SLENDER WHEATGRASS V. PRYOR ELYMUSTRACHYCAULUS 5
WESTERN WHEATGRASS V. ARRIBA PASCOPYRUM SMITHII 10
LITTLE BLUESTEM V. PASTURA SCHIZACHYRIUM SCOPARIUM 2
BUFFALO GRASS V. TEXOKA BUCHLOE DACTYLOIDES 10
SIDEOATS GRAMA V. VAUGHN BOUTELOUACURT~ENDULA 6
BLANKET FLOWER GAILLARDIA ARISTATA 2
BLUE FLAX UNUM PERENNE 1
PRAIRIE CONEFLOWER RATIBIDA COLUMNIFERA 0.25
YARROW ACHILLEA MILLEFOLIUM 0.2
TOTAL 37.95
·COMMERCIAL FERTILIZER ANALYSIS (~) LBS.lACRE AVAILABLE
NITROGEN 18 45
PHOSPHORUS 46 115
POTASSIUM 0
Table4a I 6
.. .. .. . . . .
. Se. m~ qp.plied September,. 1·9N. No/et18izer .plietl.
COMMON NAME BOTANICAL NAME PLSLACRES (lbs .)
BLUEGRAMAV.HAcffiTA BOUTELOUA GRACIUS 1.5
SLENDER~ATGRASSV.PRYOR ELYMUSTRACHYCAULUS 5
WESTERN WHEATGRASS V. ARRIBA PASCOPYRUM SMITHll 10
lITrLE BLUESTEM V. P ASTURA SCHIZACHYRIUM SCOPARIUM 2
BUFFALO G~S V. TEXOKA BUCHLOE DACTYLOIDES 10
SIDEOATS GRAMA V. VAUGHN BOUTELOUACURTWENDULA 6
BLANKET FLOWER GAILLARDIA ARISTATA 2
BLUE FLAX LINUM PERENNE 1
PRAIRIE CONEFLOWER RATIBIDA COLUMNIFERA 0.25
YARROW ACffiLLEA MILLEFOLIUM 0.2
CANADA BLUEGRASS V. RUEBES POA COMPRESSA 0.5
SHEEP FESCUE FEsTUCA OVINA 12
TOTAL 50.45
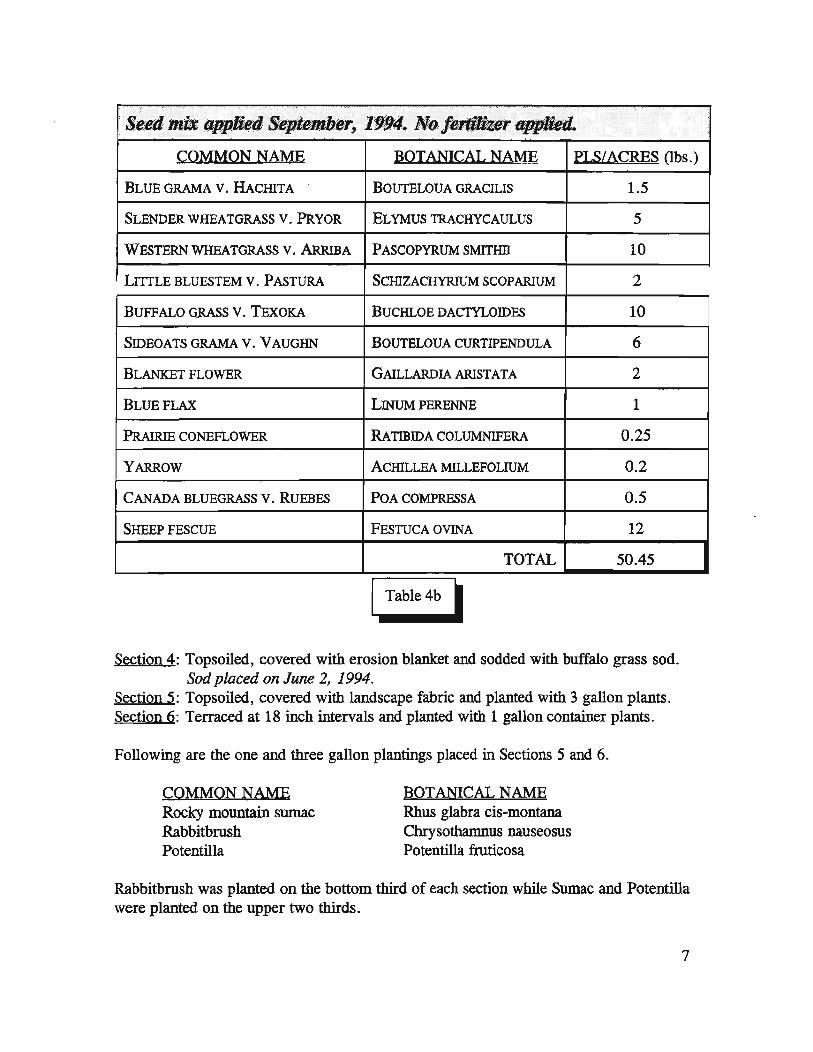
I Table4b I Section 4: Topsoiled, covered with erosion blanket and sodded with buffalo grass sod.
Sod placed on June 2, 1994. Section 5: Topsoiled, covered with landscape fabric and planted with 3 gallon plants. Section 6: Terraced at 18 inch intervals and planted with 1 gallon container plants.
Following are the one and three gallon plantings placed in Sections 5 and 6.
COMMON NAME
Rocky mountain sumac Rabbitbrush Potentilla
BOTANICAL NAME
Rhus glabra cis-montana Chrysothamnus nauseosus Potentilla fruticosa
Rabbitbrush was planted on the bottom third of each section while Sumac and Potentilla were planted on the upper two thirds.
7
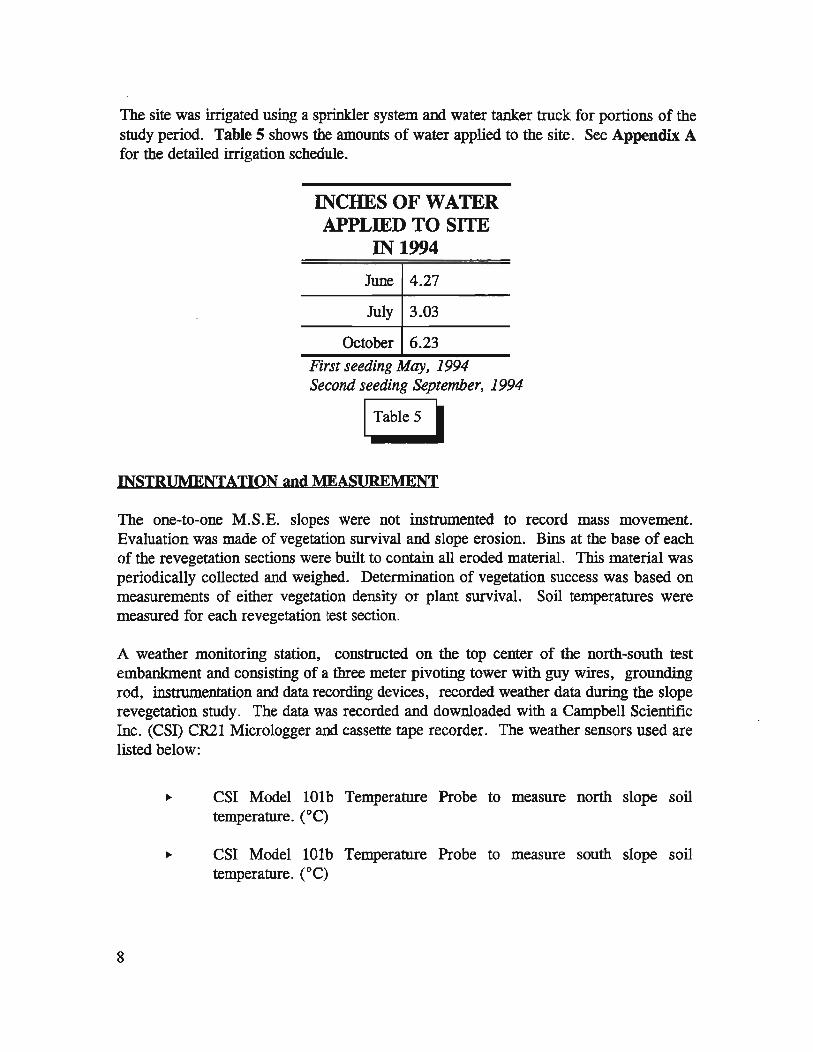
The site was irrigated using a sprinkler system and water tanker truck for portions of the study period. Table 5 shows the amounts of water applied to the site. See Appendix A for the detailed irrigation schedule.
INCHES OF WATER APPLIED TO SITE
IN 1994
June 4.27
July 3.03
October 6.23
First seeding May, 1994 Second seeding September, 1994
I Table5 •
INSTRUMENTATION and MEASUREMENT
The one-to-one M.S.E. slopes were not instrumented to record mass movement. Evaluation was made of vegetation survival and slope erosion. Bins at the base of each of the revegetation sections were built to contain all eroded material. This material was periodically collected and weighed. Determination of vegetation success was based on measurements of either vegetation density or plant survival. Soil temperatures were measured for each revegetation test section.
A weather monitoring station, constructed on the top center of the north-south test embankment and consisting of a three meter pivoting tower with guy wires, grounding rod, instrumentation and data recording devices, recorded weather data during the slope revegetation study. The data was recorded and downloaded with a Campbell Scientific Inc. (CSI) CR21 Micrologger and cassette tape recorder. The weather sensors used are listed below:
8
CSI Model lOtb Temperature Probe to measure north slope soil temperature. eC)
CSI Model lOtb Temperature Probe to measure south slope soil temperature. eC)

CSI Model 101 Temperature Probe to measure level ground soil temperature. (DC)
CSI Model 201 TemperaturelRelative Humidity (RH) Probe to measure air temperature (DC) and relative humidity (%)
Qualimetrics Silicon Cell Pyranometer Model 3120 to measure solar radiation. (W Im'l)
.. Met-One Model 024A Wind Direction Sensor to measure wind direction (in degrees with north equal to zero degrees)
.. Met-One Model 014A Wind Speed Sensor to measure wind speed (m/s)
.. CSI Model TE525 Tipping Bucket Rain Gage to measure rainfall (mm)
The sensors were sampled every ten seconds by the CR21 Micrologger and data values were computed and recorded every six hours (6:00 am, 12:00 pm, 6:00 pm, 12:00 am).
The air and soil temperature probes had maximum, minimum and average temperatures computed for each six hour period. The TemperaturelRH probe and Pyranometer recorded average percent relative humidity and average solar radiation over the same periods. A wind vector program computed mean wind speed, mean wind vector magnitude, mean wind vector direction and standard deviation using the wind direction and wind speed sensors. The tipping bucket gage recorded time of rainfall events and total rainfall over the six hour period. Micrologger identification number and battery voltage were also recorded to monitor the status of the recording device. The recorded data were converted from Micrologger format on the cassette tape to ASCn fIle format for interpretation and storage.
Data from existing local weather stations operated by the Denver Water Department was used in addition to the on-site weather station data.
RESULTS AND DISCUSSION
Erosion Control Eroded material was collected and weighed twice during the study period. The eroded soil collected was essentially dry except for that from Section 1. This section had a large amount of material which tended to be moist throughout. Moisture contents were determined and used for Section 1 samples to compute dry weight. Table 6 shows factored values for total eroded material collected during the study period.
9
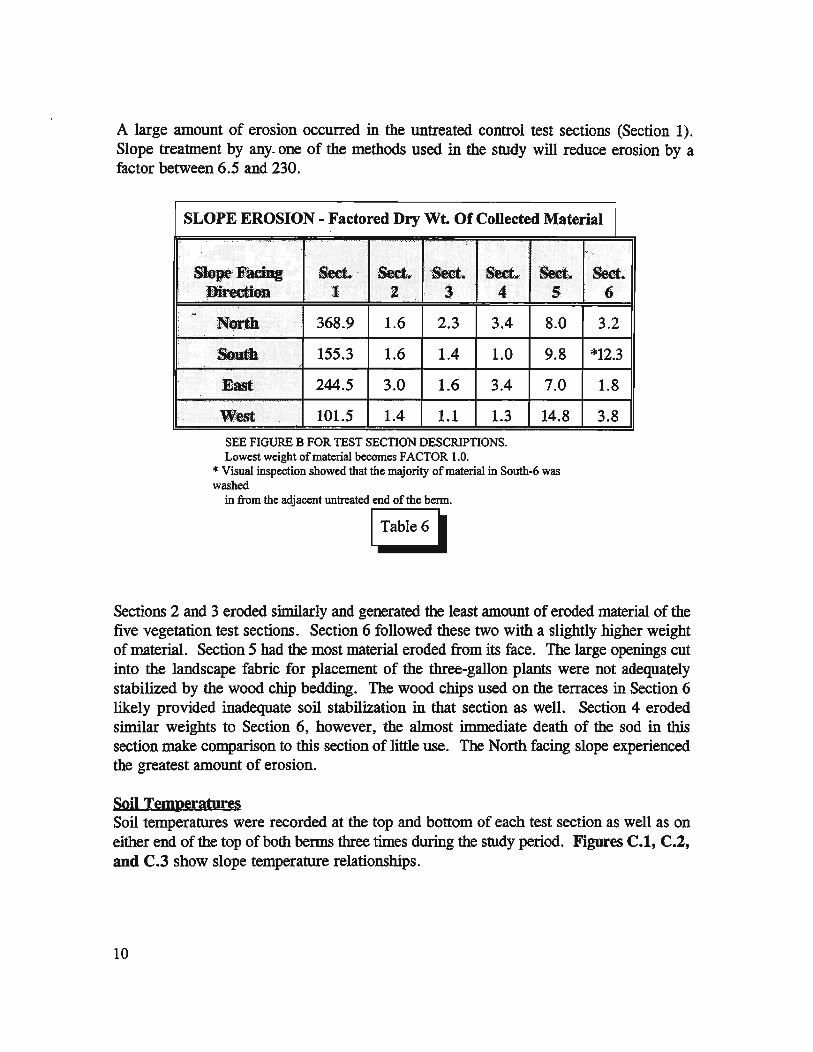
A large amount of erosion occurred in the untreated control test sections (Section 1). Slope treatment by any- one of the methods used in the study will reduce erosion by a factor between 6.5 and 230.
SLOPE EROSION - Factored Dry Wt. Of Collected Material I ......
Slope: Facing ...... ,' .. Sect. . Sect. :sect. Sea. Sect.
~
l)irection :t 2 3 4
N.,. 368.9 1.6 2.3 3.4
SbDth 155.3 1.6 1.4 1.0 ..
East 244.5 3.0 1.6 3.4
West 101.5 1.4 1.1 1.3
SEE FIGURE B FOR TEST SECTION DESCRIPTIONS. Lowest weight of material becomes FACTOR 1.0.
5
8.0
9.8
7.0
14.8
• Visual inspection showed that the majority of material in South-6 was washed
in from the adjacent untreated end of the berm.
I Table 6 I
. ..
Sect. 6
3.2
*12.3
1.8
3.8
Sections 2 and 3 eroded similarly and generated the least amount of eroded material of the five vegetation test sections. Section 6 followed these two with a slightly higher weight of material. Section 5 had the most material eroded from its face. The large openings cut into the landscape fabric for placement of the three-gallon plants were not adequately stabilized by the wood chip bedding. The wood chips used on the terraces in Section 6 likely provided inadequate soil stabilization in that section as well. Section 4 eroded similar weights to Section 6, however, the almost immediate death of the sod in this section make comparison to this section of little use. The North facing slope experienced the greatest amount of erosion.
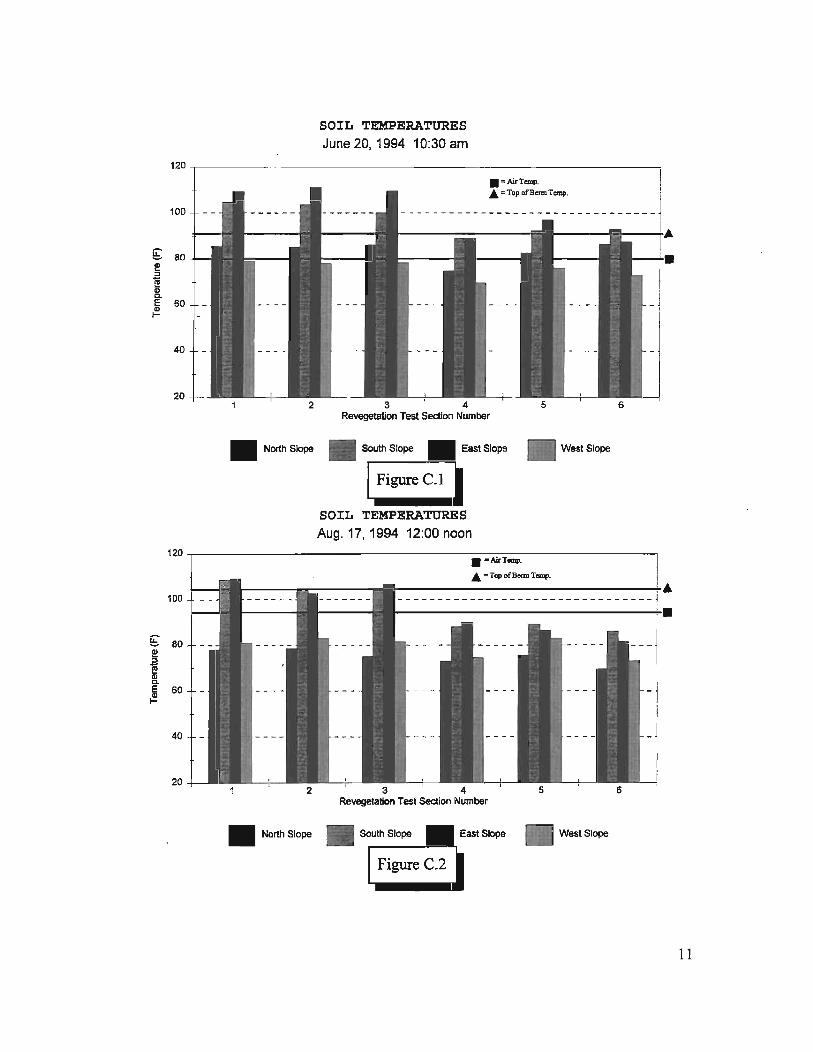
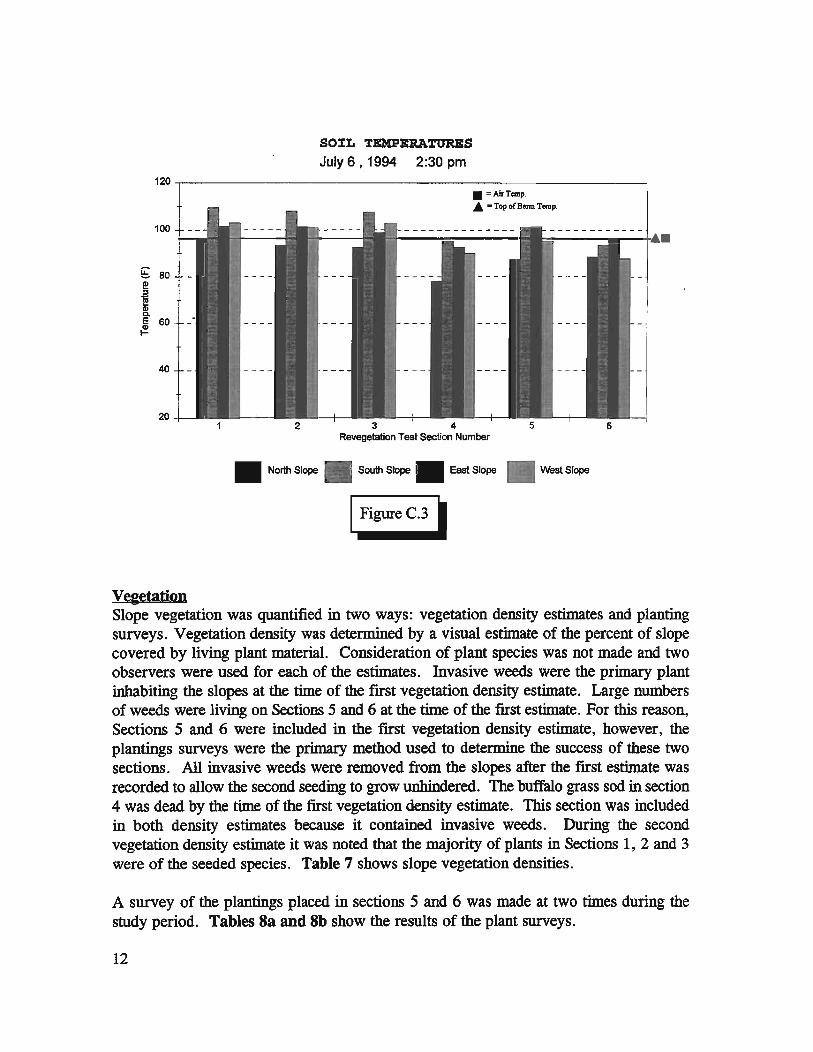
SQiI Temperatures Soil temperatures were recorded at the top and bottom of each test section as well as on either end of the top of both berms three times during the study period. Figures C.I, C.2, and C.3 show slope temperature relationships.
10
120
100
~ 80 ! :::l
~ II) Co E 60 Gl I-
40
20
120
100
~ 80 I!!
~ Gl Co E 60 Gl I-
40
20
2
North Slope
2
North Slope
SOIL TEMPERATURES June 20,1994 10:30 am
• = Air Temp . • = Top of Berm Temp.
3 4 Revegetation Test Section Number
SOIL TEMPERATURES Aug. 17, 1994 12:00 noon
• a AirTemp .
5
• = Top ofBorm T_
3 4 5 Revegetation Test Section Number
West Slope
West Slope
6
11
120
100
~ 80 I!!
~ CD Co E 60
{!!.
40
20 2
North Slope
Vegetation
SOiL TEMPERATURES
July 6 ,1994 2:30 pm
• = Air Temp .
.. - Top afB""" Temp.
3 4 5 Revegetation Test Section Number
South Slope III East Slope West Slope
I Figure C.31
6
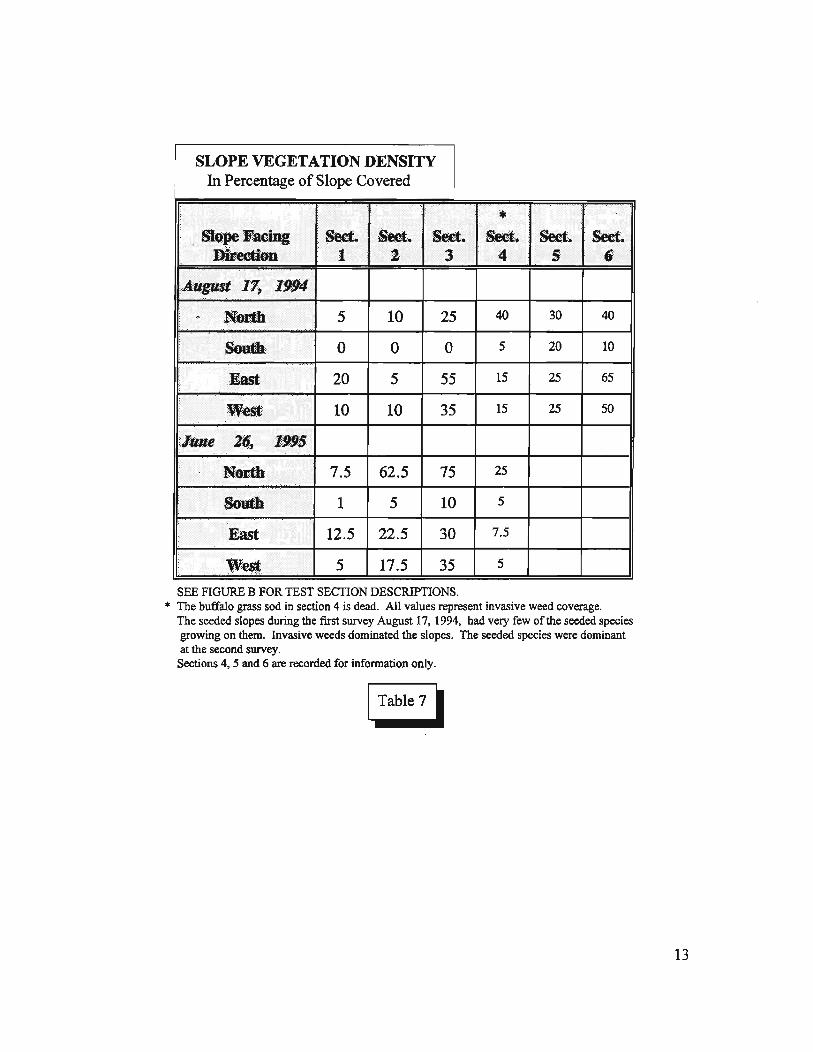
Slope vegetation was quantified in two ways: vegetation density estimates and planting surveys. Vegetation density was determined by a visual estimate of the percent of slope covered by living plant material. Consideration of plant species was not made and two observers were used for each of the estimates. Invasive weeds were the primary plant inhabiting the slopes at the time of the first vegetation density estimate. Large numbers of weeds were living on Sections 5 and 6 at the time of the first estimate. For this reason, Sections 5 and 6 were included in the first vegetation density estimate, however, the plantings surveys were the primary method used to determine the success of these two sections. All invasive weeds were removed from the slopes after the first estimate was recorded to allow the second seeding to grow unhindered. The buffalo grass sod in section 4 was dead by the time of the first vegetation density estimate. This section was included in both density estimates because it contained invasive weeds. During the second vegetation density estimate it was noted that the majority of plants in Sections 1, 2 and 3 were of the seeded species. Table 7 shows slope vegetation densities.
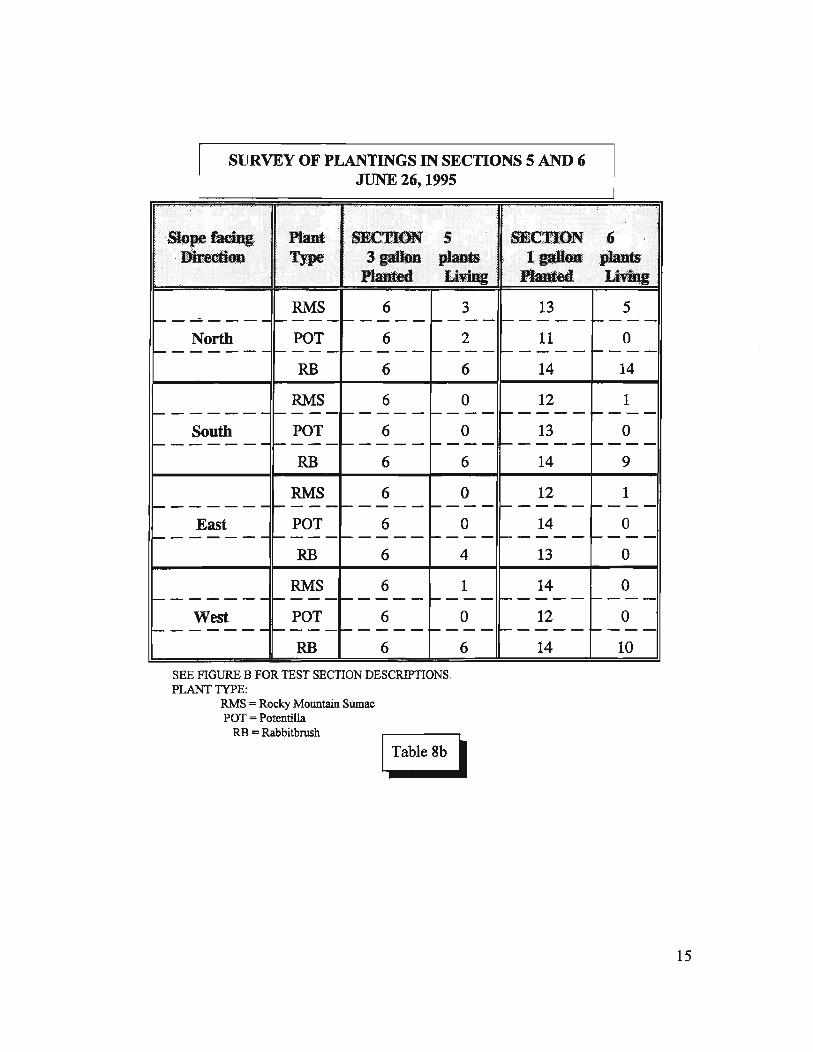
A survey of the plantings placed in sections 5 and 6 was made at two times during the study period. Tables Sa and Sb show the results of the plant surveys.
12
SLOPE VEGETATION DENSITY In Percentage of Slope Covered
SlQ~F~cing Sect. Sect. Sect. Direction 1 2 3
"Aug{lSt 17, 1994
NOdh 5 10 25
South 0 0 0
. East 20 5 55
w.~s.t 10 10 35
tlfllU! ZQ., 1895
North 7.5 62.5 75
South 1 5 10
East 12.5 22.5 30
W~ 5 17.5 35
SEE FIGURE B FOR TEST SECTION DESCRIPTIONS.
* Sed:., Sect~ Seet~
4 5 6 . .
40 30 40
5 20 10
15 25 65
15 25 50
25
5
7.5
5
* The buffalo grass sod in section 4 is dead. All values represent invasive weed coverage. The seeded slopes during the first survey August 17, 1994, had very few of the seeded species growing on them. Invasive weeds dominated the slopes. The seeded species were dominant at the second survey.
Sections 4, 5 and 6 are recorded for information only.
13

14
SURVEY OF PLANTINGS IN SECTIONS S AND 6 AUGUST 17, 1994
SlopefaciDg Plant SECTION S .Dir:ectmn Type " .. : 3 gallon plants
Planted Lirillg -
RMS 6 4 - ---- ------- - - -- r----North POT 6 4
-- ---- - ---- - ---- ----RB 6 6
RMS 6 4 1-- ---- --~--- 1-- - - -- ----
South POT 6 0 1--- ---- - 1-----1----- - ----
RB 6 6
RMS 6 5 -- - --- - f-o---- 1-- -- -- 1-----
East POT 6 1 -- ---- - ----~ ---- 1-----
RB 6 6
RMS 6 6 - ----- - -------- - ----
West POT 6 3 - ---- -- ----- -- -- r----RB 6 6
SEE FIGURE B FOR TEST SECTION DESCRIPTIONS. PLANT TYPE:
RMS = Rocky Mountain Sumac POT = Potentilla
RB = Rabbitbrush
SECTION . , " .~. ~ .'
19ai.on Planted
13 ~- ---
11 ~--- -
14
12 -----13 -----14
12 -----14
f-o-----
13
14 1------
12 ~ ----
14
, pIanIs. L·· · . · IV:IIlg
13 r---
1 ---14
4 ---"
1 ---13
9 ---0
r- - --1
10 1-----
3 r---
13
SURVEY OF PLANTINGS IN SECTIONS 5 AND 6 JUNE 26, 1995
.. SkJpefadng Plaut SECTION S Direction· Type 3galhm plants
lanted P , ..•. L·" • . 'IVIllg
RMS 6 3 ~ ---""--- - ..... _-- f-- - - - - .... _--
North POT 6 2 1--- --- - - ,.---- ,.--- -- ~---
RB 6 6
RMS 6 0 - ----- - 1"'---- - --- - I-- -- -South POT 6 0
-- --- --1"'----1"'-- - -- 1-----
RB 6 6
RMS 6 0 1"'-------1-----1-- --- - r--- -
East POT 6 0 I"'- -- -- - - ---- "-- - --- r----
RB 6 4
RMS 6 1 ~---- - - ----- --- - ----
West POT 6 0 I"'- - -----~--- - -- - - ----
RB 6 6
SEE FIGURE B FOR TEST SECTION DESCRIPI10NS. PLANT TYPE:
RMS = Rocky Mountain Sumac POT = Potentilla
RB = Rabbitbrush
SECTION 19dou;
Planted
13 - ----11
~----
14
12 1-- - - - -
13 -- -- --14
12 - ----14 - --- -13
14 I"'- - - - -
12 ~ ----
14
,
6 pJants. :' :
lb' · ..'1lqI . '.,'. "'. :
5 1-----
0 ~---
14
1 ----0 ----9
1 1-----
0 1-----
0
0 ------0
1-----
10
15

CONCLUSION
Eyapotranspiration Rates Plant growth is largely a function of temperature and available moisture. Inadequate moisture will prevent seed germination and lead to wilting. Adequate temperature for seed germination and plant growth is necessary while excessive temperatures lead to high evapotranspiration (ET) rates. As plant ET increases, so does the need for available moisture to the plant in the form of precipitation or irrigation. Temperature's affect on plant ET can be seen in the Blaney-Criddle Formula as described below: l
u = kf
where u = ET
With
ET =
k = Empiracle ET coefficient for a month = ~xkc·
~ = 0.0173t - 0.314
kc = plant growth stage coefficient
f = (t x p)+l00
t = Average monthly temperature and p = Monthly percentage of daylight hours in the year,
0.0 173fkcP - 0.314tkJ2 100
This relationship between temperature and ET was used to compute the on-site ET values shown in Table 9. This method of computing ET is less realistic than the method used by the Denver Water Department in computing ET rates.2 Denver Water Department ET rates are based on solar radiation, air temperatures, relative humidity and wind conditions. Since the seed mix used on the study slopes required at least 30 percent less water than the alfalfa crop upon which the Denver Water Department ET rates are based, the factored off-Site ET rates shown in Table 9 are 70 percent of the Denver Water Department rates.
IV. S. Deparbnent of Agriculture, Soil Conservation Service, Engineering Division, Technical Release No. 21 (Rev. 2), April 1967, Revised September 1970.
2Denver Weather Station Infonnation, compiled by the Denver Water Department and posted on the Galacticomm Bulletin Board System at (303)628-6365, Denver Water Department, Denver, Colorado.
16
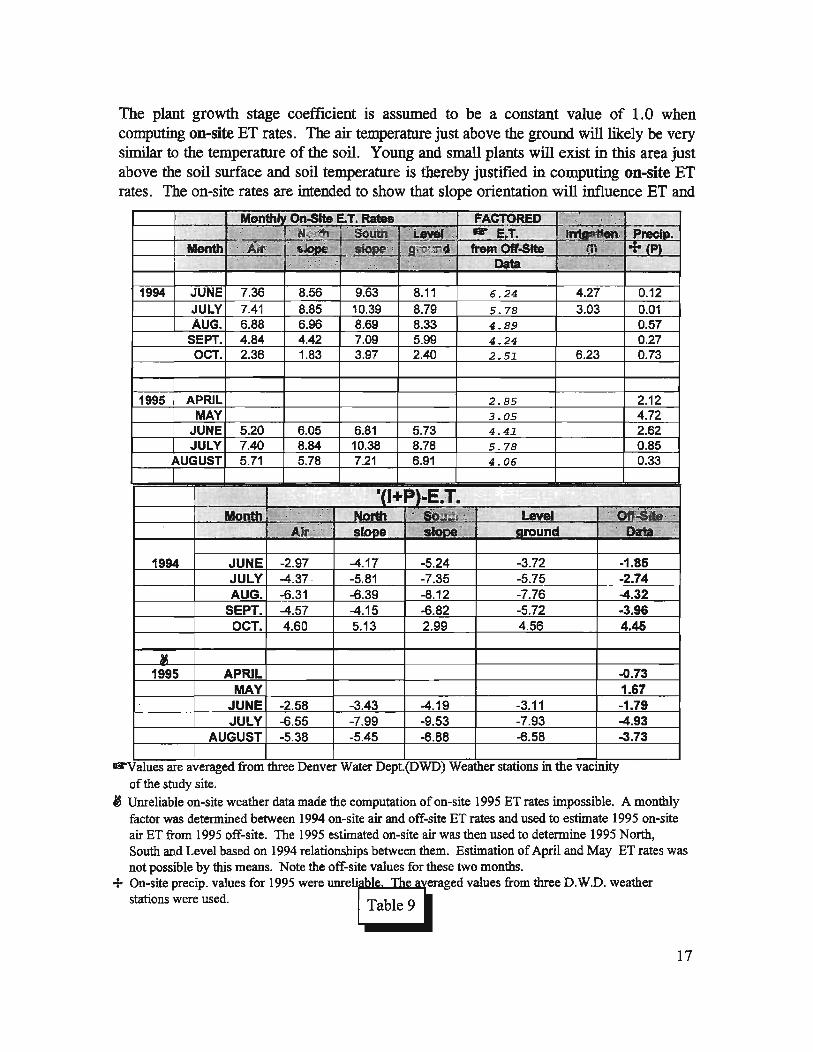
The plant growth stage coefficient is assumed to be a constant value of 1.0 when computing on-site ET rates. The air temperature just above the ground will likely be very similar to the temperature of the soil. Young and small plants will exist in this area just above the soil surface and soil temperature is thereby justified in computing on-site ET rates. The on-site rates are intended to show that slope orientation will influence ET and
M~ On-Site E. T. Rates F~ .~~ 1-:---:--'H6~ . SO.Uih, ' leWiI ; ... E.T. ,~ Precis •
Month .... ~ ... . $iOii .--: ,~I hm Otf-stte . . ril. · ofe(p) I .. ' . . Data . . . '
1994 JUNE 7.36 8.56 9.63 8.11 6.24 4.27 0.12 JULY 7.41 8.85 10.39 8.79 5.78 3.03 0.01 AUG. 6.88 6.96 8.69 8.33 4.89 0.57
SEPT. 4.84 4.42 7.09 5.99 4.24 0.27 OCT. 2.36 1.83 3.97 2.40 2.51 6.23 0.73
1995 APRIL 2.85 2.12 MAY 3.05 4.72
JUNE 5.20 6.05 6.81 5.73 4.41 2.62 JULY 7.40 8.84 10.38 8.78 5.78 0.85
AUGUST 5.71 5.78 7.21 6.91 4.06 0.33
I '(I+P)-E.T. Month
.. ''''.: ' ~rth ,. SOl.'itI :. · Level Air-: . slooe SItma- around '. Data ·
1994 JUNE -2.97 -4.17 -5.24 -3.72 -1.85 JULY -4.37 · -5.81 -7.35 -5.75 -2.74 AUG. -6.31 -6.39 -8.12 -7.76 -4.32
SEPT. -4.57 -4.15 -6.82 -5.72 -3.96 OCT. 4.60 5.13 2.99 4.56 4.45
M 1995 APRIL -0.73
MAY 1.67 JUNE -2.58 -3.43 -4.19 -3.11 -1.79 JULY -6.55 -7.99 -9.53 -7.93 -4.93
AUGUST -5.38 -5.45 -6.88 -6.58 -3.73
.. .... Values are averaged from three Denver Water Dept.(DWD) Weather stations m the vaclIllty
of the study site.
.'.
, Umeliable on-site weather data made the computation of on-site 1995 ET rates impossible. A monthly factor was determined between 1994 on-site air and off-site ET rates and used to estimate 1995 on-site air ET from 1995 off-site. The 1995 estimated on-site air was then used to determine 1995 North, South and Level based on 1994 relationships between them. Estimation of April and May ET rates was not possible by this means. Note the off-site values for these two months.
+ On-site precip. values for 1995 were umel~eraged values from three D.W.D. weather
stations were used. ~
17
therefore required available water. The semiarid climate of this study requires irrigation on the North, South, and level ground exposures to establish plant growth. The South facing slopes will require the most irrigation water. See Figures C.I, C.2 and C.3 above for additional illustration of the relationship between slope orientation and temperature.
The negative values for (l + P)-ET show that there was not enough water for plant growth after the frrst seeding and planting in June of 1994. According to Climatological Data Annual Summary the Period following the first seeding and planting was drier and hotter than the normal.3 This fact was accentuated on the South and East slopes which were typically wanner than other exposures. The second seeding in October was well irrigated and lost less water to ET. This aided the seed germination but was too late to benefit the plantings placed in June. The mild, wet spring that followed was very beneficial to the seeded slopes as is evidenced in Table 7 detailing the second vegetation density survey.
Another factor which influenced the success of the slope vegetation was slope grade. In comparison to flatter slopes, a forty-five degree slope will allow for a much higher rate of surface runoff and therefore allow less incident water to be used by vegetation. It was apparent during vegetation surveys that much of the water that fell on the smooth slopes (test sections 1 to 4) had settled at the slope base in that vegetation densities were typically greater at the slope bases.
Vegetation Surviyal The buffalo grass sod planted in test sections 4 was dead within approximately one month of its placement. Successful plots of buffalo grass sod under the study site's weather conditions generally require daily watering for the first month followed by every other day watering for half of the second month. The irrigating schedule did not supply nearly the water required for the sod to establish itself. The sod pieces were placed on an erosion blanket in order stabilize the soil/root interface and to prevent the sod from sliding down the slope. However, due to the arid climate, this system likely prevented early root-soil bonding and allowed the sod root systems to dry out.
The plantings experienced mixed success as shown in Tables Sa and Sb. The Potentilla were quickest to dry out and die. The vast majority of the one-gallon Potentilla on all slopes and the 3-gallon Potentilla on the warmer East and South slopes were dead by the first survey. The one-gallon likely lost root moisture sooner than the 3-gallon. All Potentilla were dead at the second surveying except two 3-gallon plants on the North facing slope which was the coolest and was therefor likely the most moist. The Rocky Mountain Sumac were more resistant to drought but still showed large numbers of dead plants of the one-gallon size at the first survey on the South and East slopes. By the
3U. S. Department of Commerce, National Oceanic and Atmospheric Administration, Climatological Data Annual Summary. Colorado. 1994. Volume 99, Number 13,1994, Asheville, North Carolina.
18

second survey essentially all Rocky Mountain Sumac were dead except for approximately half of the 3-gallon and one third of the one-gallon on the North slope. The Rabbitbrush were by far the most successful plantings on all slopes except the East. Sixty-four percent remained alive on the South slope, seventy-one percent survived on the West slope and all plants on the North slope were alive. At the time of the fIrst survey, all but one of the East slope Rabbitbrush were dead. The reason for the high mortality of the Rabbitbrush on the East slope is uncertain. The relative success of the Rabbitbrush could be due to one or both of two factors. First, the species requires the least water for survival of the three plantings used on the site. Second, placement of the Rabbitbrush at the bottom of all slopes resulted in a greater supply of water due to slope runoff. It is likely a combination of these two factors that resulted in the success of the Rabbitbrush plantings .
Two test sections were seeded with a seed mix that bas proven successful in use on many Denver area highway projects. As was noted earlier, the fIrst seeding was largely unsuccessful due to inadequate water supply following seed application. The second seeding was given enough water by irrigation to promote seed germination and strong early grass growth. This seeding was successfully applied to the slopes by spraying the grass seed directly through the erosion blanket. Mild Fall and Spring weather further encouraged grass success on the seeded test sections. The South facing slope fared least well with rather low grass density. This was likely due to the higher temperatures experienced on this slope. The East and West slopes saw similar success while the North slope had by far the most complete slope coverage. Those slopes which received no topsoil before seeding generally had much lower grass coverage. The greater success of the topsoiled test sections is likely due to the topsoil's greater nutrient supply and greater ability to retain water than embankment material alone.
Buffalo grass sod requires a large amount of irrigation water to ensure that it will become established on a steep slope. The high irrigation cost and the relatively high cost of sod will likely make its use uneconomical on most large scale projects. Use of the erosion blanket underneath buffalo grass sod in semiarid climates should be avoided. One-gallon plantings should not be used if three-gallon plantings are available. Three-gallon Rabbitbrush is the best choice of the three in this study. Careful attention to plant bedding will minimize the erosion that is seen when wood chips are used as bedding. Of the two sections with plantings Section 6 is more costly but more aesthetically pleasing. If budget will permit and plantings are the desired slope treatment, the terraces as in Section 6 planted with three-gallon Rabbitbrush would be the most successful and appealing revegetation choice. Sections 2 and 3 are the most cost effective of the treatments and will erode the least. Topsoil before seeding is worth the additional cost. Watering commensurate with evapotranspiration is necessary until the plot is established.
19
Recommendations
The cost to construct a one-to-one M.S.E. slope is much less than the cost to construct either a concrete cantilever wall or a mechanically stabilized backfill (MSB) wall. Cantilever walls can be 50 to 75 percent more expensive and MSB walls can be 3Q to 50 percent more expensive than an M.S.E. slope with topsoil, erosion blanket and seed. Where project spacial restrictions will allow and where aesthetic options are needed the vegetated M.S.E. slope should be considered assuming irrigation can be provided to suppliment precipitation as necessary to establish plant growth. The type of slope vegetation treatment will largely be a function of project budget and desired visual effect.
Selection of M.S.E. slopes in semiarid areas « 15" annual rainfall) should be limited to plantings with native grass species on East, West or North facing slopes with temporary irrigation used for initial plant establishment. Ornamental plantings on M.S.E. slopes should be limited to low height East, West, and North facing slopes where permanent irrigation is available. Sediment loss from the test slopes was controlled in all test sections regardless of the success of vegetation. The erosion control systems described in this study were effective in reducing soil loss on one-to-one slopes to a negligible amount.
20
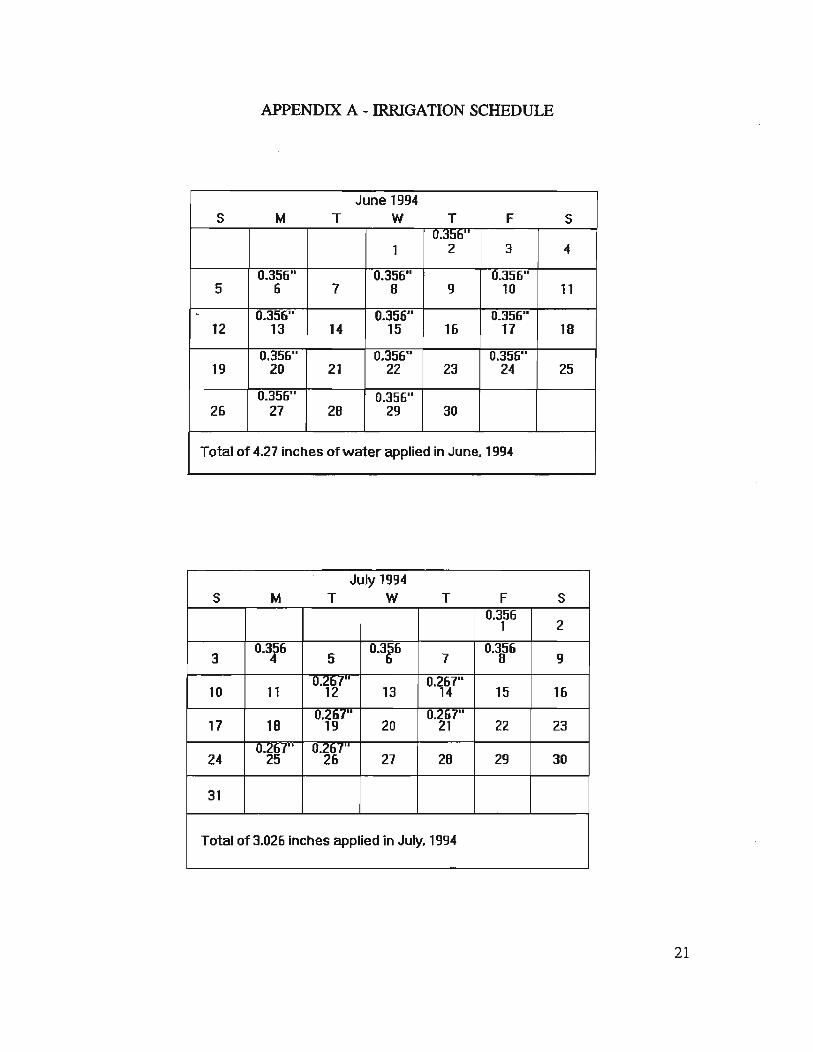
APPENDIX A - IRRIGATION SCHEDULE
June 1994 S M T W T F S
O.j:Jb" 1 2 3 ..
0.356" 0.356" 0.356" 5 6 7 8 9 10 11
- 0.356" 0.356" 0.356" 12 13 14 15 16 17 18
0.356" 0.356" 0.356" 19 20 21 22 23 24 25
0.356" 0.356" 26 27 28 29 30
Total of 4.27 inches of water applied in June. 1994
July 1994 S M T W T F S
0.356 1 2
0.3~6 0.356 0.356 3 5 6 7 B 9
10 11 0.~~7" 13 0.267"
14 15 16
O·?!f' 0.267" 17 18 19 20 21 22 23
0.267" 0.2~r 24 25 26 27 28 29 30
31
Total of 3.026 inches applied in July. 1994
21
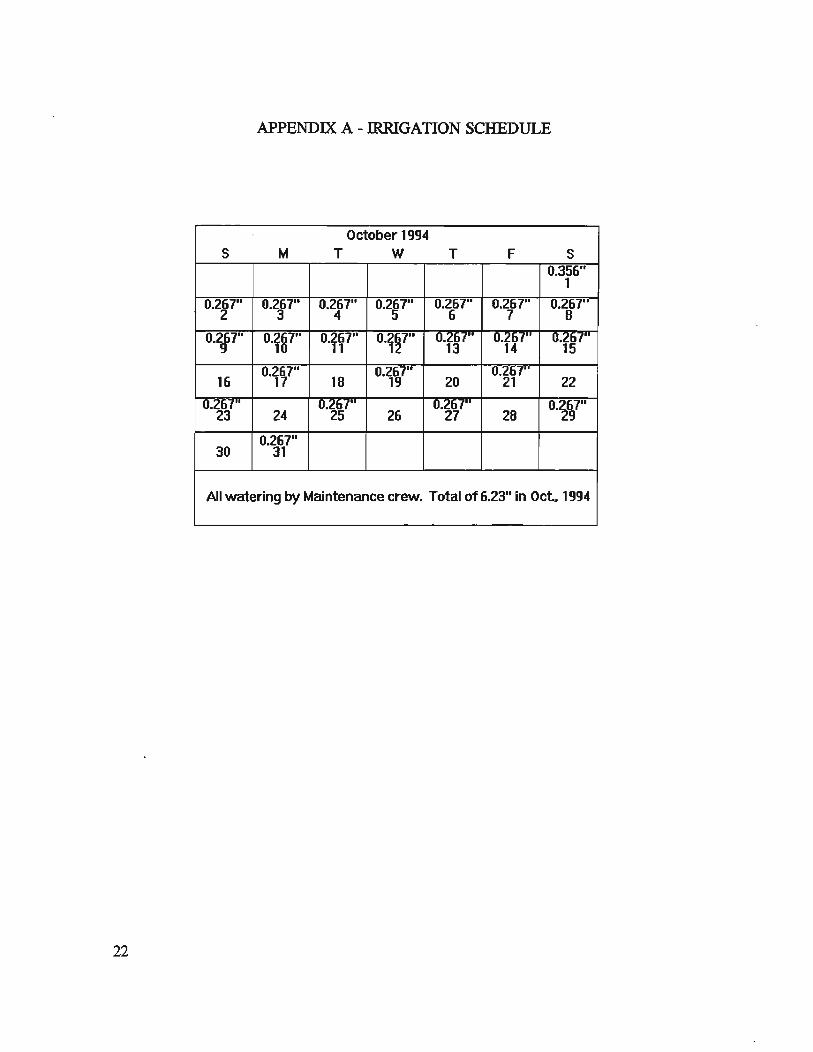
APPENDIX A - IRRIGATION SCHEDULE
October 1994 S M T W T F S
0.356" 1
0.267" 0.267" 0.267" 0.267" 0.267" 0.267" 0.267" 2 3 4 5 6 7 8
0.267" 0.267" 0.267" 0.267" 0.267" 0.267" 0.267" 9 10 11 12 13 14 15
16 0.267"
17 18 0.267"
19 20 O.~~,..
21 22
0.267" 0.267" 0.267" 0.267" 23 24 25 26 27 28 29
0.267" 30 31
All watering by Maintenance crew. Total of 6.23" in Oct .. 1994
22