erm for health insurance from an actuarial perspective a ...€¦ · erm for health insurance from...
TRANSCRIPT

ERM for health insurance from an actuarial perspective A discussion paper
By G.C. Orros and J. Smith
Presented to the Institute and Faculty of Actuaries
29 November 2010 (London)


1
ENTERPRISE RISK MANAGEMENT FOR HEALTH INSURANCE FROM AN ACTUARIAL PERSPECTIVE
BY G.C. ORROS AND
J. SMITH
[Presented to the Institute and Faculty of Actuaries in London: 29 November 2010]
ABSTRACT
This paper focuses on Enterprise Risk Management (ERM) and strategic business management for health insurance companies in our world of ‘unknown unknowns’ and the emergence of unexpected risks over time. It illustrates how Chief Risk Officers (CROs) can focus on ‘risk and opportunity management’ through an ERM framework, and thereby balance risks against opportunities, whilst being resilient against ‘unknown unknowns’ and their emergence over time as ‘known unknowns’ and ‘known knowns’. The paper has been designed to meet the broad requirements of health insurers that would like to implement an ERM framework for the effective risk management of their health insurance lines of business. Risk management for health insurers in the context of Solvency II and broader European Commission regulatory requirements is also discussed. The authors discuss how insurers can develop and apply risk management to build resilience in the face of the storms and shocks that may lie ahead.
KEYWORDS
Enterprise risk management; strategic risks; risk and uncertainty; governance; risk appetite; health insurance; healthcare providers; NHS.
CONTACT ADDRESS George Orros, BA, MSc., MBA, FIA, FCII, C.Stat, Chartered Insurer, Marsh Ltd., Tower Place, London, EC3R 5BU, United Kingdom. Tel: +44(0) 207 357 2768. E-mail: [email protected]
1. INTRODUCTION
1.1 Background
1.1.1 Health insurers and healthcare providers succeed and fail for many reasons, and the management of unexpected or unpredictable events has always attracted interest. Furthermore, there is a growing realisation that there is upside as well as downside risk potential. This leads to the concept of risk and opportunity management as being the cornerstone of effective enterprise risk management.
1.1.2 This paper has been written by two health insurance actuaries who are interested in such events (or risk) and the possibilities for risk and opportunity management. Consideration has been given to both the short-term and long-term features of UK health insurance business. While the paper takes a health insurance perspective, the authors believe it may have wider applicability. Note that, in this paper, we are narrowing our view of health and care insurances to only those health insurance products that cover the costs of care provided in the event of illness or injury. We do not consider products that cover lost income or debt servicing obligations that are sometimes referred to as income protection.

2
1.1.3 Enterprise Risk Management is not purely an actuarial preserve; it is important to recognise that it is relevant to all areas of healthcare and that most of the work to date has been carried out by non-actuaries. Our discussion suggests that the opportunities for actuaries to make a meaningful contribution are growing, especially given rapidly changing UK regulatory and capital market conditions, including Solvency II developments.
1.1.4 ERM has been around for many years and yet it has had a chequered history, only recently starting to be fully adopted by companies in the UK insurance and financial service markets and elsewhere around the world. Elements of ERM have also been applied throughout the UK National Health Service (NHS) and other UK government agencies.
1.1.5 Continued development of the regulatory environment and the sophistication of risk analysis techniques have changed approaches adopted by health insurers and the wider community of life and non-life insurance companies. ERM is now commonly accepted as a necessary part of any successful health insurer’s modus operandi, even if what ‘good ERM’ means is not commonly understood. ERM appears here to stay.
1.1.6 ERM has become a pivotal component of the forthcoming Solvency II regime for the UK and the European Union. Although this paper is focussed on ERM, substantive references are made to Solvency II, its development and the associated regulatory framework.
1.2 Structure of Paper
1.2.1 Following this introduction, section 2, entitled ‘ERM Framework for Health Insurers’, considers what ERM is and/or should be for UK health insurers. The scope of ERM is discussed and how it varies from what has previously been discussed under the heading of risk management. It summarises key aspects of the ERM process based on what the authors regard as current best practice. The topics include:
(a) ERM framework model that would be suitable for UK health insurance obligations.
(b) ERM process inputs, mechanisms, constraints and outputs for a health insurance company.
(c) Examples and case studies of ERM process tools and techniques for a health insurance company.
1.2.2 Section 3, entitled ‘Practical Examples of Risk and Opportunity Management’, provides a case study example based on innovation portfolio screening tools for health insurance business cases.
1.2.3 Section 4, entitled ‘ERM Framework for Healthcare Providers, Consumers, and Policy Makers’, considers what ERM is and/or should be to these actors in the UK healthcare market, the scope of ERM and how it varies from what has previously been discussed under the heading of risk management. The topics addressed include:
(a) Health insurance ERM context within the UK’s mixed economy of healthcare financing and provision.
(b) ERM practices in the NHS, private healthcare providers and preferred provider networks.
(c) ERM in the healthcare area is not a new thing (e.g. NHS practices, Department of Health, etc.).

3
1.2.4 Section 5, entitled ‘Health insurance under Solvency II’, considers certain aspects of ERM from the perspective of a regulator under the developing Solvency II regulatory regime as it will impact UK health insurers. The topics in this section include:
(a) Solvency II developments and issues for health insurance business.
(b) How health insurance risks are conceptualised under Solvency II as well as how risk-based capital requirements for health insurers will be measured.
(c) Potential health insurance industry reactions to Solvency II developments.
1.2.5 In section 6, entitled ‘Many Risks ... and Many Views on Risk’, having considered risk management perspectives of insurers, providers, consumers, policy makers, and regulators, the threads are pulled together and synthesised to provide a high-level view of ERM for health insurers in a Solvency II world. This poses some interesting questions, such as:
(a) Is health insurance fundamentally different as a class of insurance?
(b) How should one balance long-term customer wants and requirements against the short-term nature of health insurer’s contractual obligations and regulatory requirements?
(c) Are there important risk management gaps arising from of the varying perspectives of participants in the market?
1.2.6 Finally, in section 7, we draw some conclusions.
2. ERM FRAMEWORK FOR HEALTH INSURERS
2.1 Health insurance in the UK is a complex subject from a risk management perspective. It has short-term, medium-term and long-term enterprise risk connotations and these aspects need to be managed to the satisfaction of the key stakeholders.
2.2 There are multiple perspectives on risks in health insurance decisions and purchases. For example, the health insurer may want to manage risk to meet whatever its business objectives are, whereas the regulator may require sufficient capital so that the insurer can manage its risks over a 1-year time horizon. The insured and/or their insured dependants may want the insurer to be solvent in the long-term and to be there to provide relevant insurance cover in future years and also in their old age. Therefore, the health insurance CRO requires a broad ERM framework that can deal with the multifaceted risk perspectives of the key stakeholders.
2.3 The health insurance CRO should also consider the risk perspectives of its key suppliers, such as the private and public sector healthcare providers. These will generally have business objectives and capital investment programmes that will need to be carefully assessed and understood. It will be important, therefore, for the CRO to review their business plans and to consider how these plans may affect their business relationships with the health insurer. This argues for a broad ERM framework that can deal effectively with the interactions between insurers and providers.
2.4 Furthermore, as the NHS in the UK accounts for the great majority of healthcare expenditures, state financing and political considerations can have an important bearing on the ERM issues faced by the health insurers and their planned risk responses. For example, NHS

4
restructuring plans will inevitably affect the complementary and supplementary product mix that the health insurers should offer in response to the changing requirements (given the NHS offerings) of their personal and corporate health insurance customers. This argues for a broad ERM framework that can deal effectively with external sources of risk, such as legal, political, economic and social risks.
2.5 The authors believe that ERM framework models that can deal effectively with the qualitative as well as the quantitative risk issues are likely to be more useful to the health insurance CRO than those with primarily a quantitative focus. It is clear to the authors that, although quantitative risk analysis can be useful, such analysis alone is a necessary but insufficient success criterion. Therefore, the authors favour broadly based ERM framework models that can provide an appropriate balance between the qualitative and the quantitative risk issues.
2.6 The operational risk elements of enterprise risk management, implications of value innovation and blue ocean strategies are outside the scope of this paper. Readers are directed to relevant papers on insurance companies, Orros & Howell (2006), on general insurance, Tripp et al. (2004) and on life assurance, Dexter et al. (2006).
2.7 ERM frameworks for insurance lines of business have been studied by several actuarial research groups, both in the UK and internationally. There have been several Institute of Actuaries papers on the subject, include one on general insurance, Tripp et al. (2008) and another on life insurance, Deighton et al. (2009).
2.8 ERM is viewed as a lead indicator, where a weakening of standards is an indicator of future problems. In particular excellent ERM insurers need to be mentally prepared for soft markets (e.g. credit markets, equity markets, interest rate markets and insurance markets) and understand the implications for risk limits and risk/reward standards in the face of the softening of each of their relevant risk markets.
2.9 In the view of the authors, three of more interesting broadly based ERM framework models for a health insurance CRO would be those associated with COSO, Standard & Poor’s and Chapman. These models were selected from a wider range of ERM frameworks, Orros (2007a), together with an ERM bibliography of 60 relevant publications Orros (2007b).
2.10 A brief discussion of the COSO, Standard & Poor’s and Chapman models is shown in figures 1 – 9.
2.11 COSO ERM Framework Model
2.11.1 COSO (The Committee of Sponsoring Organisations of the Treadway Commission), COSO (2004:2) has defined ERM as follows:
”Enterprise risk management is a process, effected by an entity’s board of directors, management and other personnel, applied in strategy setting and across the enterprise, designed to identify potential events that may affect the entity, and manage risk to be within its risk appetite, to provide reasonable assurance regarding the achievement of entity objectives”.
2.11.2 The COSO Integrated ERM Framework principles and methodologies are a unifying suite of holistic enterprise risk management processes applicable to almost any enterprise or organisation in both the private sector and the public sector (e.g., Government, regulators). Private sector applications can include insurance and financial services business.
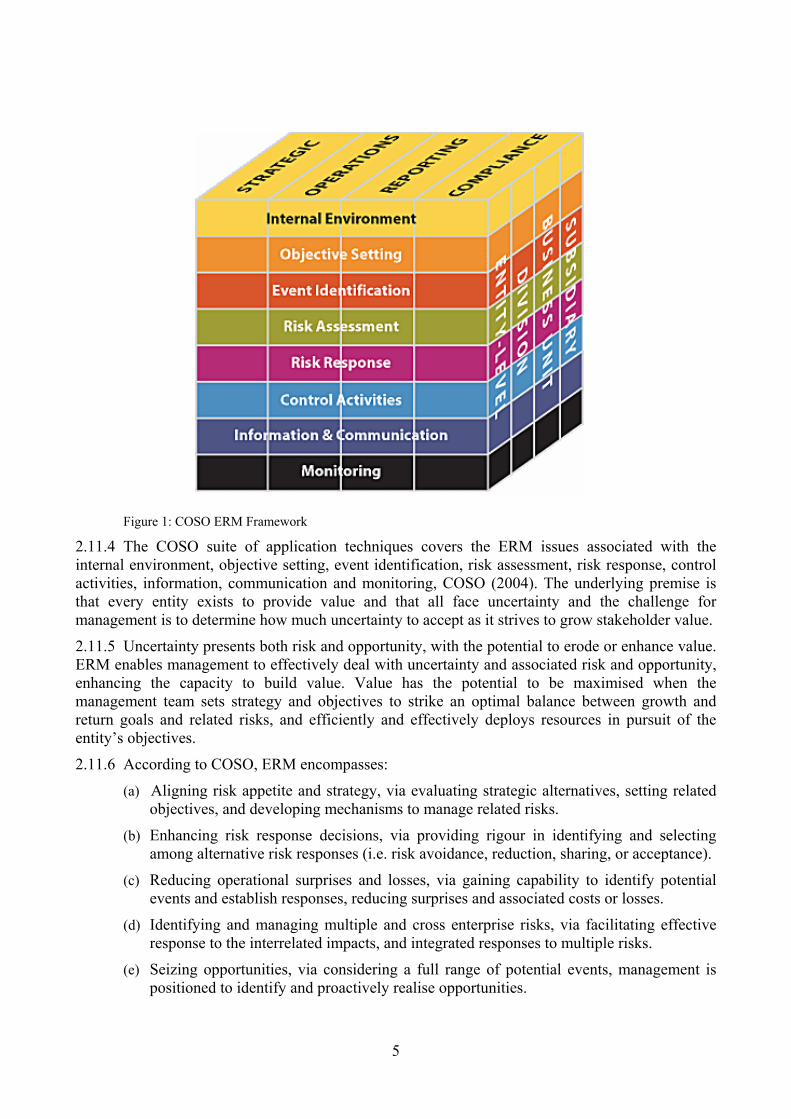
2.11.3 The COSO ERM framework is illustrated in Figure 1.
5
Figure 1: COSO ERM Framework
2.11.4 The COSO suite of application techniques covers the ERM issues associated with the internal environment, objective setting, event identification, risk assessment, risk response, control activities, information, communication and monitoring, COSO (2004). The underlying premise is that every entity exists to provide value and that all face uncertainty and the challenge for management is to determine how much uncertainty to accept as it strives to grow stakeholder value.
2.11.5 Uncertainty presents both risk and opportunity, with the potential to erode or enhance value. ERM enables management to effectively deal with uncertainty and associated risk and opportunity, enhancing the capacity to build value. Value has the potential to be maximised when the management team sets strategy and objectives to strike an optimal balance between growth and return goals and related risks, and efficiently and effectively deploys resources in pursuit of the entity’s objectives.
2.11.6 According to COSO, ERM encompasses:
(a) Aligning risk appetite and strategy, via evaluating strategic alternatives, setting related objectives, and developing mechanisms to manage related risks.
(b) Enhancing risk response decisions, via providing rigour in identifying and selecting among alternative risk responses (i.e. risk avoidance, reduction, sharing, or acceptance).
(c) Reducing operational surprises and losses, via gaining capability to identify potential events and establish responses, reducing surprises and associated costs or losses.
(d) Identifying and managing multiple and cross enterprise risks, via facilitating effective response to the interrelated impacts, and integrated responses to multiple risks.
(e) Seizing opportunities, via considering a full range of potential events, management is positioned to identify and proactively realise opportunities.

6
(f) Improving deployment of capital, via robust risk information that allows management to assess effectively overall capital needs and enhance capital allocation.
2.11.7 ERM capabilities can help management achieve performance and profitability targets and prevent loss of resources. It can help ensure effective reporting, compliance with laws and regulations, and help avoid damage to reputation and associated consequences. Events can have negative or positive impact, or both. Negative impact events can erode existing value. Positive impact events represent opportunities that can inform strategy and objective setting.
2.11.8 Risk appetite can be expressed in terms of a ‘risk map’, such as the map in Figure 2. Any significant residual risk in the map’s yellow area exceeds the company’s risk appetite, and requires management action to reduce the likelihood and/or impact of the risk in order to bring it within the company’s risk appetite, COSO (2004).
Low Medium High
Low
Med
ium
Hig
h
ExceedingRisk Appetite
Within Risk Appetite
Impa
ct
Likelihood Figure 2: Risk appetite expressed as a risk map
2.11.9 The company can then strive to diversify its portfolio to earn a return that is aligned with the target risk profile. Inevitably, plotting the current state of the estimated ‘return’ against the ‘capital at risk’ will identify instances where the ‘return’ is insufficient to justify the ‘capital at risk’, according to the company’s risk appetite. In such situations, the associated business plans need to be revised to satisfy the executive management and the Board that the proposed returns are compatible with the capital at risk and the risk appetite. Portfolio diversification may be required in order to propose a ‘return’ that aligned to the target risk profile, closer to the efficient risk/return frontier, rather than lower down in the interior of the risk region, COSO (2004).
2.11.10 A health insurance example of this might be expanding product range to include a broader array of excess level options to policyholders at each renewal. All things being equal, higher excess products make claim costs more volatile and require more policies to diversify. Availing the option to policyholders will also increase selection. However, the option could make a firm’s offering more marketable. The question then becomes whether the firm has the appetite and additional capital to support increased risk exposure, and would expected margins produce a suitable return on capital.
2.11.12 Figure 3 illustrates the principle, and the effects of three business plan revisions that were designed to move three business units closer to the efficient risk frontier.

7
Ret
urn
Capital at Risk Current State
Target State
Global Protection
High Excess Personal
Low Excess PersonalCorporateIndividual Surgical
Health Cash
Hospital Cash Plan
Individual
Figure 3 – Principle and effects of specific business plan revisions
2.12 Standard & Poor’s ERM Framework Model
2.12.1 Standard & Poor’s (2005) provides an ERM evaluation methodology for insurers which consists of seven initial criteria: competitive position, management and corporate strategy, operating performance, capitalisation, liquidity, investments, financial flexibility. ERM rationalises the risk limits and tolerances across different individual risks and allows comparable measures to be applied so that the risk management process can be performed at both the individual risks and enterprise level.
2.12.2 Risk capital values can also be linked to risk taking activities enabling assessment of projected and historical performance of activities in proportion to their economic capital requirements. Targets can be set for the return on ‘economic capital’ of each activity, capital is allocated to optimise the expected return on economic capital and management efforts to meet targets are assessed.
2.12.3 According to Standard & Poor’s, a health insurer that practices ERM will be working constantly to identify risks and regularly monitor the important risks. It will also have standards and limits in place for the amount and form of the risks that it is prepared to retain or tolerate as well as processes to measure and manage its risks so as to stay within formally agreed limits, within a controlled risk-taking environment.
2.12.4 A health insurer that practices ERM is not one where managers believe that they do not take any risks. Rather, it is a health insurer where managers knowingly take considered risks and understand that losses are probable. In effect, ERM should provide the health insurer with reasonable grounds to believe that it will be able to manage any events and losses within predetermined bounds.
2.12.5 The strategic risk management pillars are illustrated in Figure 4.

8
Risk Management Culture
Strategic Risk ManagementR
isk
Con
trol
Pro
cess
es
Ext
rem
e E
vent
s M
anag
emen
t
Ris
k a
nd E
cono
mic
C
apita
l M
odel
s
Figure 4: Strategic Risk Management Pillars
2.12.6 Standard & Poor’s suggested that ERM as a rating criterion has added weight for insurers as taking risk and then managing it are core insurance business activities. Companies are viewed as having excellent, strong, adequate or weak ERM relative to the risks of the company, its ability to absorb risks and the complexity of the risks.
2.12.7 The Standard & Poor’s ERM classifications relate to sustained capabilities to identify, measure and manage risk exposures and losses within the company’s predetermined tolerance guidelines; evidence of the enterprise’s practice of optimising risk-adjusted returns; and the extent to which risk and risk management are important considerations in corporate decision making.
2.13 Chapman ERM Framework Model
2.13.1 According to Chapman (2006:8-9), the enterprise risk management process is defined as: “ERM is a systematic process, embedded in a company’s system of internal control (spanning all business activity), to satisfy policies effected by its board of directors, aimed at fulfilling its business objectives and safeguarding both the shareholder’s investment and the company’s assets. The purpose of this process is to manage and effectively control risk appropriately (without stifling entrepreneurial endeavour) within the company’s overall risk appetite. The process reflects the nature of risk, which does not respect artificial departmental boundaries and manages the interdependencies between the risks. Additionally, the process is accomplished through regular reviews, which are modified when necessary to reflect the continually evolving business environment.”
2.13.2 Chapman (2006:7) describes the process of ERM, which is essentially one of risk and opportunity management, as impinging:
“on the 4 main functions of Boards; policy formulation, strategic thinking, supervisory management and accountability and their respective control cycles”.
2.13.3 These Board functions are illustrated in Figure 5.

9
Figure 5: ERM Board Functions
Source: Adapted from Garratt (2003).
2.13.4 Chapman (2006) develops an ERM corporate governance model which has five elements:
(a) Corporate governance (Board oversight). (b) Internal control (sound system of internal control). (c) Implementation (appointment of external support). (d) Risk management process (incremental phases of a 6-stage iterative process). (e) Sources of risk (internal and external).
2.13.5 Figure 6 provides an overview of the ERM corporate governance model based on the ideas presented by Chapman (2006). The authors have extended the feedback loop concept to allow for iterations at each of the six ERM process stages. The rationale for this is that it is futile to continue the ERM process if the foundation stages are flawed as a result of subsequent research and review stages.
Accountability Policy Formulation- to the company - creating the vision- to owners - creating the mission- to regulators - creating values- to legislators - developing culture- to other stakeholders - monitoring the environment
Supervisory Management Strategic Thinking- oversight management - positioning in the changing markets- monitoring budgetary control - setting corporate direction- reviewing key business results - reviewing and deciding key resources- ensuring business capability - deciding the implementation process
Short-term Long-termOperations review cycle
Gov
erna
nce
revi
ew c
ycle
Stra
tegy
rev
iew
cyc
le
Policy review cycle
Inte
rnal
Ext
erna
l
Risk and Opportunity Management

10
A1 A2 A3 A4 A5 A6
5. Sources of Risk(internal to a business and emanating from the environment)
Internal Processes Business Operating Environment
Risk Evaluation
Risk Planning
Risk ManagementAnalysis Risk
IdentificationRisk
Assessment
3. Implementation(appointment of external support)
4. Risk Management Processes(incremental phases of an iterative process)
1. Corporate Governance 2. Internal Control(Board oversight) (sound system of internal control)
2.13.6 Under the Chapman model, the enterprise risk management process is a 6-stage iterative process, as illustrated in Figure 7.
A1A2
A3A4
A5A6
Risk Planning Risk
Management
Risk Assessment Risk
Evaluation
Analysis Risk Identification
Figure 7: Chapman (2006) 6-stage ERM process
2.13.7 Each of the six risk management processes has inputs, outputs, control and mechanisms. The modes of data connectivity can be charted using the IDEFO (Integration Definition for Function Modelling) process mapping technique, as illustrated in Figure 8.
Figure 8: IDEFO Process Mapping Technique
InputProcess
Control
Mechanism
Output
Figure 6: Overview of Chapman (2006) ERM Corporate Governance Model

11
2.13.8 The first iterative step is ‘Analysis’, which builds a critical, holistic understanding of the business and the specific business activities and processes. It is the ERM foundation for everything that follows; its accuracy and realism determines the quality of the remainder of the risk management process. Figure 9 provides a typical process map for the Analysis stage.
Figure 9: Typical process map for ERM analysis stage
2.13.9 It is important (for an effective ERM framework implementation) that the ‘Analysis’ stage goals are achieved via active representation and involvement across all business units and functional departments. Active representation means the involvement and committed engagement of the appropriate individuals with the requisite knowledge, experience, perspective and responsibility.
2.13.10 The ‘Analysis’ stage is critical. Should the ‘Analysis’ stage’s detailed numbers research, quantitative analysis or qualitative analysis be flawed then there is a danger that the results of the ERM exercise will also be flawed and, in effect, worthless. Not only does this imply a high degree of care, but also the need for iterative processes to ensure that new data and information is compatible with the previous ERM process outputs. If, for example, a health insurer is considering outsourcing a significant portion of its back office operations to India (and hence significant operational costs), it should not assume that recent foreign exchange rates will persist indefinitely into the future with no potential for large swings that, left unhedged, could create unexpected losses.
2.13.11 The ‘active representation’ process should also involve and engage the Non-Executive Directors and the senior management group. Without their full and committed support, it is unlikely that an effective ERM framework implementation can be achieved.
2.13.12 In order to be judged sufficient, the ‘Analysis’ stage should be planned and evaluated using formal criteria, the use of which encourages rigorous planning of the activities and an objective review (involving non-participants in the process stage).
2.13.13 The ‘Analysis’ stage criteria might include, at a minimum, the following components:
(a) Define and articulate the mission and business objectives.
INPUTS CONSTRAINTS1 Appointment 1 Business risk management culture2 Business objectives and plan 2 Risk management resources3 Process map and organogram 3 Risk management study parameters4 Value chain 4 Risk management plan5 Audit committee6 Internal controls7 Risk management plan8 Financial reports9 Marketing plan
10 Ratio analysis
MECHANISMS A1 OUTPUTS1 Finance analysis tools 1 Business analysis findings2 Risk management process diagnostic3 SWOT questions4 PEST questions5 PESTEL analysis6 Risk mapping7 Causal modelling
Analysis

12
(b) Review and issue a clear, current and accurate business structure document. (c) Review and issue a high-level business process map or flow chart. (d) Identify and review the existing internal control system. (e) Identify and examine all primary business functions. (f) Review the existing corporate risk management plan. (g) Define, articulate and review the remit of the audit committee. (h) Define, articulate and review the remit of the existing risk management committee. (i) Profile the current ERM maturity level of the organisation. (j) Define and articulate risk appetite – in qualitative and quantitative terms. (k) Review the existing risk register. (l) Canvas and engage knowledgeable and expert participants from across the organisation. (m) Engage participants who can input to the project from a position of authority and
expertise. (n) Brief all participants and make them aware of their responsibilities. (o) Consider and consult with non-executive directors where appropriate.
2.14 A1 Analysis Example - Value Chains
2.14.1 Inputs to the process include comprehensive high-level business process maps and value chain analysis. The value chain describes the activities within and around an organisation which combine to create a product or service offering. Value chain analysis enables managers to understand how and where value may be created within the organisation and whether the value chain is aligned to strategic objectives. It should inform risk identification by analysing business activities which are cross referenced to specific strategic objectives. It also provides an input to subsequent assessment, evaluation and planning stages. An ERM-enabled insurer can evaluate the risk/return economics associated with its existing value chain configuration and linkages and plan its risk response strategies to re-configure the value chain as and when required.
2.14.2 Figure 10 provides a typical value chain for a health insurer.
Figure 10: Value chain for a health insurer
Inbound Logistics Service Operations Outbound Logistics
Marketing and Sales After Sales Service Actuarial, NPD, risk assessment, underwriting,
premium rating
Price quotations, new business processing,renewal processes, provider relations
Claims processing,lapse processing, managed care,
assistance service
Promotion, sales, market intelligence,
channel management, client acquisition
CRM, customer services, business
retention, personalised offers
Health and care insurance services
Human Resource ManagementR&D, Technology Development, Systems Development
Procurement
Company infrastructure (for example, ERM, finance, accounting, legal)
Margin
Key to abbreviations: NPD – New Product Development CRM – Customer Relationship Management

13
2.14.3 Referring to the earlier outsourcing example, the analysis stage would also include careful re-mapping of the insurer’s value chain and business process map to allow for the outsourcer’s organisational capabilities, value chain linkages and ‘softer’ aspects such as culture. The insurer needs to understand the nature of the changes to its value chain, business process map and the assumptions implicit within its existing business model. The following brief case study illustrates the types of technique which would enable the insurer to carry out the analyses across multiple business sites including the outsourcer.
2.15 A1 Analysis Case Study – Delphi Method
2.15.1 A major pharmaceutical company decided to obtain investment approval for a new research and development facility in India. A project team with members based in the UK and India was appointed to conduct a risk analysis. A distance-working solution was required in order to conduct the risk identification and assessment processes. The solution proposed was to use email and video-conferencing. A questionnaire was designed as a gap analysis tool to try to identify the risks. A draft risk register was prepared based upon the responses to the questionnaire and used to initiate a review of the risks, Chapman (2006).
2.15.2 A video conference was used to debate and build a consensus on the risk descriptions and their assessment. It was recognised that the video conference was an inferior communication event compared to a face-to-face meeting e.g. sound quality, time lags in transmission and the inability for all of the participants to see each other during discussions. The main objectives were achieved due to the rigour of the questionnaire process, content analysis of the questionnaire responses to form a draft risk register and the facilitation of the video conference workshops. The risk analysis process identified the major risks including weaknesses in the design of the procurement route which was not aligned to the project’s objectives, the lack of a formal business continuity plan and the risks stemming from different stakeholder and client representatives whose requirements had not been ascertained and incorporated within the project plan.
2.15.3 The second iterative step is ‘Risk Identification’, which is a transformation process whereby one generates a series of risks and opportunities that are then recorded on the risk register. As it is a process within ERM, it is useful to adopt the philosophy of process mapping, whereby one process exists to make a contribution to one of more of the ERM goals.
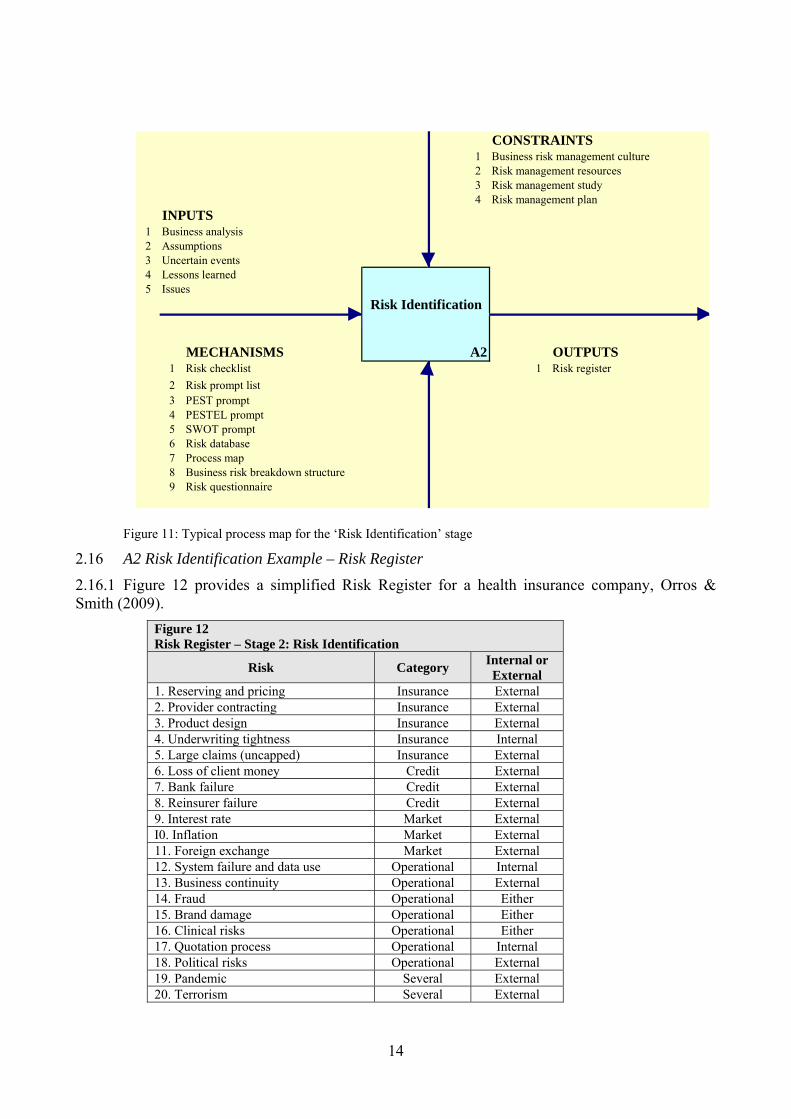
2.15.4 Figure 11 provides a typical process map for the ‘Risk Identification’ stage.
2.15.5 The ‘Risk Identification’ process must be based on a clear understanding of the management and objectives of the overall business or the activities involved. It needs to identify risks to the business which would adversely affect the achievement of its objectives and the opportunities, which may be the upside to an identified risk. The output is a ‘risk register’ of risks and opportunities.
2.15.6 External or internal risk facilitators can improve the quality and value of outputs from this stage by encouraging experienced staff to adopt a more critical, self-conscious and objective methodology to this activity. The process will generate a set of terminology which should be managed to ensure consistency of use and meaning amongst participants. It will also clarify the meaning of and distinction between ‘risk’ and ‘uncertainty’. Failure to create universally understood and accepted definitions will undermine the entire ERM process and create flawed outputs which cannot be implemented.
14
Figure 11: Typical process map for the ‘Risk Identification’ stage
2.16 A2 Risk Identification Example – Risk Register
2.16.1 Figure 12 provides a simplified Risk Register for a health insurance company, Orros & Smith (2009).
Figure 12 Risk Register – Stage 2: Risk Identification
Risk Category Internal or External
1. Reserving and pricing Insurance External 2. Provider contracting Insurance External 3. Product design Insurance External 4. Underwriting tightness Insurance Internal 5. Large claims (uncapped) Insurance External 6. Loss of client money Credit External 7. Bank failure Credit External 8. Reinsurer failure Credit External 9. Interest rate Market External I0. Inflation Market External 11. Foreign exchange Market External 12. System failure and data use Operational Internal 13. Business continuity Operational External 14. Fraud Operational Either 15. Brand damage Operational Either 16. Clinical risks Operational Either 17. Quotation process Operational Internal 18. Political risks Operational External 19. Pandemic Several External 20. Terrorism Several External
CONSTRAINTS1 Business risk management culture2 Risk management resources3 Risk management study4 Risk management plan
INPUTS1 Business analysis2 Assumptions3 Uncertain events4 Lessons learned5 Issues
MECHANISMS A2 OUTPUTS1 Risk checklist 1 Risk register2 Risk prompt list3 PEST prompt4 PESTEL prompt5 SWOT prompt6 Risk database7 Process map8 Business risk breakdown structure9 Risk questionnaire
Risk Identification

15
2.16.2 The third iterative step is ‘Risk Assessment’, which provides a judgement of the likelihood and impact of the risks and opportunities identified, should they materialise. This process provides an order of the potential ‘pain’ or ‘gain’ associated with risk and opportunity. Even when there is considerable uncertainty, quantitative techniques provide a useful framework. Figure 13 provides a typical process map for the ‘Risk Assessment’ stage.
Figure 13: Typical process map for the ‘Risk Assessment’ stage
2.17 A3 Risk Assessment Example – Causal Modelling
2.17.1 Causal chain modelling may be a useful tool to investigate the relations between an effect and its possible causes. A simple technique uses a cause-and-effect diagram. Where appropriate, more complex modelling approaches may be used to help analyse the risk data. However, in many cases risk identification has access to limited relevant data and it is unhelpful to shift attention towards the detail of a more complex modelling solution which is not appropriate to the data available.
2.17.2 Our high-level cause-effect risk map is shown below. It is noteworthy that it has an adaptive feedback control loop, from ‘incorrect evaluation of financial outcomes’ back to ‘inappropriate risk decisions’, which then leads on to ‘financial outcomes’ and then cycles back to ‘incorrect evaluation of financial outcomes’, and so on. The adaptive feedback control cycle loop is managed by examining the output from ‘incorrect evaluation of financial outcomes’ to determine whether there is a continuing need to modify the inputs to ‘inappropriate risk decisions’. In practice, adaptive feedback control has to be an expert manual process, based on a sound understanding of the business processes and their value chains, Tripp et al. (2004).
2.17.3 Figure 14 provides a typical high level risk map.
CONSTRAINTS1 Risk management resources2 Risk management study parameters3 Risk management plan
INPUTS1 Risk identification2 Risk register3 Profit and loss account4 Balance sheet5 Industry betas
MECHANISMS A3 OUTPUTS1 Probablility distributions 12 Probabliity impact matrix
Risk Assessment
Risk register, including assessments

16
Figure 14: High Level Risk Map
2.18 A3 Risk Assessment Example – Risk Heat Maps
2.18.1 Risk heat maps can help management to review the significant risk facing the business. It is important to consider the likely impact as well as the likelihood. Figure 15 provides a typical example.
Figure 15: Typical Risk Heat Map
High Level Risk Map
Underlying Causes - Internal (management, governance, ownership
Internal processes, people or systems (failed, inadequate)
Risk decisions (inappropriate risk
appetite)
Financial Outcomes (market, reputational,
credit)
Policyholder Harm (losses,
insolvency)
Risk Appetite Decision
Incorrect Evaluation of
Financial Outcomes
Underlying or Trigger Causes - External (wider changes, as well as event or insurance market)
feedback control loop
ImpactRare
0.00 < p < 0.03Unlikely
0.03 < p < 0.10Moderate
0.10 < p < 0.50Likely
0.50 < p < 0.90Almost certain 0.90 > p > 1.00
Catastrophic - the business survival at risk (eg £25M loss) High Extreme Extreme Extreme Extreme
Major - operations severely damaged (e.g. £10M loss) High High Extreme Extreme Extreme
Moderate - significant time & resources (e.g. £1M loss) Moderate Moderate High High Extreme
Minor - some disruption is possible (e.g. £0.5M loss) Low Low Moderate High High
Insignificant - minor problem, utilise normal daily processes Low Low Low Moderate High
Likelihood

17
2.18.2 Another example is shown in Figure 16, which is based on an insurance company model for a relatively large multinational insurance group.
Figure 16: Example of a Risk Heat Map for a large multi national insurance group
2.18.3 The fourth iterative step is ‘Risk Evaluation’, which involves evaluation of the results of the risk assessment stage and includes an understanding of the inter-relationships between the individual risks and the opportunities. It provides an iterative process of challenge and refinement of the information captured during the risk assessment process.
2.18.4 Figure 17 provides a typical process map for the ‘Risk Evaluation’ stage.
Figure 17: Typical process map for ‘Risk Evaluation’ stage
CONSTRAINTS1 Risk management resources2 Risk management study parameters3 Risk management plan
INPUTS1 Risk register
MECHANISMS A4 OUTPUTS1 Probability Trees 1 Risk register2 Expected Monetary Value 2 Modelling results3 Utility Theory 3 Decision trees4 Markov Chain 4 Quantitative results5 Investment appraisal 5 Scenario modelling
6 Sensitivity analysis
Risk Evaluation
Rare 0.00 < p < 0.05
Unlikely 0.05 < p < 0.30
Likely 0.30 < p < 0.70
Probable 0.70 < p < 0.95
Almost certain 0.95 > p > 1.00
impact > £300M Extreme Extreme Extreme Extreme Extreme
£150M > impact > £300M Severe Extreme Extreme Extreme Extreme
£60M > impact > £150M High Severe Extreme Extreme Extreme
£30M > impact > £60M High Severe Severe Extreme Extreme
£10M > impact > £30M Moderate High Severe Severe Extreme
£1M > impact > £10M Moderate High High High Severe
£0.5M > impact > £1M Low Moderate High High High
£0 > impact > £0.5M Low Low Moderate High High

18
2.18.5 With ‘Risk Evaluation’, the probability and impact of various combinations of multiple risks occurring is often a major concern. Decision tree analysis is a simple, and often graphical, technique to connect multiple risk combinations to come up with some estimates of the outcomes. Using decision tree analysis and the rules of joint probability, we can assess the likelihood of multiple risk events. The real strength of the decision tree graphical approach is to illustrate the impact that certain risks may have on subsequent risk-based matters. A risk event at a small unit may have an impact on other elements of operations when all of these risks are strung together.
2.19 A4 Risk Evaluation Example – Scenario Planning
2.19.1 Scenario planning is a strategic-level tool in which analysts generate simulated management games that can be used by the senior management team to consider and develop plans to deal with alternative futures. These simulations can be developed by combining the relevant facts that their framers can reasonably speculate about the future with relevant societal trends. They generally include some plausible but unexpected situations or management issues that exist in some form today. Another approach is to consider case studies, based on real situations that have happened to industry competitors, or to companies in another related industry. The advantage of the case study approach to scenario planning it can be based on well-documented real situations and, therefore, is more likely to engage the attention of the senior management team.
2.19.2 Scenario planning is a useful tool to explore existing data and analyses for emerging signals and alternative outcomes. It can help insurers to focus on specific events and explore a wide spectrum of outcomes, including interconnections and interactions across different groups of risks. The process can involve workshops, brainstorming and extreme event simulations. These output scenarios can test solutions and suggest new possibilities or improvement measures and so develop the insurer’s resilience. The process can build objective and analytical skills to enable employees to adopt a more agile and creative approach to analysing signals within data.
2.19.3 A health insurer could incorporate risk evaluation in key planning and rate review processes to help dislodge best estimate tunnel vision. If recent months’ claim cost spikes points to a surge in medical inflation not attributable to any specific source, what actions would management take, and at what point, to rectify the situation? For example, how many months of confirmation would they want before instituting other actions, expense control or provider negotiations.
2.20 A4 Risk Evaluation Case Study 1 – Risk Evaluation via Provider Networks
2.20.1 The use of preferred provider networks is common to U.S. Health Plans. The Society of Actuaries (SoA) Health Section Research Team have carried out a research study and developed a model to address the financial impact of health plan provider network risk: Winkleman et al. (2006). The study focused upon the negative impact of physician groups or hospitals who leave a health plan network either voluntarily (e.g. in response to competitor health plan proposition) or involuntarily (e.g. due to financial failure).
2.20.2 A reasonable degree of provider turnover is considered inevitable and may encourage competition and improvement in performance. However there is a point where turnover becomes dysfunctional as the health plan loses discounts on services, customer choice is restricted and the health plan may suffer reputational damage and its competitive position in the market may be weakened leading to a loss of its market share. The study considered the impact of provider network termination rates with reference to the impact upon negotiated provider discounts and the potential ‘domino’ effect upon pricing, market share and solvency. A model was developed to provide a

19
starting point for health plans to identify, assess and evaluate the financial impact of negative provider network events.
2.20.3 The authors of the SoA paper, Winkleman et al. (2006), also suggest that there is scope for consideration to be given to strategic risk within provider network management, and this might also imply the management of upside opportunities. There might also be scope for the consideration of such analyses and models by European insurers, albeit configured for the different nature of European insurance markets and the insurer-healthcare provider value chain configuration.
2.21 A4 Risk Evaluation Case Study 2 – Inadequate Risk Evaluation
2.21.1 In December, 1984, over 40 tons of poisonous gases leaked from a pesticide factory in Bhopal, India, belonging to Union Carbide, killing more than 20,000 residents. After much corrective action and legal wrangling, Union Carbide, which built the plant in 1969, settled a civil suit brought by the Indian government in 1989 by agreeing to pay US$470 million for damages suffered by the 500,000 people who were exposed to the gas. The company maintained that the payment was made out of a sense of ‘moral’ rather than ‘legal’ responsibility since the plant was operated by a separate Indian subsidiary, Union Carbide India Ltd.
2.21.2 The court proceedings revealed that management’s cost cutting measures had effectively disabled safety procedures essential to prevent or alert employees of such disasters. Dow Chemical has since taken over Union Carbide and denies responsibility for this disaster. However, because of the large loss of life there and the fact that Dow Chemical is much larger than what was once Union Carbide and its Union Carbide India Ltd. subsidiary, ongoing litigation continues to haunt Dow Chemical. The Bhopal gas leak is an example of how a risk event at a distant and relatively small unit can have disastrous consequences on a firm.
2.21.3 This case study demonstrates the need for thorough ‘risk identification’, ‘risk assessment’ and ‘risk evaluation’ processes that consider catastrophic incidents, such as one this magnitude. Each operational business unit needs to recognise the likelihood and consequences of the risks that they face. A risk event at a small foreign subsidiary can bring down the entire enterprise – risk management at all levels should recognise that catastrophes can happen. We can never predict risks of this major consequence, but an enterprise should always be aware that disasters can happen.
2.21.4 The fifth iterative step is ‘Risk Planning’, which combines the risks and opportunities together and considers their combined effect. It builds on all of the preceding steps in the ERM process to produce responses and specific action plans to address the risks and opportunities identified to secure the business objectives; it is essential to ensure these plans are prepared, considered, refined and implemented.
2.21.5 Figure 18 provides a typical process map for the ‘Risk Planning’ stage.
2.21.6 The ‘Risk Planning’ activity generates a series of risk responses which document, at the most basic level, the ‘risk ID’, risk description, impact in terms of time and cost, the risk response strategy to respond to the risk or opportunity. Each ‘risk ID’ must be referenced to an owner, manager and personnel who are responsible for taking action, the date or timescale by which actions must be implemented, the cost of the risk response strategy and any secondary risks which may arise from the risk response strategy.
2.21.7 An example of risk planning may be a health insurer choosing to include terrorism as part of standard coverage in all of its policies in the belief that the risk is overstated by customers and brokers. Thus incorporating coverage might offer a marketing advantage. But doing this would increase risk, albeit that large losses arising from terrorism may be a more remote risk. The company may be willing to place a given amount of capital to back this risk within its planning process, but only once certain operational or reinsurance arrangements are put in place.

20
Figure 18: Typical Process Map for ‘Risk Planning’ Stage
Figure 19: Typical example of Traffic Lights Confidence Test for Health Insurers
CONSTRAINTS1 Risk management resources2 Risk management study parameters3 Risk management plan
INPUTS1 Risk register2 Existing risk policies3 Business risk appetite4 Industry betas
MECHANISMS A5 OUTPUTS1 Risk response flow chart 1 Risk responses2 Response strategy 2 Updated risk register
Risk Planning
1
Is the profit pool for this new business average (yellow), a ‘rare game’ (green) or a ‘dog’ (red)?
2Do we have a significant advantage (green), small or uncertain advantage (yellow), or negative advantage (red) in this new business?
3Do we have leaders of this new business (and sponsors in the parent company) that are clearly superior to (green), similar to (yellow) or less strong than (red) competitor businesses?
4Is the impact of this new business on existing businesses likely to be significantly positive (green), uncertain (yellow), negative (red)?
1Are we confident that the profit pool potential is still sufficient to justify this project?
2Are we confident that our value advantage is still sufficient to justify this project?
3Are we confident that we have project leaders and sponsors of sufficient quality to justify this project?
4Are we confident that the impact on the core businesses is such that this project is still justified?
21
2.22 A5 Risk Planning Example – Traffic Lights Confidence Tests
2.22.1 Figure 19 provides a typical example of traffic lights confidence that can be used by health insurers to assess risks and plan their risk response strategies.
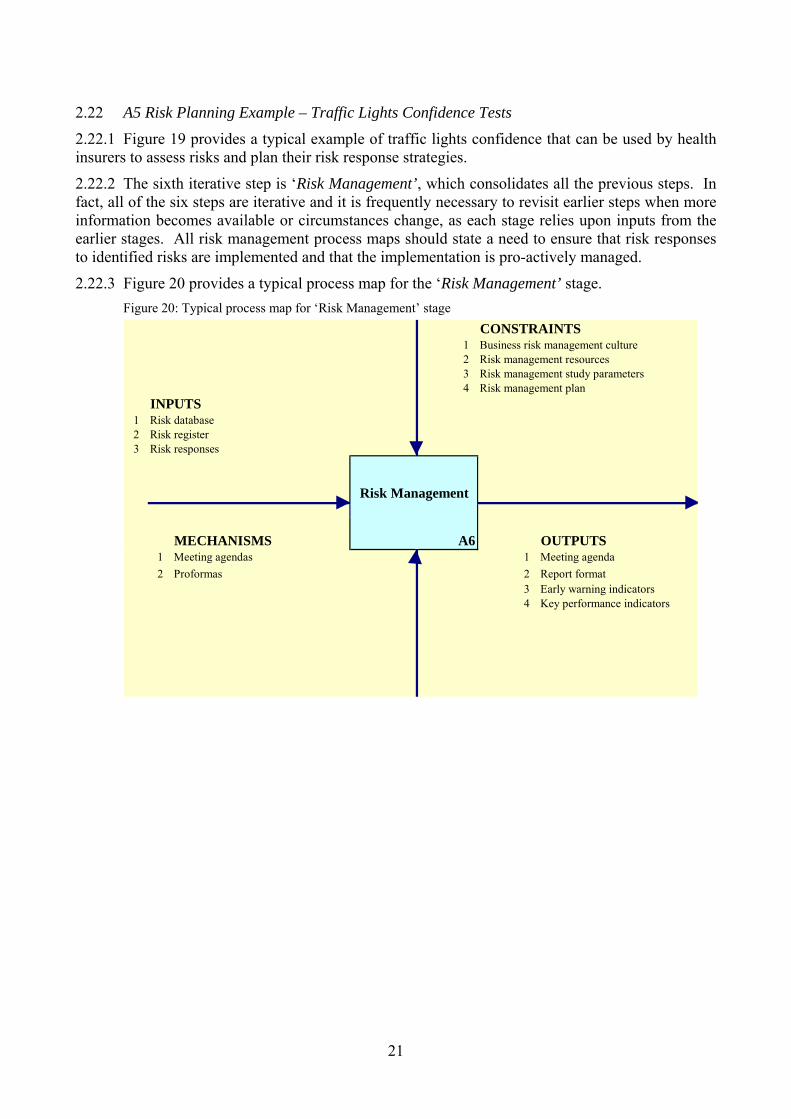
2.22.2 The sixth iterative step is ‘Risk Management’, which consolidates all the previous steps. In fact, all of the six steps are iterative and it is frequently necessary to revisit earlier steps when more information becomes available or circumstances change, as each stage relies upon inputs from the earlier stages. All risk management process maps should state a need to ensure that risk responses to identified risks are implemented and that the implementation is pro-actively managed.
2.22.3 Figure 20 provides a typical process map for the ‘Risk Management’ stage. Figure 20: Typical process map for ‘Risk Management’ stage
CONSTRAINTS1 Business risk management culture2 Risk management resources3 Risk management study parameters4 Risk management plan
INPUTS1 Risk database2 Risk register3 Risk responses
MECHANISMS A6 OUTPUTS1 Meeting agendas 1 Meeting agenda2 Proformas 2 Report format
3 Early warning indicators4 Key performance indicators
Risk Management

22
2.22.4 Risk Management consists of executing, monitoring and controlling all risk management actions against the actions and parameters contained in the risk plan. Ensuring execution means compliance with the risk plan and identifying rationale for any deviation. Monitoring should be a passive, neutral exercise which assesses how people and processes are working and that the ERM process is ‘alive’ and alert to emerging signals in the internal and external business environment e.g. are new risks and opportunities being identified and correctly cascaded through the ERM stages. Any signals of change need to be fed backwards or forward to the appropriate activity stage.
2.22.5 Chapman (2006) also categorises the micro and macro influences that can be sources of risk and opportunity and shape business performance (i.e. internal and external sources of risk).
2.22.6 Internal sources of risk are sourced within and may (potentially) be controlled by an organisation. For example, financial risk, the exposure to adverse events which can adversely affect profitability and may trigger closure of a business. For example, if a health insurer does not hold enough adequate cash or access to credit facilities to meet a spike in claim obligations and other current liabilities, it could trigger breaches or termination of provider contracts which in turn could lead to brand damage or reduced ability to price products competitively.
2.22.7 Figure.21 provides some typical internal sources of risk.
Figure 21: Typical internal sources of risk
2.22.8 External sources of risk are sources of risk occur at sub-national, national, regional and global/international levels. These sources of risk are largely exogenous to the insurer such as demographic trends however some factors may be influenced by the insurer or its peers (e.g. regulation which addresses market and consumer issues). External sources of risk include the economic, natural/physical, political, legal and regulatory environments, market structure and conditions, legislation and socio-demographic and cultural factors. These factors create sources of risk and opportunity; single factors can have relative pre-eminence or factors can interact and create a series of unpredictable and volatile shocks to the organisation which may contradict all past lessons learned by the organisation.
2.22.9 Figure 22 provides some typical external sources of risk.
Operational
Risk
Technological Risk
Financial Risk
Internal Sources of Risk

23
Figure 22: Typical external sources of risk
2.23 A6 Risk Management Example – Early Warning Indicators
2.23.1 Changes arising from the business analysis need to be explored and fed forward into the risk identification stage and downstream to update the risk assessment, evaluation, planning and inform risk management. Early warning indicators and key performance indicators are outputs from this ERM process stage.
2.23.2 Figure 23 provides a ‘key performance indicators’ grid that illustrates actual or current values for key indicators against a target value that a health insurer may wish to use.
KPI-1 Loss Ratio Trend KPI-2 Member Persistency KPI-3 Member GrowthCurrent value 52.5% Target value 60.0% Current value 25.0% Target value 60.0% Current value 59.0% Target value 60.0%
Variance 7.5% Variance 35.0% Variance 1.0%
KPI-4 Ombudsman Referrals KPI-5 Customer Service Level KPI-6 Claims Settlement PerformanceCurrent value 19.0% Target value 60.0% Current value 80.2% Target value 60.0% Current value 92.0% Target value 60.0%
Variance 41.0% Variance -20.2% Variance -32.0%
0%
10%
20%
30%
40%50%
60%
70%
80%
90%
100% 0%
10%
20%
30%
40%50%
60%
70%
80%
90%
100% 0%
10%
20%
30%
40%50%
60%
70%
80%
90%
100%
0%
10%
20%
30%
40%50%
60%
70%
80%
90%
100% 0%
10%
20%
30%
40%50%
60%
70%
80%
90%
100% 0%
10%
20%
30%
40%50%
60%
70%
80%
90%
100%
Figure 23: ‘Key performance indicators’ for health insurers
Economic
Risk
EnvironmentRisk
Social Risk
External Sources of Risk
MarketRisk
LegalRisk
PoliticalRisk
Low Risk High Risk

24
2.23.3 The construction of a ‘watch list’ or dashboard of priority information should underpin reporting activity. This approach would concentrate on ‘key performance indicators’, residual risks, assess the severity of the emerging risk and the effectiveness of control mechanisms. The use of visuals to produce risk ‘heat maps’ indicating all substantial, quantifiable risks is also a useful tool.
2.23.4 In practice, the risk dashboard for a health insurer needs to be underpinned by an information underlay which enables fast and flexible access to the underlying experience and data.
2.24 ERM Frameworks for Expecting the Unexpected
2.24.1 Health insurance practitioners need to take a necessarily broad and long view. The ERM frameworks, processes and dedicated risk analysis and quantification need to be dynamic, recognising that catastrophic risks may also sometimes emerge from ambiguous threats.
2.24.2 According to Roberto et al. (2006:106): “The most dangerous situations arise when a warning sign is ambiguous and the event’s potential for causing a company harm is unclear. In these cases, managers tend to actively ignore or discount the risk and take a wait-and-see attitude. Such an approach can be catastrophic.”
2.24.3 According to McNamee (2004:1): “Most of us are too specialized or focused and so accustomed to our environment that we cannot break out of our current thinking patterns to think broadly about our risks. And it is usually the risk that ‘no one ever thought of’ that causes the most harm. Although an outsider (e.g., a consultant) often is used to facilitate this broader thinking, the organization must eventually learn to do it for itself. It is like learning to ask dumb questions, especially ‘How?’ and ‘Why?’’
2.24.4 According to Rumsfeld (2002): “Reports that say that something hasn’t happened are always interesting to me, because as we know, there are known knowns; there are things we know we know. We also know there are known unknowns; that is to say we know there are some things we do not know. But there are also unknown unknowns - - the ones we don’t know we don’t know. And if one looks throughout the history of our country and other free countries, it is the latter category that tend to be the difficult ones.”
2.24.5 ERM principles can help actuaries to manage health insurance business risks in a world of uncertainty and to prepare for unexpected events, where equilibrium is an expedient myth that has fooled many European health insurers. We tend to post-rationalise the unexpected events, due to the limitations of inductive logic based on assumptions of ‘normality’ and our propensity for tunnel vision, and thus severely underestimate the possibility of unexpected events.
2.26 Black Swan Logic
2.26.1 In order to illustrate the limitations of inductive logic, consider the case of the ‘black swan’. According to Taleb, ((2004) and (2007)), a ‘black swan’ signifies a highly improbable incident or event characterised by its unpredictability, massive impact; and, after the event, the human desire to render its occurrence less random and more predictable than it was. For example, before the discovery of Australia, people in the Old World were convinced that all swans were white, an unassailable belief confirmed by empirical evidence. The sighting of the first black swan signifies a severe limitation to our learning from observations or experience, the depth of our ignorance, and the fragility of our knowledge. One single observation effectively invalidates a general statement based upon consolidated experience from millennia of confirmatory sightings of millions of white swans.
2.26.2 Black Swan logic makes what you do not know far more relevant than what you do know. The impact of black swans is exacerbated by its unexpectedness. For example, consider the terrorist attack of 11 September 2001. According to Taleb (2004), had the risk been reasonably

25
conceivable on 10 September 2001, it would not have happened. If such a possibility were deemed worthy of attention (or conceivable) aeroplanes would have had locked and bullet proof doors and other now- preventive measures would have been as commonplace as now and the attack would not have taken place.
2.26.3 According to Taleb (2004), in the ‘mediocristan’ world of Gaussian normality and equilibrium, one thinks of ordinary fluctuations as the dominant source of randomness, with jumps as an afterthought. Everything needs to fit some general socioeconomic model; people frown upon descriptive models. Mediocristan practitioners seek to be perfectly right in a narrow model, under precise assumptions. They use top-down models and rely on scientific papers and go from books to practice. They are inspired by physics and rely on abstract mathematics.
2.26.4 On the other hand, in the ‘extremistan’ world of sceptical empiricists, one thinks of black swans as the dominant source of randomness. They use bottom-up models and minimal theory, believing that theorising is a disease that should be resisted. They do not believe that one can easily compute probabilities. They develop intuitions from practice and go from empirical observations to books. They are not inspired by any science or the use of messy mathematics and computational methods.
2.27 Problem of Inductive Logic
2.27.1 In general, health insurance is comparatively low risk across the spectrum of insurance classes. Claim frequencies are high, and claim amounts tend to be small. Morbidity among covered lives tends to be very independent. Thus, claim costs therefore tend to normalise very quickly. This is often aided by provider contracting and regular re-pricing.
2.27.2 Even political changes to the healthcare market (e.g., introducing a risk equalisation system, NICE approving a new drug, etc) tend to be signalled well in advance and managed accordingly. This makes the life of the health actuary a busy but a predictable one. It is for this reason that complacency and the weaknesses of inductive thinking can become so entrenched in health insurance, and absurd scenarios dismissed (e.g., a reclassification of the UK Insurance Premium Tax rate for health insurance from 5% to 20%).
2.27.3 Consider the case of a turkey that is fed every day, an illustration of the ‘problem of inductive knowledge’. Every single feeding will firm up the bird’s belief that it is the general rule of life to be fed by friendly members of the human race ‘looking out for its best interests’, as a politician might say.

26
1,001 Days of History
0102030405060708090
100110120130140150
1 60 110
160
210
260
310
360
410
460
510
560
610
660
710
760
810
860
910
960
1001
Days
Util
ity o
f Tur
key
Surprise !
Figure 24: The Impact of the Highly Improbable
Source: Taleb (2007)
2.27.4 On the afternoon of the Wednesday before Thanksgiving, something unexpected will happen to the turkey. It will incur a revision of belief, as illustrated in Figure 24.
3. PRACTICAL EXAMPLES OF RISK AND OPPORTUNITY MANAGEMENT
3.1. A holistic ERM approach based on risk and opportunity management can increase customer value and facilitate a sustainable health insurance business model. Upside risks as well as downside risks need to be appreciated and catered for within the ERM framework implementation. Unrealistic assessment and dissemination of upside risks can create unrealistic stakeholder expectations and a false expectation of continuing good news which will be disappointed.
3.2. The CRO may start with ERM framework implementation (e.g. COSO (2004), Chapman (2006)), following which they can commence innovation portfolio management. They will need to balance the risks and rewards, which may require the embedding of ERM within screening tools used to evaluate and filter the innovation portfolio.
3.3. A risk matrix can be used to support innovation portfolio screening tools. It can provide a clearer picture of how the firm’s planned projects fall within the spectrum of risk. The risk matrix is the output from an experienced, multi-disciplinary team involving senior managers with a strategic focus and authority for financial resource allocation and the participation of team members delivering specific projects.
3.4. R-W-W: Is it real?, Can we win?, Is it worth doing? – Day (2007)
3.5. The risk matrix is a pre-cursor to other tools used to explore an innovation product concept, its potential market and the company’s capabilities and competition. Each concept in the health insurer’s innovation portfolio should be assessed by its development team using the R-W-W screening system outlined below. A definite yes or no answer to the ‘heading’ questions in the first column (i.e. ‘Is it real?’, ‘Can we win?’, ‘Is it worth doing?’) would require further investigation for robust answers to the supporting questions in the second and third columns.

27
3.6. The CRO needs to embed ERM principles within the resolution of each of the ‘heading’ questions (i.e. ‘Is it real?’, ‘Can we win?’, ‘Is it worth doing?’), in order to screen the innovation portfolio. The end result is to try and ensure that the proposed innovation portfolio is robust and is aligned to the risk appetite of the company, the ERM framework and the corporate strategy. The ‘Is it real?’ question includes an evaluation of legal, social and environmental acceptability (e.g. the insurer’s relationship with client and data protection issues). The question ‘Can we win?’ and assessing ability to compete might involve the consideration of the people and process implications attached to the delivery of a new service or product offer.
3.7. The CRO will also need to consider the implications of innovation screening questions for ERM requirements at later stages (e.g. development, implementation, launch and post-launch). The answer to the ‘Is it worth doing?’ question involves a consideration of both ‘Will the product be profitable at an acceptable risk?’ and ‘Does launching the product make strategic sense?’ The evaluation of the capital allocation, risk appetite and opportunity management emerges from applying an ERM perspective to the ‘heading’ questions ‘Is it real?’ and ‘Can we win?’
3.8. R-W-W screening tools Day (2007)
3.8.1 The R-W-W screening tools, within the ERM framework, can help the CRO to move firmly into the opportunity management arena. ERM should underpin balancing the risks and rewards inherent in the innovation portfolio which may involve cross border insurance operations and relatively complex healthcare service offers. The ERM framework needs to be inclusive, involving insurers, out-sourcers, medical service providers, regulatory and governmental healthcare policy advisors, and independent external input. A holistic view is required, taking account of quantitative and qualitative risk measures, if the CRO is going to be in position to manage a business of uncertainty and complexity effectively, such as a health insurer.
3.8.2 The link between ERM and the corporate strategy depends on the strategic direction, the corporate mission, the business objectives, the risk appetite and its communication to the key stakeholders, which may include shareholders, rating agencies, investment analysts, management, employees, and regulatory authorities. This link is important, but it is not necessarily simple or easy to manage.
3.8.3 Risk averse health insurers will have a small risk appetite and may want to follow the market leaders, taking as few risks as possible. For them, the risk quantification measures from a risk control environment, erring on the side of caution, will be their mantra. On the other hand, entrepreneurial market leaders with new marketspace ambitions will have a large risk appetite and may focus on using ERM for opportunity management. Whatever the risk appetite of the insurer, the CRO needs to implement and manage a practical ERM framework that is aligned to the agreed corporate strategy and the associated business plans. This will require the effective management of risk and reward in a business of uncertainty, dealing with the upside risks as well as the downside risks.
3.8.4 To illustrate a practical ERM framework under a stress scenario, consider the idealised case of a supplementary health insurance provider with a large risk appetite and market leadership ambitions. This company has an entrepreneurial CEO with many new and insightful ideas and these ideas have been formulated as an innovation portfolio. The corporate strategy is aligned to the innovation portfolio and the key stakeholders have been persuaded. How should the CRO, who may be an actuary, support the CEO and facilitate the prudential management of the insurance company? How can the ERM framework facilitate risk and opportunity management?
3.8.5 The CRO might start with the design and implementation of a standard ERM framework, such as COSO (2004b) or Chapman (2006) (e.g. the six iterative risk management steps, the

28
corporate governance and oversight issues, the internal controls, the internal and external sources of risk) and then be in a position to tackle the effective risk management of the innovation portfolio.
3.9. Case Study using the R-W-W screening tools - Day (2007)
3.9.1 Assume for a moment the CRO has adopted the Chapman model (as this seemed to the CRO to be more aligned with the agreed corporate strategy) and starts to deal with the effective risk management of the innovation portfolio and the road towards the achievement of the corporate strategy. The balancing of the risks and rewards inherent in the innovation portfolio requires the adoption of a risk matrix, in order to obtain a clearer picture of how its planned projects fall on the spectrum of risk.
3.9.2 The risk matrix is the output from an experienced, multi-disciplinary team involving senior managers with a strategic focus and authority for financial resource allocation and the participation of team members delivering specific projects. Individual team members are required to position products on the matrix and to provide a rationale to support their risk matrix.
3.9.3 Differences and divergences across the team serve to initiate a continuous process of evaluating the company’s mix of projects and their alignment with strategy and risk appetite. The risk matrix model, with probability bands indicating the probability of failure, is illustrated in Figure 25.
Figure 25: Risk Matrix Model illustrating the probability of failure
3.9.4 The innovation portfolio is plotted on the risk matrix, as illustrated below. Some of the product, service, and technology innovations are categorised as relatively small innovations, whereas others are judged to be relatively large innovations. The risk matrix model, with probability bands indicating the probability of failure and the innovation portfolio, is illustrated in Figure 26.

29
Figure 26: Risk Matrix Model, indicating probability of failure and the innovation portfolio
3.9.5 In Figure 26, each innovation product/service is positioned on the risk matrix based on a scoring system, using the ordinal scales 1 to 5. Score 1 represents ‘same as present’ whereas 5 represents ‘entirely different from our present market, or is unknown’. The ‘x’ and ‘y’ coordinates of the product innovation in the risk matrix are calculated by scoring each of the attributes of the ‘Intended Market’ and ‘Product/Service/Technology’ matrices, and accumulate the scores.
3.9.6 A template is used to derive scores for the ‘Intended Market’ and ‘Product, Service, and Technology’ matrices. The template is a useful starting point, although the CRO and team members will need to evaluate and improve the template questions.
3.9.7 Nothing about the process should be static; new team members need to be substituted, team member roles need to be varied and the templates themselves need to be challenged, evaluated and continuously improved. A ‘starting point’ template to score the familiarity and proximity of the ‘Intended Market’ is shown below. Adding the 6 scores from the ‘Intended Market’ attributes (each scored from 1 to 5) gives the ‘x’ coordinate.
3.9.8 Figure 27 illustrates a typical scoring matrix.
3.9.9 Adding the 7 scores from the ‘Product / Service / Technology’ attributes described in the template (each scored from 1 to 5) gives the ‘y’ coordinate, as illustrated in Figure 28.

30
… be the same as in our present
market
… partially overlap with our present
market
… be entirely different form
from our present
market or are unknown
Customers' behaviour and decision-making processes will .. 1 2 3 4 5
Our distribution and sales activities will … 1 2 3 4 5
The competitive set (incumbents or potential entrants) will … 1 2 3 4 5
… highly relevant
… somewhat relevant
... not at all relevant
Our brand promise is … 1 2 3 4 5Our current customer relationships are … 1 2 3 4 5
Our knowledge of competitors' behaviour and intentions is … 1 2 3 4 5
TOTAL(x-axis coordinate)
Intended Market
Figure 27: Illustration of a typical scoring matrix
… is fully applicable
… will require
significant adaptation
… is not applicable
Our current development capability … 1 2 3 4 5
Our technology competency … 1 2 3 4 5Our intellectual property protection is … 1 2 3 4 5
Our manufacturing, service and CRM delivery system … 1 2 3 4 5
… are identical to those from our current offerings
… overlap somewhat with those from our current
offerings
… completely differ from those from our current offerings
The required knowledge and science bases .. 1 2 3 4 5
The necessary product and service functions … 1 2 3 4 5
The expected quality standards … 1 2 3 4 5
TOTAL(y-axis coordinate)
Product / Service / Technology
Figure 28: Typical ‘Product/Service/Technology scoring template

31
3.9.10 The figure 28 risk scoring matrix is a pre-cursor to other tools used to explore the product concept, its potential market and the company’s capabilities and competition.
3.9.11 Each product concept in the health insurance company’s innovation portfolio should be assessed by its development team using the R-W-W screening system in Figure 29 below. A definite yes or no answer to the first column (i.e. ‘is it real?’, ‘can we win?’, ‘Is it worth doing?’) would require further investigation for robust answers to the supporting questions in the second and third columns.
Screening for Success with R-W-W
Is there a need or desire for the product?Is the market real? Can the customer buy it?
Is the size of the potential market adequate?Will the customer buy the product?
Is there a clear concept?Is the product/service real? Can the product be made?
Will the final product satisfy the market?
Does it have a competitive advantage?Can the product/service be
competitive? Can the advantage be sustained?
How will the customers respond?
Do we have superior resources?
Can our company be competitive? Do we have appropriate management?
Can we understand and respond to the market?
Are forecasted returns greater than costs?Will the product be profitable at
an acceptable risk? Are the risks acceptable?
Does the product fit our overall growth strategy?Does launching the product make
strategic sense? Will top management support it?
Is it real?
Can we win?
Is it worth doing?
Figure 29: Typical R-W-W Screening Programme
3.9.12 The CRO needs to embed the selected ERM framework and principles within the resolution of each of the three ‘heading’ questions, in order to screen (via filtering and testing) the company’s innovation portfolio. The end result is to ensure that the proposed innovation portfolio is robust and is aligned to the risk appetite of the company, the ERM framework and the corporate strategy.
3.9.13 The ‘Is it real?’ question includes evaluating whether there is a clear concept. For example, this might include an evaluation of legal, social and environmental acceptability (e.g. the insurer’s relationship with broker and/or consumer and the data protection issues).
3.9.14 The question ‘Can we win?’ and assessing ability to compete might involve the consideration of the people and process implications attached to the delivery of a new service or product offer. The CRO will also need to consider the implications of innovation screening questions for ERM requirements at later stages (e.g. development, implementation, launch and post-launch).

32
3.9.15 The answer to the ‘Is it worth doing?’ question involves a consideration of both ‘Will the product be profitable at an acceptable risk?’ and ‘Does launching the product make strategic sense?’ The evaluation of the capital allocation, risk appetite and opportunity management emerges from applying an ERM perspective to the ‘heading’ questions ‘Is it real?’ and ‘Can we win?’
3.10 ERM using the R-W-W Screening Tools.
ERM in the context of innovation screening needs to be positioned as part of a continuous improvement and learning process, rather just a ‘go / no-go’ decision. ERM has the potential to help develop the health insurer’s capability to move from risk control to opportunity management. For those with an innovation portfolio, the screening tools outlined above (which can be aligned to a robust ERM framework) can help the CRO to effectively engage in the opportunity management arena.
3.11 ERM – ‘We are all risk managers here’
Finally, the success of ERM depends on people and team work, rather than on good ideas from the top management team. ERM needs to be embedded throughout the health insurance organisation, with the underlying message that ‘we are all risk managers here’.
3.12 ERM Risk Profiling.
3.12.1 Management needs to ensure that the risk profiling process does not become stale or be seen as an end in itself. The risk profile is unlikely to change significantly in the short term, unless the insurance business is rapidly changing or growing. A long term view is required, along with secular consistency. One seeks out opportunities that increase the likelihood of the risk profile remaining relevant over time to management decision making processes and also to pro-actively respond to changes in these processes.
3.12.2 The risk profile reports should provide ‘snapshot’ management information about the significant risks, as indicated in the executive summary report in figure 30.
Figure 30: Risk Profile – Executive Summary
Impact on enterprise value
Rare 0.00 < p < 0.05
Unlikely 0.05 < p < 0.30
Likely 0.30 < p < 0.70
Probable 0.70 < p < 0.95
Almost certain 0.95 > p > 1.00
impact > £300M Extreme Extreme Extreme Extreme Extreme
£150M > impact > £300M Severe Extreme Extreme Extreme Extreme
£60M > impact > £150M High Severe Extreme Extreme Extreme
£30M > impact > £60M High Severe Severe Extreme Extreme
£10M > impact > £30M Moderate High Severe Severe Extreme
£1M > impact > £10M Moderate High High High Severe
£0.5M > impact > £1M Low Moderate High High High
£0 > impact > £0.5M Low Low Moderate High High
Control effectiveness → High Medium Low Opportunity
Likelihood
2
3 4
1
5
6
7
8
9
10
11
12
Risk 7
Inherent Residual Risk
Risk 6

33
Notes:
The top 12 risks have been positioned on the risk matrix and it is important to show their ‘before’ and ‘after’ situation, where the ‘after’ situation represents the indicated ‘inherent residual risk’ position. Any risks coloured ‘red’ (e.g. Risks 7, 11 and 12) are in the extreme danger zone and need remedial action (e.g. termination of underlying risk, as their implied risk tolerance is unacceptable). Any risks coloured ‘orange’ (e.g. Risks 6 and 10) are in the severe danger zone and need remedial action (e.g. business plan to move to a reduced underlying risk assessment). Any risks coloured ‘green’ (e.g. Risk 2) may be too safe and consideration should be given to divestment to another organisation that can create more added value. In practice, the management team will need to focus primarily on the ‘severe’ and ‘extreme’ zones and satisfy themselves that appropriate remedial action is taken, as these risk assessments are unsustainable.
4. ERM FRAMEWORKFOR HEALTHCARE PROVIDERS, CONSUMERS, AND POLICY MAKERS
4.1 Health insurance in the UK.
4.1.1 The UK has a mixed economy of public and private healthcare delivery. Health insurance (also known as PMI) is a supplementary and voluntary health insurance system and is an important component of the mixed healthcare economy that comprises public and private financing and public and private provision. The mixed economy shapes consumer expectations, the insurer’s value chain and its linkages and the underlying map of healthcare funding, provision and delivery. The interaction and flow of funds between the public and private healthcare sectors is illustrated in Figure 31 below, Foubister et al. (2006) .
NHS PMIOut-of-pocket
spending
Figure 31: Interaction and flow of funds
Source: Foubister et al. (2006)

34
Notes:
In Figure 31 above, private hospitals and specialists have been boxed separately, since the initial consultation and the hospital treatment is separated in time and place. Moreover, a privately financed consultation may not necessarily lead to a hospital episode. The consultation will often take place in office space that does not belong to a private hospital and for which the specialist will pay rent or a fee.
4.1.2 As health insurance is supplemental coverage, the insured always has the option to try and access the NHS and receive public treatment, provided that they are prepared to wait. If the insured decides to use their health insurance cover, they still have to deal with NHS business processes. In practice, the insured will need to consult their general practitioner, who will refer them to a private consultant. Some insurers require the insured to contact them at the time referral to ensure that the consultant is on their approved list, as well as prior to booking any acute treatment.
4.1.3 There may also be incidence of individuals who opt to mix public and private systems to provide different components of their care. For example, the patient may opt for certain higher cost diagnostics to be carried out in the public sector e.g. MRI scans, and pay a nominal fee to the NHS provider for the diagnostic report which can be used at a private out-patient specialist consultation. This is a problematic policy issue as it involves out-of-pocket payments to be received by NHS providers for a diagnostic test which is carried out using public healthcare facilities and staff.
4.1.4 As illustrated by the persistent number of cases profiled in the media, pressure also exists for patients to be able to self-pay for high cost pharmaceuticals not available as a public healthcare service (e.g. for cancer drugs whilst still a public patient for all other services).
4.2 Health insurance Stakeholders
4.2.1 Supplementary health insurance in the UK provides cover for the costs of treatment in respect of acute medical episodes. There are three key markets, Orros (2007) :
(a) Individuals – book rated, medically underwritten (e.g., full medical underwriting, moratorium underwriting) and excluding pre-existing medical conditions.
(b) Small Company Paid – partially experience rated (sometimes via rating pools), generally medically underwritten and excluding pre-existing medical conditions.
(c) Large Company Paid – experience rated and not medically underwritten.
4.2.2 Health insurers use medical underwriting and risk rating to set the office premium rates. Full medical underwriting requires a declaration of the applicant’s medical history. The insurer determines, at the point-of-sale, the medical conditions that will be excluded from the policy.
4.2.3 Moratorium underwriting, on the other hand, shifts the underwriting process to the point of claim. With moratorium underwriting, pre-existing conditions (and directly related conditions) during the last five years are excluded for two years, following which they are covered provided that the insured has been symptom free.
4.2.4 Consumers, individually and collectively, have a very high demand for longer and better quality lives. This creates pressure for medical innovation, and an allowance for the social costs of bearing it. Healthcare systems represent a social desire to promote basic social benefits (given that each of us will likely get seriously ill at one point) but assigning the funding burden to those who ultimately call on the most benefits speaks to basic human senses of social fairness, trust, and goodness. People clearly want to reduce or better manage healthcare risks, but they seem to accept that accomplishing this is inescapably and partly a social endeavour.
4.3 Consumer Attitudes and Expectations
4.3.1 Health insurance consumers have personal health risk priorities. They may have a high demand for health services when their life and well-being are threatened. Some purchase health

35
insurance in order to ensure access to healthcare in times of need, with limited or no financial risk. They probably know that, although their cancer risk in the next twelve months is low, this risk will increase with age; therefore, they will often buy insurance now rather than later. The implication for health insurers is that they must, therefore, react to such consumer issues and concerns on an ongoing basis, even if they cannot align their risk management objectives perfectly to those of consumers.
4.3.2 A number of research organisations survey UK healthcare consumer attitudes, as part of their European healthcare reform studies. The Stockholm Network has published the ‘Impatient for Change’ study, Disney et al. (2004), which contained the conclusions outlined below.
4.3.3 The Stockholm Network study, Disney et al. (2004)Error! Bookmark not defined. concluded that Britons’ rank of their health system is at the bottom of those countries surveyed in terms of the gap between aspiration and delivery. They are also the least inclined to put equality of access ahead of quality of personal care of any country polled. Only in Sweden do a higher proportion of people think that their health system is underfunded in absolute terms, and only in the Czech Republic do more people think that their health service is underfunded relative to other European countries.
4.3.4 The study also concluded that, for the UK, waiting times are the most significant feature of healthcare, while doctor choice is the least significant. Fewer than 1 in 5 rate the NHS as ‘good’ on waiting times, and only 1 in 4 rate it as ‘good’ on convenience. Similarly on access to the latest medicines and technology, no other country either rates it as highly as the UK, or scores their health system so low at delivering it. In line with other countries, the single reform cited as the most likely to increase the quality of care is giving patients more information about their illness while increasing the number of available medicines and treatments.
4.3.5 The phenomenon of medical inflation and consumer tolerance of it also reflects certain attitudes and expectations. Medical inflation arises from several factors, including new technologies, preference for spending a higher portion of incremental income on healthcare as overall per capita income increases, and a willingness to tolerate a degree of economic inefficiency and moral hazard in healthcare systems as the ‘price to pay’ for social fairness.
4.4 Risk Management via Preferred Provider Networks
4.4.1 Some health insurers have preferred provider networks, whereby claimants are directed towards in-network medical service providers. Although private hospital service providers operate ‘rack rates’ for their hospital beds and ancillary patient services, their actual charge levels are the outcome of confidential negotiations between insurers and providers, conducted on a bilateral basis.
4.4.2 The value chain and linkages between insurers and healthcare providers can help to manage moral hazard, improve quality of care and customer experiences and differentiate the insurer’s product and service offer. The U.S. market utilises preferred provider organisations. These are health plans consisting of hospital and physician providers that provide healthcare services to members at discounted rates in return for expedited claims payment. Although members can use any healthcare provider, financial incentives are built into the benefit structure to encourage utilisation of the preferred healthcare providers.
4.4.3 Preferred healthcare provider models are rare in Europe, although insurers may have preferred provider networks to support group employer based contracts. However, their scope is constrained in many European markets. In the context of voluntary complementary or supplementary health insurance it is difficult to restrict provider choice. This issue is heightened for voluntary as opposed to employer paid (mandatory) cover.
4.4.4 There is greater potential scope for employer paid cover to develop value chain linkages and derive benefits from provider agreements e.g. protocols for care delivery and management of care

36
episodes. Overall, low market penetration rates and consumer attitudes to what is essentially a voluntary purchase, create resistance to insurer initiatives perceived as restricting consumer choice. This presents challenges to developing greater integration between insurer and provider value chains to manage service delivery and consider more sophisticated forms of risk sharing.
4.5 Preferred Provider Networks – Case Study
4.5.1 Preferred provider network agreements were the subject of the year 2000 investigation by the Competition Commission. This concerned the proposed merger of the then Bupa Hospitals with Community Hospitals Group. It was concluded that the actual charges set reflected the bargaining strengths and abilities of the two sides, rather than the underlying structure of supply costs. The larger insurers were deemed to have a competitive advantage (due to economies of scale and medical expertise) over smaller insurers when it came to negotiating medical service provider prices (Competition Commission, 2000).
4.5.2 The Competition Commission concluded that the preferred provider discounts achievable were sometimes 25% to 35% off the ‘rack rates’ for non-network business, and even higher for network business. Furthermore, the then Bupa Hospitals had charged the Bupa insurance business significantly less than it charged smaller PMI insurers. It concluded that it was far from obvious that the lower Bupa Hospitals charges to the Bupa insurance business were fully justified on a volume basis or because of significant cost savings, Competition Commission (2000).
4.6 Governmental Policy on Healthcare Risk Management
4.6.1 The Strategy Unit of the UK Cabinet Office first published a report in 2002 that describes how handling risk and opportunity is increasingly perceived to be at the centre of good government Cabinet Office (2002). This report concludes, at the strategic level, that risk appetite concerns are about where the organisation wants to go, how to get there, and how to ensure survival. Any major risks at this level are likely to stop the organisation functioning. Risks at this level are typically concerned with commercial, financial, directional, environmental, cultural, acquisition, political and quality issues.
4.6.2 Public sector ERM focus is driven by the public sector’s need do more to anticipate risks so that there are fewer unnecessary and costly crises (citing BSE and failed IT contracts as examples); to ensure that risk management is part of the delivery plans; get the right balance between innovation and change on the one hand and avoidance of shocks and crises on the other; and, finally, to improve the management of risk and its communication.
4.6.3 Figure 32 provides a public sector perspective on the separation between strategic-level, programme-level, and operational-level decisions, Cabinet Office (2002).
Figure 32: Public Sector Perspective of Decisions
Strategic Decisions
Decisions transferringstrategy into action
Decisions requiredfor implementation
Unc
erta
intie
s
Project and Operational
Programme
Strategic

37
4.6.4 Risk management in healthcare requires the deployment of real-time, electronic risk management identification systems capable of tracking resource allocation, patient progress, and outcomes across different clinical and provider operational functions and the ability for functional teams to collaborate to support more effective management of risks across the organisation.
4.6.5 Patient and customer satisfaction has been identified in some studies as an area affecting many of the risk domains of ERM, including operational, human and strategic. Furthermore, studies of patient perceptions of safety have indicated that concerns about medical errors lead to lower patient satisfaction ratings and a reduced willingness to return for care and the reduced likelihood that patients would recommend a hospital to others, Braz et al. (2006).
4.6.6 Effective ERM, as in the example of patient satisfaction, involves information exchange with multiple disciplines in the hospital in order to capitalise on broader perspectives for correction and improvement (e.g. clinical competency of staff, physical access and environment, patient identification procedures, and systems for medication administration). Patient complaints and concerns represent not just exposure to loss, but rather they also present opportunities to improve satisfaction and to increase market share through repeat encounters, increased visits and the hospital’s good reputation in the community.
4.6.7 Healthcare providers transitioning from Risk Management to ERM can benefit from the activity of on-going change agents or ambassadors who can successfully promote recognition of the need for change for the good of the business enterprise. ERM within a provider context also involves hospital boards and governors, senior management and business unit committees. There is also a strong need for cross-functional representatives who can represent the different players, materials, resources, relationships and transactions involved in delivery of care in specific settings (e.g., diagnostics, operating suite, day care, outpatient care).
4.7 NHS Risk Management Implementation
4.7.1 The UK NHS has applied risk management principles and governance for many years, partly due to central government influences (e.g. Cabinet Office Strategy Unit papers, guidance and instructions). Risk management principles are now embedded within NHS human resource management and form an important part of NHS education, training, employee induction programmes and their continuing professional development.
4.7.2 NHS best practice principles for ERM have often been considered in the context of clinical governance and the continual drive for quality improvement, bearing in mind that an organisation is only as strong as its weakest link. Therefore, much attention has in the past been given to quality improvement studies based on peer group comparisons.
4.7.3 Best practice standards on clinical governance and quality improvement were subject of a seminal paper prepared for the NHS 50th anniversary review in 1998 for the British Medical Journal. This paper concluded that clinical governance was to be the main vehicle for continuously improving the quality of patient care and developing the capacity of the NHS in England to maintain high standards (including dealing with poor professional performance) and that new approaches were needed to enable the recognition and replication of good clinical practice to ensure that lessons were reliably learned from failures in standards of care, Scally & Donaldson (1998) 1.
4.7.4 The best practice standards for clinical governance and quality improvement are summarised via figure 33, which shows the interactions between the important components, Scally & Donaldson (1998).

38
Figure 33: Best Practice Standards for Clinical Governance and Quality Improvement
Source: Scally & Donaldson (1998)
4.8 NHSLA (NHS Litigation Authority)
4.8.1 A key function for the NHSLA is to contribute to the incentives for reducing the number of negligent or preventable incidents throughout the NHS. It is understood that they seek to achieve this through an extensive risk management programme. To this end, they publish and distribute their risk management Framework Document, National Health Service Litigation Service (2006)..
4.8.2 During 2008/09, the NHSLA received 6,080 claims of clinical negligence and 3,743 claims of non-clinical negligence against NHS bodies. This increased from the 2007/08 figures of 5,470 claims of clinical negligence and 3,380 claims of non-clinical negligence. A total of £769m was paid in respect of clinical negligence claims during 2008/09, up from £633m in 2007/08.
4.8.3 The risk management framework and standards target fundamental hospital risk management problems including under-reporting. Some commentators suggest that retrospective case review would indicate that low percentages of adverse events are reported and that, significantly, reporting of near misses is extremely poor. Under-reporting of near misses is both a source of new emerging risk and of lost opportunity as important teaching and learning experiences and lessons are wasted.
4.8.4 The Department of Health report ‘An Organisation with a Memory’ advocated the use of risk incident and near-miss analyses to develop risk planning and management strategies for future occurrences, Department of Health (2000). It concluded that the great majority of NHS care is of a very high clinical standard, and serious failures were uncommon in relation to the high volume of care provided every day in hospitals and in the community. Yet, where serious failures in care did

39
occur, they could have devastating consequences for individual patients and their families and undermine public confidence in the healthcare services that the NHS provided.
4.8.5 According to the report, most distressing of all was that such failures often have a familiar ring, displaying strong similarities to incidents which have occurred before and in some cases almost exactly replicating them. Many could have been avoided if only the lessons of experience had been properly learned, Department of Health (2000).
4.8.6 The report concluded that the introduction of clinical governance provided the NHS with a powerful imperative to focus on tackling adverse health care events. It set out to review what the Department of Health knew about the scale and nature of serious failures in NHS health care, to examine the extent to which the NHS had the capacity to learn from such failures when they occurred and to recommend measures which could have helped to ensure that the likelihood of repeated failures was minimised in the future. The work of the group was informed by evidence and experience from a range of sectors other than health, including industry, aviation and academic research, Department of Health (2000)..
4.8.7 As an interesting parallel to recent issues (e.g. whistle blowing) in the insurance and financial services industry, the report noted that ‘When things go wrong, whether in health care or in another environment, the response has often been an attempt to identify an individual or individuals who must carry the blame. The focus of incident analysis has tended to be on the events immediately surrounding an adverse event, and in particular on the human acts or omissions immediately preceding the event itself.’, Department of Health (2000).
4.8.8 Risk incident reporting can be seen as a valuable source of identifying emerging signals of risk and as an input to the risk identification process at all levels of a healthcare delivery system, care providers and frontline healthcare professionals. It is also helpful to consider the value of risk incident reporting in the context of a dynamic environment, the shortage of time in clinical settings and the need for data from healthcare professional and patient interaction.
4.8.9 The reasons for under-reporting of incidents include fear of reprisals, concerns about litigation and anonymity, training and design of incident reporting processes and forms, lack of clarity over what constitutes an adverse event, short-term target pressures, shortage of time in clinical settings and low priority where incidents do not result in an adverse outcome, incidents which are undetected by the patient and other colleagues and a lack of peer support, forums and feedback.
4.8.10 Reporting levels are however higher amongst some specific groups, such as nurses where incident reporting is part of formal training and there are high levels of patient contact. Some commentators also suggest that hospital working environments are not strongly conducive to reflective learning and that even where incidents are reported the organisation may not be well-equipped and trained in using incident data to learn and improve processes.
4.8.11 The Standard Format of medical case conferences may also be seen as viewing errors as the result of individual, personal failure or professional shortcoming. In this way the case review may promote an ‘unrealistic expectation of perfection [which] undoubtedly contributes to physicians’ traditional reluctance to discuss errors’, Wachter et al. (2002). Studies have suggested that it may be more constructive to focus upon system problems which may contribute to a clinical error or poor outcome for a patient rather than focusing upon individual human errors.
4.9 NICE (National Institute for Clinical Excellence)
4.9.1 NICE seeks to contribute to the incentives for improving risk assessment and risk management practices in the NHS. NICE publications include documented examples of risk assessment best practices, NICE (2007). These case studies address risks in the healthcare sector

40
and provide some interesting ideas on how to deal with them, based on an initiative by the health promotion bodies and the Health Services Advisory Committee.
4.9.2 The validity of an ERM framework needs to be continually tested, evaluated and assessed. In a healthcare context this includes evaluation and post-implementation review of specific changes in processes following patient risk incidents. This process needs to be carried to evaluate risk planning and management activities from the perspective of patient care, provider costs and capacity. However it is important to avoid a situation where resourcing pressures effectively censor the output of the review as issues are raised with no available resources to address them.
4.9.3 The process of ongoing evaluation and embedding ERM culture at an organisational level is also encouraged by the development of indicators for use by frontline healthcare staff to measure whether a specific procedural change is successful and whether actual outcomes match those expected. While still evolving, the use of ERM has become increasingly embedded in healthcare provision.
4.10 Healthcare Provider Risk Management Practices
4.10.1 Healthcare delivery organisations (e.g. NHS, private care providers) are exposed to a broad, interactive spectrum of risk. These include operational risk, financial risk, human resources (e.g. recruiting, retaining and managing a workforce); strategic risk, legal/regulatory risk (e.g. ownership of patient data); technological risk (e.g. biomedical and information technologies).
4.10.2 The public sector has developed practical guidance to assist governments and government agencies in developing ERM frameworks and risk response strategies to manage outcomes of policy implementation, extreme events (natural and man-made) and increasing consumer activism where the State is deemed to under-deliver or fail in delivering its legal responsibilities and duties.
4.10.3 The practice of NHS outsourcing to private sector health care providers can impact on the private sector’s own risk management practices. Private sector service delivery and pricing are influenced by NHS outsourcing. In a mixed economy of care the insurer’s ERM framework needs to incorporate environmental scanning activity to detect the signals of risk and opportunity which may originate from different stakeholder groups. The insurer’s ERM framework should encompass both technical quality ‘what the customer gets’ and functional quality ‘how he gets it’, Grönroos (1984) and recognise the potential for unintended and unexpected consequences from shifts in policy and risk management in the provider sector and how the impact on consumer behaviour.
4.10.4 Health insurance product differentiation and innovation aims to retain loyal/knowledgeable customers, encourage repeat purchases maintain/increase market share whilst copies appear, the competition intensifies and the segments drift apart Grönroos, (1984). The impact of economic, social and political change on public healthcare budgets, risk appetites and consumer healthcare behaviour will demand ERM frameworks with adaptive feedback and control mechanisms to identify where expected outcomes diverge from the business model and trigger risk management actions. In particular, performance metrics based solely on general insurance techniques primarily intended for a 1-year time horizon would seem inadequate to the challenges of the health insurance market.

41
5 HEALTH INSURANCE UNDER SOLVENCY II
5.1 The Regulation of Health Insurance as an Insurance Enterprise
5.1.1 Solvency II seeks to harmonise insurance regulation within the EU, encourage the use of risk management, and promote transparency and market efficiency. While Solvency II is explicit in its aim to promote ERM, it is principle based in this aim. Thus, adequate risk management specific to health insurance is not addressed in Solvency II. The extent of specific requirements for health insurance related risks are the solvency capital standards for health insurance. Thus, this section of the paper has a strong focus on risk based capital issues for health insurance.
5.1.2 The treatment of health insurance under Solvency II has been a topic of much debate. The forms of health insurance, as well as their economics and risk profiles, vary across member states due to national and regional perspectives on health and care, local social insurance systems, local healthcare markets, and other factors. It is therefore a challenge to define health insurance in a manner that can accommodate all this variation, and in particular a Standard Formula for quantifying risk-based capital consistently across all Member States.
5.2 CEIOPS Advice on Health Insurance Regulation
5.2.1 CEIOPS has been active in seeking to develop a consensus view across member states on the treatment of health insurance under Solvency II and its has issued and responded to a number of consultation papers on the subject and how health insurance is intended to be regulated alongside life and non-life insurance business lines.
5.2.2 The CEIOPS advice on the Level 2 implementing measures for the Solvency II regulation of health underwriting risk and its treatment in the Standard Formula for the Solvency Capital Requirement (SCR) was issued on 8 April 2010 as CEIOPS-DOC-68/10, CEIOPS (2010).
5.2.3 The CEIOPS paper is the revised version of CP72, CEIOPS (2009), following stakeholder feedback from consultation and further collection of data.
5.2.4 CEIOPS has classified all health insurance undertakings under three separate categories:
(a) Health insurance obligations pursued on a similar technical basis to that of life insurance (SLT Health).
(b) Health insurance obligations not pursued on a similar technical basis to that of life insurance (Non-SLT Health).
(c) Health insurance obligations Catastrophe risk (Health CAT), CEIOPS (2010). Therefore, health insurance (as defined in this paper) would primarily be associated with the non-SLT classification. But, depending on the health insurance product, it could have catastrophe exposures or be classified as SLT.

42
5.2.5 CEIOPS summarises the health modules via figure 34.
Figure 34: Summary of Health Modules Source: CEIOPS (2010)
5.2.6 Each module is associated with a risk associated with health insurance, whether SLT, non-SLT, or both. Other risks assumed by a health insurer are addressed in through other modules are not a part of the health underwriting module. For example, operational risks specific to health insurance are addressed in a general operational risk module that applies to all classes of insurance.
5.2.7 CEIOPS provided the proposed calibration of the health underwriting risk module in accordance with the requirements of Article 104 of the Level 1 text, which states that each of the risk modules referred to in paragraph 1 shall be calibrated using a Value at Risk measure with a 99.5% confidence level, over a 1-year period.
5.2.8 CEIOPS’ advice is based on health insurance data that they received from fifteen Member States. This represented a significant improvement compared to previous calibration exercises undertaken by CEIOPS. Only six Member States provided data for analysis in Consultation Paper 72, and only three for QIS3 and QIS4, CEIOPS (2010). However, data for any one specific risk was not necessarily available from all fifteen member states, The data was not necessarily homogeneous across member states in respect of the forms of health insurance (e.g., medical expense versus income protection). Subsequent analysis by CEIOPS as part of the European Commissions Health Task Force slightly expanded the data points used for the final calibration.
5.2.9 The health insurance data used by CEIOPS in its calibration was judgementally filtered to remove, to the best extent possible, distortions due to mergers and acquisitions, apparent inconsistencies between different years and between opening reserve and closing reserve for the same company, catastrophe losses and other features which were considered to be incorrect based on expert judgement, CEIOPS (2010).
5.2.10 CEIOPS’ analysis was stated to be in line with the requirements underlying the design of the Standard Formula. For example:
(a) it provides an estimate for a set of factors which are pan-European;

43
(b) allowance has been made for an average level of geographical diversification, as implied by data;
(c) no allowance for underwriting cycle;
(d) no allowance for expected profits and losses; and
(e) no allowance for a size factor (e.g., diversification by volume, which implies that the proposed calibration may overestimate for large portfolios and underestimate for small portfolios), CEIOPS (2010).
5.2.11 No explicit allowance was made for inflation in the calibration process. Implicitly therefore it was assumed that the inflationary experience in the period from 2002 to 2008 was representative of the inflation that might occur in the future. The period analysed was a relatively benign period with low inflation in the countries supplying data and without unexpected inflation shocks which might be expected to increase the factors. The medical inflation issue in respect of health insurance was not explicitly considered in CEIOPS’ design and calibration of the health underwriting risk module.
5.2.12 The CEIOPS advice was summarised via the results shown in CEIOPS-DOC-68/10. The final gross technical fitted result across all methods was derived by taking an average of the methods that best fit the data. CEIOPS reported that their selection was not conservatively selected, but rather based on the goodness of fit results and the adequacy of the method. Furthermore by blending methods, CEIOPS is ensuring that the factors are not biased towards factors most appropriate for larger portfolios (and hence leading to a lower calibration). The analysis shows that for most lines of business the factors should be higher for smaller and medium portfolios, CEIOPS (2010).
5.2.13 CEIOPS supplemented its analysis with additional exercises provided by itself or by the industry. These additional exercises also suggest that factors proposed for QIS4 may not be appropriate at least for some lines of business.
5.2.14 CEIOPS initially recommended that the factors for the premium and reserve risk sub modules should be as per figure 35.
LOB Net premium factor Net reserve factor
Accident 10.0% * (NCR/GCR) 17.5%
Sickness 7.5% * (NCR/GCR) 12.5%
Workers compensation 10.0% * (NCR/GCR) 12.5% Figure 35: Recommended Factors for Premium and Reserve Risk Sub Modules
Source: CEIOPS (2010)
Note:
CEIOPS has recommended an adjustment factor for Premium Risk that is undertaking specific, and so it is not possible to provide a single numeric net premium factor common for all insurers since the effect of reinsurance uniquely affects each insurer. NCR and GCR stand for net combined ratio and gross combined ratio respectively
5.2.15 CEIOPS endeavoured to be as transparent in the process they followed as far as possible CEIOPS (2010).
5.2.16 At the time, CEIOPS recognised that, as the Standard Formula is intended to be pan-European, it is not possible to select a factor that fits all portfolio specificities and works perfectly for all undertakings operating in the EEA. The Solvency II framework provides several approaches

44
for an undertaking to determine its SCR, only one of which is the Standard Formula. CEIOPS reported that undertakings that consider that some or all of the standard parameters within the Standard Formula do not appropriately reflect their risk profile, may wish to consider using Undertaking Specific Parameters or applying for the approval of a (full or partial) internal model, CEIOPS (2010).
5.2.17 For estimation risk in the Standard Formula, a shock can be derived as follows: it is assumed that undertakings estimate the level of claims from the last five observations, i.e. the annual inflation-adjusted claims for the last five years. If the distribution of annual claims is assumed to be approximately normal, the estimation error on a 99.5% VaR level can be calculated as indicated by figure 36.
Estimation error =
σ*)995.0(5
1−N σ*15.1≈
where N is the cumulative distribution function of the standard normal distribution and σ the standard deviation of annual claims. Figure 36: Distribution of annual claims, assuming an estimation error of 99.55 VAR
5.2.18 The capital charge for the combined premium risk and reserve risk was determined as indicated by figure 37.
Figure 37: Capital charge for combined premium risk and reserve risk
5.2.19 The mathematical formulae used by CEIOPS are specified in their final advice paper, CEIOPS (2010).
5.2.20 Following the publication of the final advice papers on 8 April 2010, the Solvency II calibration paper was issued as CEIOPS-SEC-40-10 on 15 April 2010, CEIOPS (2010).. This paper refined the calibrations for all lines of business and provided the background information to the technical analysis carried out by CEIOPS for the calibration of key parameters of the Standard Formula for the SCR and the calculation of technical provisions for the purpose of QIS-5. The calibrations they advised for the Standard Formula are shown in figure 38, CEIOPS (2010), but have subsequently been revised CEIOPS (2010), as indicated by figure 38.
LOB Gross premium factor Gross reserve factor
Accident 12.5% 17.5%
Sickness 9.5% 12.5%
Workers compensation 5.5% 12.0% Figure 38: Calibration of key parameters of the Standard Formula for the SCR and the calculation of technical provisions for the purpose of QIS-5 in the final advice for CP 72
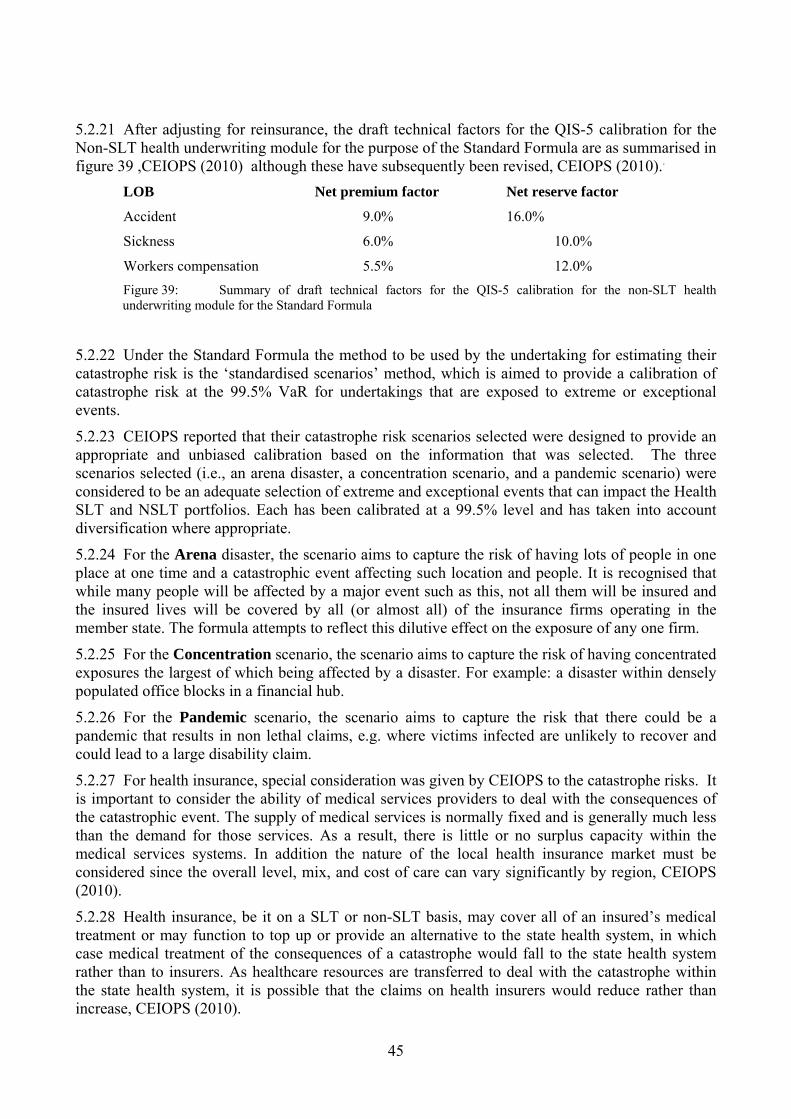
45
5.2.21 After adjusting for reinsurance, the draft technical factors for the QIS-5 calibration for the Non-SLT health underwriting module for the purpose of the Standard Formula are as summarised in figure 39 ,CEIOPS (2010) although these have subsequently been revised, CEIOPS (2010)..
LOB Net premium factor Net reserve factor
Accident 9.0% 16.0%
Sickness 6.0% 10.0%
Workers compensation 5.5% 12.0% Figure 39: Summary of draft technical factors for the QIS-5 calibration for the non-SLT health underwriting module for the Standard Formula
5.2.22 Under the Standard Formula the method to be used by the undertaking for estimating their catastrophe risk is the ‘standardised scenarios’ method, which is aimed to provide a calibration of catastrophe risk at the 99.5% VaR for undertakings that are exposed to extreme or exceptional events.
5.2.23 CEIOPS reported that their catastrophe risk scenarios selected were designed to provide an appropriate and unbiased calibration based on the information that was selected. The three scenarios selected (i.e., an arena disaster, a concentration scenario, and a pandemic scenario) were considered to be an adequate selection of extreme and exceptional events that can impact the Health SLT and NSLT portfolios. Each has been calibrated at a 99.5% level and has taken into account diversification where appropriate.
5.2.24 For the Arena disaster, the scenario aims to capture the risk of having lots of people in one place at one time and a catastrophic event affecting such location and people. It is recognised that while many people will be affected by a major event such as this, not all them will be insured and the insured lives will be covered by all (or almost all) of the insurance firms operating in the member state. The formula attempts to reflect this dilutive effect on the exposure of any one firm.
5.2.25 For the Concentration scenario, the scenario aims to capture the risk of having concentrated exposures the largest of which being affected by a disaster. For example: a disaster within densely populated office blocks in a financial hub.
5.2.26 For the Pandemic scenario, the scenario aims to capture the risk that there could be a pandemic that results in non lethal claims, e.g. where victims infected are unlikely to recover and could lead to a large disability claim.
5.2.27 For health insurance, special consideration was given by CEIOPS to the catastrophe risks. It is important to consider the ability of medical services providers to deal with the consequences of the catastrophic event. The supply of medical services is normally fixed and is generally much less than the demand for those services. As a result, there is little or no surplus capacity within the medical services systems. In addition the nature of the local health insurance market must be considered since the overall level, mix, and cost of care can vary significantly by region, CEIOPS (2010).
5.2.28 Health insurance, be it on a SLT or non-SLT basis, may cover all of an insured’s medical treatment or may function to top up or provide an alternative to the state health system, in which case medical treatment of the consequences of a catastrophe would fall to the state health system rather than to insurers. As healthcare resources are transferred to deal with the catastrophe within the state health system, it is possible that the claims on health insurers would reduce rather than increase, CEIOPS (2010).

46
5.2.29 In the UK, health insurance provides access to care from private care providers that deal with acute conditions such as cancer and cardiovascular disease, but not emergencies. In emergencies arising from an accident or a pandemic, policyholders would rely on the NHS for treatment and care rather than rely on private providers. For markets such as these, no capital requirements are considered necessary for the catastrophe scenarios specified. For a market event, the constrained capacity within the NHS implies that the treatment would be in place of other healthcare treatments that the insurer would be paying for anyway. Although the types of treatment and costs would differ, it is anticipated that the overall increase in claim cost would be modest and would be logically reflected in the ordinary volatility risk, CEIOPS (2010).
5.2.30 CEIOPS reported that their scenario in which catastrophe capital may be required is under the ‘concentration scenario’ and the insurer would cover the cost of all medical treatment arising out of the scenario. If health insurance is offered to a group of employees (or similar) then an event effecting those employees would generate an unanticipated increase in claim cost for the insurer and any offset from the substitution effect considered above would be very small. Capital would be required here and should be calculated in a similar manner to that for other types of benefit. As a result this has been allowed for under the ‘concentration scenario’, CEIOPS (2010).
5.2.31 The final QIS-5 Solvency II design and calibration factors for health insurance published by the EC (European Commission) on 5 July 2010, European Commission (2010) differ in several respects from CEIOPS’ final advice. In particular, the classifications for risks are along medical and income protection lines rather than historical accident and sickness lines.
5.2.32 The QIS-5 documents define underwriting risk as the specific insurance risk arising from insurance contracts, in so far as it relates to the uncertainty about the results of the insurer's underwriting. This includes uncertainty about the amount and timing of the eventual claim settlements in relation to existing liabilities, the volume of business to be written and the premium rates at which it will be written, the premium rates which would be necessary to cover the liabilities created by the business written and the risk resulting from decisions made by policyholders regarding whether they decide to renew or not, European Commission (2010).
5.2.33 The QIS-5 Solvency II calibration factors for SLT and non-SLT health insurance business (which are lower than those recommended by CEIOPS) have been summarised in figures 40 and 41, alongside the CEIOPS emerging and final advice, Elliott & Abbey (2010) and CEIOPS (2010). .
Note The adjustment factor for non-proportional reinsurance NP by line of business allows undertakings to take into account the risk-mitigating effect of particular per risk excess of loss reinsurance.
Figure 40: Summary of non-SLT health underwriting risk module - development of premium factors Line of Business QIS4 CP50
Option 3 CP72
OriginalCP72
RevisedQIS5
OriginalLine of Business QIS5
Revised
Accident 5.0% 5.0% 10.0% 12.5% x NGR
9.0% x NGR
Medical expense 4.0%x NP
Sickness 3.0% 3.0% 7.5% 9.5% x NGR
6.0% x NGR
Income protection 8.5%x NP
Workers' Compensation
7.0% 7.0% 10.0% 5.5% x NGR
5.5% x NGR
Workers' Compensation
5.5%x NP
Non-proportional health reinsurance 17.0%
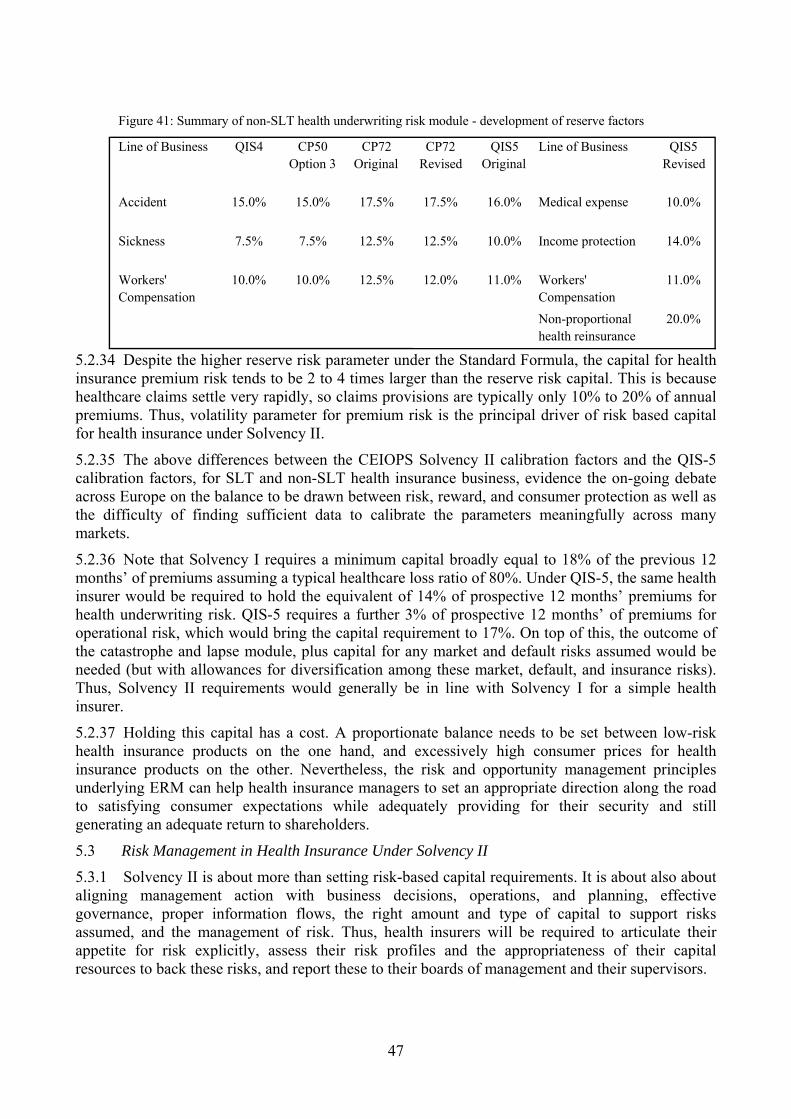
47
5.2.34 Despite the higher reserve risk parameter under the Standard Formula, the capital for health insurance premium risk tends to be 2 to 4 times larger than the reserve risk capital. This is because healthcare claims settle very rapidly, so claims provisions are typically only 10% to 20% of annual premiums. Thus, volatility parameter for premium risk is the principal driver of risk based capital for health insurance under Solvency II.
5.2.35 The above differences between the CEIOPS Solvency II calibration factors and the QIS-5 calibration factors, for SLT and non-SLT health insurance business, evidence the on-going debate across Europe on the balance to be drawn between risk, reward, and consumer protection as well as the difficulty of finding sufficient data to calibrate the parameters meaningfully across many markets.
5.2.36 Note that Solvency I requires a minimum capital broadly equal to 18% of the previous 12 months’ of premiums assuming a typical healthcare loss ratio of 80%. Under QIS-5, the same health insurer would be required to hold the equivalent of 14% of prospective 12 months’ premiums for health underwriting risk. QIS-5 requires a further 3% of prospective 12 months’ of premiums for operational risk, which would bring the capital requirement to 17%. On top of this, the outcome of the catastrophe and lapse module, plus capital for any market and default risks assumed would be needed (but with allowances for diversification among these market, default, and insurance risks). Thus, Solvency II requirements would generally be in line with Solvency I for a simple health insurer.
5.2.37 Holding this capital has a cost. A proportionate balance needs to be set between low-risk health insurance products on the one hand, and excessively high consumer prices for health insurance products on the other. Nevertheless, the risk and opportunity management principles underlying ERM can help health insurance managers to set an appropriate direction along the road to satisfying consumer expectations while adequately providing for their security and still generating an adequate return to shareholders.
5.3 Risk Management in Health Insurance Under Solvency II 5.3.1 Solvency II is about more than setting risk-based capital requirements. It is about also about aligning management action with business decisions, operations, and planning, effective governance, proper information flows, the right amount and type of capital to support risks assumed, and the management of risk. Thus, health insurers will be required to articulate their appetite for risk explicitly, assess their risk profiles and the appropriateness of their capital resources to back these risks, and report these to their boards of management and their supervisors.
Figure 41: Summary of non-SLT health underwriting risk module - development of reserve factors Line of Business QIS4 CP50
Option 3CP72
OriginalCP72
RevisedQIS5
OriginalLine of Business QIS5
Revised
Accident 15.0% 15.0% 17.5% 17.5% 16.0% Medical expense 10.0%
Sickness 7.5% 7.5% 12.5% 12.5% 10.0% Income protection 14.0%
Workers' Compensation
10.0% 10.0% 12.5% 12.0% 11.0% Workers' Compensation
11.0%
Non-proportional health reinsurance
20.0%

48
5.3.2 It is possible, and indeed likely, that a insurer’s risk appetite will not align with the supervisor standard of a 1-year 99.5% VaR. For example, a firm may seek a high credit rating, or it may want a high confidence that it can meet its objectives well beyond a 1-year time horizon.
5.3.3 Solvency II recognizes this. Thus as part of their Own Risk and Solvency Assessment (ORSA) process, insurers must reconcile their risk profile and capital level to the regulatory minimum and prove that the firm is no less prudent than the regulatory minimum. The insurance risk assessment is a central feature of Solvency II’s requirement that insurers produce an ORSA. Solvency II is at its core about insurer survival with a high degree of confidence. It is important that the management team takes a view on insurance risk and how they will manage their insurance risk. Despite the common practice of an annual business planning cycle, few insurance risks can be aligned with such a convenient time frame.
5.3.4 Solvency II nevertheless requires firms to take a broad view of the historical record and recognize credibility and suitability limitations with data. At its heart, Solvency II should make firms better appreciate the extent of what they know and do control and what they don’t know and may not control. Stress testing and scenario testing are expected to become the norm, including reverse stress testing to help characterize the types of scenarios that would lead to insolvency. These scenarios could very well play out over a longer time frame than the 1-year assumed in the design of Solvency II’s SCR or the time frame used by management for business planning purposes. Management should consider extreme and ‘inconceivable’ scenarios and how they would unfold over time.
5.3.5 This may sound very theoretical, especially for a ‘predictable’ class of insurance such as health insurance. Figure 42 illustrates the experience of Bupa during the macro-economic context of the 1970s (i.e., stagflation) and highlights how a narrow 1-year time horizon could be misleading for health insurance since ‘abnormal’ conditions took a few years to manifest themselves and work themselves through the economy and healthcare market.
Figure 42: Fluctuation of a health insurance portfolio’s dynamics through turbulent macro-economic context
BUPA experience over time
-4%
-2%
0%
2%
4%
6%
8%
10%
12%
14%
16%
18%
20%
22%
24%
26%
28%
30%
32%
1966
1967
1968
1969
1970
1971
1972
1973
1974
1975
1976
1977
1978
1979
1980
Year
% C
hang
e Y
ear
on Y
ear
CPI GDP ΔRisk Cost Δ# Policies ΔPremium

49
5.3.6 Figure 42 illustrates how during ‘normal’ times an insurer has to manage fluctuating claim costs and the net rate of portfolio growth. Between 1966 and 1971, claim cost rate increases doubled from 6% to 12% per annum whilst portfolio growth ranged from 2% to 10%.
5.3.7 If the period of ‘normalcy’ is sufficient, institutional memory of unstable periods may weaken. Who in 1971 would have believed that the claim cost rates would reach four times historical average and that the portfolio would begin to contract due to severe lapses and limited growth?
5.3.8 Since health risks often have a significant macro-economic component, extreme scenarios could easily take more than one year to play out. Such a time horizon is longer than that adopted for Solvency II. A 1-year, 99.5% VaR level of confidence is a necessary standard for consistency across the European insurance markets. But this simple historical case study suggests that it may not be sufficient to characterise the risks inherent to a given business. Hence the need for stress and scenario testing by a health insurer’s management to inform them on the risks underlying assumptions in the business model.
5.3.9 This is not to say the Solvency II standard is flawed or deficient in this aspect. Any solvency standard will have limitations. It will always be necessary for insurers to strive to understand risks and uncertainties in a more specific and realistic manner.
5.3.10 More generally, each health insurer will find itself in a unique position in respect to its business objectives, risk exposures, risk appetite, and capital and management resources to support risks assumed. Solvency II sets out some basic measures for capital adequacy, and both carrots and sticks for developing risk management. This is especially true in respect of operational risk. Thus, the ERM tools described in Section 2 of this paper are supportive of Solvency II’s Pillar 2 objectives. But it is not possible to translate these into “one right way” of managing health risks across the market as easily as it can set Pillar 1 standards for preparing the regulatory balance sheet and assessing capital adequacy.
5.4 Potential Reactions to Solvency II by the Health Insurance Industry 5.4.1 Solvency II will promote risk and capital awareness. Ideally firms will be prompted to develop a deeper appreciation for ERM and in doing do assimilate ERM practices such as risk planning and scenario testing and the use of a rigorous ERM framework. (Sections 2 and 5).
5.4.2 Capital requirements under Solvency I were based on simple revenue and claims based measures. These were tied to uneconomic and arbitrary rules. These include a 50% limit to the amount of capital that could be offset through reinsurance and the so-called ‘three-year look back rule’. In addition, a 72% loss ratio threshold that triggered a higher capital requirement rate regardless of whether portfolios with a 72% loss ratio represent fundamentally different levels of risk and uncertainty. These factors limited the use of reinsurance in the health insurance market and also created barriers to entry in established markets.
5.4.3 Solvency II, on the contrary, focuses on risks and uncertainties in health insurance underwriting, reserving, and catastrophe exposures. It does away with Solvency I’s arbitrary and uneconomic rules. The consequences of this include reinsurance being more extensively used as a capital management tool. For example, the larger health insurers can be expected to realise more capital efficiencies under Solvency II and this in turn will increase the competitive pressures on the smaller health insurers in those markets.
5.4.4 QIS-5 will evaluate the impact on the health insurance sector. The calibration of the SCR suggests that the aggregate capital requirements will be broadly in line with Solvency I levels for the typical health insurer. CEIOPS expects to publish it QIS-5 findings in early 2011.
50
6 MANY RISKS ... AND MANY VIEWS OF RISK
6.1 In the previous sections, we touched on the risk perspectives of several key players in the health insurance industry, namely those of insurers, consumers, providers, policy makers, and finally regulators. These players’ influences on the health insurance market form something of a system, with its own ecology. While each part in the health system depends on others, any one party’s actions can also work at odds with the others.
6.2 Another way of conceiving this is that there are always multiple perspectives on risks in every health insurance purchase and decision. For example, an insurer may want to manage its risks to meet whatever its business objectives are, while the regulator requires sufficient capital so that the insurer can manage risks to a high standard over a 1-year time horizon. Consumers want the insurer to not only be solvent over the next few years but provide coverage on an ongoing basis that provides access to the care they desire in the event of an adverse health event even if years in the future. Solvency II requires only the reconciliation of the first two of these objectives. Ostensibly it requires a consideration of the consequences of risks originating from other entities, but only if such risks are material. And it does not require a reconciliation of the supervisory and insurer risk perspectives with that of consumers.
6.3 Why might this gap be a problem? If consumers are purchasing health products using more of a life insurance mindset, they may be assuming that the insurer will always renew products each year, and on reasonable and non-discriminatory terms, in order to provide coverage they would want now in the event of need. However, the insurer may decide at some future time to change its mind on product support, design, or pricing, at which point the customer may not meet insurer’s underwriting standards for contract renewals. One could argue that the supervisor would seem to be indifferent, provided that the anticipated liabilities can be settled in full as they fall due to a supervisory standard and to the standard set out by the insurer’s board of management.
6.4 Furthermore, the insured may develop a medical condition which was covered for claims at the point of onset but not following the insurer’s retroactive management decision to deny such medical conditions for future claims. Whilst such action may be acceptable within short-term general insurance obligations, it would not be acceptable under long-term insurance obligations. It could be argued that there is asymmetry between the insured’s long-term health insurance requirements and the insurer’s short-term (i.e., 1-year) insurance contract. Again, the supervisor would seem to be indifferent to such asymmetries between short-term cover and long-term insurance needs.
6.5 Health insurance is not quite like other personal classes of insurance, such as travel or motor insurance. With these classes, there is less of an attachment to insurers and more of a willingness to change based on price product or value without penalty. At least with life products, firms must meet capital standards that consider adverse events that occur over long durations. It is hard for health insurance customers to switch if they have a pre-existing condition. Thus, if the future has the potential for ‘black swans’, are health insurance consumers more exposed to this mismatch of parties’ risk management expectations?
6.6 Health insurance is relatively ‘low risk’ in the near term, despite the complexities of products and markets. But what makes it so interesting is the longer term interaction of the players above. Health insurance industries around the world have struggled to create long term products to provide customers with the products and guarantees they desire, even in those markets where risk equalisation systems, national health systems, and community rating or age-at-entry rating systems exist.
6.7 Such a product would have to address, amongst other factors:
(a) Morbidity trends.

51
(b) Medical inflation trends.
(c) Medical advances and associated changing medical protocols.
(d) Macro-economic shocks.
(e) Innovations and breakthroughs in medical technologies and treatment.
(f) Shifting definitions or standards for illness, treatment, minimally acceptable care, and what is considered medically necessary.
(g) Adverse selection and moral hazard.
(h) Shifts in government policy.
(i) Periodic social upheaval, war, etc.
(j) Changing regulation.
6.8 It has been difficult for the industry to embrace successfully all of these risks and uncertainties and in doing so create a viable market for long-term health insurance products. Fundamentally there are gaps and conflicts between the perspectives of risk among the players in the ‘eco-system’ of healthcare and health insurance. This seems to be a common problem found in most countries around the world. They have responded with many varieties of solutions, such as risk equalisation systems, guaranteed issue requirements, community rating schemes, risk pooling, mandated benefits, and so on.
6.9 Health insurance seems to involve an implicit standard of fairness that is difficult to codify into an insurance contract. Consumers want insurers to be there to provide good service in the long run, and hence be capitalised and manage risks accordingly, regardless of the regulatory standard that applies.
6.10 Furthermore, they trust that their policies will be renewed at a fair price, perhaps with changes to excess levels, accepting that medical inflation is a difficult but necessary social phenomenon. Consumers do not expect insurers to drop them from coverage simply because they have claimed. And while consumers can struggle with the difficulty of changing definitions and medical understanding over the long term, they expect to be treated fairly if definitions used at point of purchase become nebulous as time passes and medical standards evolve. Health insurers thus appear to preserve a custodial duty to consumers beyond a fiduciary duty.
6.11 If this is the case, what if anything should insurers consider as part of their risk management efforts that factor in this consumer’s perspectives on health risks? Or, are there some risks associated with health insurance, such social and healthcare costs trends, that are effectively uninsurable and which the consumer is willing to assume?
6.12 As an example of just one issue, risk-based performance measurement systems used by health insurer’s management are often those commonly used those for general insurance products, such as risk-adjusted return on capital. Given that health insurance is relatively low risk as discussed in section 5 (e.g., a small SCR), but implicitly depends on brand and long-term customer loyalty (which is not an asset represented on the Solvency II balance sheet), perhaps some form of embedded value metric would be valid. Such a metric could be used to encourage behaviours in health insurance organisations to align and manage longer-term interests common to the insurer and consumer that are not likely to be captured by either an SCR or a 1-year business plan. Insurers must ask themselves if they are incentivising management consistently with the risks and the appetite for these risks that the board seeks to manage over a specific horizon of time.
6.13 The world is continually changing. For example, how would the healthcare ‘eco-system’ described above change if a period of stagflation returns as governments try to lower deficits and

52
bond markets attempt to price in credit risks? What would happen to healthcare providers, to insurance premium tax rates, consumer purchasing power, anti-selection, etc? Such questions would seem to be sensible to evaluate by health insurers even if their time horizon is shorter than the government’s.
6.14 Solvency II encourages thinking about risk management and anticipating absurd but possible change. But it is unclear if Solvency II’s paradigm is sufficient given health insurance’s unusual social and long-term characteristics that lead other key players in the market, such as consumers, providers, and government officials, to take a longer term view of healthcare risks.
7 CONCLUSIONS
7.1 Health insurers should consider developing ERM programmes (as described in sections 2 and 3) that include very open ended stress and scenario testing to drive out hidden assumptions about health, shows the effects of shifts and shocks to the wider healthcare landscape (as described in sections 4 and 5), along with the challenges the limitations and suitability of our knowledge in the face of risks and uncertainties related to the future. They should assess how the organisation can learn from potential risk exposures and then synthesize these findings into more effective operations to manage risks and exploit opportunities.
7.2 ERM frameworks for health insurers are likely to be more complex than those for life and non-life insurers. Not only will they have to cater for the insurance lines of business, but also for their interface with government healthcare policy and a mixed economy of public and private sector healthcare providers.
7.3 ERM frameworks for public and private sector healthcare providers are likely to be affected by governmental and political influences regarding corporate governance best practice and the need to satisfy public expectations regarding healthcare delivery services. In the eventuality of stresses and shocks, there will be occasions when national and local government are likely to become involved to deal with such stresses and shocks.
7.4 The ERM process commences with comprehensive Analysis of the business model, where the inputs include business process maps and value chain analysis. The Analysis stage provides an input to subsequent assessment, evaluation and planning stages. The conclusion to the ERM process should be an ERM-enabled insurer who can evaluate the risk/return economics associated with its existing value chain configuration and linkages and plan its risk response strategies to re-configure the value chain as and when required.
7.5 Holistic ERM is allied to risk and opportunity management and can potentially build a sustainable supplementary health insurance business model which increases customer value in a complex, mixed economy of care. ERM can underpin balancing the risks and rewards inherent in the insurer’s innovation portfolio associated with complex healthcare service offers. The ERM framework needs also to be inclusive, involving insurers and their stakeholder community, policyholders and their dependants, healthcare providers, regulatory and Government healthcare policy advisors.
7.6 In the view of the authors, the CRO of a health insurer should start with the design and implementation of a broadly based ERM framework. Having covered the core ERM implementation issues, including the six iterative risk management steps (if we adopt the base framework outlined by Chapman), considered the corporate governance and oversight issues, the internal controls, the internal and external sources of risk, the CRO can then begin to deal with the

53
effective risk management of the innovation portfolio and the road towards the achievement of the corporate strategy.
7.7 The CRO will need to balance the risks and rewards inherent in the innovation portfolio. ERM needs to be embedded within innovation portfolio screening tools such as a risk matrix which plots a firm’s planned projects on a spectrum of risk. The essential input to this project is an experienced, multi-disciplinary team involving senior managers with a strategic focus and authority for financial resource allocation and the participation of team members delivering specific projects. The risk matrix is a pre-cursor to other tools used to explore an innovation product concept, its potential market and the company’s capabilities and competition.
7.8 Each concept in the health insurer’s innovation portfolio should be assessed by its development team using the R-W-W screening system. The CRO needs to embed the selected ERM framework and principles within the resolution of each of the three ‘heading’ questions, in order to screen the company’s innovation portfolio. The end result is to try and ensure that the proposed innovation portfolio is robust and is aligned to the risk appetite of the company, the ERM framework and the corporate strategy.
7.9 An organisation is only as strong as the weakest link across its value chain. The health insurer must take the broadest view of its own value chain and how and who it interfaces with. This is enabled by an exhaustive analysis of the insurer’s value chain and the development of appropriate risk management processes e.g. hospital provider and consultant/surgeon input monitoring systems and processes which manage delivery and costs upstream whilst managing experienced outcomes downstream at the point of pre-authorisation and care delivery.
7.10 Effective supplier monitoring systems supported by a risk dashboard or watch list can further indicate emerging risks or opportunities. Prioritising supplier relationships and value chain linkages as critical risks with a high impact can also lead to the development of cooperative relationship with providers.
7.11 Health insurance under Solvency II is a complex subject, as much depends on the national position of the EC member states on their public and private sector healthcare delivery systems. Some features of health insurance are similar to those for non-life insurance undertakings, whereas other features are similar to those for life insurance undertakings. The CEIOPS advice has attempted to recognise these complexities and has sought to develop on pan-European view on how best to proceed with the regulation of health insurance undertakings. However, healthcare seems unusual in the number of key players in the market with differing objectives, time horizons, and views on risks.
7.12 Under Solvency II, the UK health insurance model has potential applications for other EC member states and insurers may benefit from EC increased mobility of labour and residence. Supplementary health insurers may be able to exploit gaps in state provision and in customer segments served by the public sector. They will need to adopt a combined strategy of cost and value differentiation to balance the tension arising from the differing perspectives on healthcare risk and value among key players in the healthcare market. The switch from Solvency I to Solvency II should help prompt the health insurance industry to make more economic decisions in the use of their capital, the management of risks, the design of products, and organisation of operations. But Solvency II does not capture many of health insurance’s nuances.
7.13 Given the complexity involved with the health insurance, product concepts should be positioned as ‘options’ on the future rather than ‘winners and losers’, with these options part of a relevant ERM framework module. The screening process should derive and evolve from the direct input of team members to avoid the risk of ‘transplant rejection’ where a process is grafted on from an external or internal donor that does not share the same DNA as the adopter. Embedding ERM

54
within the organisation and ensuring that it is part of the DNA of every strategic and operational decision hinges on people and culture. This includes connecting with a diverse stakeholder community.
7.14 ERM health insurance practitioners need to build a culture and business processes which value learning from the people within the insurer’s stakeholder community:
Learn from the people Plan with the people Begin with what they have Build on what they know Of the best leaders When the task is accomplished The people all remark We have done it ourselves Source: Taoist sage, Lao-tzu.

55
REFERENCES
BRATZ, R., BARGER, D., GELLER, K., KICKLIGHTER, L., MIDGELEY, M.S., SHOSTEK, K., ULMER, E.G. & NAKAMURA, P.L. (2006) Enterprise Risk Management Monograph. American Society for Healthcare Risk Management, USA
CABINET OFFICE (2002). Risk Improving Government’s Capability to Handle Risk and Uncertainty. Strategy Unit, Cabinet Office, London, UK
CEIOPS (2009). Consultation paper no. 72 – Draft L2 advice SCR Standard Formula – Calibration of Health Underwriting Risk, available at: https://www.ceiops.eu/fileadmin/tx_dam/files/consultations/consultationpapers/CP72/CEIOPS-CP-72-09-Draft-L2-Advice-Calibration-health-underwriting-risk.pdf
CEIOPS (2010a). CEIOPS’ Advice for Level 2 Implementing Measures on Solvency II: SCR Standard Formula Calibration of the Health Underwriting Risk, published as CEIOPS-DOC-68/10 available at: https://www.ceiops.eu/fileadmin/tx_dam/files/consultations/consultationpapers/CP72/CEIOPS-DOC-68-10%20_L2_%20Advice_on_Calibration_Health_Underwriting_%20Risk.pdf
CEIOPS (2010b). QIS-5 Technical Specifications: Annex to Call for Advice from CEIOPS on QIS-5. Available at: https://www.ceiops.eu/fileadmin/tx_dam/files/consultations/QIS/QIS5/Annexes-to-QIS5-technical_specifications_20100706.pdf
CEIOPS (2010c). Solvency II Calibration paper, published as CEIOPS-SEC-40-10. Available at: https://www.ceiops.eu/fileadmin/tx_dam/files/consultations/consultationpapers/CP70/CEIOPS-L2-Advice-Market-risk-calibration.pdf
CHAPMAN, R.J. (2006). Simple Tools and Techniques for Enterprise Risk Management. John Wiley & Sons Inc., New Jersey, USA
COMPETITION COMMISSION (2000). British United Provident Association Limited and Community Hospital Groups Plc.: A Report on the Proposed Merger. Competition Commission, London, England.
COSO (2004a). Enterprise Risk Management – Integrated Framework, Application Techniques, COSO. (The Committee of Sponsoring Organisations of the Treadway Commission), September 2004.
COSO (2004b). Enterprise Risk Management – Integrated Framework, Executive Summary, COSO (The Committee of Sponsoring Organisations of the Treadway Commission), September 2004. Available at: http://www.coso.org/documents/COSO_ERM_ExecutiveSummary.pdf
DAY, G.S. (2007). Is it Real? Can we Win? Is it worth doing?: Managing Risk and Reward in an Innovation Portfolio, Harvard Business Review, December 2007.
DEPARTMENT OF HEALTH (2000). An Organisation with a Memory: Report of an expert group on learning from adverse events in the NHS chaired by the Chief Medical Officer. HMSO Stationery Office, London. Available at: http://www.dh.gov.uk/prod_consum_dh/groups/dh_digitalassets/@dh/@en/documents/digitalasset/dh_4065086.pdf
DISNEY, H., HORN, K., HROBON, P., KILMARNOCK, A., MIHM, A., MINGARDI, A., PHILIPPE, C., SMITH, D., VAN DEN BROEK, E., & VERHOEKS, G. Impatient for Change: European Attitudes to Healthcare Reform. The Stockholm Network. Available at: http://www.healthpowerhouse.com/files/Impatient%20for%20change.pdf
ELLIOT, S. & ABBEY, T. (2010) Health and Care; Good Practice for Internal Models: A Closer Look at Solvency II. Institute and Faculty of Actuaries Health and Care Conference, April 2010. Available at: http://www.actuaries.org.uk/sites/all/files/documents/pdf/abbey.pdf
EUROPEAN COMMISSION (2010). April 2010: Fifth Quantitative Impact Study: Consultation on Call for Advice and Technical Specifications. Available at: http://ec.europa.eu/internal_market/insurance/solvency/index_en.htm#consultation Draft technical specification available at: http://ec.europa.eu/internal_market/insurance/docs/solvency/qis5/draft-technical-specifications_en.pdf
FOUBISTER, T., THOMSON, S., MOSSIALOS, E. & MCGUIRE, A. (2006). Private Medical Insurance in the United Kingdom. WHO Regional Office for Europe, Copenhagen, Denmark.
GARRATT, R. (2003). The Fish Rots from the Head: The Crisis in our Boardrooms – Developing the Crucial Skills of the Competent Director. Profile Books Ltd. London, England.

56
GRÖNROOS, C. (1984). A Service Quality Model and its Marketing Implications. European Journal of Marketing 18(4) 1984, pp. 36-44.
MCNAMEE, D. (2004). Risk Reflections: based on his extensive experience. Internal Auditor, October 2004. (Report of an Interview). Available at: http://findarticles.com/p/articles/mi_m4153/is_5_61/ai_n6332709/pg_2/?tag=content;col1 NATIONAL HEALTH SERVICE LITIGATION AUTHORITY (2006). Framework Document. Available at: http://www.nhsla.com/NR/rdonlyres/D872241A-43E3-492B-8F74-32FB0586608F/0/Frameworkdocument.pdf
NATIONAL INSTITUTE FOR CLINICAL EXCELLENCE (2007). Risk Assessment at work: Practical examples in the NHS. Available at: http://www.nice.org.uk/niceMedia/documents/risk_assment_examples.pdf
ORROS, G.C. (2007a). Risk Sharing Models for Private Healthcare Insurance. IAAHS Colloquium paper, May 2007. Available at: http://www.actuaries.org/IAAHS/Colloquia/Cape_Town/IAAHS_2007_Orros.pdf
ORROS, G.C. (2007b). ERM Literature Review. GIRO 2007 Convention. Actuarial Profession. Available at: http://www.actuaries.org.uk/sites/all/files/documents/pdf/Tripp.pdfand at: http://www.actuaries.org.uk/research-and-resources/documents/enterprise-risk-management-erm-working-party-overview-and-summary-r32F751723D99/2812/ERM_LitRev_Annex_180807.pdf
ORROS, G.C. & SMITH, J. (2009). Enterprise Risk Management for Health and Care Insurance Companies. Available at: http://www.actuaries.org.uk/_data/assets/pdf_file/0005/160988/OrrosSmith.pdf
ROBERTO, M.A., BOHMER, R. & EDMONSON, A.C. (2006) Facing Ambiguous Threats. Harvard Business Reivew. November 2006.
RUMSFELD, D. (2002) Department of Defense News Briefing. 12 February 2002. Available at: http://www.quotationspage.com/quote/30526.html
SCALLY, G. & DONALDSON, L.J., (1998) Clinical Governance and the Drive for Quality Improvement in the New NHS in England. British Medical Journal 317 July 1008. Available at: http://www.ncbi.nlm.nih.gov/pmc/articles/PMC1113460/pdf/61.pdf
STANDARD & POOR’S. (2005). Insurance Criteria: Evaluating the enterprise Risk Management Practices of Insurance Companies. Standard & Poor’s, McGraw Hill, USA.
TALEB, N.N. (2004). Fooled by Randomness: The Hiden Role of Change in Life and in the Markets. 2nd Ed. The Random House Publishing Group 2005. Penguin Books 2007, London, England.
TALEB, N.N. (2007). The Black Swan: the Impact of the Highly Improbable. Allen Lane, an imprint of Penguin Books, London, England.
TRIPP, M., ORROS, G.C., BRADLEY, H., DEVITT, R., OVERTON, G., PRYOR, L. & SHAW, R. (2003). Risk Measurement or Bust: Operational Risks Working Party. GIRO (2003) Convention. Available at: http://www.actuaries.org.uk/sites/all/files/documents/pdf/measurement-or-bust.pdf
WACHTER, R..M SHOJANIA, K.G., SAINT, S., MARKOWITZ, A.J. & SMITH, M. (2002). Learning from Our Mistakes: Quality Grand Rounds, a New Case-Based Series on Medical Errors and Patient Safety. Annals of Internal Medicine. 136(11): 850-2.
WINKELMAN, R.A., VAN DEN BOS, J. & JOHNS, C. (2006). Society of Actuaries’ Research Project: Health Plan Provider Network Risk, Society of Actuaries, USA. Available at: http://www.soa.org/files/pdf/final%206-26-06.pdf
DISCLAIMER The views expressed in this publication are those of invited contributors and not necessarily those of the Institute and Faculty of Actuaries. The Institute and Faculty of Actuaries do not endorse any of the views stated, nor any claims or representations made in this publication and accept no responsibility or liability to any person for loss or damage suffered as a consequence of their placing reliance upon any view, claim or representation made in this publication. The information and expressions of opinion contained in this publication are not intended to be a comprehensive study, nor to provide actuarial advice or advice of any nature and should not be treated as a substitute for specific advice concerning individual situations. On no account may any part of this publication be reproduced without the written permission of the Institute and Faculty of Actuaries.

Institute and Faculty of Actuaries
Maclaurin House Staple Inn Hall Napier House
18 Dublin Street Edinburgh EH1 3PP T +44 (0)131 240 1300 F +44 (0)131 240 1313
High Holborn London WC1V 7QJ T +44 (0)20 7632 2100 F +44 (0)20 7632 2111
4 Worcester Street Oxford OX1 2AW T +44 (0)1865 268 200 F +44 (0)1865 268 211
www.actuaries.org.uk
© 2010 Institute and Faculty of Actuaries