eric prestbo ph.d. ([email protected]) analysis of atmospheric mercury speciation at...
Post on 21-Dec-2015
215 views
TRANSCRIPT
Eric Prestbo Ph.D. ([email protected])
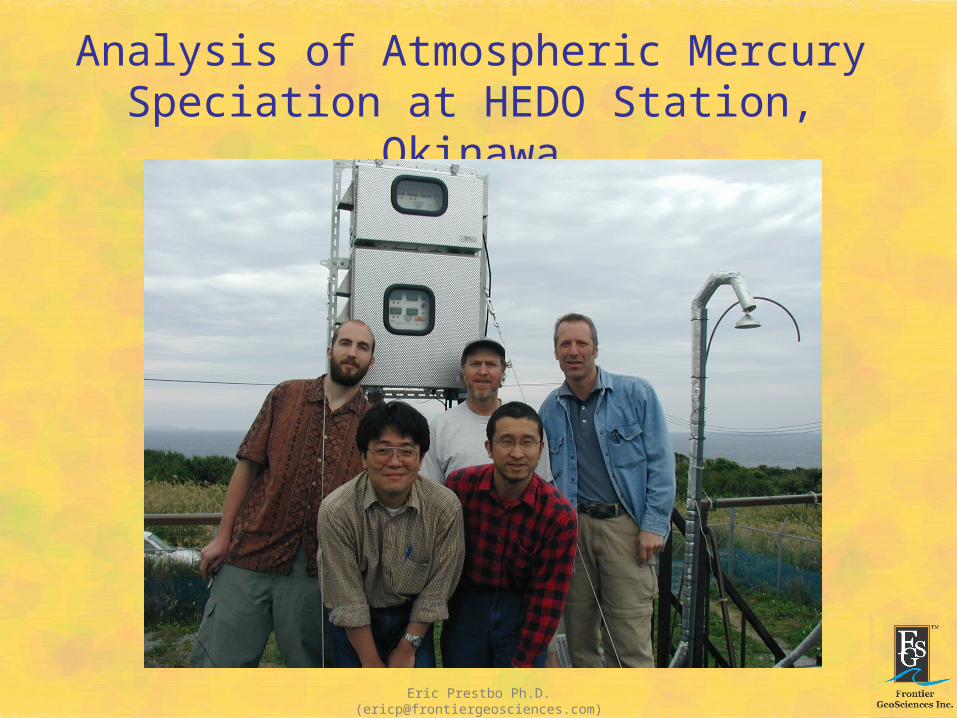
Analysis of Atmospheric Mercury Speciation at HEDO Station, Okinawa


Eric Prestbo Ph.D. ([email protected])
Eric Prestbo Ph.D. ([email protected])
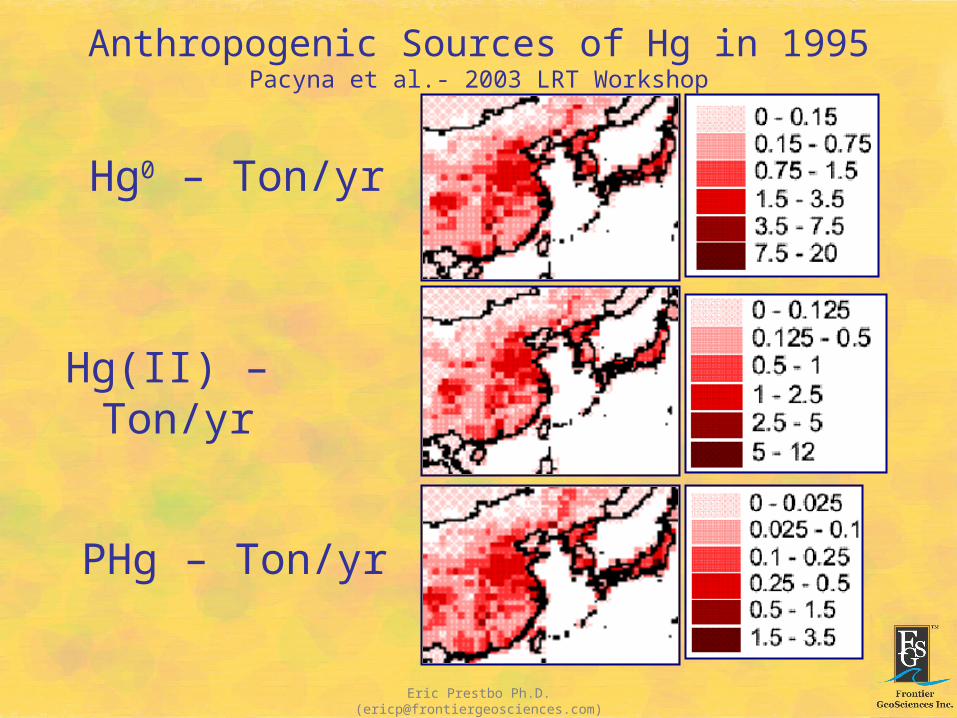
Anthropogenic Sources of Hg in 1995Pacyna et al.- 2003 LRT Workshop
Hg0 – Ton/yr
Hg(II) – Ton/yr
PHg – Ton/yr

Eric Prestbo Ph.D. ([email protected])
Atmospheric Mercury Nomenclature
• Hg0 or GEM - Gaseous Elemental Mercury
• PHg – Particulate Bound Hg (2.5 um)
• RGM - Reactive Gaseous Mercury - HgCl2?


Eric Prestbo Ph.D. ([email protected])
HEDO Mercury
0
1
2
3
4
5
84 88 92 96 100 104 108 112 116 120
Julian Day
Ele
me
nta
l Hg
(n
g/m
3)
0
10
20
30
40
50
PH
g a
nd
RG
M (
pg
/m3
)
Hg0 PHg RGM

Eric Prestbo Ph.D. ([email protected])
Measurement vs Model
Hedo Mean Hg0 = 2.04 ng/m3
Hedo Max Hg0 = 5.47 ng/m3
Seignuer et al., 2004 ES&T 38:555

Eric Prestbo Ph.D. ([email protected])
Measurement vs Model
Dastoor and Larocque., 2004 Atmos. Env. 38:147
Hedo Mean Hg0 = 2.04 ng/m3
Hedo Max Hg0 = 5.47 ng/m3

Eric Prestbo Ph.D. ([email protected])
Measurement vs ModelHedo RGM Mean = 4.51 pg/m3
Hedo RGM Max = 32.5 pg/ m3
Seignuer et al., 2004 ES&T 38:555

Eric Prestbo Ph.D. ([email protected])
Measurement vs ModelHedo PHg Mean = 3.05 pg/m3
Hedo PHg Max = 16.5 pg/ m3
Seignuer et al., 2004 ES&T 38:555

Eric Prestbo Ph.D. ([email protected])
Comparison of Model and Observation of Hg0 Seignuer et al., 2004 ES&T 38:555
Location Date Model (ng/m3)
Obs
W. Korea Spring 2001
3.72 2.13
Seoul, Korea Sept-97 May-98
3.43-3.94 2.03; 2.12
Kyushu, Japan 1996 10.8 1.70
Beijing, China Jan, Feb, Sept 98
6.2 – 24.7 2.26; 2.38
HEDO, Okinawa Spr-2004 1.7-1.9 2.04
Changchun, China
**PHg**
Jul-Jan 2000
0.02-2 (PHg) 0.06 - 2

Eric Prestbo Ph.D. ([email protected])
0
1
2
3
4
5
6
80 85 90 95 100 105 110 115 120 125
Julian Day
Hg
0 (
ng
/m3 )
and
1-u
m S
O4 (
ug
/m3 x
10)
0
100
200
300
400
500
600
CO
(p
pb
)
Hg0 CO
Beijing - China

Eric Prestbo Ph.D. ([email protected])
0
1
2
3
4
5
6
80 85 90 95 100 105 110 115 120 125
Julian Day
Hg
0 (
ng
/m3 )
and
1-u
m S
O4 (
ug
/m3 x
10)
0
100
200
300
400
500
600
CO
(p
pb
)
Hg0 CO

Eric Prestbo Ph.D. ([email protected])
0
1
2
3
4
5
6
80 85 90 95 100 105 110 115 120 125
Julian Day
Hg
0 (
ng
/m3 )
and
1-u
m S
O4 (
ug
/m3 x
10)
0
100
200
300
400
500
600
CO
(p
pb
)
Hg0 CO

Eric Prestbo Ph.D. ([email protected])
0
1
2
3
4
5
6
80 85 90 95 100 105 110 115 120 125
Julian Day
Hg
0 (
ng
/m3 )
and
1-u
m S
O4 (
ug
/m3 x
10)
0
100
200
300
400
500
600
CO
(p
pb
)
Hg0 CO

Eric Prestbo Ph.D. ([email protected])
0
1
2
3
4
5
6
80 85 90 95 100 105 110 115 120 125
Julian Day
Hg
0 (
ng
/m3 )
and
1-u
m S
O4 (
ug
/m3 x
10)
0
100
200
300
400
500
600
CO
(p
pb
)
Hg0 CO
Eric Prestbo Ph.D. ([email protected])
0
1
2
3
4
5
6
80 85 90 95 100 105 110 115 120 125
Julian Day
Hg
0 (
ng
/m3 )
and
1-u
m S
O4 (
ug
/m3 x
10)
0
100
200
300
400
500
600
CO
(p
pb
)
Hg0 CO

Eric Prestbo Ph.D. ([email protected])
0
1
2
3
4
5
6
80 85 90 95 100 105 110 115 120 125
Julian Day
Hg
0 (
ng
/m3 )
and
1-u
m S
O4 (
ug
/m3 x
10)
0
100
200
300
400
500
600
CO
(p
pb
)
Hg0 CO

Eric Prestbo Ph.D. ([email protected])
0
1
2
3
4
5
6
80 85 90 95 100 105 110 115 120 125
Julian Day
Hg
0 (
ng
/m3 )
and
1-u
m S
O4 (
ug
/m3 x
10)
0
100
200
300
400
500
600
CO
(p
pb
)
Hg0 CO
LOCAL?

Eric Prestbo Ph.D. ([email protected])
0
1
2
3
4
5
6
80 85 90 95 100 105 110 115 120 125
Julian Day
Hg
0 (
ng
/m3 )
and
1-u
m S
O4 (
ug
/m3 x
10)
0
100
200
300
400
500
600
CO
(p
pb
)
Hg0 CO

Eric Prestbo Ph.D. ([email protected])
0
1
2
3
4
5
6
80 85 90 95 100 105 110 115 120 125
Julian Day
Hg
0 (
ng
/m3 )
and
1-u
m S
O4 (
ug
/m3 x
10)
0
100
200
300
400
500
600
CO
(p
pb
)
Hg0 CO

Eric Prestbo Ph.D. ([email protected])
0
1
2
3
4
5
6
80 85 90 95 100 105 110 115 120 125
Julian Day
Hg
0 (
ng
/m3 )
and
1-u
m S
O4 (
ug
/m3 x
10)
0
100
200
300
400
500
600
CO
(p
pb
)
Hg0 CO

Eric Prestbo Ph.D. ([email protected])
0
1
2
3
4
5
6
80 85 90 95 100 105 110 115 120 125
Julian Day
Hg
0 (
ng
/m3 )
and
1-u
m S
O4 (
ug
/m3 x
10)
0
100
200
300
400
500
600
CO
(p
pb
)
Hg0 CO

Eric Prestbo Ph.D. ([email protected])
0
1
2
3
4
5
6
80 85 90 95 100 105 110 115 120 125
Julian Day
Hg
0 (
ng
/m3 )
and
1-u
m S
O4 (
ug
/m3 x
10)
0
100
200
300
400
500
600
CO
(p
pb
)
Hg0 CO

Eric Prestbo Ph.D. ([email protected])
0
1
2
3
4
5
6
80 85 90 95 100 105 110 115 120 125
Julian Day
Hg
0 (
ng
/m3 )
and
1-u
m S
O4 (
ug
/m3 x
10)
0
100
200
300
400
500
600
CO
(p
pb
)
Hg0 CO

Eric Prestbo Ph.D. ([email protected])
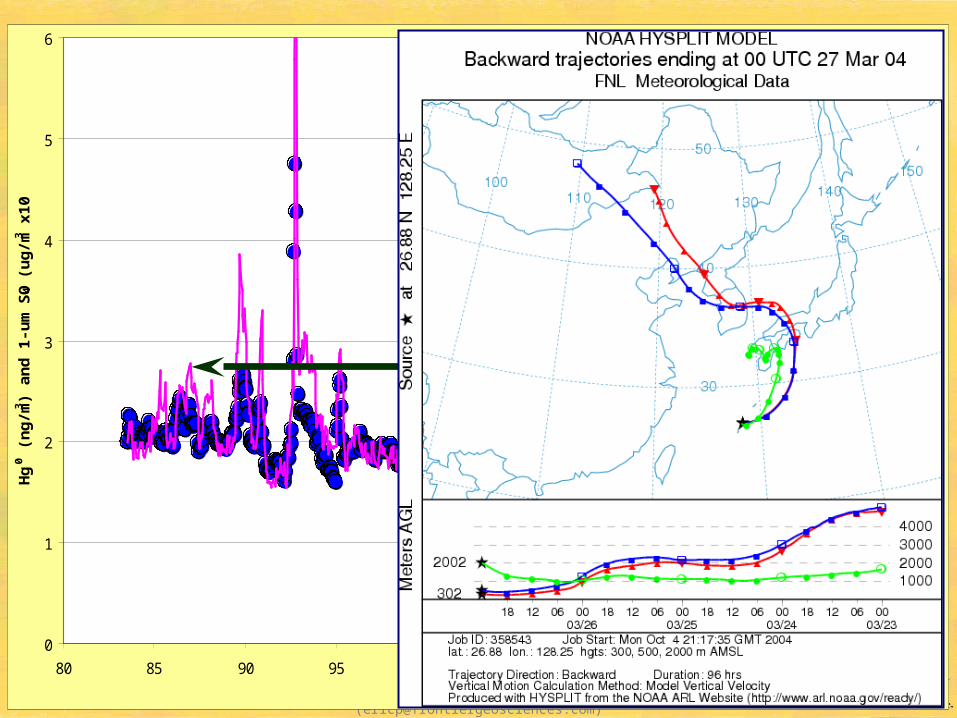
High Hg0 and CO often begins with rainfall note also SO4 washout
HEDO Hg0, CO, 1-um SO4 and Rainfall
0
1
2
3
4
5
80 85 90 95 100 105 110 115 120 125Julian Day
Hg
0 (
ng
/m3)
an
d R
ain
(m
m)
0
100
200
300
400
500
CO
(p
pb
) an
d 1
-um
SO
4
x10
(ug
/m3 )
Hg0 Rain (mm) CO 1-um SO4

Eric Prestbo Ph.D. ([email protected])
Evidence for Biomass Signal?Organic Rich – Sulfate Low
0
1
2
3
4
5
6
89 90 91 92 93 94 95Julian Day
Hg
0 (n
g/m
3 ) a
nd
1-u
m O
rg (
ug
/m3 )
0
100
200
300
400
500
600
CO
(p
pb
) a
nd
1-u
m S
O4
(u
g/m
3 x
10
)
Hg0 1-um Organic CO 1-um SO4

Eric Prestbo Ph.D. ([email protected])
Evidence for Biomass Signal?Organic Rich – Sulfate Low
0
1
2
3
4
5
6
83 84 85 86 87 88 89Julian Day
Hg
0 (n
g/m
3) a
nd
1-u
m O
rg (
ug
/m3)
0
100
200
300
400
500
600
CO
(p
pb
) an
d 1
-um
SO
4 (u
g/m
3 x1
0)
Hg0 1-um Organic CO 1-um SO4


Eric Prestbo Ph.D. ([email protected])
No clear observation of a dust event
0
1
2
3
4
5
6
80 85 90 95 100 105 110 115 120 125Julian Day
Hg
0 (n
g/m
3 )
0
100
200
300
400
500
600
CO
(p
pb
), S
cat
(m-1
x 1
06)
an
d
SO
4 (u
g/m
3 x1
0)
Hg0 CO 1-um SO4 Neph


Eric Prestbo Ph.D. ([email protected])
PHg correlates well with SO4 and CO
0
5
10
15
20
25
30
85 89 93 97 101 105 109 113 117 121
Julian Day
PH
g (
pg
/m3
) a
nd
1-u
m S
04
(u
g/m
3)
0
100
200
300
400
500
600
CO
(pp
b)
1-um SO4 PHg CO
Eric Prestbo Ph.D. ([email protected])
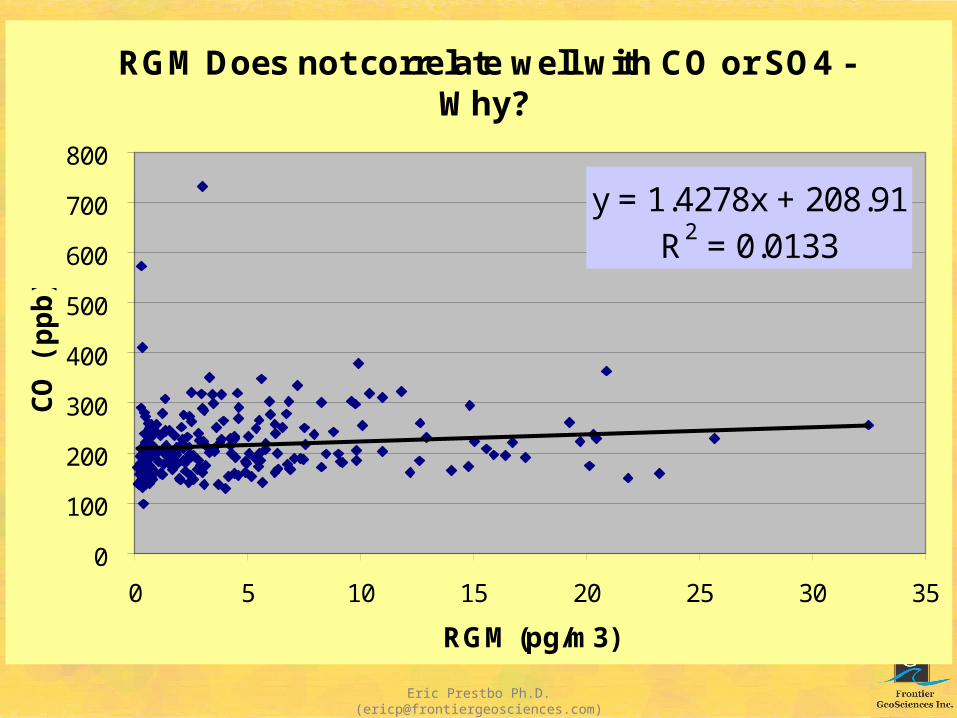
RGM Does not correlate well with CO or SO4 - Why?
y = 1.4278x + 208.91R2 = 0.0133
0
100
200
300
400
500
600
700
800
0 5 10 15 20 25 30 35
RGM (pg/m3)
CO
(p
pb
)

Eric Prestbo Ph.D. ([email protected])
Low-Level RGM and PHg Emissions results
in faster local removal by Dry Deposition?
< 50 Meter Total Hg Emissions (tons/yr)
>150 Meter Total Hg Emissions (tons/yr)
Pacyna et al.- 2003 LRT Workshop

Eric Prestbo Ph.D. ([email protected])
Why are RGM values lower than models and uncorrelated with pollution
compounds?
Hypothesis – RGM from anthropogenic emissions are preferentially reduced to Hg0 via the complex chemistry of S02 > S03 > S04 during cloud droplet formation and evaporation

Eric Prestbo Ph.D. ([email protected])
What controls [RGM] – Photochemistry?
HEDO - Hg Species Diurnal Pattern
1.6
1.8
2.0
2.2
2.4
0:00
-2:0
0
3:00
-5:0
0
6:00
-8:0
0
9:00
-11:
00
12:0
0-14
:00
15:0
0-17
:00
18:0
0-20
:00
21:0
0-23
:00
Local Time of Day (JST)
Hg
0 (n
g/m
3)
1
3
5
7
9
RG
M a
nd
PH
g (
pg
/m3)
GEM
PHg
RGM

Eric Prestbo Ph.D. ([email protected])
RGM and Solar Insolation
0
10
20
30
40
103 104 105 106 107 108 109 110 111 112 113
Julian Date
[RG
M]
(pg
/m3 )
0
1000
2000
3000
4000
So
lar
Inso
lati
on
(w
atts
/m2 )
RGMSolar Flux
0
1
2
3
4
103 104 105 106 107 108 109 110 111 112 113Julian Day
Hg
0 (
ng
/m3)
0
100
200
300
400
CO
(p
pb
)
Hg0 CO
Hg0

Eric Prestbo Ph.D. ([email protected])
Future Data Interpretation
• More refined analysis of each event with respect to AMS and meteorology
• Support hypothesis that SO3 is preferentially converting emitted Hg(II) to Hg0 during cloud water processing (formation/evaporation)
• Rule out local impacts

Eric Prestbo Ph.D. ([email protected])
Future: Need Hg Deposition Data!
• Inventories coupled to models predict high deposition in NW Pacific due to RGM and PHg emissions
• Measurements needed to confirm at HEDO and elsewhere
• Should be event based – at least for intensive study periods
• What Hg deposition data is currently being collected or published?

Eric Prestbo Ph.D. ([email protected])
Continuous Mercury Speciation at HEDO
• Depending on support-level we can do complete Automated Hg speciation system – or only total gaseous Hg with select intensive studies