eric cummings - core
TRANSCRIPT

Techniques of single-shot thermometry
by degenerate four-wave mixing
Eric Cummings

Techniques of single-shot thermometry
by degenerate four-wave mixing
Eric Cummings
Graduate Aeronautical Laboratories
California Institute of Tecllnology
Techniques of Single-Shot Thermometry
by Degenerate Four-Wave Mixing
1. Introduction
Proper evaluation of highenthalpy and chemically reacting flows often requires unconventional diagnostics.
Temperatures in reentry flows may exceed 10000 K within a few mean-free-paths of a shock front. This temperature
rapidly drops as gas molecules dissociate into nonequilibrium species and radicals (Vincenti and Kruger, 1965). Even
in flows without such harsh conditions, conventional thermometry and mass spectrometry measurements may have
insufficient time and space resolution. Furthermore, these probes are intrusive, affecting the local flow field and
chemical composition, e.g.,through catalysis.
These problems have led to the application of laser spectroscopy and nonlinear optical techniques for the noninva-
sive probing of reacting fluid flows. Two of these techniques in particular have reached a fair level of maturity: coherent
anti-Stokes Raman scattering (CARS) and laser-induced fluorescence spectroscopy (LIFS) (Eckbreth, 1988). CARS
is a coherent optical technique which allows accurate point measurements of species concentration and temperature.
Its use is limited by signal-to-noise to probing majority species. LIFS, on the other hand, is an incoherent technique
which is much more sensitive than CARS and allows planar measurements, but is much less amenable to quantitative
analysis.
Degenerate four-wave mixing (DFWM) is a coherent nonlinear optical technique that has only recently been
applied to flows of gasdynamic interest. This technique offers the promise of the quantitative accuracy of CARS
(Dreier, 1990), the sensitivity of LIFS, and the capability for excellent flow-imaging (Rakestraw, 1990; Ewart, 1989).
It can be applied in various ways to provide spatially resolved measurements of species concentration, vibrational
populations, rotational populations (and thereby temperature), molecular diffusion rates, and other transport properties
of a flowing inert or chemically reacting fluid (Fourkas, 1991).
DFWM and CARS may be applied for thermometry in narrowband laser scanning experiments by measuring
the ground-state rotational population distribution of a probed species to a Boltzmann distribution (Bervas, 1992). In
CARS, rotational spectra are "washed out" at very high temperatures by Doppler broadening, complicating thermom-
etry. Narrowband DFWM spectra are "Doppler-free" (Dreier, 1990), allowing laser-scanning thermometry of high
temperature gases encountered, for example, in reentry-type flows.
DFWM has several advantages over LIFS. The DFWM signal is coherent (laser-like) allowing efficient signal
collection with very high f-number optics. This feature is especially important in flows where optical access is limited
or where luminosity is high. In addition, DFWM is not inherently susceptible to quenching (Dreier. 1990), unlike
LIFS, allowing the use of DFWM in many cases where LIFS cannot be used or cannot be quantitatively interpreted
because of quenching.

Degenerate four-wave mixing has the advantage of relative experimental simplicity. Unlike CARS, DFWM has
trivial phase-matching requirements. It also requires only one laser and can be applied to atomic species. On the other
hand, the interpretation of CARS signals is simpler and much more developed than that of DFWM. In some cases
the choice of DFWM over CARS is a trade-off between experimental and computational difficulty. Because the cost
of computing power is decreasing while the cost of lasers is relatively constant, this trade-off will continue to shift
towards DFWM.
This paper provides an overview of two "single-shot" resonant degenerate four-wave mixing thermometry tech-
niques suitable for making measurements in unsteady flows or in pulsed facilities such as the T5 free piston shock
tunnel. The first technique involves measuring rotational population distributions and fitting them to .Boltzmann
distributions to obtain rotational temperatures, and has been the conventional technique used in CARS, LIFS, and now
DFWM. Single-shot thermometry by this technique requires a broad bandwidth laser to probe a number of rotational
lines simultaneously (Ewart, 1990; Yip, 1992). This requirement complicates both the experimental apparatus and
signal interpretation. The second technique involves time resolution of the DFWM signal. Using this novel technique,
local sound speeds and transport coefficients can be inferred. The physics of this technique are discussed along with a
derivation of an analytical expression for the signal generated by this technique and its experimental advantages and
challenges. Other thermometry techniques, such as measuring translational temperatures via DFWM lineshapes, etc.,
are not included in this paper.
The physical processes underlying resonant DFWM in gases are first discussed generically in order to provide
insight into this phenomenon. The two techniques of thermomeay are then detailed in light of these processes. Com-
plications and experimental considerations are presented. An expression for the time-resolved DFWM thermometry
signal is derived. A brief history of the analytical use of DFWM is outlined, concluding with suggestions for future
directions of research.
2. The Physics of Resbnant DFWM in Gases
Degenerate four-wave mixing is a third-order nonlinear optical phenomenon in which three imposed light fields
interact or "mix" in a medium to generatea fourth (signal) wave (Fisher, 1983). The interaction is called "degenerate"
because all of the waves have the same frequency.
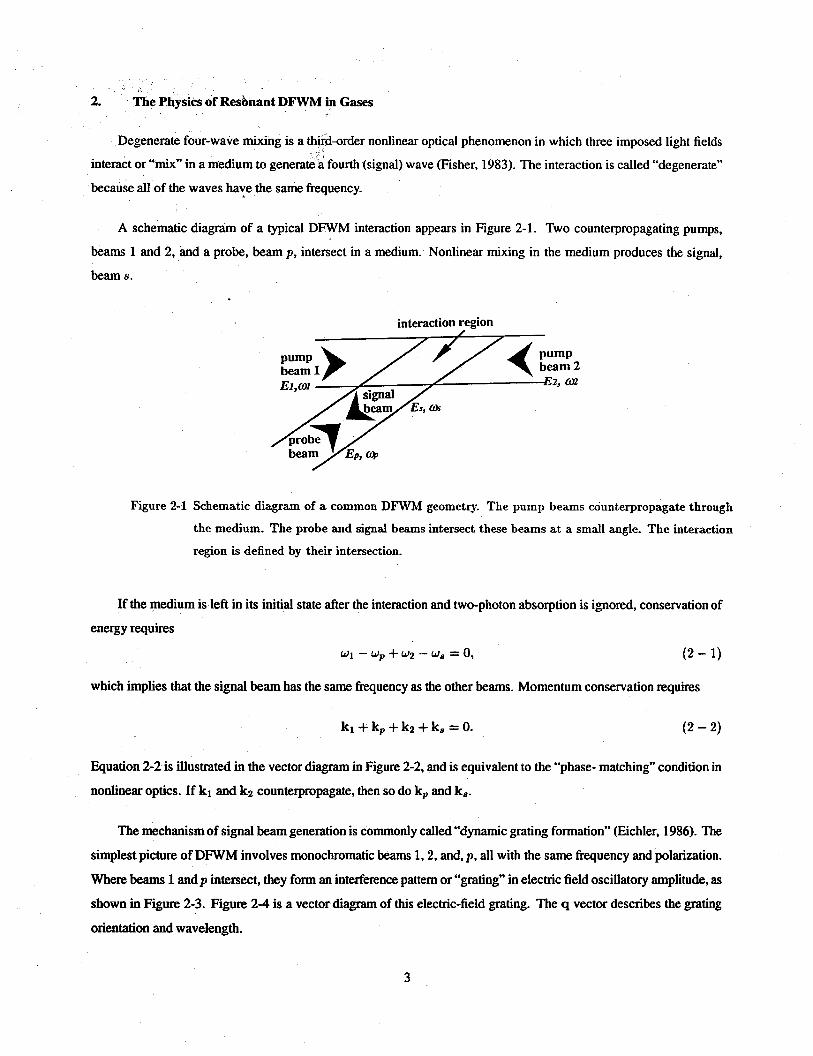
A schematic diagram of a typical &WM interaction appears in Figure 2-1. Two counterpropagating pumps,
beams 1 and 2, and a probe, beam p, intersect in a medium. Nonlinear mixing in the medium produces the signal,
beam s.
interaction region
beam 2 EZ, 62
Figure 2-1 Schematic diagram of a common DFWM geometry. The pump beams counterpropagate through
the medium. The probe and signal beams intersect these beams at a small angle. The interaction
region is defined by their intersection.
If the medium is left in its initial state after the interaction and two-photon absorption is ignored, conservation of
energy requires
W l - y + w2 - Ws = 0, (2 - 1)
which implies that the signal beam has the same frequency as the other beams. Momentum conservation requires
Equation 2-2 is illustrated in the vector diagram in Figure 2-2, and is equivalent to the "phase- matching" condition in
nonlinear optics. If kl and k2 counterpropagate, then so do kp and k,.
The mechanism of signal beam generation is commonly called "dynamic grating formation" (Eichler, 1986). The
simplest picture of DFWM involves monochromatic beams 1,2, and, p, all with the same frequency and polarization.
Where beams 1 andp intersect, they fonn an interference pattern or "grating" in electtic field oscillatory amplitude, as
shown in Figure 2-3. Figure 2-4 is a vector diagram of this electric-field grating. The q vector describes the grating
orientation and wavelength.

Figure 2-2 Vector diagram of momentum conservation or phase-matching for DFWM with the geometry shown
in Figure 1.
Forward Grating -- 7 pump beam2
generated by scattering of
beam pump beam 2 off forward grating
Backward Grating
pump beam 1 A
signal generated by scattering of // beam
pump beam 1 off backward grating
Figure 2-3 Schematic diagram of the formation of the forward and backward electric-field gratings via inter-
ference between the first pump and probe and the second pump and probe, respectively. The signal
beam is formed by scattering off these gratings.
Forward Grating Vector Diagram
Backward Grating Vector Diagram
Figure 2-4 Vector diagram of the interference patterns or electric-field gratings produced by the intersection
of the pump beams and the probe beam.

* For DFWM in a gas, the electric field from the superimposed beams interacts strongly with the medium only if
its frequency is near or on that of a transition, making the interaction spectroscopically selective. Near resonance,
the spatial electric-fieldgraling creates an excited-state population grating. This grating causes an index-of-refraction
grating usually via saturable absorption or dispersion (Ewart, 1990). Light from pump 2 is then diffracted by this grating
into the signal beam that propigates counter to the probe beam. This can be viewed equivalently as a consequence of
conservation of momentum or as diffraction from a thick grating satisfying the Bragg condition (Eichler, 1986):
therefore,
Saturable absorption and dispersion are also spectroscopically selective. This means that only light near or on
the transition frequency is diffracted efficiently by the grating created by the transition. Several gratings may be
superimposed by simultaneously pumping and probing the medium with light at frequencies of different transitions.
Light at each frequency will "see" only its respective grating. Thus gratings may be "multiplexed," or superimposed
in space without interaction or crosstalk between gratings. This is the reason that single-shot rotational temperature
measurements are possible using DFWM.
Electric field amplitude gratings are formed by the intersecting laser beams if they have the same polarization.
Gratings of a different nature are formed if the imposed beams have different polarizations. If a pump beam and the
probe beam are cross-polarized then a "polarization grating" is formed in which the polarization alternately changes
from linear to right-circular to linear (cross) to left circular to linear polarization. This leads to reorientation gratings
in the medium and similarly results in an index-of-refraction grating (Dreier, 1990; Fourkas, 1991).
A treatment of DFWM using nonlinear Maxwell's equations shows that
where "*" denotes complex conjugation. This relation and the property k, = -kp indicate that the signal beam is
proportional to the time reversal or "phase conjugate" of the probe beam. That is, the signal will exactly retrace the
path of the probe beam, effectively correcting for any distortions of the beam caused by imperfect optical elements
or turbulence encountered along the optical path. Thus DFWM has superb remote-imaging capabilities (Rakestraw,
1990).
The grating produced by beams 1 and p is usually called the "forward grating." Similarly a "backward grating"
is formed by the intersection of beams 2 andp (Figure 2-3). Diffraction of light from pump 1 by the backward grating
likewise contributes to the signal beam.
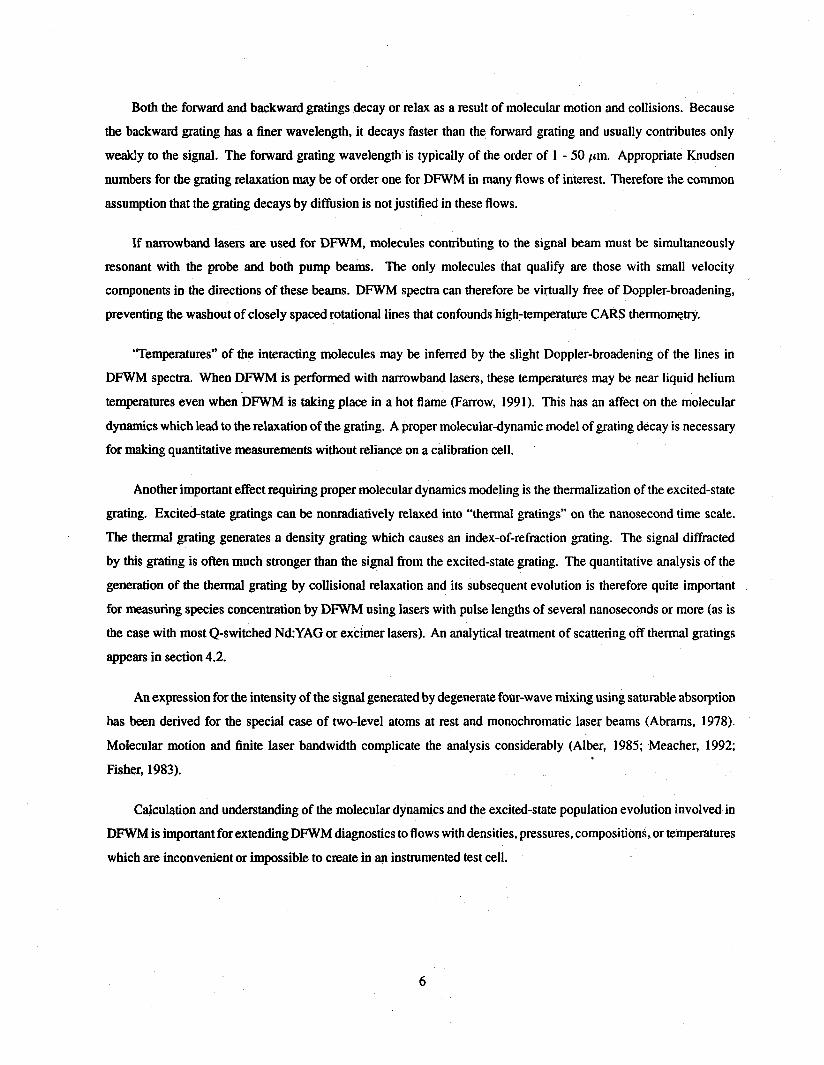
Both the forward and backward gratings decay or relax as a result of molecular motion and collisions. Because
the backward grating has a finer wavelength, it decays faster than the forward grating and usually contributes only
weakly to the signal. The forward grating wavelength is typically of the order of 1 - 50 pm. Appropriate Knudsen
numbers for the grating relaxation may be of order one for DFWM in many flows of interest. Therefore the common
assumption that the grating decays by diffusion is not justified in these flows.
If narrowband lasers are used for DFWM, molecules contributing to the signal beam must be simultaneously
resonant with the probe and both pump beams. The only molecules that qualify are those with small velocity
components in the directions of these beams. DFWM spectra can therefore be virtually free of Doppler-broadening,
preventing the washout of closely spaced rotational lines that confounds high-temperature CARS thermometry.
"Temperatures" of the interacting molecules may be inferred by the slight Doppler-broadening of the lines in
DFWM spectra. When DFWM is performed with narrowband lasers, these temperatures may be near liquid helium
temperatures even when DFWM is taking place in a hot flame (Farrow, 1991). This has an affect on the molecular
dynamics which lead to the relaxation of the grating. A proper moleculardynamic model of grating decay is necessary
for making quantitative measurements without reliance on a calibration cell.
Another important effect requiring proper molecular dynamics modeling is the thermalization of the excited-state
grating. Excited-state gratings can be nonradiatively relaxed into "thermal gratings" on the nanosecond time scale.
The thermal grating generates a density grating which causes an index-of-refraction grating. The signal diffracted
by this grating is often much stronger than the signal from the excited-state grating. The quantitative analysis of the
generation of the thermal grating by collisional relaxation and its subsequent evolution is therefore quite important
for measuring species concentration by DFWM using lasers with pulse lengths of several nanoseconds or more (as is
the case with most Q-switched Nd:YAG or excimer lasers). An analytical treatment of scattering off thermal gratings
appears in section 4.2.
An expression for the intensity of the signal generated by degenerate four-wave mixing using saturable abso~ption
has been derived for the special case of two-level atoms at rest and monochromatic laser beams (Abrams, 1978).
Molecular motion and finite laser bandwidth complicate the analysis considerably (Alber, 1985; Meacher, 1992;
Fisher, 1983).
Calculation and understanding of the molecular dynamics and the excited-state population evolution involved in
DFWM is important for extending DFWM diagnostics to flows with densities, pressures, compositions, or temperatures
which are inconvenient or impossible to create in an instrumented test cell.

" 2 3. Multiplex DFWM Rotational Temperature Measurements
Two remarkably different and, in some respects, complementary techniques for single-shot DFWM thermometry
are presented in this and the following section. The technique of multiplex DFWM thermometry is presented in
this section, including a brief discussion of the physics and some of its advantages, considerations, and pitfalls. The
technique of multiplex DFWM, currently under development in several laboratories, is a conventional spectroscopic
method of thermometry applied using DFWM. The technique discussed in the next section is unconventional and
undeveloped but could vastly simplify DFWM thermometry both in experiment and analysis.
Thermometry by muitiplex DFWM applies principally to diatomic gas molecules and radicals. These molecules
have both translational and rotational degrees of freedom into which energy can be distributed (as well as vibrational
and electronic degrees of freedom which are not of interest in this discussion.) Thermodynamic temperatures relate to
the Maxwellian distribution of translational speeds of molecules. However, the distribution of (quantized) rotational
levels of a diatomic gas lags that of the translational energy distribution typically by only nanoseconds in atmospheric
pressure flows (Vincenti and Kruger, 1965). Therefore in almost all cases the rotational temperature provides an
excellent measure of the thermodynamic temperature.
At room and combustion temperatures, significant numbers of rotational levels are populated. By measuring the
populations of several levels of different (known) quantum number J , the rotational temperature can be calculated
from the relation (Eckbreth, 1988)
where
and
and where:
N N j = -g1(2J + l ) e x p [ - B J ( J + l )hc / l ;T] ,
Qrot
h: Planck's constant,
C: speed of light,
B: rotational constant of molecule,
I: moment of inertia of molecule,
k: Boltzmann's constant,
T: temperature,
gI (J) : degeneracy factor,
N: number of species molecules, and
Nj: number of species molecules in rotational state J .

This relation is simply a fit of rotational populations to a Boltzmann distribution with appropriate regard for
degeneracy of states. For kT/hcB >> 1,
Q r o t LTlhcB,
allowing simple inversion of the distribution to obtain temperature.
This population-distribution measurement is the conventional technique for thermometry by spectroscopic tech-
niques including absorption, CARS, LIFS, and DFWM. Usually, population measurements are taken by scanning a
narrow bandwidth laser across a rotational band of a molecule of interest. A signal spectrum is recorded which is then
related to rotational populations. Laser scanning is a time consuming process that is not usually capable of taking
measurements in unsteady flows or in pulsed facilities. One counterexample is a fast scanning CW dye laser developed
by Chang et al. (1991). This dye laser can be scanned in frequency at a 4 kHz rate, fast enough to resolve fluctuations
in some unsteady flows. However there exist a wide class of flows which require a single-shot technique to measure
temperature.
Single-shot measurements may be achieved with "multiplex" DFWM, in which a laser with a bandwidth broad
enough to span transitions from several rotational levels is used for DFWM (Ewart, 1990). As described earlier,
this broadband excitation will create excited state population gratings for each included transition. These population
gratings lead to index of refraction gratings which are spectroscopically selective. The spectrum of light scattered by
a grating caused by saturable absorption/dispersion with no Doppler broadening has the Lorentzian form
C'; (Siegman, 1986)
i
where Ci is a constant, wi is the frequency of the i-th saturated transition (typically loi5 Hz), and ri is the inverse
lifetime of that excited state (typically 101° Hz). Thus any nonresonant part of the broad bandwidth laser beam is
strongly suppressed. Some Doppler line broadening occurs because of the finite laser bandwidth. The effect of using
broad-bandwidth lasers on the DFWM signal line shape and amplitude has been explored by Ewart et al. (1990). This
line-broadening is usually not so severe that rotational levels are "washed out."
Experimentally, the broad-bandwidth laser is usually a dye laser without any higbly dispersive elements. A
modeless (ASE) laser is used by Ewart er aL(1990) to create a laser beam without mode structure in the spectrum.
Frequency conversion,e.g., second harmonic generation and sum frequency mixing, is complicated for broad bandwidth
beams but necessary to access electronic transitions in most diatomic gases. Angular dispersion of the beam is often
needed to optimize phase-matching and thereby frequency conversion efficiency.
A serious problem with multiplex DFWM as it is usually implemented is that excited-state thermalization times
and laser pulse durations (1 - 10 nsec) are often comparable at atmospheric pressure. At least part of the signal that is
measured comes from thermal gratings. The absolute intensity of signals from thermal gratings is difficult to quantify,

as will be shown in section 42. In addition; thermal gratings are not spectroscopically selective. In a multiplex
experiment, nonresonant light can be diffracted off thermalized gratings. The efficiency of this nonresonant diffraction
can be limited weakly by phasematching requirements for a finite volume grating. The phenomenon of resonant
enhancement of the index of refraction near a transition can also enhance the spectrum. However, for closely spaced
transitions, e.g., rotational line& and for minority species, these effects are not generally enough to preserve the spectra.
Thus multiplex rotational temperature measurements should be taken on a time scale less than the thermalization time.
The use of sub-nanosecondduration pulses from an amplified, passively mode-locked dye laser could ensure that
signals are not scattering off thermal gratings. However, these lasers tend to be expensive and low in output power,
limiting signal strength and measurement field size.
Normal laser-pumped pulsed dye lasers have pulse envelopes dictated by the pump laser duration. Reducing
the pulse duration of a Nd:YAG laser, a common dye-laser pump laser, from several nanoseconds to less than one
nanosecond requires complicated laser modifications such as modelocking and/or cavity dumping. Because light
travels about one optical foot per nanosecond, the pump-laser cavity optical length must be less than six inches for
cavity dumping alone to be successful in shortening the laser pulse adequately. In this case, thermal effects limit the
energy that can be supplied per pulse. Alternatively, a longer cavity can be used in connection with modelocking.
Again, this limits the energy per pulse and adds considerable expense to the laser.
Care must be taken to ensure that the pump and probe beams arrive in the medium at nearly the same time. Any
time delay increases the likelihood of a thermal grating contribution to the signal.
The availability of picosecond- and femtosecondduration dye and Ti:Sapphire lasers suggests using ultrashort
pulses for DFWM to solve both the problem of eliminating thermal grating contributions and broadening the laser
bandwidth (via Fourier-transform limit.) Unfortunately, this only raises new problems for the quantitative measurement
of temperature.
Using ultrashort lasers for DFWM leads to interesting phenomena. If the bandwidth of the shortened pulse is
broadened to include several transitions by the Fourier-transform relation between pulse duration and bandwidth, then
the transitions will be excited coherently, a requirement for "quantum beating" effects to occur. Quantum beating is a
phenomenon in which the populations of coherently prepared excited states evolve in an oscillatory manner in time.
For example, if two states are excited coherently, the population of the excited states may oscillate from one state
to the other. At one time, a measurement would detect all of the population in one state; at a later time, the same
measurement would detect all of the population in the other state.
While quantum beating effects are interesting and can provide a window into molecular physics, quantum beats
could lead to large uncertainties in measurements. For instance, oscillating population gratings would cause an
unwanted modulation of the DFWM signal. Measurements taken with different time delays between beams would

yield different results. For this reason, it is important for pulse durations to be much longer than the inverse of the
frequency differences between rotational levels. This typically constrains the pulses to be longer than 50 psec.
Actually, quantum beats can be eliminated only if the bandwidth of the laser is broadened entirely by stochastic
phase fluctuations (impossible for finite duration laser pulses.) They are less significant if the exciting laser pulse is as
long as suggested above. However, it may be necessary to evaluate the effect of quantum beats. The evolution of the
excited state populations may be treated computationally using the formalism of quantum density operator mechanics,
a computational tool for treating the behavior of ensembles of particles commonly used in the field of quantum optics.
Through density operator mechanics, nonlinear, coupled differential equations are derived for the populations of the
various molecular levels involved in the interaction. In general these must be solved numerically.
Finally, additional experimental difficulties are associated with multiplex DFWM. Much of the energy of a
broadband laser in DFWM falls between transitions and contributes to the DFWM signal only as an unwanted
nonresonant background (caused for instance by scattering from thermal gratings or imperfect optical elements). The
efficiency is dramatically reduced from that of narrowband DFWM. It is also difficult to provide enough energy over
a narrow absorption line to saturate the transition, a procedure recommended by Lucht er al. (1992) to minimize the
sensitivity of the DFWM signal to quenching, pressure, and laser intensity. Multiplex DFWM furthermore requires
the simultaneous and quantitative recording of the laser and signal spectra. Very good spectral resolution is required to
record closely spaced rotational lines without undue instrument function contributions. Mode structure in the broadband
laser can also significantly detract from the accuracy of multiplex temperature measurements (Ewart, 1990).

h 4. Time-Resolved DFWM from Thermal Gratings
Time-resolved DFWM thermometry is radically different from the multiplex technique described in section 3,
This technique exploits &id grating thermalization, an effect which hampers multiplex DFWM. This new technique
is first described conceptually. Then an analytical expression for the signal that is derived. This expression is valid
or readily extendable to the general case of DFWM off thermal gratings. Finally, experimental considerations are
outlined.
4.1 The principle of thermometry by time-resolved DFWM from thermal gratings
In this technique, a moderately short-pulse laser (e.g., 1 - 10 nsec duration from a Q-switched Nd:YAG- or
excimer- pumped dye laser) is used for the probe and first pump beams. The second pump beam comes from a
long-pulse laser (e.g., 1 psec, from a flashlamp-pumped dye laser.)
The probe and first pump beam are separated by a small angle (e.g., 1 - 20 degrees), providing a grating spacing
which is large compared to the mean-free molecular path in the medium (e.g.,l - 50 pm). The forward excited-state
population grating is formed by the short laser pulse. This grating thermalizes rapidly compared to the rate of energy
transport by diffusion or wave action, (e.g.,l - 10 nsec).
The rapid grating thermalization causes a periodic thermal perturbation to form before collisions and molecular
motion can produce a corresponding density grating, creating a periodic pressure perturbation. In a one-dimensional
approximation, this perturbation decomposes into two oppositely traveling pressure and density waves, as in the
D'Alembert solution to the onedimensional wave equation (c.f. Brillouin modes in scattering theory) and a stationary
isobaric thermal grating (c.f. the Rayleigh mode in scattering). These stationary and traveling waves alternately
interfere constructively and destructively, leading to a temporal modulation of the index-of-refraction grating strength.
The long duration second pump beam scatters off the superposition of these modulated gratings to form the modulated
signal beam, which may be recorded using a photo-multiplier tube or fast photodiode (e.g.. 1 GHz frequency response.)
Thg time-resolved measurement of the DFWM "reflectivity," or the instantaneous ratio of the signal beam
intensity to the second pump beam intensity, provides the local speed of sound and information about transport
quantities including the thermal diffusivity and the acoustic damping coefficient. A derivation of the time-resolved
DFWM reflectivity using thermal gratings as the nonlinearity is included in the following section.
4.2 Derivation of the signal intensity for time-resolved DFWM off thermal gratings
A formula for the signal strength of time-resolved DFWM off thermal gratings is derived in this section. The
equations that are derived are valid for a special case of the broader class of four-wave mixing phenomena and can

easily be extended to general four-wave mixing using laser-induced hydrodynamic modes (c.f. stimulated Brillouin
scattering) as the nonlinearity.
For this technique, the terms pump and probe do not provide particularly good insight into the physics of the
laser-induced interaction. Rather, the first pump beam and the probe beam are more clearly called the first and second
driver beams, because they are used to generate a thermal grating which drives hydrodynamic modes. The second
pump beam is more clearly called the source beam because it serves as the source of the light which is scattered by the
gratings to provide the signal beam.
The analysis begins with an expression for the electric field in the far-field approximation scattered from a source
beam by an arbitrary dielectric disturbance. This disturbance is constitutively related to a density disturbance, thereby
providing an expression for scattering off density gratings. The analysis proceeds with the derivation of the response
of a fluid to laser-induced heating. It will be shown that laser heating excites several hydrodynamic modes, including
a stationary isobaric density mode (thermon) and two traveling modes (phonons). Laser temporal profile effects are
convolved with the hydrodynamic response to obtain the opto-hydrodynamic response function. The spatial intensity
distribution of the driver beams dictates the spatial distribution of the laser-induced hydrodynamic modes and the
amplitude of the scattered signal. This distribution is calculated for the case of Gaussian driver beams. Finally, the
DFWM "reffectivity" or the ratio of the detected signal power to the source power is derived by combining the previous
elements of the analysis. The temporal envelope of the signal is discussed and limiting case behavior is examined.
Finally the absolute magnitude of the DFWM signal is discussed.
4.2.1 Expression for scattering ofian arbitrary dielectric disturbance
Light in a medium is scattered by variations or disturbances in the susceptibility or dielectric constant of the
medium. In the classical view, light passing through a medium causes the electronic clouds of the molecules of
the medium to oscillate in the d ic t ion of the electric field. These oscillating electronic clouds reemit light like an
array of dipole antennas, each dipole independently having no directivity. if the medium is "ordered" or "regular,"
symmetry requires that light emitted by the array of oscillating dipoles adds up in phase only in the direction of light
transmission. Perfect phase-cancellation occurs in all other directions so no light is scattered. If there are disturbances
in the dielectric constant, however, the symmetry is broken. Phase-cancellation is not perfect and scattered light is
generated. For example, Einstein (1910) showed that Rayleigh scattering was caused by light scattering off dielectric
disturbances caused by random microscopic thermaldensity fluctuations. Brillouin scattering is caused by scattering
off randomly generated microscopic acoustic waves.
Landau and Liftshitz (1960) derived an expression for scattering off an arbitrary dielectric disturbance. In the far
field approximation, at a point R from the disturbance, the electric field scattered from a monochromatic plane wave

by a small disturbance in thkdielectric constant at the origin with the scattering geometry shown in Figure 4-1 is given
where q is the change in wave vector from the source (plane wave) to the scattered beam, shown in Figure 4-1, and
cdet is the permittivity of the medium in which the detector is located. The scattering direction and strength is dictated
by the spatial Fourier transform of the dielectric disturbance:
where S E ( P , t ) is the perturbation of the permittivity (dielectric constant). Because
f = c o ( l + x ) ,
where X, so defined, is the susceptibility of the medium, the relative dielectric perturbation is
Wq, t ) bx(q7 t ) -=- fdet 1 + Xdei'
where Sx(q, t ) is the spatial Fourier transform of the amplitude of the modulation of the susceptibility in the interaction
region. In air at atmospheric pressure, xdet is much smaller than unity and can be ignored. Thus
6e(q't) 2 6 x ( q , t ) . edet
scattered light
ko
dielectric disturbance at origin
from source -
Figure 4-1 Scattering geometry for equation 4-1.

4.2.2 Constitutive relation beween density and susceptibility
The susceptibility in the interaction region, X , can be considered to be the sum of two parts, a nonresonant part,
Xnrr which has very weak frequency dependence, and a resonant part, x,, which contributes only if the source laser is I
tuned near a transition. The nonresonant part is a result of the sum of the contributions of all of the tails of transitions
far from the laser wavelength.
where p is the density of the fluid, po is a standard density, i.e., atmospheric, and h' is the Gladstone-Dale coefficient,
which ranges for air from 0.000290 to 0.000298 across the visible spectrum (Wood, 1956), increasing for shorter
wavelengths as electronic transitions in the UV are approached.
The resonant part of the susceptibility is somewhat more complicated to evaluate. If target molecules did
not move or lost their excited-sote energy infinitely slowly, then only light at precisely the transition wavelength
would be affected (either absorbed or retarded) by the target molecules. The absorption line-shape would be a delta
function. Because real molecules lose their excited-state energy at a finite rate by spontaneous radiation or nonradiative
means, these transitions are broadened "homogeneously," i.e., as a result of the Fourier-transform relationship between
frequency and time. Homogeneously broadened transitions have Lorentzian line-shapes. Because molecules at finite
temperatures are in motion. radiation absorbed or emitted by them is Doppler-shifted, causing molecular transitions to
appear broadened to a fixed observer. "Inhomogeneous-" (Doppler-) broadening causes a Gaussian line-shape when it
is the principal line-broadening mechanism because of the Gaussian distribution of molecular velocities.
In general, both of these broadening mechanisms occur, leading to a line-shape which is neither Lorentzian nor
Gaussian but a convolution of the two shapes. The resonant susceptibility, x,, in the general case is
where ANro is the number density of the population difference between the ground and excited state of the resonant
transition at po, a standard density; c is the local speed of light; yrad is the radiative decay rate of the resonant transition;
wr is the frequency of the resonant transition; AwH is the homogeneous bandwidth of the' transition; and AWD is the
inhomogeneous (Doppler) bandwidth,
AwD = / B W W r l m c2
where k is Boltzmann's constant and m is the mean molecular mass.
There is no simple analytical form for this integral except in the homogeneously broqdened limit:

.r The total susceptibility is the sum of these components:
P X = Xr + Xnr = - ( ~ r o + x n r o ) ?
Po
where the subscript 0 implies the value of the quantity at a standard condition. The susceptibility perturbation is
assumed to depend linearly on density for p 1! po:
The quantities x r o and A,,+ depend upon gas composition and are assumed to be constant over the interaction region.
Thus the constitutive relation between density and susceptibility is obtained.
4.2.3 Derivation of the hydrodynamic response of aJluid to thernlalization of excited state energy
In this section an expression is derived for the generation and evolution of density fluctuations in a fluid driven
by an internal thermal energy source. The thermal energy source is the thermalization of excited-state energy from the
absorption of the driver laser beams. Scattering of light from the source beam off these density disturbances creates
the signal beam. The expression for the thermal source term is derived empirically, assuming excited state energy is
thennalized at a particular rate and otherwise lost, e.g., by radiation, at another particular rate.
The expression for the full three-dimensional, unsteady evolution of the density disturbances is "exact" in
the "near-continuum" limit, that is, for small fluctuation Knudsen numbers (i.e,, > 0.1). In time-resolved DFWM
thermometry, the appropriate Knudsen number is the ratio of the molecular mean-free-path in the fluid to the grating
wavelength. If the small Knudsen number condition is not met, the evolution of the disturbances must be treated using
the kinetic theory of gases and the validity of the definitions of macroscopic properties such as the speed of sound,
diffusivities, and susceptibility must be called into question.
The spatial Fourier transform of the density grating, d p ( q , t ) , may be derived using the equations of linear
I hydrodynamics provided that the density perturbation is weak and the Knudsen number of the grating is small.
The natural dependent variables for this application of the hydrodynamic equations are pl = d p , the mass density
perturbation, and TI, the temperature perturbation. Following the treatment by Bern (1976), a set of three simultaneous
linear partial differential equations is formed from continuity, conservation of momentum, and conservation of energy.

where
q1 = v - u l ,
and y is the ratio of specific heats of the medium ( cp /cu) , a is the thermal expansion coefficieot (-$ (3) ), c. is P
the isentropic sound speed (($) ), Dv is the longitudinal kinematic viscosity ($ ($ . + $ n s ) ) . DT is th; thermal 8
diffusivity, and ~d is the "driven" thermal energy source term. The boundary and initial conditions are
pl ( r , t ) + 0; $1 ( r , t ) + 0 1 , ) + 0, as Irl -+ m.
Taking Laplace and Fourier transforms of this set of equations provides a set of three simultaneous algebraic equations.
Expressed in matrix notation, these are
Equation 4-12 can be solved using standard matrix techniques (Bern, 1976). The solution for the density perturbation
is
For a perfect gas this equation becomes
where R is the gas constant of the medium. Perfect gas behavior is assumed for the remainder of this analysis for ease
in interpretation of results.
The quantity M(q, s ) is the characteristic equation of the 3x3 matrix on the left side of equation 4-12:
The thermal source term, &(q, s ) , describes how the driver beams heat the medium through absorption and
subsequent thermalization. This term is difficult to express satisfactorily, since the actual mechanisms of energy
transfer from an excited state to a ground state may be arbitrarily complicated. An analpgy for this process might be
16

E water cascading down an irregular rock. The flow rate of water through a hole at the base of the rock may be very
complicated to evaluate a priori. As a first estimate, the flow rate could be assumed to be proportional to the amount
of water at the top the rock. This is the approach adopted in this analysis:
where Td(r, t), the rate of thermal energy addition per unit volume, is analogous to the water flow rate through the
hole at the base of the rock; Ue,, the excited-state energy density, is analogous to the amount of water at the top of the
rock; and -yth, the rate of conversion of excited-state energy to thermal energy, is the proportionality constant.
An expression for Uez 'is needed. Classically, molecules behave as "square-law detectors" of light. The amount
of optical energy at a particular wavelength absorbed by molecules is proportional to the square of the sum of incident
electric fields, often called the electric field intensity. Defining I ( r ) to be the normalized spatial intensity distribution
of the driver-beam interference pattem and P ( t ) to be the normalized time profile of the driver-beam interference
pattem, auez -
at + %hue, + 7nthUez - Dsv2Uez = 2ad{EdP(t)I(r)) , (4 - 17)
where y,th is the rate of loss of excited state energy by mechanisms other than thermalization, e.g., radiation, analogous
to the rate at which water misses the hole at the rock base in the earlier analogy. Ed is the total energy of the driver
beams during a pulse. Transport of excited state energy is assumed to be purely diffusive with diffusivity D,. A proper
accounting of the effect on excited-state energy of transport by organized molecular motion requires the addition of
a convection term in equation 4-17. This equation must then be solved simultaneously with equations 4-9.4-10, and
4-1 1. This complication is ignored in this analysis but may be important in cases where thermalization times are
relatively long.
Taking the Laplace and Fourier transforms of equations 4-16 and 4-17 gives
where P(s) is the Laplace transform of P ( t ) and I (q ) is the Fourier transform of I(r).
The parameter a d is the absorption coefficient of the medium for light at the driver wavelength, with units of
inverse length. For linear absorption, W
ad = - - I m { ~ ( u d ) ) , ( 4 - 19) C

where x(wd) is generally given by equation 4-5. In the homogeneous and inhomogeneous limits respectively,
Relaxing the assumption that absorption is linear is relatively straightforward, but doing so complicates the resulting
expressions and analysis.
The solution for the relative density perturbation evolution, obtained by combining equations 4-14 and equation
where 17 = ~ t h / ( Y t h + Ynth + Dq2) is the efficiency with which the absorbeddriver energy is converted to a thermal
energy grating.
A partial fractions decomposition of equation 4-22 in s provides insight into the physical meaning of the solution.
There is an analytical solution for the exact roots of M(q, s) in s since it is a cubic polynomial. However, it is
convenient to use a perturbation approximation to the exact solution which lends itself to physical interpretation. To
first order in Knudsen number, the roots of M(q, s ) are
s2 = -rq2 + ic,q, and (4 - 23)
where r is the classical acoustic damping coefficient, (b[(? - l )DT + Dv]), and c, is the isentropic speed of sound.
The inclusion of higher order terms is straightforward but probably would not lead to further accuracy because
this first-order analysis breaks down at about the same point as the continuum approximation needed to make sense
of bulk quantities such as diffusion coefficients and sound speeds. Thus, for sufficiently,small Knudsen number, the
partial fraction expansion for the density perturbation is
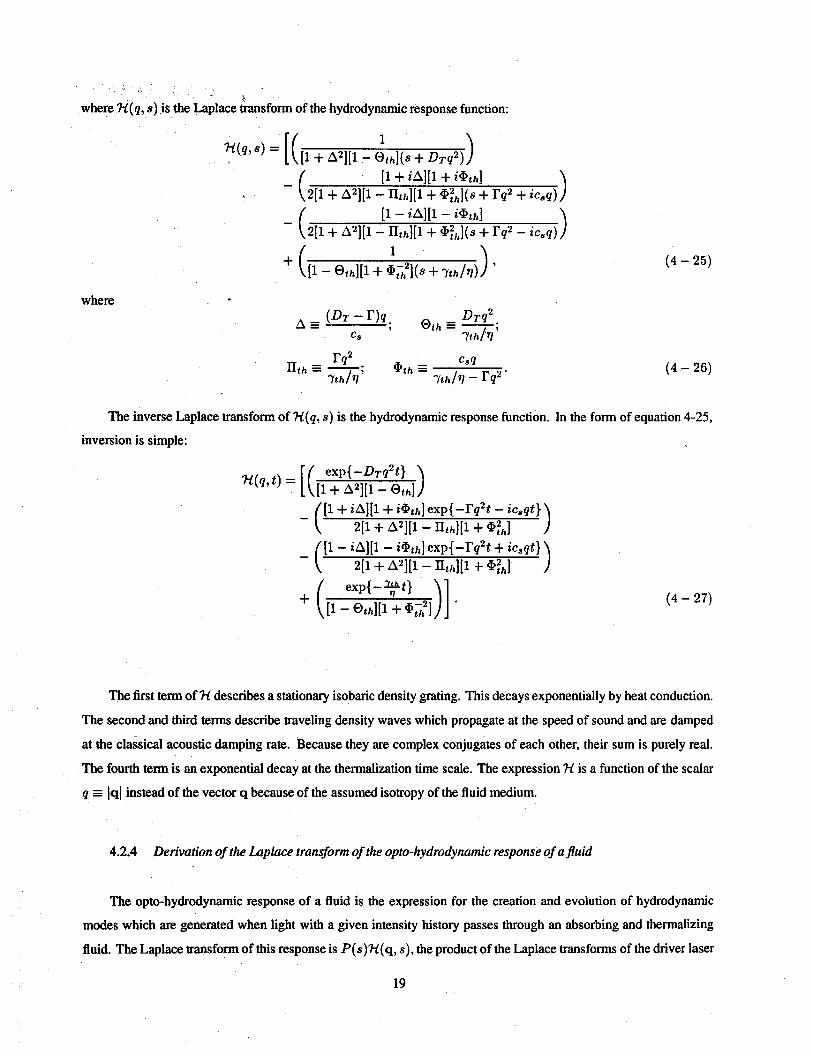
X where 'H(q, s ) is the Laplace transform of the hydrodynamic response function:
where
The inverse Laplace transform of %(q, s) is the hydrodynamic response function. In the form of equation 4-25,
inversion is simple:
The first term of 'H describes a stationary isobaric density grating. This decays exponentially by heat conduction.
The second and third terms describe traveling density waves which propagate at the speed of sound and are damped
at the cl&sical acoustic damping rate. Because they are complex conjugates of each other, their sum is purely real.
The fourth term is an exponential decay at the thennalization time scale. The expression 'H is a function of the scalar
q = Jql instead of the vector q because of the assumed isotropy of the fluid medium.
4.2.4 Derivation of the Laplace transform of the opto-hydrodynamic response of a juid
The opto-hydrodynamic response of a fluid is the expression for the creation and evolution of hydrodynamic
modes which are generated when light with a given intensity history passes through an absorbing and themalizing
fluid. The Laplace transform of this response is P(s)'H(q, s) , the product of the Laplace transforms of the driver laser

temporal profile and the hydrodynamic response. By the convolution theorem for the Laplace transform, this response
is the temporal convolution of the laser temporal profile with the hydrodynamic response:
where W(q, t ) is the opto-hydrodynamic response function.
In order to evaluate the opto-hydrodynamic response for the case of DFWM thermometry, a generic or approximate
driver laser temporal profile is needed. A generic form for the temporal laser pulse shape which is reasonable and has
a simple Laplace transformation is
The first coefficient is a normalization factor. Both r1 and r d are characteristic times of the laser pulse. The act of
normalization removes the variability of 7 1 so that the driver laser profile depends only on r d , the approximate laser
duration. The Laplace transform of this generic profile is
A Taylor series expansion of P(<) about < = 0 where < = W d / 2 is
2 P ( < ) = 1 - t + - < 2 - < 3 + . . . .
J;;
This may be approximated by
The error of this approximation is less than 5% for < < $. In other words, this approximation holds for times greater
than r d , the laser pulse duration. For time-resolved DFWM thermometry, in which the driver laser duration is short
compared to the grating lifetime, this approximation is acceptable. A more realistic repregentation of the laser temporal
profile is needed for studying the general case of DFWM off thermal gratings. In this case it may be best to convolve
numerically the actual laser profile with the hydrodynamic response function, as in equation 4-28.
The complete Laplace-transformed temporal behavior of the density grating for times greater than the driver laser
duration is:

X where for the short generic laser pulse approximation
is the Laplace transform of the opto-hydrodynamic response function, where
are natural dimensionless variables which dictate the creation and evolution of the grating. The number of independent
dimensionless variables is 5, becausevariables with subscript th are equal to their d-subscriptedcounterparts multiplied
The parameter Ud is a proportionality constant:
where variable w is the width of the driver beams and t is the length of the interaction region. Thus the parameter Ud
is the ratio of the thermalizable driver energy to the thermal energy of the interaction region and is of the order 6T/T
in the thermal grating.
4.2.5 Laplace inversion of W (q, s )
Taking the inverse Laplace transform of equation 4-24 supplies the time dependence of hydrodynamic modes
induced by the generic driver laser in terms of the opto-hydrodynamic response function, W(q, t):

The response function W ( q , t ) in the generic-laser-pulse case is the inverse Laplace transform of equation 4-33:
- B ( q ) e ~ ~ { - I ? ~ ~ t ) [ ( l - 6) cos w e t - ( A + E ) sin wBt]
+ c ( q ) exp {- ~t 1 + D ( q ) exp { - i t ) '
where
and where W B = csq is the "Brillouin" frequency, the frequency of acoustic waves with wave vector of magnitude q.
The singularities of the expression W ( q , t) (equation 4-37), the opto-hydrodynamic response in the generic case,
are removable and correspond to cases in which the form of the solution changes from simple exponential to the form
pt exp{ -v t ) . For instance, when C -, 1, the last two terms in W ( q , t ) degenerate.
Because this degeneration occurs at a point and is nonsingular, analytically there is little trouble. Numerically, however,
as these parameters approach unity, stiffness can be avoided by adopting the asymptotic form, as in equation 4-39.
It is noteworthy that all of the temporal information of a beam with scattering vector q scattered off a driver-
laser-induced density disturbance is included in the opto-hydrodynamic response function. The temporal behavior is
entirely independent of the spatial distribution of the density disturbance or the driver laser interference pattern. The
spatial profiles affect only the amplitude of the scattered signal.
4.2.6 Derivation of the driver laser electric$eld intensity distribution in the interaction region
In this section, a typical (generic) driver laser intensity profile in the interaction region, I ( r ) , is derived. Its
Fourier transform, I ( q ) , dictates the strength of the light scattered through a scattering vector, q. While any density
disturbance will give rise to scattered light, a disturbance in the form of a volume grating is desirable because it will

scatter light efficiently at thexphase-matched or Bragg angle, and only at this angle, thereby selecting a unique phase-
matched scattering vector q+, (or small range of vectors near q4,) over which strong scattering can be detected.
Such a volume grating in electric field intensity is generated at the intersection of the two driver beams.
The Fourier transform of the intensity distribution, I(q), depends upon the experimental configuration, the driver
beam shapes, etc. For this analysis the driver beams are assumed to be Gaussian (TEMoo) with waists of half-width
w which intersect at a half-angle 8 as shown in Figure 4.2.
Figure 4-2 Geometry of the intersection region used in this analysis.
The waists are assumed to be long compared to the length of the interaction region so that only plane waves are
considered. Both driver beams have the same polarization. The electric field amplitudes of the two driver beams are
El(r , t) = E l F e x p [- x2 sin2 B + y2 cos2 B + z2 + xy sin 28 I exp(iwdt + ikdzx + ikdyy) + C.C. (4 - 40) 7rw2 w2
E2 (r, t) = & exp [- x2 sin2 8 + y2 cos2 B + z2 - xy sin 28 I exp(iwdt + ikdzx - ikdyy) -k C.C. (4 - 41) nw2 w2
These expressions are normalized so that the total intensity of each beam, the integral across the beam of the square
of the electric field, is equal to Et, £22 for beams 1 and 2 respectively. The spatial electric field intensity distribution
caused by the superposition of the two beams, normalized by the total intensity of the separate beams is

The first two terms of equation 4-42 represent the "uninterfered" beams and are not of interest. The third term describes
the interference pattern:
1 + cos(2y kd sin 8) I(r) = - I (4 - 43)
where kd I 4-, E I w/sin8 is the half-length and h r w/cos8 is the half-height of the interaction region,
as shown in Figure 4-2. A cross section of the field intensity of this interference pattern is shown in Figure 4-3. The
spatial Fourier transform of equation 4-43 is
2 w 8 } [ { } cash (q@$)] . (4 - 44) ~ ( q ) = pfi exp {- l [ q ; ~ + q:h2 + q:w2] 1 + 2 exp - --
A cross section of this intensity pattern in inverse space is shown in Figure 4-4. The three peaks of the profile lie at
q = 0 and at the phase-matched scattering vectors, f q4, = f 2kd,i3,, where 6 , is the unit vector in the q,direction.
The peak at q = 0 is not of interest except that it represents a forward scattered beam that diverges because of
diffractive effects caused by the finite interaction region size. The other peaks represent phase-matched scattering
lobes. The width of these lobes is exaggerated in Figure 4-4 by choosing the interaction region width to be only a few
wavelengths of light. In practical experiments the interaction region will be much larger, providing much narrower
peaks.
The coefficient qjnt = 2E1E2/(&: + &;) is the efficiency of the creation of the electric field interference pattern
from the two driver beams, taking into account the beam strengths, and attains a maximum value of unity when the
driver beams have the same intensity. The definition of this interference efficiency could be extended to include effects
such as spatial and temporal beam overlap.
In the more general class of four-wave mixing, the frequencies of the two driver beams need not be equal. The
interference pattern that is formed becomes a moving grating with a speed proportional to the frequency difference
between the beams. In this case, the expression I has a separable time dependence, i.e., I = Iq(q)It(t). Extension of
the analysis presented here is straightforward. The timedependent part of I must be combined with the time response
W(q, t). The treatment of the spatial part of I does not change. When the motion of the grating is convolved with
the opto-hydrodynamic response of the medium, two additional removable singularitie3 are introduced for grating
velocities in the y-direction equal to f c,, the sound speed. These cases correspond to linear growth in the strength of
the grating by resonant coupling of the electric field grating to phonons in the medium. This phonon-resonance is the
principle behind the technique of nearlydegenerate-four-wave-mixing-enhanced stimulated Brillouin scattering.

Figure 4-3 Sample crosssection in the plane z = 0 of the electric field intensity grating caused by the intersection
of two Gaussian beams, as in Figure 4-2.
Figure 4-4 Sample crosssection in the plane q, = 0 of the spatial Fourier-transform of the Gaussian intensity
grating. The peaks of the three lobes lie a t q = 0, and q = f 2kdyey s q+,. The two lobes centered
on q+, correspond to scattering peaks in the phase-matched direction.

Equation 4-44 was derived assuming there was no absorption or scattering of the driver beams. When this
approximation is relaxed, two effects of absorption are revealed. First, the intensity of driver beams 1 and 2 at the
interaction region is diminished by
I1,2 = 101.02 / - 2 c u ( p l ~ 2 ) e~~ { - 2 a ( p 1 , 2 ) ~ 1 , 2 ) dp lY2 , laser
where Iol and Io2 are the lossless intensities of the two driver beams, pl andp2 are the paths that driver beams 1 and 2
take through the medium, cu is the loss coefficient, which is similar to the absorption coefficient but includes losses per
unit length due to scattering, etc. The resonant absorption coefficient, cud, provides a lower bound for this parameter.
Secondly, the location of the interaction region is displaced slightly toward the source of the driver beams, along
the bisector of the two beams. This displacement is given by
cu cos 8 Sr=-- 2 t e z ,
where 6 , is a unit vector in the xd'iction. This displacement may affect experiments in which high spatial accuracy
is required. An effect of this displacement on the signal is to add a coefficient so that the complete effect of absorption
is
Iabs = I - dl . Az . exp ( 4 - 47)
If absorption or other losses are to be considered explicitly, then Iabs should replace I in the following analysis.
4.2.7 Derivation of the temporal response of the DFWM refectiviry
All of the elements of the creation, evolution, and spatial profile of the driver laser-induced density gratings have
been derived:
Combining the density grating equation 4-36, the constitutive equation 4-8, and the scattering equation 4-1 gives
E0 k' exp i (k , - R - w o t ) X o ~ d w 2 ~ ( q ) ~ ( q , t ) . Es (R , t; q) = a The signal that is collected by a square-law detector will be proportional to the integral of the square of the modulus
of equation 4-48 over the detector area. A convenient measure for this signal is the "reflectivity" of the interaction, or
the ratio of the reflected power to the incident power,
source beam

As evidenced by ~ i ~ u & 4-4, the scattering intensity is strongest for two nonzero values of q. These values are
q = f 2kdY6, f q+,. Phase-matching (the Bragg condition) is satisfied for scattering in these directions. The
scattering intensity (oc fL) has a Gaussian profile centered on these phase-matchedpoints with half-widths (in q-space)
of 1/21, 1/2h, and 1/2w in the q,, q,, and q, directions, respectively. The size of the scattering intensity lobes
determines the solid angle of viewing that is required to collect the scattered light efficiently. In a well conducted
experiment, the detector would be centered on the scattering lobe in a phase-matched direction and would have a
viewing area sufficient to collect most of the scattered light. Changing variables from q to q' = q - q+, facilitates
calculation of the total intensity of light scattered on such a detector. Then, ignoring contributions to the scattering
signal from other two lobes,
The dependence of W(qt, t) on q' is weak compared to that of I(q1). Approximating that W(q, t) 2 W(q+,, t) over
the scattering lobe, the reflectivity becomes
where 1 IZ(ql)RzdQ (4 - 52)
det.801. ang.
is the integral of 12R2 over the detector solid angle, and Eo is the average electric field of the source beam incident
upon the interaction region.
The integral of equation 4-52 may be evaluated by adopting a spherical coordinate system with the main axis
centered on the maximum of the scattering lobe.
Then,
where 40 is the half-angle subtended by the detection optics and the length and height of the interaction region have
been expressed in terms of the intersection half-angle, 8.
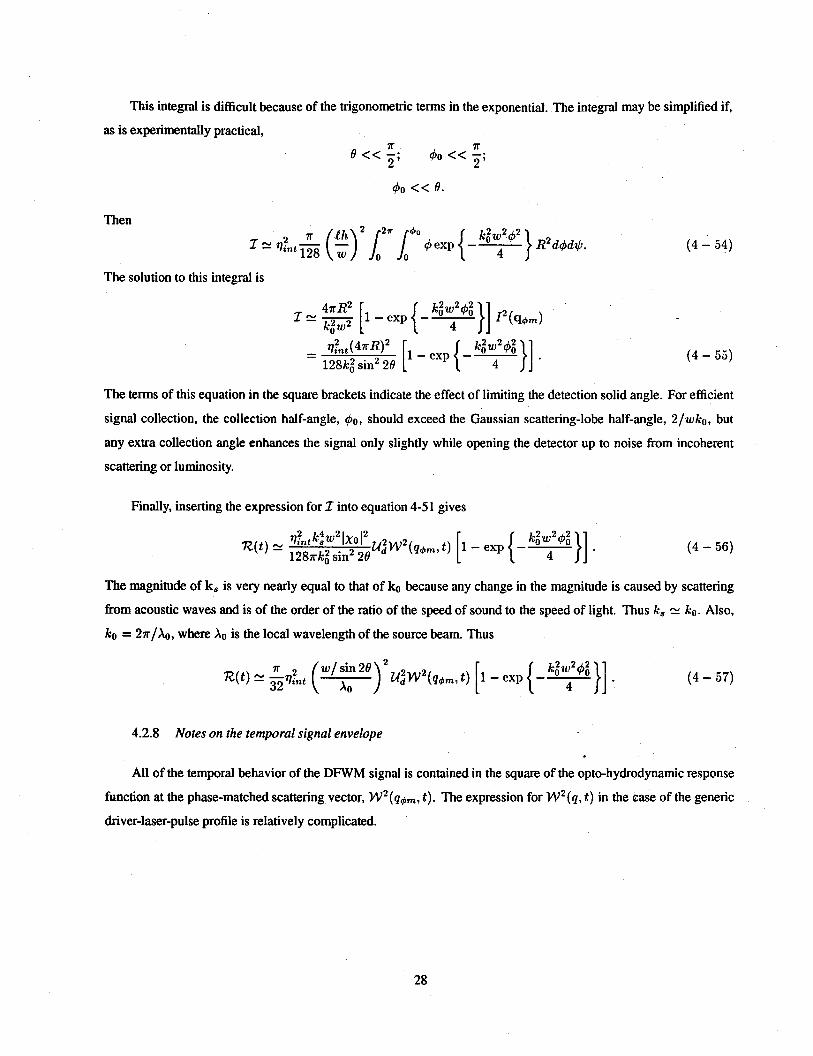
This integral is difficult because of the trigonometric terms in the exponential. The integral may be simplified if,
as is experimentally practical,
Then k , 2 ~ ~ 4 ~
I 2 n? '"'128 1 (g w ) 1" 14' 4 exp ~ ~ d g d $ .
The solution to this integral is
4nR2 k,2w2& I 2 - [ I - exp { - -)] I2 ( q a m )
ki w2
- - I L ( ~ A R ) ' [ 1-exp { -- kf:241)] . (4 - 5 5 ) 128k: sin2 28
The terms of this equation in the square brackets indicate the effect of limiting the detection solid angle. For efficient
signal collection, the collection half-angle, 40, should exceed the Gaussian scattering-lobe half-angle, 2/wk0, but
any extra collection angle enhances the signal only slightly while opening the detector up to noise from incoherent
scattering or luminosity.
Finally, inserting the expression for Z into equation 4-51 gives
The magnitude of k, is very nearly equal to that of ko because any change in the magnitude is caused by scattering
from acoustic waves and is of the order of the ratio of the speed of sound to the speed of light. Thus k, 2 ko. Also,
LO = 2lr/X0, where Xo is the local wavelength of the source beam. Thus
w / sin 20 2 U: w ~ ( ~ + ~ ~ t ) [ I - exp {--)I .
4.2.8 Notes on tlie temporal signal envelope
All of the temporal behavior of the DFWM signal is contained in the square of the opto-hydrodynamic response
function at the phase-matched scattering vector, w ~ ( ~ ~ ~ , t ) . The expression for w 2 ( q , t) in the case of the generic
driver-laser-pulse profile is relatively complicated.

+ 2 ~ ~ e x p {- ( D T ~ Z + $) t ) + 2AD exp {- ( D T ~ ~ + :) t )
+ 2 c D e x p {- ($ + &) t ) , (4 - 58)
where
This expression may be simplified somewhat for time-resolved DFWM thermometry, in which thermalization
rates are large and laser pulse durations are short. To first order in a d , @ t h , n d , 11th. a d , @ t h , i.e., for thermalization
times and laser pulse durations small compared to characteristic hydrodynamic times,
where
Ignoring finite grating-production times, the response of the system to an instantaneous thermal grating is obtained.
where
In this limit, the signal depends only on the grating wavelength and hydrodynamic variables: the speed of sound,
c,; the classical acoustic damping coefficient, I?; and the thermal diffusivity, DT. In this limit, these hydrodynamic

variables may be independently calculated from experimental time-resolved DFWM signal envelopes, without the
influence of any other parameters.
When the conditions of this limiting case are not valid, either equation 4-59 or equation 4-58 could be used to fit
experimental calibration data to obtain specific finite therrnalization rate and laser duration parameters for thermometry
in experiments. Even in cases in which the full formula for W 2 is required, the envelope of the signal that is generated
by DFWM depends upon relatively few extraneous parameters: the driver laser temporal profile and the rates of loss of
excited-state energy. This vastly curtailed parameter set represents a significant simplification over the interpretation
of multiplex DFWM signals.
4.2.9 Estimation of the absolute magnitude of the DFWM signal
A simple estimate of the magnitude of the time-resolved DFWM signal scattered off thermal gratings is useful for
assessing the plausibility of applying the technique to a particular situation. Such an estimate is made in this section.
Several simplifications and approximations can be made for this estimate. The complicated expression w ~ ( ~ , t)
is of the order 2 for instantaneous grating formation. Ignoring the resonant part of xo and assuming all of the scattered
light is collected, the reflectivity is of the order
w/ sin 28 2
llnll= gqb, . ( ) 2 . ( 2 1 ~ : ) . u j . 4
2 For air at atmospheric density, (2~:) rc 3.5 . lo-'. If I is 2 rnrn and X0 is 500 nm, then (I/10)* = 1.6. 10'.
Then
llall = 0 . 5 4 ~ ; ~ ~ ~ : .
The parameter Ud x ATIT in the interaction region, For linear hydrodynamic behavior, Ud should be kept as small
as practical, e.g., or so. Thus, for good driver efficiency (good beam overlap, equal intensities of driver beams),
reflectivities of the order to should be readily obtainable. This starkly contrasts the reflectivities of around
10-lo to lo-' commonly observed in CARS measurements.
The absolute magnitude of the time-resolved DFWM reflectivity can be used to obtain AN,, the absolute number
density of molecules resonant with the driver beams by expressing Ud and xo in terms of the AN,. This practice
requires accurate determination of a number of parameters which are difficult to obtai;, for example, the Gladstone-
Dale coefficient for the gas composition in the interaction region, the homogenous and inhomogeneous line broadening
factors of the gas in the interaction region, the driver beam overlap factor, etc. These complications are the principal
problem with using DFWM off thermal gratings to obtain absolute or even relative species populations.

X 4.3 Experimental considerations
Time-resolved DFWM thermometry has several advantages over multiplex DFWM. The time-resolved technique
requires "garden variety" lasers, e.g., a narrowband, pulsed dye laser and a flashlamp-pumped dye laser that are readily
available commercially and aot excessively expensive. The technique also has a natural advantage in flows where
thermalization rates are high. In addition, this technique can be used on atomic species because it does not rely upon
rotational spectra. Thus it can be used not only on intrinsic atomic species in the gas, but also extrinsic (seed) atoms
such as sodium or iodine, which are favorable for their readily accessible transitions (dye lasers may be used without
laser frequency up-conversion needed to probe gaseous diatomics with UV transitions). This technique also does not
require the use of high resolution spectrometers. Timedomain optical sensors required by this technique are typically
more accurate than frequencydomain optical sensors required by multiplex DFWM. A disadvantage of this technique
is that it requires a separate data channel that samples at near-GHz rates for each temperature data point. In contrast,
multiplex DFWM requires a time integral of the signal spectrum for each point. In multiplex work, a CCD array is
ideal for thermometry along a line. Evidently, there does not exist a simple commercial system for performing the
same function in the time domain except perhaps the streak camera.
The time-resolved technique allows the use of a source (second pump) beam that is not tuned to an absorption
line. This detuning can eliminate absorption of the source and the signal beam along their paths through the flow.
In addition, this can allow filtering to help to reduce the detection of light scattered from the driver (first pump and
probe) beams. When the source beam is detuned greatly from the driver beams, phase-matching does not allow phase
conjugation. Instead, the signal beam emerges at an angle from the probe beam determined by the phase-matching
requirements. If the detuning is slight, as is required to eliminate resonant absorption, then phase conjugation of the
probe beam approximately occurs. Beam arrangements other than the one shown in Figure 2-1 can be used as long as
the scattering vector, q , is equal to the phase-matched scattering vector, q4,.
When performing time-resolved DFWM thermometry, a large grating wavelength is desirable from the standpoint
of ensuring continuum behavior, minimizing density grating washout by finite thermalization effects, and obtaining
large numbers of oscillations before grating decay (the decay ratelwave motion across one grating wavelength goes
as the grating Knudsen number). On the other hand, spatial and time resolution is lost as the grating wavelength is
increased. Furthermore, the duration of the second pump laser beam that is required to collect "all" of the density
perturbation signal increases as the square of the grating wavelength. Ractical pulse-length limits may be reached. In
addition, beamdivergence and uncertainty in the intersection angle of the beams contribute increasingly to measurement
errors as the intersection half-angle, 0, decreases. For visible light, a grating wavelength larger than 50 pm requires
angular beam separations of less than one degree. Clearly, an optimal grating wavelength exists for any particular
experiment.
There is also an obvious trade off between signal intensity and the spatial resolution via the t2 dependence of the
reflectivity. The larger e is, the less spatial certainty there is. If high spatial resolution is desired, other parameters in the
reflectivity, such as XO, can be modified to increase the signal. If the source beam is tuned near a transition in the gas,
the resonant part of xo is enhanced. For a strong transition or for a transition of a majority species, this can increase the
value of x o by orders of magnitude. However, absorption of the source beam and signal beam will likewise increase.
This technique works best when the species with the resonant transition appears in the path of the source and signal
beams only near the interaction region .so that the absorption along the paths of the beams is minimized.
Time-resolved DFWM thermometry has considerable advantages over more conventional thermometry tech-
niques, including its relative experimental ease. Experience using this technique needs to- be obtained before its
ultimate potential can be properly gauged.

61 5. Status of Current Research
DFWM has been applied to spectrochemical studies only in the past six years. It has been used as a diagnostic tool
in simple combustion experiments only in the past three years. There is wide interest in the combustion, gasdynamics,
and spectrochemical communities in DFWM for the reasons discussed in this report.
Early experiments by Ramsey (1987) at Oak Ridge National Laboratory sought to exploit D F ~ for its high
sensitivity. Detection limits of sodium in a seeded flame of four parts-per-billion were obtained with a theoretical
limit, imposed by Rayleigh scattering, estimated to be 0.01 parts-per-trillion (10 fglml). More recently, Williams
et al. (1992) at Stanford Lsed DFWM to detect the minority CH radical (30 parts-per-million) in an atmospheric
oxy-acetylene flame. The detection limit was estimated to be 4 . lO"~rn-~ of CH and 4 . ~ O ~ c r n - ~ per quantum state.
Ewart (1988), et al. at Clarendon Laboratories, Oxford, recognized the potential of DFWM for the imaging
of atomic concentrations-in flames. They obtained phase-conjugate images of sodium which compared favorably
to similar LIFS images. Shortly afterward Rakestraw and Farrow (1990) at Sandia National Laboratory performed
imaging of the radical OH in flames, illustrating the effect of phase conjugation on the quality of images. Cross-
polarized pump beams were used. In this configuration, the signal beam is cross polarized from the probe beam,
allowing efficient separation of light scattered from the probe beam by surface imperfections on the beamsplitter.
Thermometry has been conducted by Dreier and Rakestraw at Sandia (1990) and Winter er al. (1992) at United
Technologies Research Center (UTRC). At Sandia, ground state rotational populations were recorded by scanning
the laser wavelength across the R1 and R2 branches of the ground state to first excited electronic state transitions in
OH and the Rl, Rz, and R3 branches of the corresponding transition in NH. Temperatures obtained by fitting these
populations to a Boltzrnann distribution were found to agree with similar CARS measurements. The uncertainties
in the DFWM and CARS measurements were similar. At UTRC, a novel experimental configuration was used in
which the pump beams were phase-conjugate. This configuration relaxes alignment constraints on the pump beams
and assures excellent beam overlap. Similar experiments were repeated by Feikema et al, (1992) in higher pressure
flames (up to 9 bar). Ewart et al. (1991) have demonstrated planar temperature measurements of OH by recording
multiple images of the DFWM signal from OH in a flame front while the laser is scanned across rotational branches.
Ewart et al. (1990) have also explored multiplex DFWM by simultaneously exciting two sodium lines. The
recorded spectra showed two distinct lines. However, there was significant broadening of the lines and nonresonant
background signal, suggesting that some of the DFWM signal was derived from thermal gratings. This possibility is
consistent with the observation that a several-nanosecond laser was employed in these experiments. Yip et ~141992)
recently performed multiplex DFWM thermomeay on OH using two transitions, with similar results.
Analytical and numerical work has been undertaken to quantify DFWM signals. Cooper et al. (1989) and
Meacher et al. (1992) calculated the spectra and signal intensity of DFWM using broad-bandwidth pump beams.

These calculations are.a prelude to multiplex DFWM experiments in an atomic vapor. Lucht er aL(1992) have
performed narrowband DFWM simulations to explore signal sensitivity to pressure, quenching, and laser intensity in
Doppler-broadened media. Lineshapes were calculated which compare well with experimental data.

r 6. Suggestions for Future Work
Before DFWM can be generally applied to technical problems beyond low pressure analytical flames, vapors,
and plasmas, the issue of grating thermalization must be addressed. Until recently, consideration of thermalization
has been avoided in the analytical and computational modeling of DFWM. If accurate DFWM experiments are to be
conducted at atmospheric pressure and higher with nanosecond or longer laser pulses, thermalization effects need to
be quantified and understood. The analysis of the magnitude and the temporal behavior of the signal scattered from
these hydrodynamic gratings in section 4.2 is a first step in this diction.
Thermalization is noi an inherent problem of DFWM. There is a laser pulse-length window between the regions of
quantum beating effects and thennalization effects in which unhampered DFWM can be performed. While this window
does not necessarily include convenient or common lasers, suitable lasers exist. This contrasts the extremely useful
but quantitatively difficult technique of LIFS. Quenching and rotational redistribution are inherent in fluorescence
techniques. Even predissociative LIFS is not entirely free of these problems.
Modeless lasers and broadband frequency conversion technology should be explored further. Mode structure in
lasers used to excite DFWM has strong effects on the DFWM signal intensity. If there is even a slight redistribution of
energy between modes or modal detuning between laser pulses, the DFWM signal may not be repeatable enough for
confidence in single-shot measurements. To some degree, this can be mitigated using a simultaneous calibration cell
as recommended by Eckbreth (1988) for CARS measurements.
The technique of time-resolved DFWM thermometry has great promise for relatively "low tech" measurements
and should be pursued. Readily available lasers and detectors can be used. By avoiding diect measurement of absolute
or even relative quantum state populations, a host of complications is eluded. Calculation of the signal envelope or
interpretation of experimental signals involves a small number of parameters.
Effects which invalidate or call into question the analysis in section 4.2 need to be analyzed in the time-resolved
DFWM process, For example, DSMC (direct simulation by Monte Carlo technique) or equivalent modeling should
be performed on the entire molecular dynamic process: from selective pumping of particles with no Doppler shift,
to the redistribution of thermalized energy, to the eventual creation of density waves. This modeling would provide
information about "cutoff' grating Knudsen numbers for continuum behavior. Interesting and important rarefied gas
effects may be discovered in each step of this process.
The use of laser sheets and volumes to obtain multipoint measurements should be examined analytically. The
extension of the analysis in section 4.2 to these cases should be relatively straightforward, but generally not trivial,
since hydrodynamic mode interferences will occur. There is likely to be a direct analogy between this analysis and
that of volume holography.

Finally, the technique should be tested experimentally in a calibrated cell over the range of parameters which
control the signal, including the grating Knudsen number, the acoustic damping coefficient, the thermal diffusivity, the
thennalization rate, and driver laser strength. These tests would be used to develop confidence in the expression for
the time-resolved DFWM signal and to facilitate quantitative measurements elsewhere.

References
R.L. Abrams, R.C. Lind, 1978 Opt. Lett. 2.94-96 ; ibid., 3,205.
B:J. Beme, R. Pecora, 1976 Dynamic Light Scattering, John Wiley and Sons, New York, NY.
H. Bervas, B. Attal-Tretout, S Le Boiteux, J.P. Taran, 1992 "OH detection and spectroscopy by DFWM in flames;
comparison with CARS," J. Phys. B 25,949-969.
A.Y. Chang, M.D. DQosa, D.F. Davidson, R.K. Hanson, 199 1 "Rapid tuning CW laser technique for measurements
of gas velocity, temperature, pressure, density, and mass flux using NO," Appl. Opt. 30,301 1-3022.
J. Cooper, A. Charlton, D.R. Meacher, P.Ewart, G. Alber, 1989 "Revised theory of resonant degenerate four-wave
mixing with broad-bandwidth lasers," Phys. Rev. A 40,5705-5 175.
T. Dreier, D.J. Rakestraw, 1990 "Degenerate four-wave mixing diagnostics on OH and NH radicals in flames,"
Appl. Phys. B 50,479-485.
A.C. Eckbreth, 1988 Laser Diagnostics for Combustion Species and Temperature, Abacus Press, Cambridge,
MA.
H.J. Eichler, 1986 Laser-induced Dynamic Gratings, Springer-Verlag, New York, NY.
A. Einstein, 19 10, Ann. Phys.33,1275.
P. Ewart, P. Snowdon, I. Magnusson, 1989 "Two-dimensional phase-conjugate imaging of atomic distributions in
flames by degenerate four-wave mixing," Opt. Lerr. 14.563-565.
P. Ewart, P. Snowdon, 1990 "Multiplex degenerate four-wave mixing in a flame," Opt. Lett. 15, 1403-1405.
P. Ewart, M. Kaczmarek, 1991 '"Twodimensional mapping of temperature in a flame by degenerate four-wave
mixing in OH," Appl. Opt. 30,3996-3999.
R. Farrow, 1991 Sandia National Laboratories, personal communication.
D.A. Feikema, E. Domingues, M.J. Cottereau, 1992 "OH rotational temperature and number density measurements
in high pressure laminar flame using double phase conjugate 4-wave-mixing," Appl. Phys. B 55,424-429.
R.A. Fisher, 1983 Optical Phase Conjugation, Academic Press, San Diego, CA.

J.T. Fourkas, T.R. Brewer, H. Kim, M.D. Fayer, 1991 "Picosecond time-resolved four-wave mixing experiments
in sodium-seeded flames," Opt. Lett. 16,177-179.
L. D. Landau, E. M. Liftshitz, 1960 Elecrrodynamicsof Continuous Media, Addison-Wesley Publishing Company,
Inc., Cambridge, MA.
L. D. Landau, E. M. Liftshitz, 1959 Fluid Mechanics, Addison-Wesley Publishing Company, Inc., Reading, MA.
D.R. Meacher, P.G.R. Smith, P. Ewart, 1992 "Frequency spechum of the signal wave in resonant four-wave
mixing induced by broad-bandwidth lasers," Phys. Rev. A. 46,2718-2725.
D.J. Rakestraw, R.L. Farrow, T. Dreier, 1990 "Two-dimensional imaging of OH in flames by degenerate four-wave
mixing," Opt. Lett. 15,709-71 1.
J.M. Ramsey, W.H. Whitten, 1987 "Degenerate four-wave mixing as a spectrochemical analysis technique," Anal.
Chem. 59,167-171.
A.E. Siegman, 1986 Lasers, University Science Books, Mill Valley, CA.
W. G. Vincenti, C. H. Kruger, 1965 Introduction to Physical Gas Dynamics, Krieger Publishing Company,
Huntington, NY.
S. William, D.S. Green, S. Sethuraman, R.N. Zare, 1992 "Detection of trace species in hostile environments using
degenerate Cwave mixing - CH in an atmospheric pressure flame," J. Amex Chem. Soc. 114,9 122-9 130.
M. Winter, P.P. Radi, 1992 "Nearly degenerate four-wave mixing using phase conjugate pump beams," Opt. Lett.
17,320-322.
B. Yip, P.M. Danehy, R. K. Hanson, 1992 "Degenerate four-wave mixing temperature measurements in a flame,"
Opt. Len. 17,751-753.

C
Figure 2-1 Schematic diagram of a common DFWM geometry. The pump beams counterpropagate through the medium.
The probe and signal beams intersect these beams at a small angle. The interaction region is defined by their
intersection.
Figure 2-2 Vector diagram cff momentum conservation or phase-matching for DFWM with the geometry shown in
Figure 1.
Figure 2-3 Schematic diagram of the formation of the forward and backward electric-field gratings via interference
between the first pump and probe and the second pump and probe, respectively. The signal beam is formed
by scattering off these gratings.
Figure 2-4 Vector diagram of the interference patterns or electric-field gratings produced by the intersection of the pump
beams and the probe beam.
Figure 4-1 Scattering geometry for equation 4-1.
Figure 4-2 Geometry of the intersection region used in this analysis.
Figure 4-3 Sample cross section in the x - y-plane of the electric field intensity grating caused by the intersection of
two Gaussian beams, as in Figure 4-2.
Figure 4-4 Sample spatial Fourier-transform of the Gaussian intensity grating. The peaks of the three lobes lie at
q = 0, and q = f 21cd,B, = q4,. The two lobes centered on qg, correspond to scattering peaks in the
phase-matched direction.
Figure 4-5 Vector diagram of the scattering/detector geometry.