er - shodhganga : a reservoir of indian theses @...
TRANSCRIPT
UTILIZATION OF GOVERNMENT er PRIVATE HEALTH SERVICES

CHAPTER - VII
UT1L;IZATION OF GOVERNMENT AND PRIVATE HEALTH SERVICES
Barring a few Socialist countries like Cuba where the state is the
sole provider of medical care, most of the developed and developing
world largely has a mixed provlslonlng of services. The relative roles of
public and private sectors in health care in developing countries have
changed considerably over time. Although the state has played a central
role in providing medical care in India, private interests were never
curbed and as a result they have grown over the years. The focus of this
chapter is to examine the utilization pattern of Govt. and private health
care centres and the problems faced in general in the utilization of Govt.
health care centres.
lndia does not have a well-developed private "health" sector.
Despite the fact that the private sector is large and popular, its
contribution to eradicating small pox, controlling malaria, bringing down
the incidence of diarrhoea1 deaths, and in general to lowering death rate
and in increasing the life expectancy of the population of lndia is
marginal. What exists is exclusively a 'private medical sector' isolated
almost completely from efforts at providing health care to the people.
The private medical sector in India is perhaps the largest in the world.
Eighty percent of about 400000 registered allopathic and 85% of around
50,000 registered non-allopathic doctors' work in the private sector, of
them over 85% was engaged in private medical practice (Uplekar and
George 1994).

The private medical sector is vested with certain characteristics.
The practitioners are like their counterparts in the public sector, trained
in western type, hospital based urban oriented medical care system.
Community health is perhaps the weakest and most neglected part of
their curriculum. A licence to practice is issued to them soon after their
training. Once they start practice, the phase of their education comes to
an end and they are completely free to pursue their vocation. No
monitoring, no organized arguments for continuing medical education,
no regulation of fees they charge or the drugs they administer and
prescribe and no system of renewal of the licence to practice (Uplekar
and George 1994). But even then, regarding the provision of health care,
most of the people in urban areas depends on private health care
practitioners and private health care centres, because Covt. medical
institution is fully vested with the bureaucratic dictation of medical
professionals and the chance of getting best treatment to common people
are very remote. Many of the doctors, nurses, and paramedical personnel
working in the public health care system are not committed to their
works, often greedy of making more and more money through private
practice and other out of way methods. The health system has therefore
to be de-mystified, de-professionalised, de-bureaucratised and de-
commercialized to provide better services to the masses (Joseph et al
1983).
The private sector plays an important role in India's health care
system. Through a wide network of health care facilities, this sector
caters to the needs of both urban and rural population and has expanded

widely to meet the increasing demands and challenges (Bhat 1999).
Total health expenditure in India is estimated to be about 6% of C.D.P of
which private health expenditure is 75% or 4.25% of G.D.P. About one
third of this expenditure is on secondary and tertiary inpatient care, the
rest meeting the curative needs at primary level (World Bank 1995).
Private health care expenditure in India has grown at the rate of 12.5%
per annum since 1960-61. For each 1% increase in percapita income,
private health care expenditure has increased by 1.47% (Bhat 1996).
About 57% of hospitals and 32% of hospital beds are in the
private sector. At present about 80% qualified allopathic doctors
registered with medical councils in India are working in the private
Sector (Jessani and Anantharam 1989, Bhat R 1996). There are over
6,50,000 providers of other systems of medicine practicing in India
(Govt. of India 1998) and most of them are in private practice.
Utilization studies show that one third of the inpatients and three quarters
of the outpatients utilize private health care facilities (Duggal and Aniin
1989, Yesudian 1990, Visaria and Gumber 1994).
Government Health Services
Though Govt. health services are available freely to the poor, they
are not fully used by them. Many factors are responsible for the under
utilization of the Govt, hospital. Majority of the people used Govt.
hospital for inpatient care as they can escape from the huge hospital bill
levied by the private hospitals. The analysis of curative care in the
earlier chapter revealed that, for outpatient care, only very few is using

the Govt. hospitals, because they have to borrow entire medicines from
private sourcks. This section deals with the utilization of Govt. hospital,
causes for non-utilization of Govt. hospital and knowledge about various
departments in the Govt. hospital and the opinion and complaints about
Govt. hospital.
Table 7.1: SES Class and households Utilised Government health
Source: Survey data. Figures In parentheses indicate percentage
Table 7.1 provides the SES class with the number of households
who Utilised Govt. hospitals1 health centres, during the last 3 years prior
to the survey. It shows that 43.3% households' in urban and 88.8%
households' in slum Utilised Government hospital during the last 3
years. From the table it can be seen that 100% of the very low class
(SES5) and 85% of the low class (SES4) in urban areas used Govt.
hospital in the last 3 years. For the urban slum this was 97.5% and
96.8% respectively for SES5 and SES4. Though the upper classes used
b v t . hospital, it was very meagre and it is to be noted that nobody in the

upper class (SES,) used Govt. hospital during the last 3 years. In the
slum as a whole 88.75% used Govt. hospital during the last 3 years,
whereas this was only 43.3% in the urban sarnpk. The analysis of data
revealed that as socio-economic status improves, the percentage of
household utilizing Govt. health setvices declines and vice-versa.
Percaoita income and utilization of Government h o s ~ i t a l
Though the impact of SES on utilization of Govt. health services
is analysed in table 7.1, the linkage of percapita income (though it is a
constituent in measuring the SES of households) on the utilization of
Govt. hospitals1 health centres is analyzed separately. Table 7.2 provides
percapita income of households and the utilization of Government
hospital1 health centres by the household members in the last 3 years
prior to the survey. It reveals that as percapita income slab increases, the
nercentage of households who Utilised Govt, hospital services decreases
and it is common for both urban and slum households. The decline in
utilization of Govt. health services as percapita income increases is much
deeper in the percapita income slab 501-750 in the case of slum
compared to urban, where the decline is not so deeper. This indicates
that even certain better income groups are utilizing Govt. hospital for
getting either medical re-imbursement facility or for recording the
treatment undergone under the Govt, doctors for availing medical leave.
Thus percapita income and utilization of Govt. hospital is moving in the
opposite direction.

Table 7.2: Percapita income of households and utilization of Govt. hospital/ health centres -
Percapita Income (Amount in Rupees) - upto I00
501 to 750
751toIOOO
1001 to 1500
Above 1500
Ooinion about inpatient Services
Total
Table 7.3 provides the opinion of respondents about test and
(86.4) 11
(47.8) 4
(30.8) 6
(22.2) -
treatment during the stay in Govt. hospital in the last 2 years. It can be
' Urban
Source: Survey data. Figures in Parentheses ind~cale percentage
52 (43.3)
seen that with regard to the inpatient services received from the Govt.
Utilised Slum
(13.6) 12
(52.2) 9
(69.2) 2 1
(77.8) 22
hospital, 92% of the slum respondents and 78% of the urban respondents
Utilised
2
( 100) 68
(56.7)
were totally dissatisfied indicating the poor and dismal performance of
Not Utilised
23
13
27
22
Govt, hospital. Most of the respondent in their informal talk with us
Total Not Utilised
120 (100)
disclosed that the test and treatment offered during their stay in hospital
Total
2
(94.7) 2
(25)
was very bad. As there is no other resort they stayed in the hospital for
7 1 (88.8)
few days.
(5.3) 6
(75) 8
9 (1 1.2)
80 (100)

Table 7.3: SES Class and Opinion about Inpatient Treatment in
Source: Survey data. Figures in Parentheses indicate percentage.
Similarly the advice and information provided at the time of
discharge is also significant as part of the follow up treatment. Most of
the patients from the Govt. hospital would be discharged as early as
possible to avoid the rush in the inpatient ward. But most of them are
dissatisfied with the advice and information provided by the hospital
authorities for follow up treatment. Table 7.4 gives opinion about the
advice and information provided at the time of discharge from Govt.
Hospital.
Table 7.4: SES Class with Advice and information orovided at the
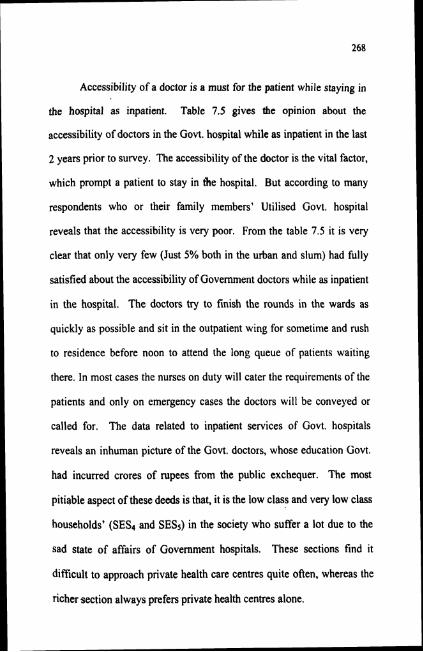
Accessibility of a doctor is a must for the patient while staying in
the hospital as inpatient. Table 7.5 gives the opinion about the
accessibility of doctors in the Govt. hospital while as inpatient in the last
2 years prior to survey. The accessibility of the doctor is the vital factor,
which prompt a patient to stay in the hospital. But according to many
respondents who or their family members' Utilised Govt. hospital
reveals that the accessibility is very poor. From the table 7.5 it is very
clear that only very few (Just 5% both in the urban and slum) had fully
satisfied about the accessibility of Government doctors while as inpatient
in the hospital. The doctors try to finish the rounds in the wards as
quickly as possible and sit in the outpatient wing for sometime and rush
to residence before noon to attend the long queue of patients waiting
there. In most cases the nurses on duty will cater the requirements of the
patients and only on emergency cases the doctors will be conveyed or
called for. The data related to inpatient services of Govt. hospitals
reveals an inhuman picture of the Govt. doctors, whose education Govt.
had incurred crores of rupees from the public exchequer. The most
pitiable aspect of these deeds is that, it is the low class and very low class
households' (SES4 and SES5) in the society who suffer a lot due to the
sad state of affairs of Government hospitals. These sections find it
difficuk to approach private health care centres quite often, whereas the
richer section always prefers private health centres alone.

Table 7.5: SES class with accessibility of doctors while as inpatient in
Source: Survey data. Figures in Parentheses indicate percentage
Com~laints and Alleeations against Govt. hospitals
In order to get vivid picture about the service conditions of the
Government hosp'itals, opinion about 7 items of services were asked to
the respondents who Utilised Govt, hosp~tal dur~ng the last 2 years.
. . households' ~ t i l k d ~ove'rnment hospital.

From the Table 7.6 It can be seen that the major complaints raised
by the respondents were against the check-up of doctors and poor
medical equipment. As there is long queue in the outpatient department,
the doctor in charge of the out patient counter may finish the check-up of
each patient within seconds and give them prescriprions for one or two
tablets and ask the next person to come. There is no proper diagnosis of
the patient, as the doctor is busy to finish his work in the hospital and
wanted to start private practice either from his residence or from the
separate clinic setup for this. The lack of proper check-up of patients
due to the callousness of the doctors is causing severe medical problems
to the patients and in certain times even death. Lack of medical
equipment is also causing severe problem for the patients. Though
Government hospital is meant for the poor and vulnerable in the society,
there are no medical equipment properly functioning in most of the
hospitals. For X-ray, EGG etc. patients have to go outside. Even for
blood test, sputum test, urine test etc. private sector is the only resort.
Even if certain equipments were there, most of the time they will be in
out of order or under damage and the authorities concerned would not
take initiative to repair it due to pressure from outside private agencies,
which render these. services. Similarly the poor nursing care,
favouritism, indifferent doctor's behaviour etc. are also categorized as
complaints against Govt. hospitals. Many respondents informed us that
most of the nurses behave arrogantly and will not show any sympathy
and if the patients raise.any doubts about the medicine, they irritate on
them. In the informal chat with the respondents and household members
of the study area, we realised few more complaints against Govt.

hospitals and doctors. Even if,medicines were available in the Govt.
hospital, the doctors in duty prescribe medicines to outside. Similarly
for X-ray, ECG, Ultra Sound Scanning etc. they prescribe to outside
private agencies and will not take interest to repair the existing
equipment or install new one. As the doctors are recerrlng good amount
as commission from these private agencies, they try their level best to
continue the statusquo of Government hospitals for years. Those who
raised complaints against the neatness in the General Hospital increased
with the rise of socio-economic status. Since the houses of upper
middle, upper class and lower middle class households were maintained
clean and neat, the hospital environment looked unclean to them when
compared to the cleanliness of their houses. On the other hand, the
dwellings of the slum households and urban poor were not at all
maintained properly and neatness was not a problem to them. In the
slum, we often observed that on one side of the kitchen (most often only
one room including kitchen) one child may be defecating, very close to it
another child may be eating food. (This was observed during a rainy
day). In the case of urban poor, their living situation is not as worse as
that of slum dwellers, so some of them raised their voice against
cleanliness. In General, for the poor, the hospitals were not unclean
when compared to their own house.
On the whole 52 respondents in the urban areas made 249
complaints and 71 respondents in the slum areas made 316 complaints
that Utilised Govt. hospitals (Table 7.6). The average number of
complaints per household was 4.7 in urban and 4.5 in slum. In the urban

sample the average number of.complaints made by low class (SES4)
households was highest with 5.3 followed by upper middle class (SES2)
with 5.4 and minimum of 4.1 by lower middle class (SES,). In the slum,
it was the lower middle class (SES,) whom raised maximum complaints
with average rate of 5 followed by very low class (SEY) with complaint
rate of 4.5 and low class (SES4) with complaint rate of 4.4.
Private health services
Private medical practice is the fundamental feature of urban health
care system. The better off sections like SESI, and SESz nurtures the
private medical practice in urban areas. Due to the callousness and
indifferent attitude of the Govt. doctors on the one side and sad state of
affairs of the Govt. hospital on the other, even the poor sections are now
utilizing the private health services. Private health centres in the study
area is divided into three categories, namely private clinic, private
hospital and voluntary hospital. Private hospital provide outpatient and
inpatient services, and owned by either a single individual or a
partnership. In private clinics the doctor either gives only prescriptions
or medicines, from his own dispensary and voluntary hospitals in the
study area are the Co-operative hospitals with outpatients and inpatient
facility. It is managed by a board of directors as per the co-operative
rules and regulations in practice. Table 7.7 explains the type of private
health centres Utilised by the sample households. From the table it can
be seen that 90.8% households in the urban, 66.3% households in slum
Utilised private health services in the last two years. All the upper class
(SES,) and upper middle class (SES2) households Utilised the private

health services. Similarly most of the very low class (SESs) low class
(SES~) and lower middle class (SES,) households in both urban and slum
had Utilised private health services. From the table it can be seen that
the proportion of households utilizing private health services rises with
rise of socio-economic status. Class wise analysis of urban private
health services utilization revealed that 60.5% of the private health
sewice is met through private clinics, 28.4% through private hospitals
and 11% through doctor's residence. It can be seen that slum households
also exhibit somewhat similar trend. Doctors running private clinics
near to the slum areas provide some concession to the poor people in the
consultation fees charged by them which act as a blessing for the
deprived groups in the slums and it augment the utilization of health
services
Source: Survey data. Figures in Parentheses indicate percentage
Reasons for goine to private health centres
Though Government is incurring crores for running public health
centres many poor people are compelled to go to private health centres

for treatment. From the sample households in the urban area it can be
seen that 109 households utilisea private health services, whereas the
~ o v t . health services was utilised only by 52 households. So the reason
for the utilization of private health services were analysed and it is
provided in table 7.8. From the table it is clear that y s t of the upper
class (SES,) and upper middle class (SES2) used private health centres
for good treatment and personal contact of the doctor. Major proportion
of the low class (SES4) and very low class (SES5) households in urban
and slum used private health centres mainly due to lack of medicines in
Govt, hospitals. Many respondents expressed the view that what they
can save after spending half day in front of the outpatient (0 .P ) counter
of Govt. hospital is only the consultation fee of Rs.251-, because they
have to purchase the entire medicine from outside. In addition to this
many households in the low class and very low class households prefer
private clinic because it functions in night. So if the children or other
members fall sick, the head of the household or other earning members
in the family would have to take them to hospital or health centres.
Since private clinic functions in night many prefers to take them to such
clinic in the evening after earning their livelihood. So without causing
any loss of income, they can consult doctors in the private clinic.
Another reason suggested for the option of the private clinic or health
centre is that, there is no need of long waiting as in the O.P. counter of
Govt. hospitals. Due to the personal contact of the doctors, they can
easily consult the doctor and long waiting can be avoided. The analysis

of the reason for the choice of private health centre reveals that both the
urban and slum respondents differ widely in their attitude towards
private health care. In the urban sample, around 58% prefer private
health centres for good treatment and personal wntact of the doctors,
whereas in the slum this was only 5.7%. In the slum the motivating < force behind the utilization of private health service is accessibility of the
doctors in the night and non-availability of medicines from Govt.
hospitals, which accounts for 76% of the reasons pointed out by them.
Table 7.8: SES class and reasons for the choice of private health services

Com~laints aednst Private hosaital
The complaints raised against private hospital1 health services
were few. As they are charging good amount for the services rendered,
it is upto the mark in every sense. But the major complaint on the part of
private health service users was that the rate charged by them was
abnormal and treatment is expensive. But this complaint had little
relevance, as the study made by Aravindan (2001) revealed that the cost
of an illness episode as outpatient is somewhat same in private and Govt.
hospitals in Kerala. Out of 109 respondents in urban sample who used
private health services, 10.1 % of them complaint that it is costly and in
slum 22.6% of 53 respondents also complaint about high cost of private
health care service. Many upper class and upper middle class
respondents informed us that doctors practicing in big hospitals are
unnecessarily advising for undergoing MRI Scanning, ECG, and X-ray
etc, for raising hospital resources. Such charges are even too heavy for
the lower middle class (SES3) and upper middle class households (SES2).
Utilization of private and Government health services
As the health care system is covered by both public and private
agencies, there exist many households', which utilize both public and
private health services. In order to get a clear picture of the utilization
pattern of Govt. and private health services, only a combined data can
provide these results. Table 7.9 provides the utilization pattern of
Government and private healrh services together. From the table 7.9 it is
clear that there is a marked difference in the utilization pattern of
Government and private health services.
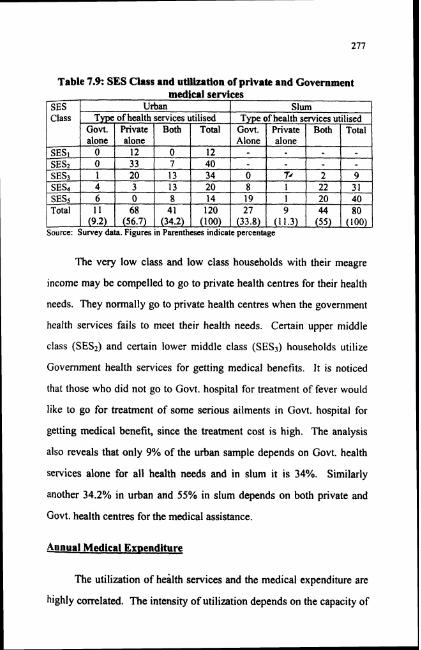
Table 7.9: SES Class and utilization of prlvate and Government medical services
Source: Survey data. Figures in Parentheses indicate percentage
The very low class and low class households with their meagre
income may be compelled to go to private health centres for their health
needs. They normally go to private health centres when the government
health services fails to meet their health needs. Certain upper middle
class (SES2) and certain lower middle class (SES3) households utilize
Government health services for getting medical benefits. It is noticed
that those who did not go to Govt. hospital for treatment of fever would
like to go for treatment of some serious ailments in Govt. hospital for
getting medical benefit, since the treatment cost is high. The analysis
also reveals that only 9% of the urban sample depends on Govt. health
services alone for all health needs and in slum it is 34%. Similarly
another 34.2% in urban and 55% in slum depends on both private and
Govt. health centres for the medical assistance.
Annual Medical Exaenditure
The utilization of health services and the medical expenditure are
highly correlated. The intensity of utilization depends on the capacity of

the medical aid seeker to pay for it. But by the linking of medical aid
with the expenditure capacity, it'could not be possible to judge utilization
of health services by the low class and very low class sections, because
these two classes mainly use freely available public health services.
Medical expenditure items of the community differ widely from
one SES class to another. The expenditure data of the present study
reveals that the upper class (SESI) and upper middle class (SES*) spend
good amount for medical care. Their expenditure items include special
food, transportation, tests, medicines, consultant fees etc. Whereas most
of the low class and very low class (SES4 and SES5) restricted their
expenditure in one or two items like either medicines or medicines and
transportation. Table 7.10 analyses the medical expenditure of different
SES classes during the last one year prior to survey. From the table I!
can be seen that in the urban sample 50% of the upper class (SES,) and
27.5% of upper middle class (SES2) had expenditure above Rs.3500.
Similarly 50% of the very low class (SESs) and 40% of the low class
(SES4) had annual medical expenditure of less than Rs.1000 per month.
Another thing to be noted here is that 5.8% of the urban sample had no
health expenditure at all for the last one year and in high classes we
assumes that the no expenditure may be due to their good luck in
escaping from diseases due to infection and in the case of lower sections
this may be due to their lacunae to go for treatment. ln the urban sample
out of 15 households, whi.ch had health expenditure of above Rs.5000,
80% belongs to upper class (SES,) and upper middle class (SES2). In the
slum only very few (i.e 10%) had expenditure beyond Rs.2500. On the
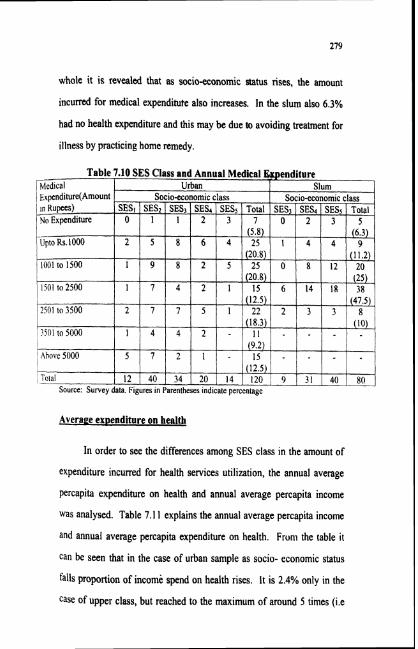
whole it is revealed that as socio-economic status rises, the amount
incurred for medical expenditute also increases. In the slum also 6.3%
had no health expenditure and this may be due to avoiding treatment for
illness by practicing home remedy.
Averaee exoenditure on health
In order to see the differences among SES class in the amount of
expenditure incurred for health services utilization, the annual average
percapita expenditure on health and annual average percapita income
was analysed. Table 7.1 1 explains the annual average percapita income
and annual average percapita expenditure on health. From the table i t
can be seen that in the case of urban sample as socio- economic status
falls proportion of income spend on health rises. It is 2.4% only in the
case of upper class, but reached to the maximum of around 5 times (i.e
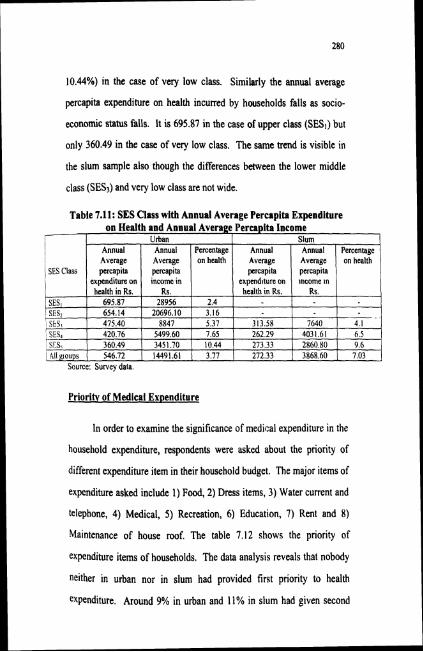
10.44%) in the case of very low class. Similarly the annual average
percapita expenditure on health incurred by households falls as socio-
economic status falls. It is 695.87 in the case of upper class (SES,) but
only 360.49 in the case of very low class. The same trend is visible in
the slum sample also though the differences between the lower middle
class (SES,) and very low class are not wide.
Source: Survey data.
Table 7.11: SES Class with Annual Average Percapita Expenditure on Health and Annual Average Percapita Income
Priority of Medical Expenditure
In order to examine the significance of medical expenditure in the
household expenditure, respondents were asked about the priority of
different expenditure item in their household budget. The major items of
expenditure asked include 1) Food, 2) Dress items, 3) Water current and
telephone, 4) Medical, 5) Recreation, 6) Education, 7) Rent and 8)
Maintenance of house roof. The table 7.12 shows the priority of
expenditure items of households. The data analysis reveals that nobody
neither in urban nor in slum had provided first priority to health
expenditure. Around 9% in urban and 11% in slum had given second
SES Class
Slum Urban Annual Average percapita
exvend~ture on
Annual Average percapita
exoenditure on
Annual Average percapita lncome ln
Annual Average percapita income in
Percentage on health
Percentage on health

priority to medical aid in the expenditure. There are certain households
with members ailing from chmnic illness, like asthma, diabetes, pain in
joint, epilepsy, cancer etc. for such illness continuous treatment is a
must. These households have to keep separately a good amount for the
purchase of medicines and conducting of medical tests, such households'
medicine is most urgent after food. Most of the households in upper
class (SES,) and upper middle class (SES2) did not provide any high
priority for medical expenditure and provide 4Ih, 5Ih , or 6Ih priority only.
The number of households given last priority increased with rise of
socio- economic status.
The high class spent good amount as health expenditure (table
7.12) but their priority to medical expenditure was very low. Though the
absolute amount spent on health services was high, but this amount
formed only a small of their total income as they earns huge
amount as monthly income and they spend bigger amount on other

household expenditure. In our informal talk with the respondents certain
respondents in the upper class' households revealed that, current water,
and telephone charge occupy the first priority in their expenditure items.
At the same time smaller amount incurred for the health expenditure by
the low class and very low class households, formed a bigger percentage
of their total income as they earn only a minimum income, that too was
not fixed in character.

References
Aravindhan K.P.(2001) Kerala Aroghya Mathmka, Puthiya Noottandilekku,
Kerala Sastra Sahithya Parishad, Kochi.
Bhat Ramesh (1996) Regulation of private health sector in India.
International Journal of health planning and Management, Vol.11 P. 253-
274.
Bhat Ramesh (1999) Characteristics of private medical practice in India,
a provider perspective, Health Policy and Planning Vo1.14 No. l P. 26.37.
Duggal R and Amin S (1989) Cost of health care, A household Survey in
an Indian district, FRCH, Bombay.
Government of India (1998) Approach paper to Ninth Five Year Plan
1997-98 Planning Commission, New Delhi, P.87.
Jessani A and Anatharam S (1989) Private Sector and Privatization in the
health care services, F.R.C.H., Bombay.
Joseph George, Desrochers John Kalathil Mariamma (1983) Heath Care
in India,Centre for Social Action, Banglore.
Uplekar Mukund and George Alex (1994) Access to health care in India,
present situation and innovative approaches, R.C.H. Bombay P.lO.
Visaria P and Gumber Anil (1994) Utilization of and expenditure on
health care in India 1986-87, Gujarat Institute of Development Research,
Goa.

World Bank (1995) India policies and Finance strategies for
strengthening primary health care services, Report No. 13042 Population
and Human Resources Division, Washington D.C.
Yesudian C.A.K (1990) Utilization pattern of health services and its
implications for urban health policy, Take mi Programme in
International Health, Harvard School of Public Health.