equivalent wind speed for aep - ewea€¦ · standard aep calculation (wind speed at hub height)....
TRANSCRIPT

Equivalent wind speed for AEP
Rozenn Wagner
Working group power curve measurement in non-standard flow
12-03-2013
Siemens, Brande, Denmark
DTU Wind Energy, Technical University of Denmark
Add Presentation Title in Footer via ”Insert”; ”Header & Footer”
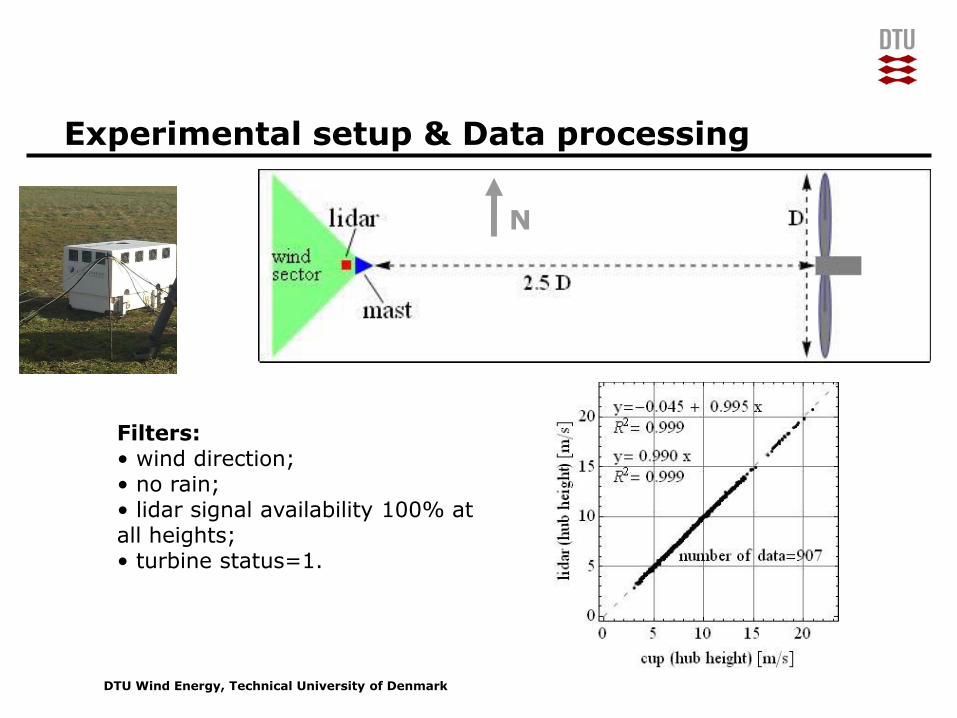
Experimental setup & Data processing
Filters: • wind direction; • no rain; • lidar signal availability 100% at all heights; • turbine status=1.
N

DTU Wind Energy, Technical University of Denmark
Add Presentation Title in Footer via ”Insert”; ”Header & Footer”
Profiles classification
( )
fit
mfit hub
hub
zu z u
z
2
( ) mfit i i
i
RSS u z u
RSS<0.1
RSS>0.1

DTU Wind Energy, Technical University of Denmark
Add Presentation Title in Footer via ”Insert”; ”Header & Footer”
Standard power curve
2 groups of profiles result in 2 different power curves

DTU Wind Energy, Technical University of Denmark
Add Presentation Title in Footer via ”Insert”; ”Header & Footer”
Equivalent wind speed
A1
A2
A3
A4
A5
Concept:
One wind speed representative of the whole wind speed profile in front of the wind turbine rotor in term of power production
U1
U2
U5
U4
U3 Ueq
1/3 1/3
3 3
1
1( ) ( )
R Ni
KE i
iR
AU u z c z dz u
A A
Definition:

DTU Wind Energy, Technical University of Denmark
Add Presentation Title in Footer via ”Insert”; ”Header & Footer”
Power curve with equivalent wind speed
Similar power curves are obtained for both groups of profiles
DTU Wind Energy, Technical University of Denmark
Add Presentation Title in Footer via ”Insert”; ”Header & Footer”
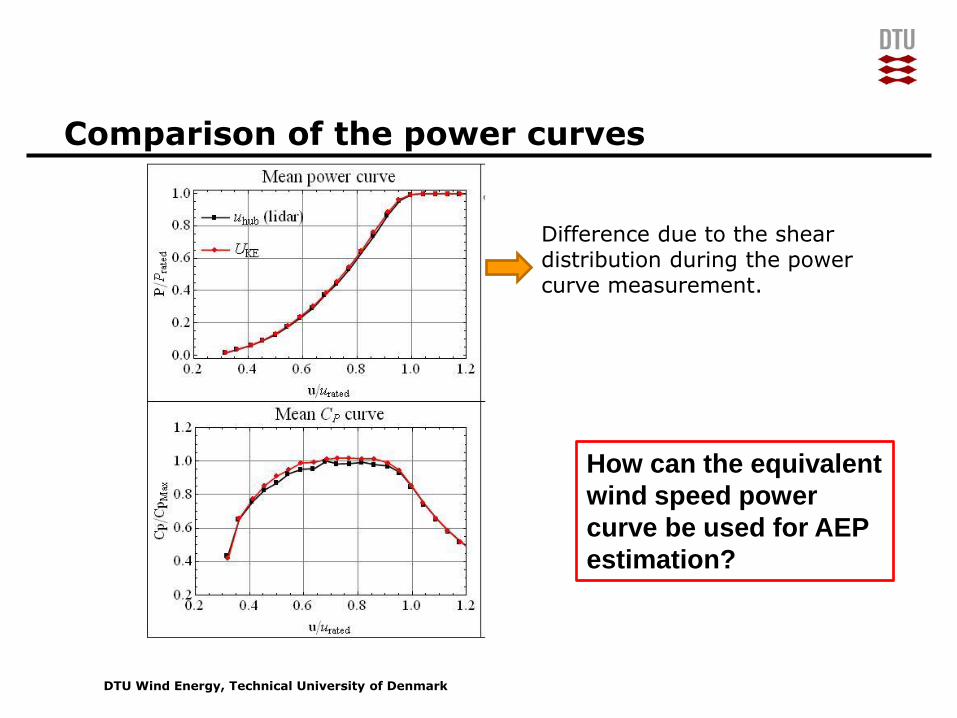
Comparison of the power curves
Difference due to the shear distribution during the power curve measurement.
How can the equivalent
wind speed power
curve be used for AEP
estimation?
DTU Wind Energy, Technical University of Denmark
Add Presentation Title in Footer via ”Insert”; ”Header & Footer”
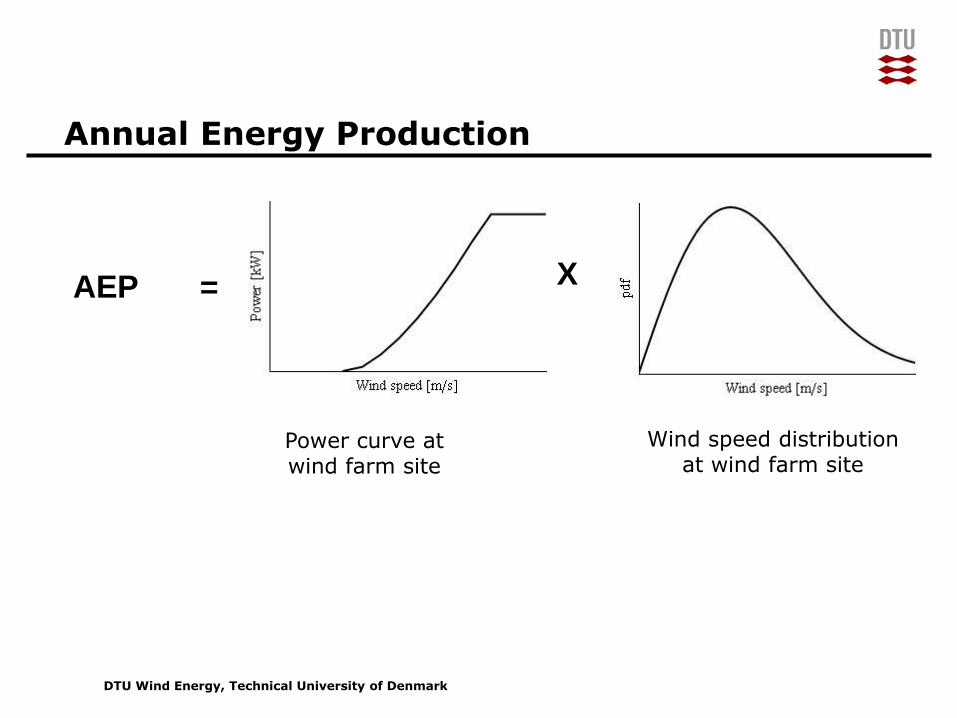
Annual Energy Production
X AEP
Power curve at wind farm site
Wind speed distribution at wind farm site
=
DTU Wind Energy, Technical University of Denmark
Add Presentation Title in Footer via ”Insert”; ”Header & Footer”
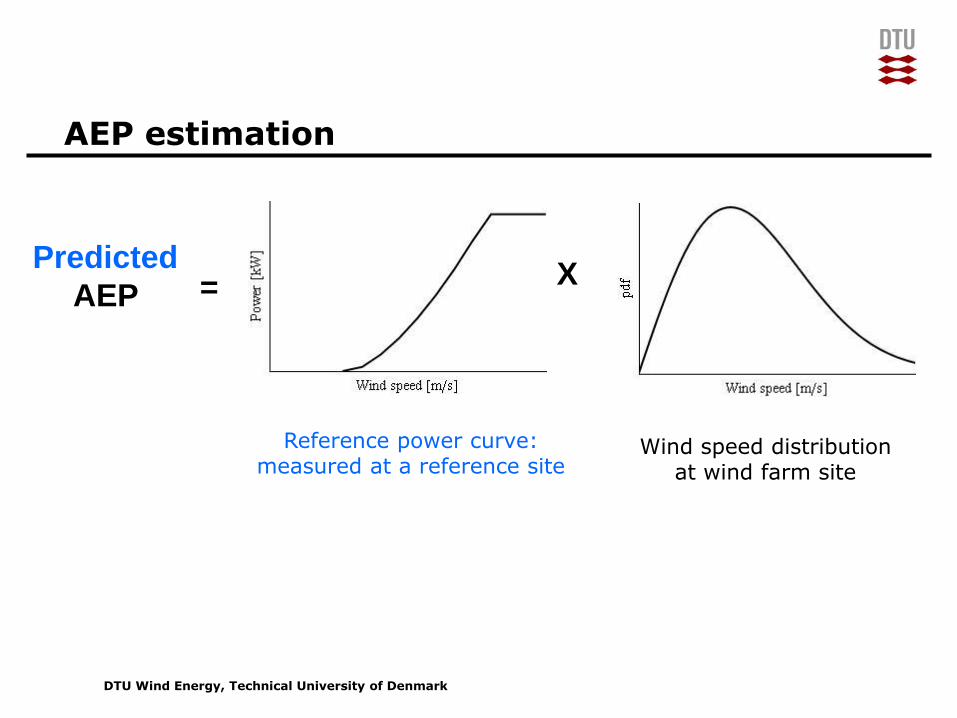
AEP estimation
X Predicted
AEP
Reference power curve: measured at a reference site
=
Wind speed distribution at wind farm site
DTU Wind Energy, Technical University of Denmark
Add Presentation Title in Footer via ”Insert”; ”Header & Footer”
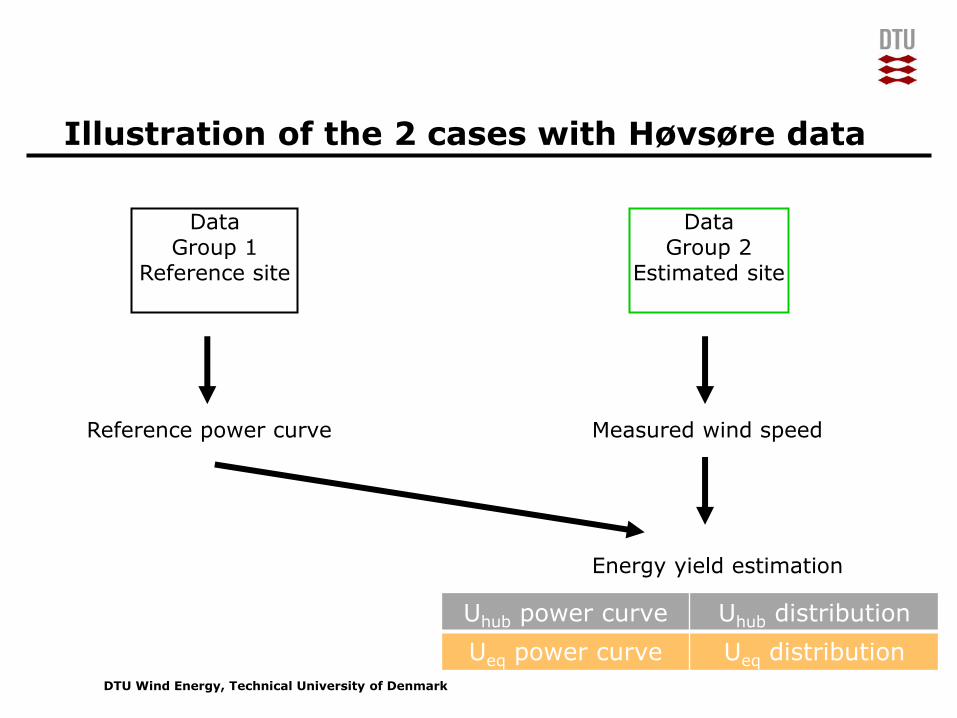
Illustration of the 2 cases with Høvsøre data
Data Group 1
Reference site
Reference power curve
Data Group 2
Estimated site
Measured wind speed
Energy yield estimation
Uhub power curve Uhub distribution
Ueq power curve Ueq distribution

DTU Wind Energy, Technical University of Denmark
Add Presentation Title in Footer via ”Insert”; ”Header & Footer”
Illustration of the 2 cases with Høvsøre data
prediction: + 1.76%
Case 1

DTU Wind Energy, Technical University of Denmark
Add Presentation Title in Footer via ”Insert”; ”Header & Footer”
Illustration of the 2 cases with Høvsøre data
prediction: + 1.76% prediction: 0.005%
Improved AEP estimation by using the equivalent wind speed both in
the power curve and the wind speed distribution.
Case 1 Case 2

DTU Wind Energy, Technical University of Denmark
Add Presentation Title in Footer via ”Insert”; ”Header & Footer”
BUT…
… what if the distribution of the rotor equivalent wind speed at the assessed site is not available?

DTU Wind Energy, Technical University of Denmark
Add Presentation Title in Footer via ”Insert”; ”Header & Footer”
More realistic application Power curve and wind distribution from 2 separate sites
Høvsøre
Østerild
DTU’s Test Site for Large Turbines Høvsøre

DTU Wind Energy, Technical University of Denmark
Add Presentation Title in Footer via ”Insert”; ”Header & Footer”
Power curve measured at Høvsøre in Feb-March 2009
Wind speed distribution measured at Østerild May 2010- May 2011
4 6 8 10 12 140
100
200
300
400
m s
nbho
urs
All
4 possible combinations, but no turbine yet.
More realistic application Power curve and wind distribution from 2 separate sites
DTU Wind Energy, Technical University of Denmark
Add Presentation Title in Footer via ”Insert”; ”Header & Footer”
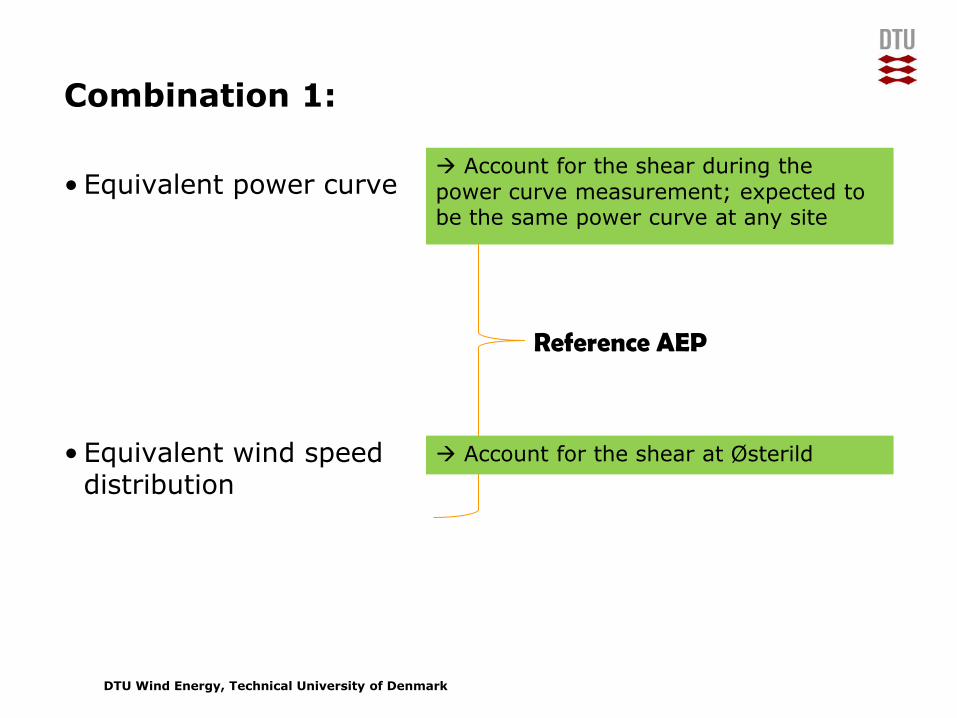
Combination 1:
• Equivalent power curve
• Equivalent wind speed distribution
Account for the shear during the
power curve measurement; expected to be the same power curve at any site
Account for the shear at Østerild
Reference AEP

DTU Wind Energy, Technical University of Denmark
Add Presentation Title in Footer via ”Insert”; ”Header & Footer”
Combination 2:
• Hub height power curve
• Hub height wind speed distribution
-2.3%
Underestimates the power produced
because of the shear during the power curve measurement.
Slightly underestimates the energy
available because does not account for the shear at Østerild (assumes constant wind speed profiles)
DTU Wind Energy, Technical University of Denmark
Add Presentation Title in Footer via ”Insert”; ”Header & Footer”
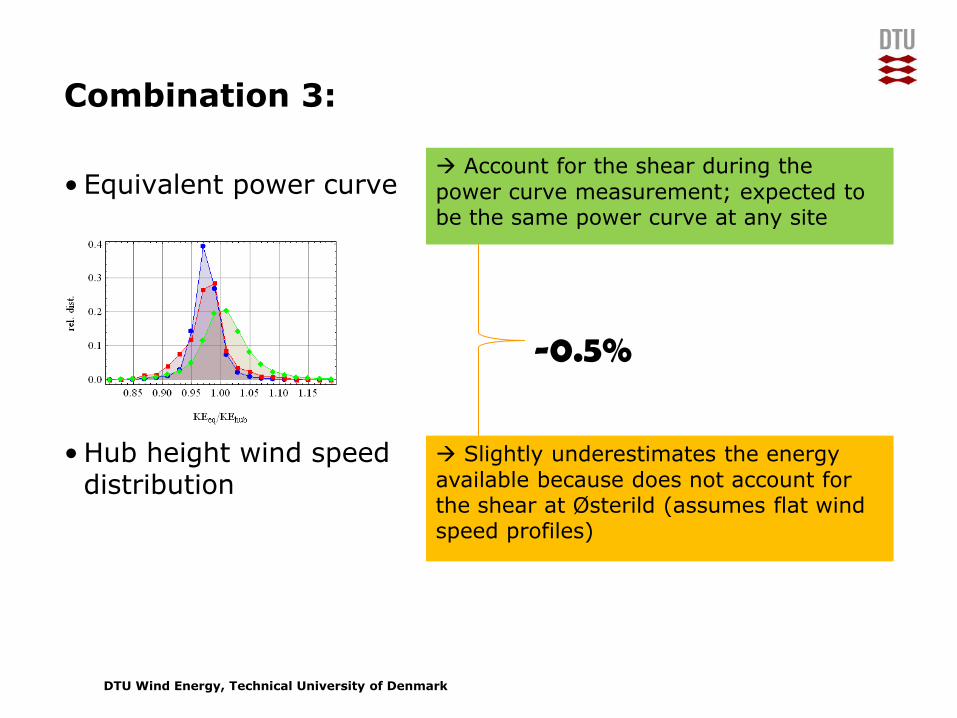
Combination 3:
• Equivalent power curve
• Hub height wind speed distribution
-0.5%
Account for the shear during the
power curve measurement; expected to be the same power curve at any site
Slightly underestimates the energy
available because does not account for the shear at Østerild (assumes flat wind speed profiles)

DTU Wind Energy, Technical University of Denmark
Add Presentation Title in Footer via ”Insert”; ”Header & Footer”
Summary
U_hub power curve Ueq power curve
U_hub distribution -2.3% -0.5%
U_eq distribution (ref)
The error depends both on: • the Ueq/Uhub distribution during the power curve measurement • and the Ueq/Uhub distribution at the assessed site

DTU Wind Energy, Technical University of Denmark
Add Presentation Title in Footer via ”Insert”; ”Header & Footer”
More examples
Ueq/Uhub> 1
Ueq/Uhub< 1

DTU Wind Energy, Technical University of Denmark
Add Presentation Title in Footer via ”Insert”; ”Header & Footer”
Case1: Ueq/Uhub> 1
U_hub power curve Ueq power curve
U_hub distribution (-3.8%) (-2.1%)
U_eq distribution (ref)
Profiles with larger kinetic energy than flat profiles
Part of the the error due to Ueq/Uhub distribution at the assessed site larger than before (-2.1%); Overall error larger than previous case.

DTU Wind Energy, Technical University of Denmark
Add Presentation Title in Footer via ”Insert”; ”Header & Footer”
Case2: Ueq/Uhub< 1
U_hub power curve Ueq power curve
U_hub distribution (0.00%) (+1.8%)
U_eq distribution (ref)
Profiles with smaller kinetic energy than flat profiles
Specific case: The Ueq/Uhub distribution are very similar for both datasets.
DTU Wind Energy, Technical University of Denmark
Add Presentation Title in Footer via ”Insert”; ”Header & Footer”
Conclusions 1
The shear influences the AEP estimation in 2 ways: 1) Error in power curve due to the shear during the power curve
measurement 2) Error in available energy at the assessed site.
Missing uncertainty terms in the standard AEP estimation
Equivalent wind speed results in a repeatable power curve.
Improved AEP estimation with equivalent wind speed
It requires to measure the wind speed profiles for site assessment

DTU Wind Energy, Technical University of Denmark
Add Presentation Title in Footer via ”Insert”; ”Header & Footer”
Conclusions 2
What to do if the equivalent wind speed distribution at the assessed site is not available?
If the Ueq/Uhub distributions at the two sites are similar: use the
standard AEP calculation (wind speed at hub height).
If the Ueq/Uhub distributions are different: combine the hub height speed distribution with the equivalent power curve.
But to know the Ueq/Uhub distribution… … you need to measure the shear!
Acknowledgement: EU SafeWind