equivalent per day (“boe/d”) weighted 40 percent to field ... · - 3 - rates as a result of...
TRANSCRIPT

1
First Quarter 2017 Highlights
Generated adjusted funds from operations of $8.2 million and realized net earnings of $8.4 million;
Produced an average of 8,198 barrels of oil equivalent per day (“boe/d”) weighted 40 percent to field condensate and natural gas liquids;
Increased production from the Bigstone Montney by 14 percent to 7,050 boe/d compared to 6,196 boe/d in the fourth quarter of 2016, as a result of a 33 percent or 773 barrels per day (“bbls/d”) increase in field condensate and natural gas liquids (“NGL”) production while natural gas volumes remained relatively flat;
Increased Montney field condensate and NGL yields to 130 barrels per million cubic feet (“bbls/mmcf”) in the first quarter of 2017 compared to 99 bbls/mmcf in the fourth quarter of 2016;
Montney field and plant condensate yield averaged 91 bbls/mmcf or 70 percent of the total 130 bbls/mmcf of Montney liquids yield;
Generated operating netback of $17.07 per boe before risk management contracts, up 150 percent from $6.82 for the same period in 2016;
Successfully drilled four gross (2.6 net) wells as part of the Company’s capital program and completed, tied-in and brought on production four gross (2.5 net) Montney wells in Bigstone;
Continued the two rig drilling program through spring break up that will result in an inventory of five gross (3.2 net) wells drilled and ready for completion operations as ground conditions improve;
Commenced the expansion of the existing Montney field dehydration and compression capacity at East and South Bigstone.
Operational Highlights
Three Months Ended March 31
Production 2017 2016 % Change
Field condensate (bbls/d) 1,933 1,700 14
Natural gas liquids (bbls/d) 1,302 1,335 (2)
Crude oil (bbls/d) 7 5 40
Total crude oil and natural gas liquids (bbls/d) 3,242 3,040 7
Natural gas (mcf/d) 29,737 32,127 (7)
Total (boe/d) 8,198 8,395 (2)
Financial Highlights ($ thousands except per unit amounts)
Three Months Ended March 31
2017 2016 % Change
Crude oil and natural gas sales 25,671 17,316 48
Realized sales price per boe 34.17 30.47 12
Funds from operations 8,166 8,190 -
Per boe 11.08 10.72 3
Per share – Basic and diluted 0.05 0.05 -
Net earnings 8,352 5,259 59
Per boe 11.32 6.89 64
Per share – Basic and diluted 0.05 0.03 67
Capital invested (30,297) 16,658 82
Disposition of properties (46) (4,583) (99)
Net capital invested 30,251 12,075 151

- 2 -
March 31, 2017 December 31, 2016 % Change
Net debt (1) 108,367 85,945 26
Total assets 325,607 303,625 7
Shares outstanding (000’s)
Basic 156,898 155,994 1
Diluted(2) 182,915 180,752 1
(1) Defined as the sum of bank debt and Senior Secured Notes plus (minus) the working capital deficit (surplus) excluding the current portion of the fair
value of the financial instruments.
(2) Represents the full dilution of all outstanding options and warrants.
MESSAGE TO SHAREHOLDERS
Delphi continues to execute the accelerated development plan of its liquids-rich Montney property (“Bigstone Montney”)
located at Bigstone in northwest Alberta, with two drilling rigs continuing to operate through spring break up on separate
pad locations. The Company was able to execute on its entire planned first quarter capital program, and will be in a position
to complete five (3.2 net) additional Montney wells as wet weather and spring break up conditions subside.
Production in the first quarter of 2017 averaged 8,198 boe/d, weighted 40 percent to field condensate and natural gas
liquids, compared to 8,395 boe/d during the first quarter of 2016. The Bigstone Montney production represented 86 percent
or 7,050 boe/d of the Company’s corporate production during the first quarter of 2017. As a result of the successful drilling
program, four gross (2.5 net) Montney wells were brought on-stream during the quarter, increasing corporate production
during April 2017 to average approximately 10,000 boe/d. Current production capability remains at the upper end of our
2017 annual production guidance of 9,000 to 9,500 boe/d.
The 14 percent or 854 boe/d increase in Bigstone Montney production to 7,050 boe/d in the first quarter of 2017 compared
to the fourth quarter of 2016 was largely a result of a 33 percent or 773 bbls/d increase in field condensate and natural gas
liquids production. Montney field and plant condensate yields averaged 91 bbls/mmcf of the total 130 bbls/mmcf liquids
yield. Increased condensate yields are a result of continued frac innovations and delineation of the Bigstone Montney
westward with the new wells being drilled.
The Company’s successful operating margin growth is a result of the high quality Bigstone Montney asset base, majority ownership in strategic infrastructure, firm take away capacity and proven expertise in developing this liquids-rich asset. The Company generated an operating netback of $17.07 per boe before risk management contracts, up 150 percent from $6.82 per boe during the comparative quarter of 2016.
During the first quarter of 2017, the Company invested gross field capital of $30.3 million. Net of carry capital costs of $9.1 million associated with the Partner Transaction already accounted for at December 31, 2016, the program was executed on budget. Delphi spent 78 percent of field capital on drilling, completing and equipping four gross (2.5 net) Montney wells at Bigstone. A pipeline loop was installed to the 7-11 facility to handle increased volumes being produced from the new wells that are extending the Montney development westward. In addition, the Company incurred costs to secure a 20 mmcf/d amine processing package and compressor for its amine project scheduled for commissioning in the first quarter of 2018.
Drilling activity on the Company’s Bigstone Montney asset continues with operations largely complete on the 14-09-60-23W5 (“14-09”) well (62 percent working interest). The 14-09 horizontal Montney well was drilled from spud to a total depth of 5,908 metres in a Company record 25 days. Innovations to the drilling program have resulted in decreased drilling times, on this most recent well, by 14 percent compared to the average well in 2016. These innovations will allow Delphi to absorb service cost inflation and maintain targeted drilling costs. A 40 stage completion liner was installed in the 2,863 metre horizontal lateral. Drilling operations continue in the horizontal lateral at the 16-18-59-23W5 (“16-18”) well (65 percent working interest) and are expected to be finished in the next two weeks. The 14-09 and 16-18 wells are both the second wells drilled from each of their respective wellsite pads. Completion operations on these two pads in addition to the 15-09-60-23W5 well (62 percent working interest) are scheduled to commence after spring break up utilizing the Company’s third and fourth generation frac designs.
Adjusted funds from operations in the first quarter of 2017 were $8.2 million or $0.05 per basic and diluted share, unchanged from the comparative quarter of 2016. Realized cash netbacks during the first quarter of 2017 were $11.08 per boe, including a $(0.62) per boe loss on risk management contracts. This compares to $10.72 per boe, including a $7.80 per boe realized gain on risk management contracts during the first quarter of 2016. Cash costs were higher in the first quarter due to a combination of non-recurring crown royalty, operating and general administrative charges, as well as higher crown royalty

- 3 -
rates as a result of higher commodity prices, and additional pro-rated operating costs for the scheduled SemCAMS K3 processing plant turnaround in the second quarter of 2017.
At March 31, 2017, the Company had bank debt of $32.0 million and a working capital deficit of $23.1 million. Including the Senior Secured Notes, the Company had total net debt of $108.4 million. As at March 31, 2017, Delphi had $42.2 million (net of outstanding letters of credit) available to be drawn on its $80 million senior credit facility. Risk Management
The Company has approximately 22 million cubic feet per day (“mmcf/d”), or 65% of its remainder of 2017 forecast natural gas production hedged at an average price of CDN$4.20 per million British thermal units (“mmbtu”) and approximately 900 bbls/d of condensate hedged at an average WTI price of CDN$66.67 per barrel. Delphi has mitigated the persistent widening of the AECO and Station 2 basis differentials by contracting most of its gas into the Chicago market where pricing has materially outperformed local western Canada pricing, even with the incremental transportation costs.
Natural Gas Q2 – Q4/17 2018 2019
Percent Hedged * 65% 54% 21%
Hedge Price (CDN $/mmbtu) $4.20 $3.92 $3.89
Crude Oil Q2 – Q4/17 2018 2019
Percent Hedged * 42% 14% 14%
Hedge Price (WTI CDN $/bbl) $66.67 $70.00 $70.00
* Based on average 2017 production of 33.5 mmcf/d of natural gas and 2,150 bbls/d of field condensate.
Outlook
The Company continues to forecast absolute and per share growth across all measures during 2017, while maintaining balance sheet strength. The 2017 guidance is highlighted by a significant increase in drilling activity.
Delphi has secured the required firm service transportation for 100 percent of forecasted 2017 natural gas production growth. The contracted Alliance full path service to Chicago with its incremental priority interruptible service handles approximately 95 percent of the Company’s natural gas sales, and together with the existing and incremental 2018 contracted firm TCPL service, will provide the Company with firm service to handle accelerated growth plans beyond 2017. Delphi’s Bigstone Montney field compression and dehydration facilities are also sufficient for the forecasted growth in 2017.
Delphi will have five (3.2 net) Montney wells ready to complete and bring on production over the next two months as spring break up conditions subside and has plans to drill an additional five (3.3 net) wells during the second half of 2017.
To handle the Company’s growing production volumes beyond 2017, Delphi is working to cost effectively expand its existing Montney field dehydration and compression capacity at East and South Bigstone. Delphi is well positioned to achieve increased production, cash flow and reserve growth over the near and long term to the benefit of all our stakeholders.
The existing Board of Directors looks forward to the addition of Mr. Glenn A. Hamilton, Mr. Peter T. Harrison, and Mr. Ian Wild to the Board of Directors. “Glenn, Peter and Ian bring tremendous depth to our Board with their extensive experience in oil and gas accounting, finance, banking and investment,” said David J. Reid, President and CEO. “And together with the Company’s new CFO, Mr. Mark Behrman, we have significantly strengthened our team to continue to successfully pursue ambitious growth plans”.
On behalf of the Board of Directors and all the employees of Delphi, we would like to thank our shareholders for their continued support.
On behalf of the Board,
David J. Reid, President and Chief Executive Officer May 10, 2017

- 4 -
MANAGEMENT’S DISCUSSION AND ANALYSIS
(All tabular amounts are stated in thousands of dollars, except per unit amounts)
Management’s discussion and analysis (“MD&A”) has been prepared by management and reviewed and approved by the Board of Directors of Delphi Energy Corp. (“Delphi” or “the Company”). The discussion and analysis is a review of the financial position and results of operations of the Company. Its focus is primarily a comparison of the financial performance for the three months ended March 31, 2017 and 2016 and should be read in conjunction with the unaudited condensed consolidated interim financial statements and accompanying notes for the three months ended March 31, 2017 and 2016 and the audited consolidated financial statements and accompanying notes for the years ended December 31, 2016 and 2015 and the related MD&A. The unaudited condensed consolidated interim financial statements have been prepared in accordance with International Accounting Standard (“IAS”) 34, Interim Financial Reporting. The reporting currency is the Canadian dollar. The discussion and analysis have been prepared as of May 9, 2017.
For the purpose of reporting production information, reserves and calculating unit prices and costs, natural gas volumes have been converted to a barrel of oil equivalent (“boe”) using six thousand cubic feet equal to one barrel. A boe conversion ratio of 6:1 is based upon an energy equivalency conversion method primarily applicable at the burner tip and does not represent a value equivalency at the wellhead. This conversion conforms to the Canadian Securities Administrators’ National Instrument 51-101 when boes are disclosed. Boes may be misleading, particularly if used in isolation.
Management uses certain measures that are not recognized under IFRS to help evaluate the performance of the Company. The following are terms and definitions contained within this MD&A that are not recognized measures under IFRS:
Adjusted funds from operations - cash flow from operating activities before accretion on bank debt and subordinated debt, decommissioning expenditures and changes in non-cash working capital from operating activities. Management uses adjusted funds from operations to analyze performance and considers it a key measure as it demonstrates the Company’s ability to generate the cash necessary to fund future capital investments and to repay debt. Delphi’s determination of adjusted funds from operations may not be comparable to that reported by other companies nor should it be viewed as an alternative to cash flow from operating activities, net earnings (loss) or other measures of financial performance calculated in accordance with IFRS.
Adjusted funds from operations per share – adjusted funds from operations divided by the number of common shares outstanding calculated using weighted average shares outstanding consistent with the calculation of earnings (loss) per share.
Adjusted working capital ratio – current assets include the undrawn portion of the senior credit facility, less outstanding letters of credit, and exclude the current portion of the fair value of financial instruments. Current liabilities exclude the current portion of long term debt and the current portion of the fair value of financial instruments. This ratio is used to calculate the Company’s compliance with its working capital ratio covenant.
Net debt – the sum of bank debt and Senior Secured Notes (minus) the working capital deficit (surplus) excluding the current portion of the fair value of the financial instruments. Net debt is used by management to monitor the remaining availability under its credit facilities.
Management considers netbacks as an important measure of the cash generating capability of the produced volumes. Netbacks are generally discussed and presented on a per boe basis.
Operating netbacks – crude oil and natural gas sales plus realized gains (losses) on financial instruments less royalties, operating and transportation costs. Management considers operating netbacks per boe an important measure of profitability relative to current commodity prices and costs of production.
Cash netbacks - operating netbacks less interest on bank debt and Senior Secured Notes, general and administrative costs and cash costs related to the Company’s restricted share units. Management considers cash netbacks per boe an important measure as it demonstrates the cash realized on each unit of production to be reinvested in future capital investment or repay debt.
Senior Secured Notes – ten percent Collateralized Exchange Listed Notes (“Senior Secured Notes”) to term out, over a period of five years.

- 5 -
DELPHI’S OPERATIONS
What is the nature of Delphi’s business and where are its operations?
Delphi is a publicly-traded company with its corporate office in Calgary, Alberta, Canada. Delphi is engaged in the exploration for, development and production of crude oil and natural gas from properties and assets located in Western Canada in which it holds an interest. The Company’s operations are concentrated in the Deep Basin of Northwest Alberta. The Company’s core area in the Deep Basin is located at Bigstone, producing in excess of 95 percent of the Company’s production.
FIRST QUARTER 2017 ACCOMPLISHMENTS
What were the highlights of Delphi’s operational and financial results for the first quarter of 2017?
In the first quarter of 2017, the Company achieved the following:
Successfully drilled four gross (2.6 net) wells as part of the Company’s capital program and completed, tied-in and brought on production four gross (2.5 net) Montney wells in East Bigstone;
Generated operating netback of $17.07 per boe before gains (losses) on risk management contracts, up 150 percent from $6.82 for the same period in 2016:
Generated adjusted funds from operations of $8.2 million and realized net earnings of $8.4 million;
Produced an average of 8,198 barrels of equivalent per day (“boe/d”) weighted 40 percent to field condensate and natural gas liquids;
Increased Montney natural gas liquids (“NGL”) and field condensate yields to 130 barrels per million cubic feet (“bbls/mmcf”) in the first quarter of 2017 compared to 99 bbls/mmcf in the fourth quarter of 2016.
FIRST QUARTER 2017 OPERATIONAL AND FINANCIAL RESULTS
LIQUIDITY AND CAPITAL RESOURCES
Sources and Uses of Funds
Three Months Ended
March 31, 2017
Sources:
Cash and cash equivalents 1,580
Adjusted funds from operations 8,166
Disposition of properties 46
Accretion of bank debt 13
Exercise of stock options 1,041
Change in non-cash working capital 13,659
24,505
Uses:
Capital expenditures 30,297
Expenditures on decommissioning 1,208
31,505
Change in bank debt 7,000
- 6 -
Net Debt
What is liquidity risk and how does the Company manage this risk?
As an oil and gas business, Delphi has a declining asset base and therefore relies on oil and gas property development and acquisitions to replace produced reserves. Future oil and natural gas production and growth in reserves are highly dependent on the success of exploiting the Company’s existing asset base and/or acquiring additional lands or reserves. To the extent Delphi is successful or unsuccessful in these operations, cash flow could be increased or reduced.
Liquidity risk is the risk that Delphi will not be able to meet its financial obligations as they become due. The Company’s financial liabilities arise through the cost of operations and the capital program in order to maintain or increase production and develop reserves, the acquisition of crude oil and natural gas assets, financial instrument contracts and borrowings under the Company’s credit facilities.
Delphi actively manages its liquidity through daily, short term and long term cash, debt and equity management strategies. Such strategies encompass, among other factors: having adequate sources of financing available through its bank credit facilities, forecasting future cash generated from operations based on reasonable production and pricing assumptions, monitoring economic risk management opportunities and maintaining sufficient cash flows for compliance with financial debt covenants.
Delphi generally relies on operating cash flows and its credit facilities to fund ongoing capital requirements and provide liquidity. Future liquidity depends primarily on cash flow generated from operations, existing credit facilities and the ability to access debt and equity markets. From time to time, the Company accesses capital markets to meet its additional financing needs and to maintain flexibility in funding its capital expenditures program. There can be no assurance that future debt financings, equity financings or cash generated from operations will be available or sufficient to meet these or other corporate requirements. If debt or equity financing is available, there is no assurance that it will be on terms acceptable to Delphi.
Delphi’s results are affected by external market and risk factors, such as fluctuations in the prices of crude oil and natura l gas, movements in foreign currency exchange rates and inflationary (deflationary) pressures on service costs. Volatility in crude oil and natural gas prices continues resulting in a challenging environment for the energy sector. In response to this volatility and to preserve financial flexibility, Delphi took a conservative approach to its capital spending plan until the fourth quarter of 2016 when it entered into a strategic agreement. The agreement consisted of partner equalizations into certain working interests in the Bigstone area for $34.6 in proceeds and a carry capital program where our partner will contribute $20.0 million for drilling and completion costs. In the first quarter of 2017, the Company’s net capital expenditures were $30.3 million, partially funded with $9.1 million of the carry capital proceeds.
Delphi continuously monitors commodity prices and has an active commodity price risk management program in order to reduce its exposure to fluctuations in commodity prices and protect its future cash flows.
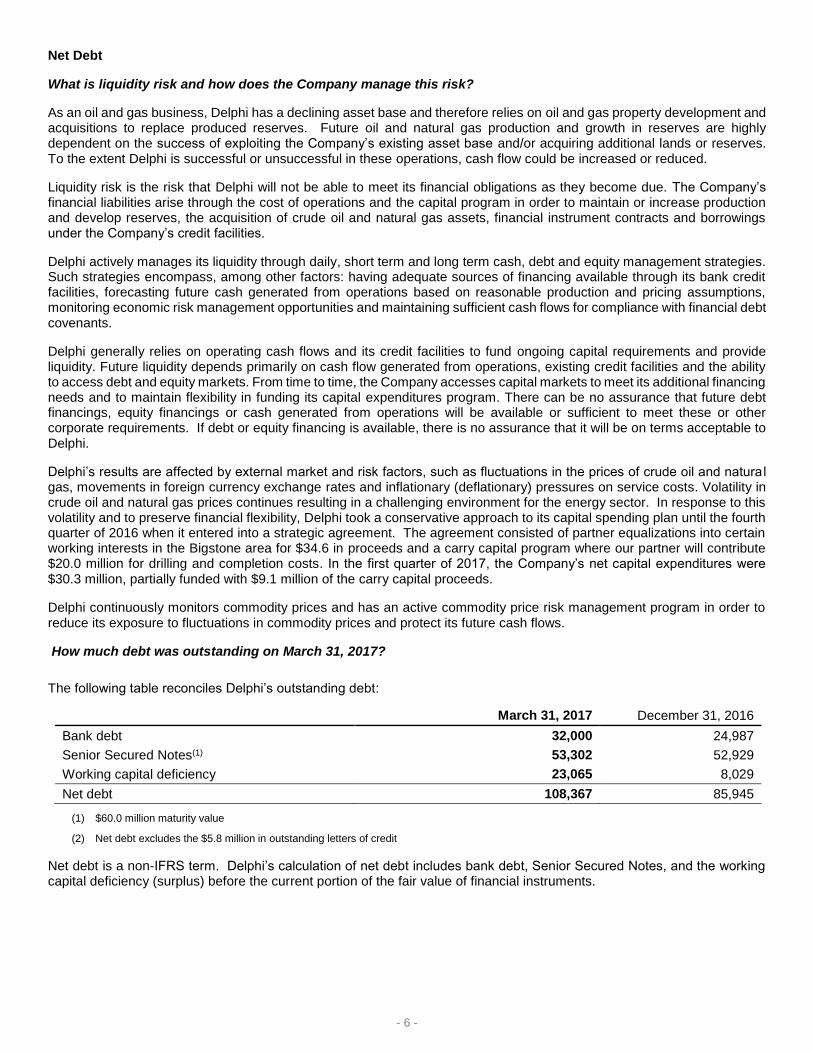
How much debt was outstanding on March 31, 2017?
The following table reconciles Delphi’s outstanding debt:
March 31, 2017 December 31, 2016
Bank debt 32,000 24,987
Senior Secured Notes(1) 53,302 52,929
Working capital deficiency 23,065 8,029
Net debt 108,367 85,945
(1) $60.0 million maturity value
(2) Net debt excludes the $5.8 million in outstanding letters of credit
Net debt is a non-IFRS term. Delphi’s calculation of net debt includes bank debt, Senior Secured Notes, and the working capital deficiency (surplus) before the current portion of the fair value of financial instruments.

- 7 -
What are the Company’s credit facilities and related covenants and when is the next scheduled review of the borrowing base?
Senior Credit Facility
In January of 2017, Delphi entered into a new $80.0 million senior secured credit facility consisting of a $12.5 million operating facility and a $67.5 million revolving facility with a new banking syndicate.
The Company’s new senior credit facility with a syndicate of Canadian chartered banks is subject to the banks’ semi-annual review of the Company’s crude oil and natural gas properties. The facility is a 364 day committed facility available on a revolving basis until May 31, 2017 at which time it may be extended at the lenders’ option. If the revolving period is not extended, the undrawn portion of the facility will be cancelled and the amount outstanding would be required to be repaid at the end of the non-revolving term being May 31, 2018. The non-extension provisions are applicable to the lenders on an individual basis.
Interest payable on amounts drawn under the facility is at the prevailing bankers’ acceptance or LIBOR rates plus stamping fees, lenders’ prime rate or U.S. base rate plus the applicable margins, depending on the form of borrowing by the Company. The applicable margins and stamping fees are based on a sliding scale pricing grid tied to the Company’s trailing debt to earnings before interest, taxes, depreciation and amortization ratio: from a minimum of the bank’s prime rate or U.S. base rate plus 1.00 percent to a maximum of the bank’s prime rate or U.S. base rate plus 3.00 percent or from a minimum of bankers’ acceptances or LIBOR rate plus a stamping fee of 2.00 percent to a maximum of bankers’ acceptances rate plus a stamping fee of 4.00 percent.
The new senior credit facility is secured by a $200.0 million demand floating charge debenture and a general security agreement over all assets of the Company.
The annual review of the Company’s $80.0 million extendible revolving term credit facility is currently underway and is expected to be completed on or before May 31, 2017. The borrowing base of the facilities will be based on the lenders’ evaluation of the Company’s petroleum and natural gas reserves at the time and commodity prices. A decrease in the borrowing base could result in a reduction to the credit facility, which may require a repayment to the lenders.
As at March 31, 2017, Delphi had $42.2 million (net of outstanding letters of credit) available to be drawn on the senior credit facility.
The senior credit facility is subject to the following financial covenant: Financial covenant
Requirement
As at March 31, 2017
Adjusted working capital ratio > 1.0 1.4
Delphi was in compliance with all covenants as at March 31, 2017.
Adjusted working capital ratio As at March 31, 2017
Current assets 30,683
Exclusion of the current fair value of financial instruments (163)
Undrawn portion of senior credit facility 42,200
72,720
Current liabilities 54,880
Exclusion of the current fair value of financial instruments (1,295)
53,585
Adjusted working capital ratio 1.4

- 8 -
Senior Secured Notes
On June 15, 2016, Delphi issued $60.0 million of 10 percent Senior Secured Notes with attached warrants. The Company issued 60 thousand units with each unit consisting of a $1,000 note and 245 warrants. The Senior Secured Notes mature on July 15, 2021. Interest is payable quarterly to the holders of record on the immediately preceding April 1, July 1, October 1 and January 1. The Senior Secured Notes are redeemable at the Company’s option, in whole or part, commencing June 15, 2018 at the following specified redemption prices (expressed as a percentage of the principal amount): 2018 at 107.5 percent, 2019 at 105.0 percent and 2020 and thereafter at 100.0 percent. Prior to June 15, 2018, Delphi has the option to redeem up to 50 percent of the Senior Secured Notes at a redemption price of 110.0 percent plus accrued interest with an amount of cash not greater than the net cash proceeds of certain equity offerings.
The Senior Secured Notes are secured on a second-priority basis by substantially all of the Company’s assets and are subordinate to indebtedness under the senior credit facility.
The Senior Secured Notes are presented net of debt issue costs of $3.4 million and will be accreted at an effective interest rate of 12.8 percent such that the carrying amount of the Senior Secured Notes will equal the principal amount of $60.0 million at maturity. The Senior Secured Notes were initially recognized at fair value based on similar debt securities without the warrant feature, net of debt issue costs and subsequently are carried at amortized cost. The principal amount of the Senior Secured Notes less the initial fair value has been allocated to the warrants.
The Senior Secured Notes have no financial covenants but have an incurrence covenant in place that limits the Company’s ability to among other things (subject to certain exceptions, limitations and qualifications); to make certain restricted payments and investments; incur additional debt; create liens; restrict dividends or other payments; consolidate, merge, sell, or otherwise dispose of all or substantially all of its assets and enter into certain transactions with affiliates.
The Senior Secured Notes contain an incurrence covenant for an interest coverage ratio. The requirement is an interest coverage ratio of not less than 2.0 to 1.0 determined on a 12 month rolling basis. Delphi was in compliance with this covenant at March 31, 2017.
Interest coverage ratio Twelve Months Ended
March 31, 2017 Twelve Months Ended
December 31, 2016
Adjusted funds from operations 29,372 29,867
Interest charges 10,370 9,617
39,742 39,484
Interest charges 10,370 9,617
Financing charges 1,324 1,079
11,694 10,696
Interest coverage ratio 3.4 3.7
Share Capital
How many common shares and stock options are currently outstanding?
As at May 9, 2017, the Company had 157.7 million common shares outstanding, 10.6 million stock options outstanding, and 14.7 million warrants outstanding. The stock options have an average exercise price of $1.52 per option and the warrants have an exercise price of $1.40 per warrant.

- 9 -
What has been the market activity in the Company’s common shares?
The common shares of Delphi trade on the TSX under the symbol DEE. The following table summarizes outstanding share data for the three months ended March 31, 2017:
Three Months Ended
March 31, 2017
Weighted Average Common Shares (in thousands)
Basic 156,790
Diluted 159,775
Trading Statistics (1)
High 1.74
Low 1.21
Average daily volume (in thousands) 416,919
(1) Trading statistics based on closing price.
BUSINESS ENVIRONMENT
What external factors of the business environment did the Company have to contend with in the first quarter of 2017?
The table below outlines the changes in the various benchmark commodity prices and economic parameters which affect the prices received for the Company’s production.
Benchmark Prices and Economic Parameters
Three Months Ended March 31
2017 2016 % Change
Natural Gas
NYMEX (US $/mmbtu) 3.31 2.04 62
Chicago City Gate (US $/mmbtu) 3.40 2.25 51
AECO (CDN $/mcf) 2.70 1.83 48
Crude Oil
West Texas Intermediate (US $/bbl) 51.86 33.58 54
Edmonton Light (CDN $/bbl) 63.91 40.85 56
Foreign Exchange
Canadian to U.S. dollar 0.76 0.73 4
U.S. to Canadian dollar 1.32 1.38 4
Natural Gas
Delphi ships the majority of its natural gas production through the Alliance pipeline system into the Chicago market.
The Chicago City Gate benchmark natural gas price has increased 51 percent in the three months ended March 31, 2017, in comparison to the same period in 2016. Natural gas storage levels are lower than 2016 as a result of lower North American production and increased Mexican and LNG exports partially offset by lower consumption for power production. This has resulted in stronger demand which has caused natural gas prices to increase in comparison to the same period in 2016.
Natural Gas Liquids
Natural gas liquids include ethane, propane, butane, pentane and plant condensate and are generally priced off light oil and natural gas prices. Ethane prices are correlated to natural gas prices while propane and butane prices trade at a discount to light oil prices depending on supply/demand conditions. Propane pricing has improved significantly from the first quarter of 2016 due to significant draws through winter. Inventory levels are down from the same period last year. Natural gas liquids pricing has generally been supported by improvements in West Texas Intermediate (“WTI”) in comparison to 2016.
- 10 -
Crude Oil
Global supply/demand fundamentals for crude oil have continued to improve since the first two quarters of 2016. WTI averaged 54 percent higher in the three months ended March 31, 2017, in comparison to the same period in 2016. The stronger prices are supported by OPEC’s commitment to cut production in the first half of 2017.
Canadian prices experienced a small tightening of basis differential as well as an increase in the Canadian to U.S. dollar exchange rate. Edmonton Light averaged $63.91 per barrel in the first quarter of 2017, up 56 percent compared to the same period in 2016.
Canadian/United States Exchange Rate
The value of the Canadian dollar against its U.S. counterpart averaged $0.76 for the three months ended March 31, 2017, a four percent increase in comparison to the same period in 2016. As a producer of crude oil, an increase in the Canadian dollar has a negative effect on the price received for production.
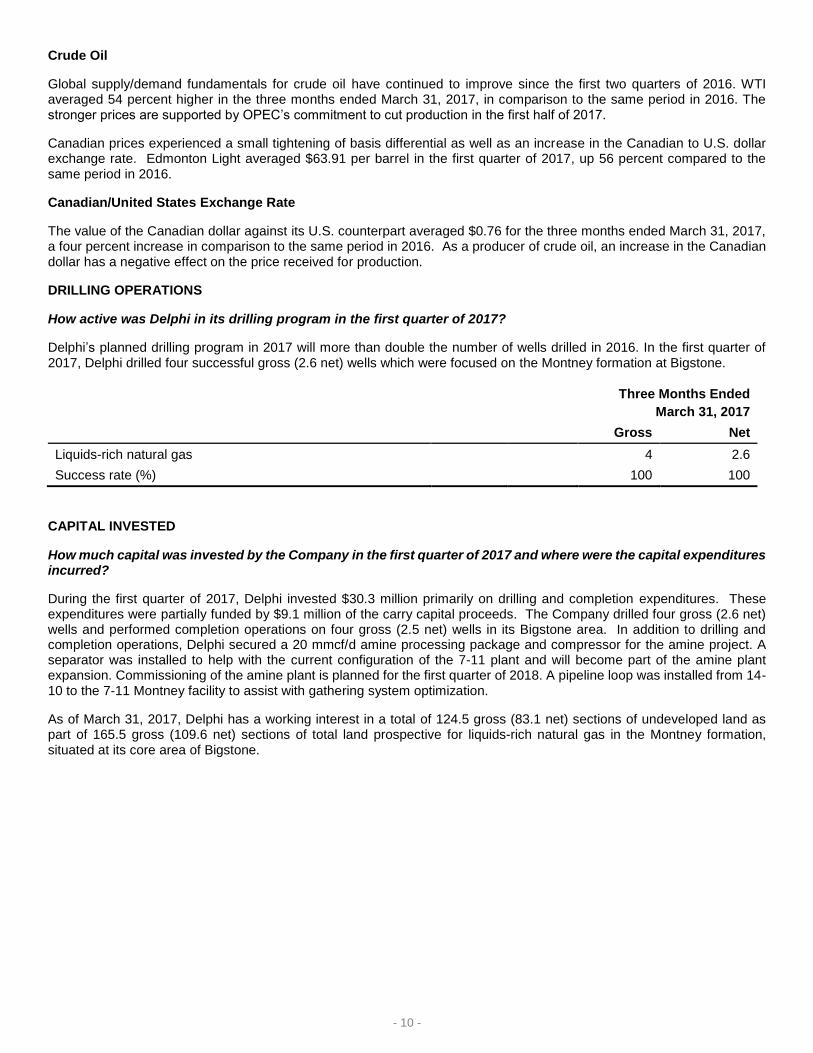
DRILLING OPERATIONS
How active was Delphi in its drilling program in the first quarter of 2017?
Delphi’s planned drilling program in 2017 will more than double the number of wells drilled in 2016. In the first quarter of 2017, Delphi drilled four successful gross (2.6 net) wells which were focused on the Montney formation at Bigstone.
Three Months Ended
March 31, 2017
Gross Net
Liquids-rich natural gas 4 2.6
Success rate (%) 100 100
CAPITAL INVESTED
How much capital was invested by the Company in the first quarter of 2017 and where were the capital expenditures incurred?
During the first quarter of 2017, Delphi invested $30.3 million primarily on drilling and completion expenditures. These expenditures were partially funded by $9.1 million of the carry capital proceeds. The Company drilled four gross (2.6 net) wells and performed completion operations on four gross (2.5 net) wells in its Bigstone area. In addition to drilling and completion operations, Delphi secured a 20 mmcf/d amine processing package and compressor for the amine project. A separator was installed to help with the current configuration of the 7-11 plant and will become part of the amine plant expansion. Commissioning of the amine plant is planned for the first quarter of 2018. A pipeline loop was installed from 14-10 to the 7-11 Montney facility to assist with gathering system optimization.
As of March 31, 2017, Delphi has a working interest in a total of 124.5 gross (83.1 net) sections of undeveloped land as part of 165.5 gross (109.6 net) sections of total land prospective for liquids-rich natural gas in the Montney formation, situated at its core area of Bigstone.

- 11 -
Three Months Ended March 31
2017 2016 % Change
Land 2,088 - 100
Seismic 10 2 400
Drilling, completions and equipping 23,515 11,917 97
Facilities 4,333 4,326 -
Capitalized expenses 351 407 (14)
Other - 6 (100)
Capital invested 30,297 16,658 82
Disposition of properties (46) (4,583) (99)
Net capital invested 30,251 12,075 151
PRODUCTION
What factors contributed to the production volumes?
Production volumes in the first quarter of 2017 averaged 8,198 boe/d, a two percent decrease over the comparative quarter in 2016, and an 11 percent increase from the 2016 fourth quarter production of 7,392 boe/d. Production volumes in the first quarter of 2017 compared to the same quarter of 2016 decreased primarily due to natural production declines as well as the 2016 fourth quarter disposition. The disposition included a 35% working interest in certain wells in the Bigstone area. The lower volumes were offset by incremental production from the six (3.8) Bigstone wells that were brought on-stream in the fourth quarter of 2016 and the first quarter of 2017.
Delphi’s production portfolio for the first quarter of 2017 was weighted 24 percent to field condensate, 16 percent to natural gas liquids and 60 percent to natural gas. This compares to a production portfolio for the comparative quarter in 2016 weighted 20 percent to field condensate, 16 percent to natural gas liquids and 64 percent to natural gas. For the three months ended March 31, 2017, field condensate as a percentage of total crude oil and natural gas liquids was 60 percent compared to 56 percent in first quarter of 2016.
Three Months Ended March 31
2017 2016 % Change
Field condensate (bbls/d) 1,933 1,700 14
Natural gas liquids (bbls/d) 1,302 1,335 (2)
Crude oil (bbls/d) 7 5 40
Total crude oil and natural gas liquids 3,242 3,040 7
Natural gas (mcf/d) 29,737 32,127 (7)
Total (boe/d) 8,198 8,395 (2)
REALIZED SALES PRICES
What sales prices were realized by the Company for each of its products?
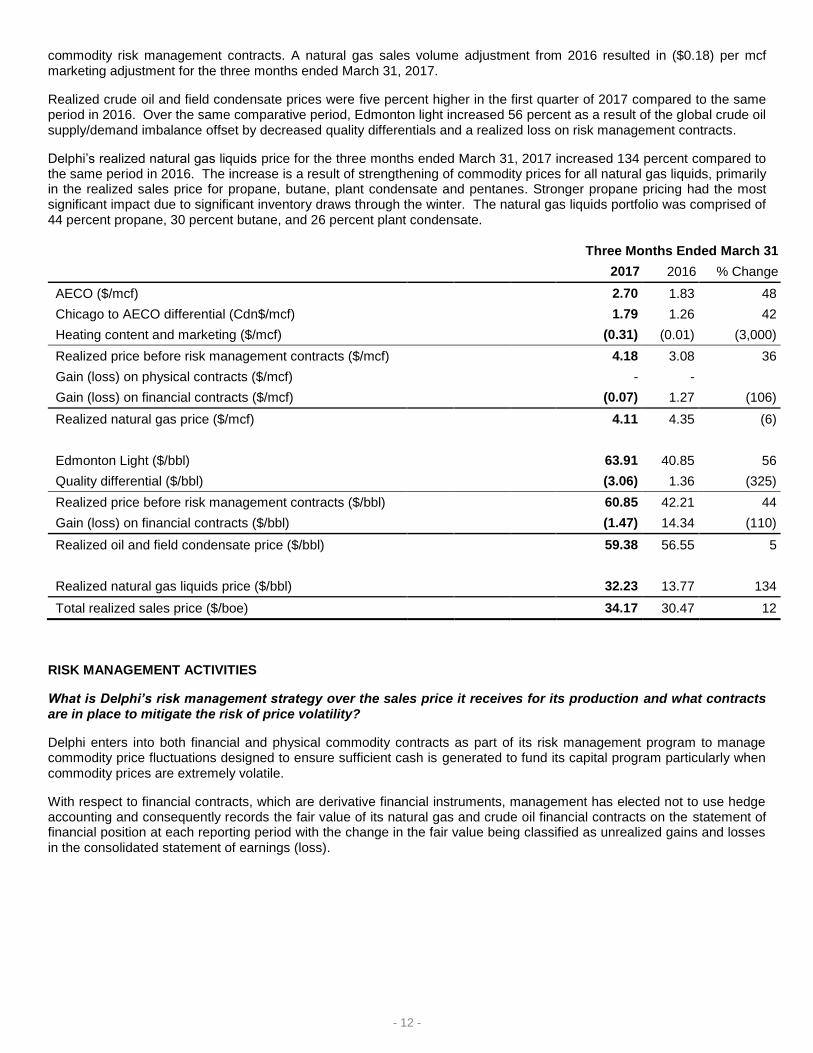
For the three months ended March 31, 2017, Delphi’s average realized sales price per boe increased twelve percent in comparison to the same period in 2016. Pricing for all commodities have increased in the first quarter of 2017 versus the same comparative period in 2016.
Delphi ships the majority of its natural gas production through the Alliance pipeline system into the Chicago market. This allows Delphi to sell its natural gas into a market where a more balanced supply and demand exist while receiving the benefits of a lower Canadian dollar against its U.S. counterpart as opposed to selling its natural gas in the predominant supply market of Western Canada.
Realized natural gas prices in the first quarter of 2017 decreased by 6 percent compared to the same period in 2016. The realized price before risk management contracts was 36 percent higher than the same period in 2016 due to the increased AECO price and the Canadian dollar equivalent Chicago City Gate benchmark price offset by realized losses on financial
- 12 -
commodity risk management contracts. A natural gas sales volume adjustment from 2016 resulted in ($0.18) per mcf marketing adjustment for the three months ended March 31, 2017.
Realized crude oil and field condensate prices were five percent higher in the first quarter of 2017 compared to the same period in 2016. Over the same comparative period, Edmonton light increased 56 percent as a result of the global crude oil supply/demand imbalance offset by decreased quality differentials and a realized loss on risk management contracts.
Delphi’s realized natural gas liquids price for the three months ended March 31, 2017 increased 134 percent compared to the same period in 2016. The increase is a result of strengthening of commodity prices for all natural gas liquids, primarily in the realized sales price for propane, butane, plant condensate and pentanes. Stronger propane pricing had the most significant impact due to significant inventory draws through the winter. The natural gas liquids portfolio was comprised of 44 percent propane, 30 percent butane, and 26 percent plant condensate.
Three Months Ended March 31
2017 2016 % Change
AECO ($/mcf) 2.70 1.83 48
Chicago to AECO differential (Cdn$/mcf) 1.79 1.26 42
Heating content and marketing ($/mcf) (0.31) (0.01) (3,000)
Realized price before risk management contracts ($/mcf) 4.18 3.08 36
Gain (loss) on physical contracts ($/mcf) - -
Gain (loss) on financial contracts ($/mcf) (0.07) 1.27 (106)
Realized natural gas price ($/mcf) 4.11 4.35 (6)
Edmonton Light ($/bbl) 63.91 40.85 56
Quality differential ($/bbl) (3.06) 1.36 (325)
Realized price before risk management contracts ($/bbl) 60.85 42.21 44
Gain (loss) on financial contracts ($/bbl) (1.47) 14.34 (110)
Realized oil and field condensate price ($/bbl) 59.38 56.55 5
Realized natural gas liquids price ($/bbl) 32.23 13.77 134
Total realized sales price ($/boe) 34.17 30.47 12
RISK MANAGEMENT ACTIVITIES
What is Delphi’s risk management strategy over the sales price it receives for its production and what contracts are in place to mitigate the risk of price volatility?
Delphi enters into both financial and physical commodity contracts as part of its risk management program to manage commodity price fluctuations designed to ensure sufficient cash is generated to fund its capital program particularly when commodity prices are extremely volatile.
With respect to financial contracts, which are derivative financial instruments, management has elected not to use hedge accounting and consequently records the fair value of its natural gas and crude oil financial contracts on the statement of financial position at each reporting period with the change in the fair value being classified as unrealized gains and losses in the consolidated statement of earnings (loss).

- 13 -
A summary of the Company’s financial commodity price risk management contracts are as follows:
Natural Gas and Crude Oil Contracts
Time Period Type of Contract
Average Quantity
Contracted Average Price
($/unit) Referenc
e
December 2015 – December 2017
Natural Gas – fixed 5,000 mmbtu/d $3.55 U.S. NYMEX
January 2017 – December 2017
Natural Gas – fixed 2,500 mmbtu/d $3.86 U.S. NYMEX
January 2017 – December 2017
Natural Gas – fixed 2,500 GJ/d $3.75 Cdn AECO
January 2017 – December 2017
Natural Gas – fixed 4,500 mmbtu/d $4.02 Cdn NYMEX
January 2017 – December 2017
Natural Gas – fixed 2,096 mmbtu/d $2.95 U.S. NYMEX
January 2017 – December 2018
Natural Gas – fixed 3,000 mmbtu/d $2.77 U.S. NYMEX
April 2017 – October 2018 Natural Gas – fixed 2,500 mmbtu/d $4.16 Cdn NYMEX
January 2018 – December 2018
Natural Gas – fixed 3,000 mmbtu/d $4.01 Cdn NYMEX
January 2018 – December 2019
Natural Gas – fixed 2,000 mmbtu/d $4.02 Cdn NYMEX
January 2018 – December 2019
Natural Gas – fixed 5,000 mmbtu/d $3.84 Cdn NYMEX
January 2017 – December 2017
Crude Oil – fixed 300 bbls/d $60.00 Cdn WTI
January 2017 – December 2017
Crude Oil – fixed 300 bbls/d $70.00 Cdn WTI
January 2017 – December 2019
Crude Oil – fixed 300 bbls/d $70.00 Cdn WTI
Subsequent to March 31, 2017, Delphi entered into the following commodity risk management contract:
Time Period Type of Contract
Quantity Contracted Price ($/unit) Reference
January 2018 – December 2018
Financial – fixed 2,500 mmbtu/d $4.17 Cdn NYMEX
Basis Differential Contracts
Delphi ships the majority of its natural gas production through the Alliance pipeline system into the Chicago market. As a result, the Company has entered into Chicago – NYMEX basis differential contracts in order to fix the Chicago price on a portion of its production.
Time Period Type of Contract
Quantity Contracted
Differential (U.S. $/unit)
December 2015 – December 2017
Chicago – NYMEX differential
2,500 mmbtu/d $0.005
What has the Company done to mitigate the effects of foreign exchange rate fluctuations?
Delphi sells the majority of its natural gas in the Chicago market in U.S. dollars. In order to mitigate the U.S. to Canadian dollar fluctuation, Delphi has entered into the following U.S. dollar forward exchange contracts:

- 14 -
Time Period
Average Notional U.S. $
Average Exchange Rate (U.S.$ to Cdn$)
May 2015 – December 2018 250.0 1.2574
December 2015 – November 2017 200.0 1.2500
January 2016 – December 2017 200.0 1.3050
January 2016 – December 2017 200.0 1.3075
January 2016 – December 2017 300.0 1.3005
January 2017 – December 2017 85.4 1.3476
January 2017 – December 2017 55.0 1.3800
What has the Company done to protect itself against an increase in interest rates?
Delphi has entered into the following interest rate swaps to mitigate interest rate volatility on bank debt:
Time Period Notional $ Fixed Interest Rate
May 2015 to April 2017 30,000 0.875%
February 2016 to January 2018 30,000 0.630%
February 2016 to January 2018 15,000 0.640%
What is the fair value of Delphi’s risk management contracts?
The fair value of the financial contracts outstanding as at March 31, 2017 is estimated to be a liability of approximately $0.1 million. The fair values of these contracts are based on an approximation of the amounts that would have been paid to or received from counterparties to settle the contracts outstanding at the end of the period having regard to forward prices and market values provided by independent sources. Due to the inherent volatility in commodity prices, foreign exchange and interest rates, actual amounts realized may differ from these estimates.
For the three months ended March 31, 2017, the change in the fair values of the outstanding derivative commodity contracts resulted in an unrealized gain on its risk management contracts of $8.9 million. The unrealized gain recognized for the three months ended March 31, 2017 is the difference between the fair values of the risk management contracts outstanding as at March 31, 2017 and the fair values as at December 31, 2016.
The Company accounts for Canadian dollar physical sales contracts, which were entered into and continue to be held for the purpose of delivery of production, in accordance with its expected sale requirements as executory contracts on an accrual basis rather than as non-financial derivatives.
REVENUE
How do revenues in the first quarter of 2017 compare to 2016 and what factors contributed to the change?
Delphi generated revenue of $25.7 million in the first quarter of 2017, a 48 percent increase over the comparative period in 2016. The increase in revenues is largely due to the strengthening of the benchmark prices for all market commodities, and offset slightly by lower production volumes. Field condensate and natural gas liquids contributed approximately 56 percent and 47 percent of total revenues in the first quarters of 2017 and 2016 respectively.

- 15 -
Three Months Ended March 31
2017 2016 % Change
Natural gas 11,201 8,977 25
Field condensate 10,590 6,531 38
Natural gas liquids 3,777 1,673 126
Crude oil 36 18 100
Sulphur 67 117 (43)
Total 25,671 17,316 48
ROYALTIES
What were royalty costs in the first quarter of 2017?
For the first quarter of 2017, royalties totaled $2.4 million compared to $1.8 million in the same period in 2016, an increase of 30 percent. Crown royalties increased 85 percent as a result of higher commodity prices and the Bigstone wells brought on-stream in the fourth quarter of 2016 and the first quarter of 2017. Royalty credits, the cost of processing the Crown’s share of natural gas production, decreased in the first quarter of 2017 in comparison to the same period in 2016, largely due to a 2016 prior period adjustment related to Montney facilities. The Crown royalty credits are largely based on the amortization of historical capital and operating costs and do not fluctuate based on commodity prices but are restricted to Crown royalties paid.
In the first quarter of 2017, gross overriding royalties decreased eight percent in comparison to the same period in 2016. The gross overriding royalty slightly decreased as a result of wells brought on-stream that are not encumbered by a gross overriding royalty.
Three Months Ended March 31
2017 2016 % Change
Crown royalties 1,222 660 85
Royalty credits (380) (522) (27)
Crown royalties – net 842 138 510
Gross overriding royalties 1,566 1,708 (8)
Total 2,408 1,846 30
Per boe 3.26 2.42 35
What were the average royalty rates paid on production in the first quarter of 2017?
In the first quarter of 2017, the average royalty rate decreased to 9.4 percent down from the 10.7 percent average royalty rate of the comparative period in 2016. The decrease is due to lower gross overriding royalty rates partially offset by higher Crown royalty rates. The increase in crown royalties are the result of the new Bigstone wells that commenced production in the fourth quarter of 2016 and the first quarter of 2017, which are initially burdened with a five percent crown royalty. In the first quarter of 2017, Delphi’s crown royalty credits were reduced by prior period adjustments related to the Company’s Montney facilities. The gross overriding royalty rate decreased 38 percent as additional sales volumes are not encumbered with a gross overriding royalty.
Three Months Ended March 31
2017 2016 % Change
Crown rate – net of royalty credits 3.3% 0.8% 312
Gross overriding rate 6.1% 9.9% (38)
Average rate 9.4% 10.7% (12)
The royalty rate calculations above exclude gains or losses on risk management activities from revenue as the denominator.

- 16 -
OPERATING EXPENSES
How do operating expenses in the first quarter of 2017 compare to 2016?
Production costs for the three months ended March 31, 2017 increased four percent in comparison to the same period in 2016. Delphi earns processing income for third party production volumes going through facilities owned by the Company. The processing income represents a reduction of the Company’s costs to operate these facilities and hence is deducted in determining operating expenses. Processing income decreased 83 percent in the three months ended March 31, 2017 compared to the same period in 2016. This decline in income is mainly due to the 35 percent working interest disposition of the Montney 7-11 facility that earned processing income. The disposition closed in the fourth quarter of 2016.
Three Months Ended March 31
2017 2016 % Change
Production costs 6,192 5,966 4
Processing income (139) (818) (83)
Total 6,053 5,148 18
Per boe 8.20 6.74 22
TRANSPORTATION EXPENSES
What factors contributed to the change in transportation costs in the first quarter of 2017?
Transportation expenses decreased ten percent in the first quarter of 2017 compared to the first quarter of 2016. Transportation expense per boe decreased as Delphi was able to allocate some of its unused transportation capacity to other producers. These lower costs were partially offset by incremental condensate volumes that were trucked to market since the current pipeline was at capacity.
The Company ships its natural gas down the Alliance pipeline thus allowing Delphi to sell its natural gas into the Chicago market. The incremental cost for shipping into the Chicago market is offset by the increase in the realized sales price for the Company’s natural gas relative to AECO prices.
Three Months Ended March 31
2017 2016 % Change
Total 4,622 5,114 (10)
Per boe 6.26 6.69 (6)
GENERAL AND ADMINISTRATIVE
How do general and administrative costs in the first quarter of 2017 compare to 2016?
General and administrative expenses (after recoveries and allocations) for the three months ended March 31, 2017 were 31 percent higher compared to the same period in 2016. In the first quarter, the increase in general and administrative expenses is a result of an employee termination payment, partially offset by higher overhead recoveries as a result of an increased capital program. Gross expenses in the first quarter of 2017 increased 33 percent compared to the same period in 2016 primarily due to higher personnel costs of $0.7 million and outside services costs of $0.3 million. This cost increase was partially offset by a $0.2 million decrease in the foreign exchange loss from the first quarter of 2016 to the 2017 period.
Three Months Ended March 31
2017 2016 % Change
Gross expenses 3,142 2,366 33
Overhead recoveries (624) (326) 91
Capitalized G&A and operating recoveries (539) (533) 1
General and administrative expenses 1,979 1,507 31
Per boe 2.68 1.97 36

- 17 -
SHARE-BASED COMPENSATION
What is share-based compensation expense?
Share-based compensation expense is the amortization over the vesting period of the fair value of stock options and restricted share units (“RSUs”) granted to employees, directors and key consultants of the Company. The fair value of RSUs is based on the Company’s closing share price on the last business day immediately preceding the vesting date or the Company’s closing share price on the last business day immediately preceding the statement of financial position date. The fair value of all options granted is estimated at the date of grant using the Black-Scholes option pricing model.
Share-based compensation expense related to the Company’s option plan decreased 14 percent for the three months ended March 31, 2017 as compared to the same period in 2016. The decrease in the expense is due to a larger portion of options outstanding in the first quarter of 2016 compared to the first quarter of 2017. The fourth quarter 2015 stock option grant was outstanding for the entire first quarter of 2016 compared to the first quarter 2017 grant that was only outstanding for a portion of the current quarter. Delphi’s options are expensed on a graded basis over their vesting period causing the majority of the expense to be recognized in the earlier years of the vesting period.
Share-based compensation expense related to the Company’s RSUs decreased in the three months ended March 31, 2017 in comparison to the same period in 2016. The decrease in the expense from the comparative period is due to a lower closing share price used to calculate the fair value of the restricted units vested during the period, in combination with a decrease in the number of outstanding units.
Capitalized share-based compensation decreased in the three months ended March 31, 2017 in comparison to the same period in 2016 as a result of a decrease in options and RSUs that have vested during the periods.
Three Months Ended March 31
2017 2016 % Change
Share-based compensation – Options 296 344 (14)
Share-based compensation – RSUs (46) 83 (155)
Capitalized costs (96) (149) (36)
Net 154 278 (45)
Per boe 0.21 0.36 (42)
FINANCE COSTS
How do the costs of borrowing compare against the comparative period?
During the first quarter of 2017, interest charges on the Company’s bank debt and Senior Secured Notes increased 35 percent over the comparative period in 2016. The increase was due to the issuance of the Senior Secured Notes at the end of the second quarter of 2016 which resulted in a higher proportion of the outstanding debt having a higher overall interest rate than the comparative period in 2016. This was partially offset by a lower average debt balance as proceeds from the partner transaction in the fourth quarter of 2016 were applied against outstanding indebtedness.
Accretion and finance charges are non-cash and are comprised of accretion expense on the Company’s decommissioning obligations and the accretion of the Company’s Senior Secured Notes.
The accretion of decommissioning obligations is an expense that relates to the passing of time until the Company estimates it will retire its assets and restore the asset locations to a condition which meets or exceeds environmental standards. Due to the long term nature of certain assets of the Company, this accretion expense is estimated to extend over a term of one to 40 years. The increase in accretion expense in the first quarter of 2017 compared to the first quarter of 2016 is due to the higher risk free interest rates used to calculate the expense in the current quarter.
The finance charge associated with the Company’s Senior Secured Notes is based on the effective interest rate method in order to amortize the transaction costs related to the issue and to accrete the Senior Secured Notes to its face value of $60.0 million over the term of the debt. The increase in financing charges in the first three months of 2017 compared to the first three months in 2016 relates to the higher amortization charge and accretion expense on the Senior Secured Notes compared to the subordinated debt that was outstanding in the first quarter of 2016.

- 18 -
Three Months Ended March 31
2017 2016 % Change
Interest 1,986 1,472 35
Accretion of decommissioning liabilities 94 85 11
Finance charges 373 128 191
Total finance costs 2,453 1,685 46
Interest per boe 2.69 1.93 39
Accretion per boe 0.13 0.11 18
Finance charges per boe 0.51 0.17 200
DEPLETION, DEPRECIATION AND IMPAIRMENT
Has the Company’s depletion and depreciation rate and expense changed in the first quarter of 2017 compared to 2016?
For the three months ended March 31, 2017, the Company recorded depletion and depreciation of $7.9 million or $10.76 per boe compared to $8.6 million or $11.32 per boe in the same period of 2016. The absolute decrease in depletion is largely attributable to the decrease in the carrying value of the assets subject to depletion as well as the slightly lower production volumes for the first quarter of 2017 versus 2016.
Three Months Ended March 31
2017 2016 % Change
Depletion and depreciation 7,942 8,651 (8)
Depletion and depreciation per boe 10.76 11.32 (5)
INCOME TAXES
What was the impact on deferred income taxes as a result of the earnings for the period?
Due to the continued weak commodity price outlook, Delphi has concluded that it’s not probable that the deferred income tax asset will be realized and as a result, it has not been recognized at March 31, 2017. Therefore, no deferred income tax expense was recorded in the first quarter against net earnings.
Delphi does not have current income taxes payable and does not expect to pay current income taxes in 2017 as the Company had estimated tax pools available at March 31, 2017 of $335.0 million (December 31, 2016 – $311.0 million). ADJUSTED FUNDS FROM OPERATIONS
What are adjusted funds from operations and why is it a key performance measure?
Adjusted funds from operations is a non-IFRS measure that has been defined by the Company and is used as a measure to analyze performance. Delphi considers adjusted funds from operations a key measure as it demonstrates the Company’s ability to generate the cash necessary to fund future capital investments and to repay debt. Adjusted funds from operations is calculated as cash flow from operating activities before accretion on bank debt and subordinated debt, decommissioning expenditures and changes in non-cash working capital.
How do cash flow from operating activities and adjusted funds from operations in the first quarter of 2017 compare to 2016?
Delphi’s adjusted funds from operations in the three months ended March 31, 2017 was consistent with the same period in 2016. Higher crude oil and natural gas sales and lower transportation expenses were offset by realized losses on risk management contracts, higher royalties, operating expenses and financing costs.

- 19 -
Three Months Ended March 31
2017 2016 % Change
Cash flow from operating activities 9,935 12,814 (22)
Accretion of bank debt and subordinated (13) 568 (102)
Decommissioning expenditures 1,208 980 23
Change in non-cash working capital (2,964) (6,172) (52)
Adjusted funds from operations 8,166 8,190 -
CASH NETBACK AND EARNINGS ANALYSIS
What factors contributed to the earnings in the first quarter of 2016?
Delphi recorded net earnings of $8.4 million ($0.05 per basic and diluted share) in the first quarter of 2017, up from the $5.3 million ($0.03 per basic and diluted share) of net earnings recorded in the first quarter of 2016. The increase in earnings is due to higher unrealized gains on risk management contracts, higher crude oil, natural gas, and natural gas liquid sales partially offset by realized losses on risk management contracts, higher operating costs and royalty expense.
Three Months Ended March 31
2017 2016 % Change
Net earnings 8,352 5,259 59
Per boe 11.32 6.89 64
Per basic share 0.05 0.03 67
Per diluted share 0.05 0.03 67
How do Delphi’s netbacks achieved in the first quarter of 2017 compare to 2016?
Delphi continues to focus its drilling on high margin liquids-rich natural gas plays in order to strengthen its operating and cash netback per boe.
For the first quarter of 2017, Delphi’s operating netback per boe increased 12 percent compared to the first quarter of 2016 as a result of stronger crude oil and natural gas liquids prices. Delphi’s marketing arrangement to ship the majority of its natural gas into the Chicago market improves the realized sales price before risk management contracts. This increase in natural gas pricing was slightly offset by realized losses on financial commodity risk management contracts. Royalties per boe increased due to higher commodity prices and new wells brought on production in the fourth quarter of 2016 and the first quarter of 2017 which have a five percent royalty rate during the initial production period. Operating expenses per boe have increased due to a decrease in processing income as a result of the disposition of a 35 percent working interest in the 7-11 Bigstone facility. Transportation expense per boe decreased as a result of lower gathering and processing charges as Delphi was able to mitigate some of its unused transportation capacity.
Delphi’s cash netback for the first quarter of 2017 increased three percent in comparison to the first quarter of 2016 due to higher general and administrative expenses and interest charges per boe. General and administrative charges per boe increased as a result of an employee termination payment, partially offset by higher overhead recoveries. Interest charges per boe increased as a result of the issuance of the Senior Secured Notes in the second quarter of 2016 which increased the overall effective interest rate on outstanding debt.
Three Months Ended March 31
2017 2016 %
Change
Barrels of oil equivalent ($/boe)
Realized sales price 34.79 22.67 53
Royalties 3.26 2.42 35
Operating expenses 8.20 6.74 22
Transportation 6.26 6.69 (6)
Operating netback before risk management contracts 17.07 6.82 150
Realized gain(loss) on risk management contracts (0.62) 7.80 (108)

- 20 -
Operating netback 16.45 14.62 13
General and administrative expenses 2.68 1.97 36
Interest 2.69 1.93 39
Cash netback 11.08 10.72 3
Unrealized gain on commodity risk contracts (12.06) (6.09) 98
Share-based compensation expense 0.21 0.36 (42)
Gain on dispositions (0.48) (2.28) (79)
Exploration and evaluation - 0.02 -
Loss on decommissioning 0.70 0.22 218
Depletion, depreciation and impairment 10.76 11.32 (5)
Accretion and finance charges 0.63 0.28 126
Net earnings 11.32 6.89 64
SELECTED INFORMATION
Over the past two years, how has Delphi performed and what significant factors contributed to the results?
Over the past two years, the changes in revenue and adjusted funds from operations from quarter to quarter primarily reflect the change in production volumes, product mix and the volatility of commodity prices.
Delphi’s focus over the past eight quarters has been to exploit its liquids-rich resource at Bigstone in northwest Alberta in order to maximize operating netbacks.
In 2015, in order to mitigate the depressed commodity environment and to maintain financial flexibility, Delphi disposed of two major properties, its Wapiti CGU and Greater Hythe assets, and a minor property in British Columbia and sold a gross overriding royalty on three gross wells completed during the year. Delphi received net proceeds of $67.6 million for the dispositions of which the majority was used to repay bank indebtedness and the remaining was directed toward the capital program. The property dispositions in 2015 were lower netback properties relative to the Montney at Bigstone.
On December 1, 2015, Delphi commenced transporting most of its natural gas volumes under its Alliance firm service agreement, minimizing the exposure to ongoing curtailments on the TransCanada system. As a result of the major property dispositions, the pipeline restrictions and the reduced capital program in 2015, Delphi’s production decreased by ten percent in 2015 to 9,469 boe/d in comparison to 2014.
In 2016, Delphi’s natural gas production has benefited from a higher Chicago City Gate benchmark price and a weak Canadian dollar relative to its U.S. counterpart as compared to a lower AECO benchmark price. Delphi’s commod ity risk management program continues to be an integral part of the Company’s strategy in order to protect cash flows and manage its capital program. During the twelve months ended 2016, Delphi invested $53.8 million, drilling six gross (4.2 net) wells and brought on production six gross (4.5 net) wells and one re-fracture in its Bigstone area. As a result of the major property dispositions in 2015 and the unplanned outage at SemKAMS K3 plant, Delphi’s production decreased by 22 percent to 7,392 boe/d in comparison to 2015.
During the first quarter of 2016, Delphi sold a gross overriding royalty on two wells completed during the quarter for proceeds of $4.6 million.
During the second quarter of 2016, Delphi’s lenders completed their annual review of the Company’s senior credit facilities. The review of the borrowing base of the facility incorporated Delphi’s risk management program, success of the development of the Company’s Montney assets and the lenders’ view of future commodity prices. As a result, Delphi’s senior credit facility was re-determined at $85.0 million, consisting of a $10.0 million operating facility and a $75.0 million revolving facility. In conjunction with the redetermination of the borrowing facility, Delphi issued $60.0 million of Senior Secured Notes on June 15, 2016. Delphi applied the proceeds from the Senior Secured Notes issue against its senior credit facility and repaid the subordinated debt balance of $14.2 million on June 15, 2016. During the third quarter, the maturity date of the senior credit facility was extended from October 1, 2017 to January 15, 2018.
During the fourth quarter of 2016, Delphi entered into the Partner Transaction with an existing working interest industry partner to accelerate the development of Delphi’s liquids rich Deep Basin natural gas play at Bigstone. At closing Delphi received proceeds of $54.6 million comprised of $32.7 million including purchase price adjustments, $1.9 million in undeveloped land and $20.0 million related to the carry capital obligation of our partner to fund 50 percent of the combined

- 21 -
share of Delphi and its partners’ drilling and completion costs. The assets had a net book value of $40.5 million including decommissioning obligations of $0.7 million and exploration and evaluation cost of $6.7 million. A gain of $7.4 million was recorded on the disposition.
At the end of the fourth quarter of 2016, Delphi entered into a term sheet with respect to a new $80.0 million senior secured revolving credit facility with a new banking syndicate comprised of Canadian chartered banks. The new senior revolving credit facility was signed in January 2017. The new senior credit facility consisted of a $12.5 million operating facility and a $67.5 million revolving facility.
Delphi’s planned drilling program in 2017 will more than double the number of wells drilled compared to 2016. Delphi added an additional rig in December 2016 which has enabled Delphi to increase activity levels in the first quarter of 2017. During the first quarter of 2017, Delphi invested $30.3 million primarily on drilling and completion expenditures, partially funded by $9.1 million in carry capital proceeds. The Company drilled four gross (2.6 net) wells and performed completion operations on four gross (2.5 net) wells in its Bigstone area.
Natural gas prices over the past two years have generally reflected the cyclical nature of demand. Higher prices are usually realized in the winter months, reflecting demand for heating, with lower prices through the summer months as production is placed in storage for the upcoming heating season demand. Natural gas supply/demand fundamentals have improved in the first quarter of 2017 as a result of lower North American production and increased Mexican and LNG exports which has supported higher prices. The average Chicago City Gate benchmark price for the fourth quarter of 2016 was U.S. $3.01 per mmbtu compared to an average in the first quarter of 2017 of U.S. $3.40 per mmbtu.
The fundamental supply/demand equation for crude oil has improved somewhat since the first two quarters of 2016. Stronger prices are supported by OPEC’s commitment to cut production in the first half of 2017. The average WTI price was U.S. $48.76 per barrel in 2015 versus U.S. $43.39 per barrel in 2016. In the first quarter of 2017, the average WTI price was $ U.S. $51.86 per barrel.
Net earnings (loss) of the Company is primarily driven by the difference between the cash netback realized per boe of production versus the Company’s depletion and depreciation rate, unrealized gains (losses) on commodity risk management contracts and other non-cash charges.
The following table sets forth certain information of the Company for the past eight consecutive quarters outlining this performance:
Mar. 31,
2017
Dec. 31,
2016
Sep. 30,
2016
Jun. 30,
2016
Mar. 31,
2016
Dec. 31,
2015
Sep. 30,
2015
Jun. 30,
2015
Production
Oil and field condensate (bbls/d) 1,940 1,338 1,667 1,060 1,704 1,613 1,198 1,455
Natural gas liquids (bbls/d) 1,302 1,125 1,251 1,023 1,336 1,414 1,045 1,582
Natural gas (mcf/d) 29,737 27,988 31,923 22,311 32,127 34,719 33,871 43,035
Barrels of oil equivalent (boe/d) 8,198 7,127 8,239 5,802 8,395 8,814 7,888 10,210
Financial
Crude oil and natural gas sales 25,671 20,546 20,331 10,942 17,316 18,601 16,234 22,790
Adjusted funds from operations 8,166 8,120 9,403 4,152 8,190 13,317 10,070 8,725
Per share – basic 0.05 0.05 0.06 0.03 0.05 0.09 0.06 0.06
Per share – diluted 0.05 0.05 0.06 0.03 0.05 0.09 0.06 0.06
Net earnings (loss) 8,352 (25,461) (2,274) (18,638) 5,259 (23,084) 10,670 (32,106)
Per share – basic 0.05 (0.16) (0.01) (0.12) 0.03 (0.15) 0.07 (0.21)
Per share – diluted 0.05 (0.16) (0.01) (0.12) 0.03 (0.15) 0.07 (0.21)
CONTRACTUAL OBLIGATIONS
Does the Company have any contractual obligations as of March 31, 2017 that will require funding in future years?
The Company is committed to future minimum payments for natural gas transmission and processing and operating leases on compression equipment. The Company also has a lease for office space in Calgary, Alberta. As noted above, the senior credit facility is based on a revolving term which is reviewed annually and converts to a 365 day non-revolving term facility if not renewed.

- 22 -
The future minimum commitments over the next five years ending on March 31 are as follows:
2017 2018 2019 2020 2021 Thereafter
Gathering, processing and transmission (1) 16,900 24,004 22,182 18,668 1,354 5,755
Office, equipment and software leases 647 43 9 7 - -
Accounts payable and accrued liabilities (2) 52,775 - - - - -
Decommissioning obligations (3) 692 2,595 294 2,013 803 16,930
Restricted share units 118 - - - - -
Risk management contracts 756 341 (189) - - -
Interest payments on Senior Secured Notes 4,500 6,000 6,000 6,000 3,250 -
Bank Debt - 32,000 - - - -
Senior Secured Notes - - - - 60,000 -
Total 76,388 64,983 28,296 26,688 65,407 22,685
(1) Balances denominated in U.S. dollars have been translated at the March 31, 2017 exchange rate.
(2) Excludes the current portion of the restricted share units as they are disclosed separately on this table. (3) Amounts represent the inflated, discounted future abandonment and reclamation expenditures anticipated to be incurred over the life of the
Company’s properties.
Effective April 1, 2017, Delphi entered into a new office sublease commencing September 1, 2017 and expiring November 29, 2024 for a total commitment of $3.1 million.
GUARANTEES AND OFF-BALANCE SHEET ARRANGEMENTS
Does Delphi have any outstanding guarantees on behalf of third parties or any off-balance sheet arrangements which could lead to liabilities in the future?
Delphi has not entered into any guarantees or off-balance sheet arrangements. Certain lease agreements entered into in the normal course of operations could be considered off-balance sheet arrangements; however, all leases which are considered operating leases are charged to operating expenses or general and administrative expenses on a monthly basis according to the lease.
CRITICAL ACCOUNTING ESTIMATES
In preparing the Company’s consolidated financial statements, is Delphi required to make estimates or assumptions about future events?
The reader is advised that the critical accounting estimates, judgments, policies and practices as described in the Company’s Management’s Discussion and Analysis for the year ended December 31, 2016 continue to be critical in determining Delphi’s financial results.
The condensed consolidated interim financial statements have been prepared in conformity with IAS 34, Interim Financial Reporting, which requires management to make judgments, estimates and assumptions that affect the application of accounting policies and the reported amounts of assets, liabilities, shareholders’ equity, revenue and expenses. Actual results may differ from these estimates.
NEW ACCOUNTING STANDARDS
Did the Company adopt any new standards and are there any future accounting standards which the Company will have to comply with in the future?
On January 1, 2016, Delphi adopted the amendments to IFRS 11, “Joint Arrangements,” issued by the International Accounting Standards Board. The amendments require business combination accounting to be applied to the acquisition of interests in a joint operation that constitute a business. The adoption of this amendment has not had a material impact on the Company’s consolidated financial statements.
The following are future accounting standards and amendments to current standards:
The IASB has issued IFRS 15, “Revenue from Contracts with Customers”, which contains a single model that applies

- 23 -
to contracts with customers and two approaches to recognizing revenue: at a point in time or over time. The model features a contract-based five-step analysis of transactions to determine whether, how much and when revenue is recognized. New estimates and judgmental thresholds have been introduced, which may affect the amount and/or timing of revenue recognized. The standard has a current effective date of January 1, 2018. The extent of the impact of adoption of the standard has not yet been determined.
The IASB has issued IFRS 9, “Financial Instruments”, which is the result of the IASB’s project to replace IAS 39, “Financial Instruments: Recognition and Measurement”. The new standard replaces the current multiple classification and measurement models for financial assets and liabilities with a single model that has only two classification categories: amortized cost and fair value. The standard has an effective date of January 1, 2018. The Company is currently evaluating the impact of adopting this standard.
The IASB has issued IFRS 16, “Leases”, which replaces the previous leases standard, IAS 17, “Leases.”. The new standard sets out the principles for the recognition, measurement, presentation and disclosure of leases and brings most leases on-balance sheet for lessees under a single model, eliminating the distinction between operating and finance leases. The standard is effective from January 1, 2019. Early adoption is permitted but only if the Company also applies IFRS 15, “Revenue from Contracts with Customers.” Delphi does not expect to early adopt the new standard and the extent of the impact of adoption of the standard has not yet been determined.
CORPORATE GOVERNANCE
Overview
The shareholders’ interests are a critical factor in the operations and management of Delphi. The Company is committed to maintaining the highest level of investor confidence in the Company through the application of its corporate policies and procedures. Delphi’s Board of Directors consists of five independent directors and one officer of the Company who meet regularly to discuss matters of strategy and execution of the business plan. See Delphi’s Management Information Circular and Annual Information Form for a listing of committees that oversee specific aspects of the Company’s operating and financial strategy.
Disclosure Controls and Procedures and Internal Controls over Financial Reporting
Disclosure controls and procedures are designed to ensure that information required to be disclosed by the Company is accumulated and communicated to the Company’s management, including its President and Chief Executive Officer and Chief Financial Officer, as appropriate, to allow timely decisions regarding required disclosure. The President and Chief Executive Officer and Chief Financial Officer have designed, or caused to be designed under their supervision, internal controls over financial reporting to provide reasonable assurance regarding the reliability of the Company's financial reporting and the preparation of financial statements for external purposes in accordance with generally accepted accounting principles applicable to the Company. The Company’s internal controls over financial reporting is based on the framework issued by the Committee of Sponsoring Organizations of the Treadway Commission (2013 Framework). The Company is required to disclose any change in the Company's internal control over financial reporting that occurred during the period beginning on January 1, 2017 and ended on March 31, 2017 that has materially affected, or is reasonably likely to materially affect, the Company's internal control over financial reporting. No material changes in the Company's internal control over financial reporting were identified during such period that has materially affected, or are reasonably likely to materially affect, the Company's internal control over financial reporting. It should be noted that a control system, including the Company's disclosure and internal controls and procedures, no matter how well conceived, can provide only reasonable, but not absolute, assurance that the objectives of the control system will be met and it should not be expected that the disclosure and internal controls and procedures will prevent all errors or fraud.
2017 OUTLOOK AND FORWARD-LOOKING INFORMATION
This management discussion and analysis contains forward-looking statements and forward-looking information within the meaning of applicable Canadian securities laws. These statements relate to future events or the Company’s future performance and are based upon the Company’s internal assumptions and expectations. All statements other than statements of present or historical fact are forward-looking statements. Forward-looking statements are often, but not always, identified by the use of any of the words “expect”, “anticipate”, “continue”, “estimate”, “may”, “will”, “should”, “believe”, "intends”, “forecast”, “plans”, “guidance”, “budget” and similar expressions.
More particularly and without limitation, this management discussion and analysis contains forward-looking statements and information relating to petroleum and natural gas production estimates and weighting, projected crude oil and natural gas prices, future exchange rates, expectations as to royalty rates, expectations as to transportation and operating costs,

- 24 -
expectations as to general and administrative costs and interest expense, expectations as to capital expenditures and net debt, planned capital spending, future liquidity and Delphi’s ability to fund ongoing capital requirements through operating cash flows and its credit facilities, supply and demand fundamentals for oil and gas commodities, timing and success of development and exploitation activities, cash availability for the financing of capital expenditures, access to third-party infrastructure, treatment under governmental regulatory regimes and tax laws and future environmental regulations.
Furthermore, statements relating to “reserves” are deemed to be forward-looking statements as they involve the implied assessment, based on certain estimates and assumptions that the reserves described can be profitable in the future.
The forward-looking statements and information contained in this management discussion and analysis are based on certain key expectations and assumptions made by Delphi. The following are certain material assumptions on which the forward-looking statements and information contained in this management discussion and analysis are based: the stability of the global and national economic environment, the stability of and commercial acceptability of tax, royalty and regulatory regimes applicable to Delphi, exploitation and development activities being consistent with management’s expectations, production levels of Delphi being consistent with management’s expectations, the absence of significant project delays, the stability of oil and gas prices, the absence of significant fluctuations in foreign exchange rates and interest rates, the stability of costs of oil and gas development and production in Western Canada, including operating costs, the timing and size of development plans and capital expenditures, availability of third party infrastructure for transportation, processing or marketing of oil and natural gas volumes, prices and availability of oilfield services and equipment being consistent with management’s expectations, the availability of, and competition for, among other things, pipeline capacity, skilled personnel and drilling and related services and equipment, results of development and exploitation activities that are consistent with management’s expectations, weather affecting Delphi’s ability to develop and produce as expected, contracted parties providing goods and services on the agreed timeframes, Delphi’s ability to manage environmental risks and hazards and the cost of complying with environmental regulations, the accuracy of operating cost estimates, the accurate estimation of oil and gas reserves, future exploitation, development and production results and Delphi’s ability to market oil and natural gas successfully to current and new customers. Additionally, estimates as to expected average annual production rates assume that no unexpected outages occur in the infrastructure that the Company relies on to produce its wells, that existing wells continue to meet production expectations and any future wells scheduled to come on in the coming year meet timing and production expectations.
Commodity prices used in the determination of forecast revenues are based upon general economic conditions, commodity supply and demand forecasts and publicly available price forecasts. The Company continually monitors its forecast assumptions to ensure the stakeholders are informed of material variances from previously communicated expectations.
Financial outlook information contained in this management discussion and analysis about prospective results of operations, financial position or cash flows is based on assumptions about future events, including economic conditions and proposed courses of action, based on management’s assessment of the relevant information currently available. Readers are cautioned that such financial outlook information contained in this management discussion and analysis should not be used for purposes other than for which it is disclosed.
Although the Company believes that the expectations reflected in such forward-looking statements and information are reasonable, it can give no assurance that such expectations will prove to be correct and such forward-looking statements should not be unduly relied upon. Since forward-looking statements and information address future events and conditions, by their very nature they involve inherent known and unknown risks and uncertainties. Delphi’s actual results, performance or achievements could differ materially from those expressed in, or implied by, these forward-looking statements and, accordingly, no assurance can be given that any of the events anticipated by the forward-looking statements will transpire or occur, or if any of them do so, what benefits Delphi will derive therefrom. Should one or more of these risks or uncertainties materialize, or should assumptions underlying forward-looking statements prove incorrect, actual results may vary materially from those currently anticipated due to a number of factors and risks. These include, but are not limited to, the risks associated with the oil and gas industry in general such as operational risks in development, exploration and production, delays or changes in plans with respect to exploration or development projects or capital expenditures, the uncertainty of estimates and projections relating to production rates, costs and expenses, commodity price and exchange rate fluctuations, marketing and transportation, environmental risks, competition from others for scarce resources, the ability to access sufficient capital from internal and external sources, changes in governmental regulation of the oil and gas industry and changes in tax, royalty and environmental legislation. Additional information on these and other factors that could affect the Company’s operations or financial results are included in the Company’s most recent Annual Information Form and other reports on file with the applicable securities regulatory authorities and may be accessed through the SEDAR website (www.sedar.com).
Readers are cautioned that the foregoing list of factors is not exhaustive. Furthermore, the forward-looking statements contained in this MD&A are made as of the date of this MD&A for the purpose of providing the readers with the Company’s expectations for the coming year. The forward-looking statements and information may not be appropriate for other purposes. Delphi undertakes no obligation to update publicly or revise any forward-looking statements or information,

- 25 -
whether as a result of new information, future events or otherwise, unless so required by applicable securities laws. The forward-looking statements contained in this management discussion and analysis are expressly qualified in their entirety by this cautionary statement.
PRODUCTION
What are the Company’s production expectations for 2017?
The Company’s average annual production in 2017 will be dependent upon the number of wells drilled, funded by cash flow, resulting in production between 9,000 and 9,500 boe/d. The production is expected to be split 40 percent to liquids and 60 percent to natural gas.
REVENUES
What does the Company project for crude oil and natural gas prices and the Canadian/United States exchange rate in 2017?
Natural Gas
United States natural gas prices are commonly referenced to the New York Mercantile Exchange Henry Hub in Louisiana (“NYMEX”) while Canadian natural gas prices are typically referenced to the Canadian Alberta Energy Company interconnect with the TransCanada Alberta system (“AECO”). Natural gas prices are primarily influenced by North American, rather than global, supplies of natural gas versus domestic demand for winter heating and the generation of electricity for summer cooling requirements. Over the past seven years, multi-stage hydraulic fracturing technology has unlocked significant natural gas resource potential in numerous shale basins in North America which are capable of initially producing at very high rates of natural gas before declining and producing for a long time. The United States has significantly grown its supply of dry gas to meet domestic demand over that same period of time further influencing the dynamics of the natural gas markets.
Natural gas storage levels have decreased in comparison to the prior year and storage levels are trending near the five year average due to an early start to winter which drew down on record high inventories. Delphi remains optimistic about the long term outlook for natural gas prices. The average price for NYMEX in the first two months of 2017 has been $3.34 per million British thermal units (“mmbtu”). Consequently, Delphi is managing its forecast for NYMEX natural gas prices to average between U.S. $3.15 and $3.35 per mmbtu for the year.
Crude Oil
West Texas Intermediate at Cushing, Oklahoma is the benchmark reference for North American crude oil prices. Canadian crude oil prices are based upon postings, primarily at Edmonton, Alberta and represent the WTI price adjusted for quality and transportation differentials as well as the Canadian/United States (“Cdn/US”) dollar exchange rate. The fundamental supply/demand equation for crude oil is imbalanced as global supply exceeds global demand. Global supply/demand fundamentals for crude oil have improved from the third quarter of 2016 as the Organization of Petroleum Exporting Countries (“OPEC”) and Russia have agreed to curtail oil output. West Texas Intermediate has responded positively to the cuts in production.
Delphi is currently managing its capital program based on an average WTI price for 2016 of U.S. $53.00 to U.S. $55.00 per barrel.
Canadian/United States Exchange Rate
Both crude oil and natural gas prices in Canada are premised on the U.S. dollar price for each product adjusted for the Cdn/US dollar exchange rate and quality and transportation differentials. The strength or weakness of the Canadian dollar versus the U.S. dollar will largely reflect the global demand for raw materials, particularly metals, minerals and crude oil. The global financial markets tolerance for risk and its need for financial security in the form of holding U.S dollars will also have an effect on the value of the Canadian dollar against the U.S. dollar.
The exchange rate is influenced by many variables which will continue to result in volatility. Delphi has assumed that the Canadian dollar will average $0.72 to $0.75 Cdn. to U.S. dollar.

- 26 -
ROYALTIES
What average royalty rate does Delphi expect to pay in 2017?
The Company pays royalties to provincial governments, individuals and companies that own surface and/or mineral rights and Companies that have been granted an overriding royalty. These payments take the form of Crown, freehold and overriding royalties. Crown royalty rates for crude oil and natural gas are generally calculated on a sliding scale based on commodity prices and production rates whereas freehold and overriding royalty rates are generally a fixed percentage of revenue less the cost to deliver the product to market. Crown royalty rates can change due to price fluctuations or changes in production volumes on a well by well basis subject to minimum and maximum rates. For natural gas liquids, Crown royalty rates are a fixed percentage of revenue with the rate varying according to the nature of the product. Crown royalty credits are received from the Crown and represent the fee earned by the owners of natural gas processing infrastructure to process the Crown’s royalty share of natural gas. Freehold royalties are paid on freehold lands and overriding royalties are generally payable on lands where the Company has earned an interest in the lands through a farm-in, whether the lands are Crown or freehold. Crown royalties are also influenced by royalty incentives provided by the provincial governments to stimulate drilling activity by the industry. Delphi expects the royalty regime in Alberta to remain stable throughout 2017. Royalties are not affected by gains or losses realized through the Company’s risk management program.
For 2017, Delphi expects its royalty rate, after the deduction for royalty credits to average between ten and twelve percent of gross revenue, excluding realized and unrealized gains or losses on commodity risk management contracts.
TRANSPORTATION EXPENSES AND OPERATING COSTS
Will Delphi be able to further reduce its costs of production in 2017?
Transportation expenses are costs incurred by the Company to transport its production volumes from the wellhead to the point of sales. In Alberta, transportation expense is influenced by market conditions and availability of existing pipeline capacity.
Delphi expects its transportation expenses to be approximately $6.50 to $7.00 per boe in 2017. Transportation expenses are subject to the availability of pipeline capacity on an interruptible basis in areas of significant production growth by industry. Delphi does not anticipate having any issues moving its production to sales.
The costs of production may be more than expected in periods of high industry activity causing considerable competition and rising prices for general oilfield services and equipment. With the growth in Montney production as a percentage of total production, operating costs are expected to increase due to sour gas processing through non-operated facilities. Operating costs in 2017 are expected to average between $6.75 and $7.25 per boe.
GENERAL & ADMINISTRATIVE AND FINANCE COSTS
What are the Company’s overhead costs for personnel and financing?
In 2017, Delphi anticipates its general and administrative costs, net of capitalized amounts, to be approximately $1.55 to $1.80 per boe, lower than 2016.
Interest costs will be dependent on market rates and credit spreads for the oil and gas sector and will be a function of the general economic conditions in Canada. If the economy is viewed as growing too fast, which may result in inflation, interest rates may be increased to slow down the pace of growth in the economy. Interest costs may also increase if adjusted funds from operations are less than expected and long term debt is used to fund a larger portion of the capital program than originally anticipated. Interest expense is expected to be approximately $2.40 to $2.75 per boe in 2017.
CAPITAL PROGRAM AND NET DEBT LEVELS
What are the Company’s forecast capital expenditures and net debt levels for 2017?
The Company expects 2017 net capital expenditures to be between $75.0 and $80.0 million to drill, complete and tie-in thirteen to fourteen wells dependent on commodity prices and hence adjusted funds from operations. These expenditures are partially funded by $9.1 million in carry capital proceeds from the Partner Transaction that closed in December of 2016. The ability to drill, complete and tie in wells assumes the availability of equipment and field personnel to undertake the operations. Historically, Delphi executes a winter capital program in excess of first quarter funds flow followed by at least one quarter of minimal activity prior to returning to the field with an active summer/fall program.
The Company is targeting net debt at December 31, 2017 to be between $120.0 and $125.0 million.

- 27 -
ADDITIONAL INFORMATION
Where is additional information about Delphi available?
Additional information about Delphi Energy is available on the Canadian Securities Administrators’ System for Electronic Distribution and Retrieval (SEDAR) at www.sedar.com, at the Company’s website at www.delphienergy.ca or by contacting the Company at Delphi Energy Corp. Suite 300, 500 – 4th Avenue S.W., Calgary, Alberta, T2P 2V6 or by e-mail at [email protected].
.

- 28 -
DELPHI ENERGY CORP.
Condensed Consolidated Statements of Financial Position
March 31, December 31,
(thousands of dollars) 2017 2016
(unaudited)
Assets
Current assets
Cash and cash equivalents - 1,580
Accounts receivable 28,874 29,804
Prepaid expenses and deposits 1,646 1,114
Fair value of financial instruments (Note 5) 163 144
30,683 32,642
Fair value of financial instruments (Note 5) 1,149 18
Exploration and evaluation (Note 6) 15,604 15,748
Property, plant and equipment (Note 7) 278,171 255,217
Total assets 325,607 303,625
Liabilities
Current liabilities
Accounts payable and accrued liabilities 52,893 39,679
Decommissioning obligations 692 848
Fair value of financial instruments (Note 5) 1,295 6,608
54,880 47,135
Bank debt (Note 8) 32,000 24,987
Senior Secured Notes (Note 9) 53,302 52,929
Decommissioning obligations 22,634 23,031
Fair value of financial instruments (Note 5) 136 2,578
Total liabilities 162,952 150,660
Shareholders’ equity
Share capital (Note 10) 311,557 310,146
Warrants (Notes 9 and 10) 3,055 3,055
Contributed surplus 20,057 20,130
Deficit (172,014) (180,366)
Total shareholders’ equity 162,655 152,965
Total liabilities and shareholders’ equity 325,607 303,625
Subsequent events (Note 5) See accompanying notes to the condensed consolidated interim financial statements.

- 29 -
DELPHI ENERGY CORP.
Condensed Consolidated Statements of Earnings and Comprehensive Income For the three months ended March 31,
(thousands of dollars, except per share amounts) 2017 2016
(unaudited)
Revenues
Crude oil and natural gas sales 25,671 17,316
Royalties (2,408) (1,846)
23,263 15,470
Realized (loss) gain on financial instruments (Note 5) (457) 5,961
Unrealized gain on financial instruments (Note 5) 8,905 4,652
31,711 26,083
Expenses
Operating 6,053 5,148
Transportation 4,622 5,114
Exploration and evaluation (Note 6) - 17
General and administrative 1,979 1,507
Share-based compensation 154 278
Gain on dispositions (Note 7) (357) (1,742)
Loss on decommissioning 513 166
Depletion, depreciation and impairment (Note 7) 7,942 8,651
20,906 19,139
Finance costs 2,453 1,685
Net earnings and comprehensive income 8,352 5,259
Net earnings per share (Note 10)
Basic 0.05 0.03
Diluted 0.05 0.03
See accompanying notes to the condensed consolidated interim financial statements.

- 30 -
DELPHI ENERGY CORP.
Condensed Consolidated Statements of Changes in Shareholders’ Equity For the three months ended March 31,
(thousands of dollars) 2017 2016
(unaudited)
Share capital
Common shares
Balance, beginning of period 310,146 309,389
Issued on exercise of options 1,041 -
Transferred on exercise of options 370 -
Balance, end of period 311,557 309,389
Warrants
Balance, beginning and end of period 3,055 -
Contributed surplus
Balance, beginning of period 20,130 19,361
Share-based compensation 297 344
Transferred on exercise of options (370) -
Balance, end of period 20,057 19,705
Deficit
Balance, beginning of period (180,366) (139,252)
Net earnings 8,352 5,259
Balance, end of period (172,014) (133,993)
Total shareholders’ equity 162,655 195,101
See accompanying notes to the condensed consolidated interim financial statements.
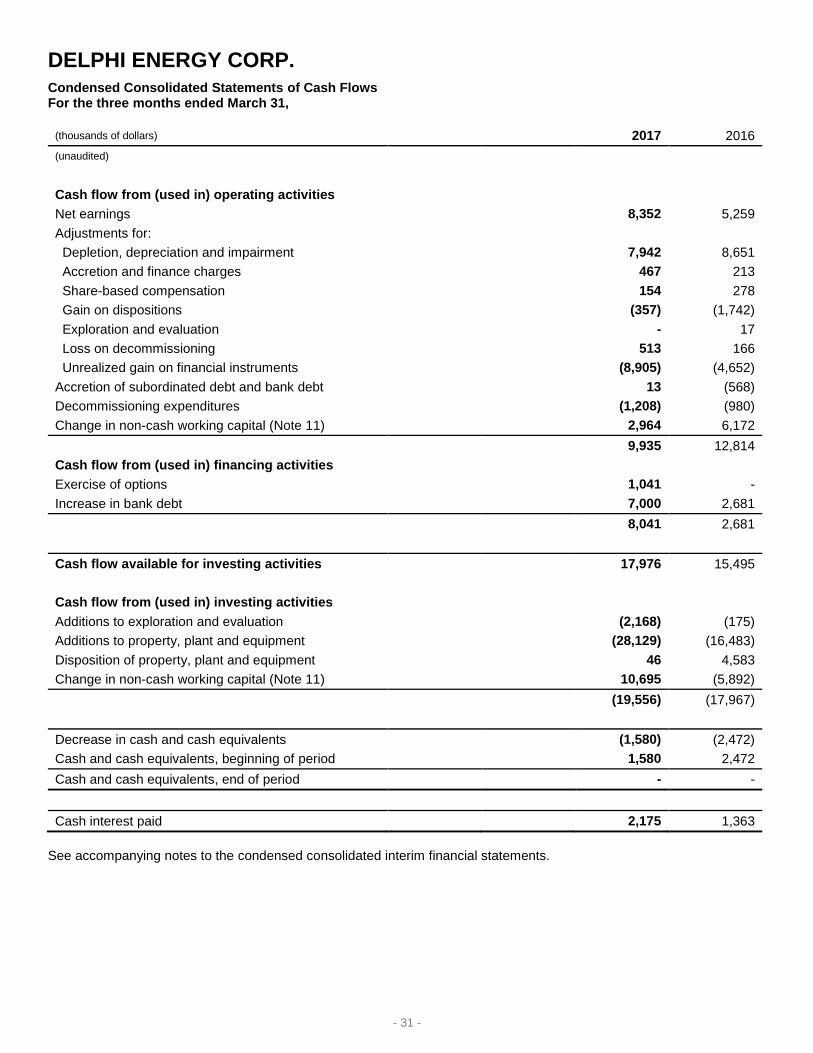
- 31 -
DELPHI ENERGY CORP.
Condensed Consolidated Statements of Cash Flows For the three months ended March 31,
(thousands of dollars) 2017 2016
(unaudited)
Cash flow from (used in) operating activities
Net earnings 8,352 5,259
Adjustments for:
Depletion, depreciation and impairment 7,942 8,651
Accretion and finance charges 467 213
Share-based compensation 154 278
Gain on dispositions (357) (1,742)
Exploration and evaluation - 17
Loss on decommissioning 513 166
Unrealized gain on financial instruments (8,905) (4,652)
Accretion of subordinated debt and bank debt 13 (568)
Decommissioning expenditures (1,208) (980)
Change in non-cash working capital (Note 11) 2,964 6,172
9,935 12,814
Cash flow from (used in) financing activities
Exercise of options 1,041 -
Increase in bank debt 7,000 2,681
8,041 2,681
Cash flow available for investing activities 17,976 15,495
Cash flow from (used in) investing activities
Additions to exploration and evaluation (2,168) (175)
Additions to property, plant and equipment (28,129) (16,483)
Disposition of property, plant and equipment 46 4,583
Change in non-cash working capital (Note 11) 10,695 (5,892)
(19,556) (17,967)
Decrease in cash and cash equivalents (1,580) (2,472)
Cash and cash equivalents, beginning of period 1,580 2,472
Cash and cash equivalents, end of period - -
Cash interest paid 2,175 1,363
See accompanying notes to the condensed consolidated interim financial statements.

- 32 -
DELPHI ENERGY CORP. Notes to the Condensed Consolidated Interim Financial Statements As at and for the three months ended March 31, 2017 and 2016 (thousands of dollars, except per share amounts) (unaudited)
1) STRUCTURE OF DELPHI
Delphi Energy Corp. (“Delphi” or the “Company”) is a publicly-traded company engaged in the exploration for, development and production of crude oil and natural gas from properties and assets located in Western Canada in which it holds an interest. The Company’s operations are primarily concentrated in the Deep Basin of Northwest Alberta. The Company’s core area in the Deep Basin is located at Bigstone, producing in excess of 95 percent of the Company’s production. The registered office of the Company is located at Suite 300, 500 – 4th Avenue S.W., Calgary, Alberta, T2P 2V6.
The condensed consolidated interim financial statements as at and for the three months ended March 31, 2017 comprise the accounts of the Company, its wholly-owned subsidiary and a partnership.
2) BASIS OF PRESENTATION
(a) Statement of compliance and authorization
These condensed consolidated interim financial statements are unaudited and prepared in accordance with International Accounting Standard 34, “Interim Financial Reporting” as issued by the International Accounting Standards Board, and do not include all of the information and disclosures normally provided in annual financial statements and should be read in conjunction with the Company’s consolidated financial statements for the year ended December 31, 2016.
These condensed consolidated interim financial statements were approved and authorized for issuance by the Board of Directors on May 9, 2017.
(b) Basis of measurement and functional currency
The condensed consolidated interim financial statements have been prepared on a going concern basis, using historical costs, except for derivative financial instruments and liabilities for cash-settled share-based payment arrangements which are measured at fair value. The financial statements are presented in Canadian dollars, the Company’s functional currency and rounded to the nearest thousand (unless stated otherwise).
(c) Use of estimates and judgments
The preparation of the condensed consolidated interim financial statements in conformity with IFRS requires management to make judgments, estimates and assumptions that affect the application of accounting policies and the reported amounts in the condensed consolidated interim financial statements and accompanying notes. By their nature, these estimates are subject to measurement uncertainty and the effect on the financial statements of changes in such estimates in future periods could be material. Actual results may differ from these estimates. Estimates and judgments are continuously evaluated and are based on management’s experience and other factors, including expectations of future events that are believed to be reasonable under the circumstances. Revisions to accounting estimates are recognized in the period in which the estimates are revised and in any future periods affected.
In preparing these condensed consolidated interim financial statements, the critical judgments that management has made in the process of applying Delphi’s accounting policies and that have the most significant effect on the amounts recognized were the same as those applied to the consolidated financial statements as at and for the year ended December 31, 2016.
3) SIGNIFICANT ACCOUNTING POLICIES
The accounting policies applied by the Company in these condensed consolidated interim financial statements are the same as those applied by the Company in its consolidated financial statements as at and for the year ended December 31, 2016.

- 33 -
4) DETERMINATION OF FAIR VALUES
A number of the Company’s accounting policies and disclosures require the determination of fair value for both financial and non-financial assets and liabilities. IFRS establishes a fair value hierarchy that prioritizes the inputs to valuation techniques used to measure fair value. The three levels of the fair value hierarchy are described as follows:
Level 1 – Quoted prices are available in active markets for identical assets or liabilities as of the reporting date. Active markets are those in which transactions occur in sufficient frequency and volume to provide pricing information on an ongoing basis.
Level 2 – Valuations are based on inputs, including quoted forward prices for commodities, time value and volatility
factors which can be substantially observed or corroborated in the marketplace.
Level 3 – Valuations in this level are those with inputs for the asset or liability that are not based on observable market
data.
Fair values have been determined for measurement and/or disclosure purposes based on the following methods:
(a) Cash and cash equivalents, accounts receivable, accounts payable and accrued liabilities:
The fair value of cash and cash equivalents, accounts receivable, accounts payable and accrued liabilities approximate their carrying value due to their short term to maturity.
(b) Bank debt and “Senior Secured Notes” (as defined in Note 9):
The debt consists of a senior credit facility and Senior Secured Notes. The fair value disclosure of the Company’s senior credit facility approximates its carrying value as it bears interest at floating rates and the applicable margin is indicative of the Company’s current credit premium. In the case of the Senior Secured Notes, the fair value disclosure is measured at level 1 of the fair value hierarchy. The Senior Secured Notes have a fair value of $62.4 million based on March 31, 2017 trading values.
(c) Restricted share units:
The restricted share unit liability is measured at level 2 of the fair value hierarchy. The fair value is based on the Company’s closing share price on the last business day immediately preceding the date of the consolidated statement of financial position.
(d) Derivatives:
Delphi’s interest, foreign exchange, basis differential and commodity contracts are measured at level 2 of the fair value hierarchy. The fair value of commodity contracts is determined by discounting the remaining contracted petroleum and natural gas volumes by the difference between the contracted price and published forward price curves as at the consolidated financial position date. The fair value of interest rate swap contracts is determined by discounting the net future cash flows based on the fixed and variable rates associated with the notional amounts.
5) FINANCIAL RISK MANAGEMENT
The Company is exposed to market, credit and liquidity risks from its use of financial instruments. There have not been any changes to the Company’s exposure to each of the above risks and the Company’s policies and processes for measuring and managing these risks since December 31, 2016.
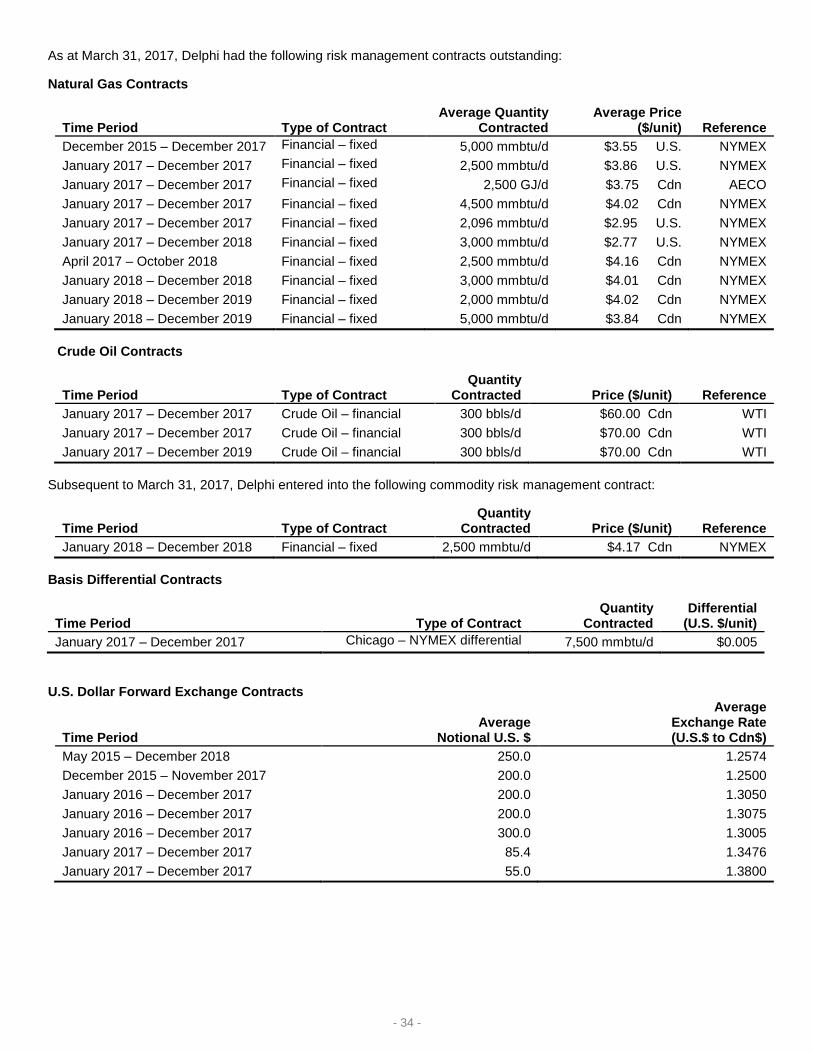
- 34 -
As at March 31, 2017, Delphi had the following risk management contracts outstanding:
Natural Gas Contracts
Time Period Type of Contract
Average Quantity Contracted
Average Price ($/unit) Reference
December 2015 – December 2017 Financial – fixed 5,000 mmbtu/d $3.55 U.S. NYMEX
January 2017 – December 2017 Financial – fixed 2,500 mmbtu/d $3.86 U.S. NYMEX
January 2017 – December 2017 Financial – fixed 2,500 GJ/d $3.75 Cdn AECO
January 2017 – December 2017 Financial – fixed 4,500 mmbtu/d $4.02 Cdn NYMEX
January 2017 – December 2017 Financial – fixed 2,096 mmbtu/d $2.95 U.S. NYMEX
January 2017 – December 2018 Financial – fixed 3,000 mmbtu/d $2.77 U.S. NYMEX
April 2017 – October 2018 Financial – fixed 2,500 mmbtu/d $4.16 Cdn NYMEX
January 2018 – December 2018 Financial – fixed 3,000 mmbtu/d $4.01 Cdn NYMEX
January 2018 – December 2019 Financial – fixed 2,000 mmbtu/d $4.02 Cdn NYMEX
January 2018 – December 2019 Financial – fixed 5,000 mmbtu/d $3.84 Cdn NYMEX
Crude Oil Contracts
Time Period Type of Contract
Quantity Contracted Price ($/unit) Reference
January 2017 – December 2017 Crude Oil – financial 300 bbls/d $60.00 Cdn WTI
January 2017 – December 2017 Crude Oil – financial 300 bbls/d $70.00 Cdn WTI
January 2017 – December 2019 Crude Oil – financial 300 bbls/d $70.00 Cdn WTI
Subsequent to March 31, 2017, Delphi entered into the following commodity risk management contract:
Time Period Type of Contract
Quantity Contracted Price ($/unit) Reference
January 2018 – December 2018 Financial – fixed 2,500 mmbtu/d $4.17 Cdn NYMEX
Basis Differential Contracts
Time Period Type of Contract
Quantity Contracted
Differential (U.S. $/unit)
January 2017 – December 2017 Chicago – NYMEX differential 7,500 mmbtu/d $0.005
U.S. Dollar Forward Exchange Contracts
Time Period
Average Notional U.S. $
Average Exchange Rate (U.S.$ to Cdn$)
May 2015 – December 2018 250.0 1.2574
December 2015 – November 2017 200.0 1.2500
January 2016 – December 2017 200.0 1.3050
January 2016 – December 2017 200.0 1.3075
January 2016 – December 2017 300.0 1.3005
January 2017 – December 2017 85.4 1.3476
January 2017 – December 2017 55.0 1.3800

- 35 -
Interest Rate Swap
Time Period Notional $ Fixed Interest Rate
May 2015 – May 2017 30,000 0.875% February 2016 – January 2018 30,000 0.630% February 2016 – January 2018 15,000 0.640%
The fair value of the risk management contracts outstanding as at March 31, 2017 is estimated to be a net liability of $0.1 million (December 31, 2016, net liability of $9.0 million). As at March 31, 2017 the following derivative financial assets and financial liabilities were offset on the consolidated statement of financial position:
Gross Amounts of
Recognized Financial Assets (Liabilities)
Gross Amounts of Recognized Financial
Assets (Liabilities) Offset
Net Amounts of Financial Assets
(Liabilities) Recognized
Risk management contracts
Current asset 1,946 (1,783) 163
Long term asset 1,435 (286) 1,149
Current liability (1,881) 586 (1,295)
Long term liability (136) - (136)
Net asset (liability) 1,364 (1,483) (119)
For the three months ended March 31, 2017, the risk management contracts resulted in realized losses of $0.5 million.
For the three months ended March 31, 2017, Delphi recorded an unrealized gain on its risk management contracts of $8.9 million. The unrealized gain recognized for the three months ended March 31, 2017 is the difference between the fair values of the risk management contracts outstanding as at March 31, 2017 and the fair values as at December 31, 2016.
As at March 31, 2017, if the future strip prices for crude oil were $1.00 per barrel higher with all other variables held constant, the unrealized gain on risk management contracts for the three months ended March 31, 2017 would have decreased by $0.3 million. As at March 31, 2017, if the future strip prices for natural gas were $0.10 per gigajoule or $0.10 per million British thermal unit higher with all other variables held constant, the unrealized gain on risk management contracts for the three months ended March 31, 2017 would have decreased by $1.6 million.
As at March 31, 2017, if the U.S. to Canadian dollar exchange rate would have been $0.01 higher with all other variables held constant, the unrealized gain on risk management contracts for the three months ended March 31, 2017 would have decreased by $0.1 million.
6) EXPLORATION AND EVALUATION ASSETS
Total
Balance as at December 31, 2015 19,213
Additions 4,998
Expense (568)
Transfer to oil and gas properties (1,172)
Dispositions (6,723)
Balance as at December 31, 2016 15,748
Additions 2,168
Transfer to oil and gas properties (2,312)
Balance as at March 31, 2017 15,604
Exploration and evaluation assets consist of the Company’s exploration projects which are pending the determination of proved and probable reserves.
During the first three months of 2017, Delphi added $2.2 million of exploration and evaluation expenditures related to developing the Montney formation at Bigstone. In the first quarter of 2017, Delphi transferred $2.3 million of exploration and evaluation assets to property, plant and equipment following the addition of proved and probable reserves.

- 36 -
7) PROPERTY, PLANT AND EQUIPMENT
Cost
Crude oil and natural gas properties
Production equipment
Other assets
Total
Balance as at December 31, 2015 429,650 59,756 1,080 490,486
Additions 49,989 892 (4) 50,877
Decommissioning obligations (50) (366) - (416)
Disposition (45,233) (16,880) - (62,113)
Transfers from exploration and evaluation assets 1,172 - - 1,172
Balance as at December 31, 2016 435,528 43,402 1,076 480,006
Additions 26,150 2,076 - 28,226
Decommissioning obligations 278 - - 278
Dispositions 80 - - 80
Transfers from exploration and evaluation assets 2,312 - - 2,312
Balance as at March 31, 2017 464,348 45,478 1,076 510,902
Accumulated depletion and depreciation Crude oil and natural
gas properties Production equipment
Other assets
Total
Balance as at December 31, 2015 (165,807) (26,331) (747) (192,885)
Depletion and depreciation (29,120) (1,080) (84) (30,284)
Dispositions 15,620 3,221 - 18,841
Impairment losses (17,990) (2,471) - (20,461)
Balance as at December 31, 2016 (197,297) (26,661) (831) (224,789)
Depletion and depreciation (7,708) (216) (18) (7,942)
Balance as at March 31, 2017 (205,005) (26,877) (849) (232,731)
Net book value as at December 31, 2016 238,321 16,741 245 255,217
Net book value as at March 31, 2017 259,343 18,601 227 278,171
For the three months ended March 31, 2017, Delphi has included $166.0 million (March 31, 2016: $237.7 million) for future development costs and excluded $1.1 million (March 31, 2016: $1.1 million) for estimated salvage to its costs subject to depletion and depreciation.
For the three months ended March 31, 2017, Delphi capitalized $0.4 million (December 31, 2016: $1.6 million) of general and administrative expenses and $0.1 million (December 31, 2016: $0.3 million) of share-based compensation expense directly related to exploration and development activities.
During the first three months of 2017, Delphi disposed of certain interests in its Miscellaneous Alberta CGU for net proceeds of $0.1 million. The net assets sold had no book value and decommissioning obligations of $0.2 million resulting in a gain of $0.3 million.
During the first quarter of 2016, Delphi received proceeds of $4.6 million in exchange for a gross overriding royalty on two gross wells completed during the quarter. A gain of $1.7 million was recorded on the granting of the gross overriding royalty.
8) BANK DEBT
March 31, 2017 December 31, 2016
Senior Credit Facility (1)
Prime-based loans 32,000 15,000
Bankers’ acceptances, net of discount - 9,987
Total 32,000 24,987
(1) As at March 31, 2017, the Company had outstanding letters of credit totaling $5.8 million.

- 37 -
In January 2017, Delphi entered into a new $80.0 million senior secured credit facility consisting of a $12.5 million operating facility and a $67.5 million revolving facility with a new banking syndicate.
The Company’s new senior credit facility with a syndicate of Canadian chartered banks is subject to the banks’ semi-annual review of the Company’s crude oil and natural gas properties. The facility is a 364 day committed facility available on a revolving basis until May 31, 2017 at which time it may be extended at the lenders’ option. If the revolving period is not extended, the undrawn portion of the facility will be cancelled and the amount outstanding would be required to be repaid at the end of the non-revolving term being May 31, 2018. The non-extension provisions are applicable to the lenders on an individual basis.
Interest payable on amounts drawn under the facility is at the prevailing bankers’ acceptance or LIBOR rates plus stamping fees, lenders’ prime rate or U.S. base rate plus the applicable margins, depending on the form of borrowing by the Company. The applicable margins and stamping fees are based on a sliding scale pricing grid tied to the Company’s trailing debt to earnings before interest, taxes, depreciation and amortization ratio: from a minimum of the bank’s prime rate or U.S. base rate plus 1.00 percent to a maximum of the bank’s prime rate or U.S. base rate plus 3.00 percent or from a minimum of bankers’ acceptances or LIBOR rate plus a stamping fee of 2.00 percent to a maximum of bankers’ acceptances rate plus a stamping fee of 4.00 percent.
The new senior credit facility is secured by a $200.0 million demand floating charge debenture and a general security agreement over all assets of the Company.
The annual review of the Company’s $80.0 million extendible revolving term credit facility is currently underway and is expected to be completed on or before May 31, 2017. The borrowing base of the facilities will be based on the lenders’ evaluation of the Company’s petroleum and natural gas reserves at the time and commodity prices. A decrease in the borrowing base could result in a reduction to the credit facility, which may require a repayment to the lenders.
As at March 31, 2017, Delphi had $42.2 million (net of outstanding letters of credit) available to be drawn on the senior credit facility.
The senior credit facility is subject to the following financial covenant: Financial covenant
Requirement
As at March 31, 2017
Adjusted working capital ratio > 1.0 1.4
For the purpose of the financial covenants, the following definitions are applicable:
Adjusted working capital ratio
Current assets include the undrawn portion of the senior credit facility and exclude the current portion of the fair value of financial instruments. Current liabilities exclude the current portion of long term debt and the current portion of the fair value of financial instruments.
9) SENIOR SECURED NOTES
Senior Secured
Notes Warrants
Total
Balance as at December 31, 2016 52,929 3,055 55,984
Accretion of discount and amortization of issue costs 373 - 373
Balance, end of period 53,302 3,055 56,357
On June 15, 2016, Delphi issued $60.0 million of 10 percent Senior Secured Notes (the “Senior Secured Notes”) with attached warrants (see Note 10). The Company issued 60 thousand units with each unit consisting of a $1,000 note and 245 warrants. The Senior Secured Notes mature on July 15, 2021. Interest is payable quarterly to the holders of record on the immediately preceding April 1, July 1, October 1 and January 1. The Senior Secured Notes are redeemable at the Company’s option, in whole or part during the twelve month period beginning on June 15 of the years indicated at the following specified redemption prices (expressed as a percentage of the principal amount): 2018 at 107.50 percent, 2019 at 105.00 percent and 2020 and thereafter at 100.00 percent. Prior to June 15, 2018, Delphi has the option to redeem up to 50 percent the Senior Secured Notes at a redemption price of 110.00 percent plus accrued interest with an amount of cash not greater than the net cash proceeds of certain equity offerings.
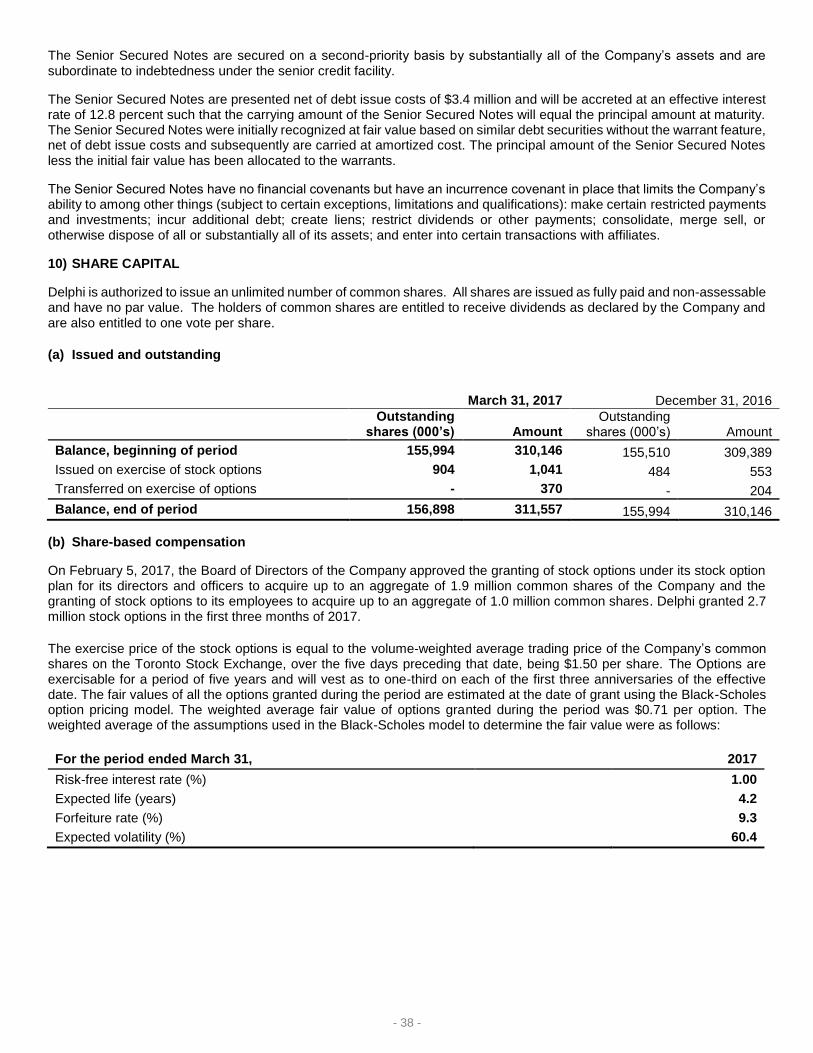
- 38 -
The Senior Secured Notes are secured on a second-priority basis by substantially all of the Company’s assets and are subordinate to indebtedness under the senior credit facility.
The Senior Secured Notes are presented net of debt issue costs of $3.4 million and will be accreted at an effective interest rate of 12.8 percent such that the carrying amount of the Senior Secured Notes will equal the principal amount at maturity. The Senior Secured Notes were initially recognized at fair value based on similar debt securities without the warrant feature, net of debt issue costs and subsequently are carried at amortized cost. The principal amount of the Senior Secured Notes less the initial fair value has been allocated to the warrants.
The Senior Secured Notes have no financial covenants but have an incurrence covenant in place that limits the Company’s ability to among other things (subject to certain exceptions, limitations and qualifications): make certain restricted payments and investments; incur additional debt; create liens; restrict dividends or other payments; consolidate, merge sell, or otherwise dispose of all or substantially all of its assets; and enter into certain transactions with affiliates.
10) SHARE CAPITAL
Delphi is authorized to issue an unlimited number of common shares. All shares are issued as fully paid and non-assessable and have no par value. The holders of common shares are entitled to receive dividends as declared by the Company and are also entitled to one vote per share.
(a) Issued and outstanding
March 31, 2017
December 31, 2016
Outstanding shares (000’s)
Amount
Outstanding shares (000’s)
Amount
Balance, beginning of period 155,994 310,146 155,510 309,389
Issued on exercise of stock options 904 1,041 484 553
Transferred on exercise of options - 370 - 204
Balance, end of period 156,898 311,557 155,994 310,146
(b) Share-based compensation
On February 5, 2017, the Board of Directors of the Company approved the granting of stock options under its stock option plan for its directors and officers to acquire up to an aggregate of 1.9 million common shares of the Company and the granting of stock options to its employees to acquire up to an aggregate of 1.0 million common shares. Delphi granted 2.7 million stock options in the first three months of 2017. The exercise price of the stock options is equal to the volume-weighted average trading price of the Company’s common shares on the Toronto Stock Exchange, over the five days preceding that date, being $1.50 per share. The Options are exercisable for a period of five years and will vest as to one-third on each of the first three anniversaries of the effective date. The fair values of all the options granted during the period are estimated at the date of grant using the Black-Scholes option pricing model. The weighted average fair value of options granted during the period was $0.71 per option. The weighted average of the assumptions used in the Black-Scholes model to determine the fair value were as follows:
For the period ended March 31, 2017
Risk-free interest rate (%) 1.00
Expected life (years) 4.2
Forfeiture rate (%) 9.3
Expected volatility (%) 60.4

- 39 -
The following table summarizes the changes in the number of options outstanding and the weighted average exercise prices:
March 31, 2017
Outstanding
options (000’s)
Weighted average
exercise price
Balance, beginning of period 10,058 1.60
Granted 2,690 1.50
Forfeited (417) 3.45
Exercised (904) 1.15
Expired (110) 2.15
Balance, end of period 11,317 1.54
As at March 31, 2017, 0.1 million restricted share units were outstanding.
(c) Warrants
As at March 31, 2017, 14.7 million warrants were outstanding.
(d) Net earnings per share
Net earnings per share has been calculated based on the following weighted average common shares:
Three Months Ended March 31
2017 2016
Weighted average common shares - basic 156,790 155,510
Dilutive effect of share options outstanding 1,805 -
Dilutive effect of warrants outstanding 1,180 -
Weighted average common shares - diluted 159,775 155,510
For the three months ended March 31, 2017, a total of 9.5 million stock options (March 31, 2016: 14.4 million) were excluded from the calculation as they were anti-dilutive.
11) SUPPLEMENTAL CASH FLOW INFORMATION
Changes in non-cash working capital are comprised of the following:
Three Months Ended March 31
2017 2016
Source (use) of cash
Accounts receivable 930 (1,344)
Prepaid expenses and deposits (532) (95)
Accounts payable and accrued liabilities 13,261 1,719
Total change in non-cash working capital 13,659 280
Relating to:
Operating activities 2,964 6,172
Investing activities 10,695 (5,892)
13,659 280

- 40 -
DIRECTORS David J. Reid President and Chief Executive Officer Delphi Energy Corp. Harry S. Campbell, Q.C. (1) (3) Chairman Emeritus Burnet, Duckworth & Palmer LLP Robert A. Lehodey, Q.C. (2) (3) Partner Osler, Hoskin & Harcourt LLP Andrew E. Osis (1) (3) Independent Businessman David J. Sandmeyer (2) Independent Businessman Lamont C. Tolley (1) (2) Independent Businessman
(1) Member of the Audit Committee (2) Member of the Reserves Committee (3) Member of the Corporate Governance and Compensation Committee AUDITORS KPMG LLP LEGAL COUNSEL Osler, Hoskin & Harcourt LLP ABBREVIATIONS bbls...........................................................................barrels bbls/d ...........................................................barrels per day mbbls..........................................................thousand barrels mcf .......................................................thousand cubic feet mcf/d .........................................thousand cubic feet per day mmcf ..........................................................million cubic feet
OFFICERS
David J. Reid
President and Chief Executive Officer
Mark Behrman Chief Financial Officer
Rod A. Hume
Senior Vice President Engineering
Hugo H. Batteke Vice President Operations
John Behr
Vice President Geosciences
Michael K. Galvin Vice President Land
CORPORATE OFFICE
300, 500 – 4th Avenue S.W. Calgary, Alberta T2P 2V6
Telephone: (403) 265-6171 Facsimile: (403) 265-6207
Email: [email protected] Website: www.delphienergy.ca
BANKERS
Alberta Treasury Branches
The Bank of Nova Scotia
INDEPENDENT ENGINEERS
GLJ Petroleum Consultants Ltd.
STOCK EXCHANGE LISTING
Toronto Stock Exchange – DEE
TRANSFER AGENT
Computershare Trust Company of Canada mmcf/d ...............................million cubic feet per day NGL ..............................................natural gas liquids bcf ....................................................billion cubic feet boe ...................barrels of oil equivalent (6 mcf:1 bbl) boe/d ........................barrels of oil equivalent per day mmboe .......................million barrels of oil equivalent