equity ownership in america (pdf) - investment company institute
TRANSCRIPT

Investment Company Institute
and the
Securities Industry Association
Equity Ownershipin America

Equity Ownership in America
Fall 1999
Investment Company Institute
and the
Securities Industry Association

Copyright © 1999 by the Investment Company Institute and Securities Industry Association

Table of Contents
List of Figures . . . . . . . . . . . . . . . . . . . . . . . . . . . . . . . . . . . . . . . . . . . . . . . . . . . . . . . . . . . . . . . . . . . . . . v
Introduction . . . . . . . . . . . . . . . . . . . . . . . . . . . . . . . . . . . . . . . . . . . . . . . . . . . . . . . . . . . . . . . . . . . . . . . . 1
Summary of Findings . . . . . . . . . . . . . . . . . . . . . . . . . . . . . . . . . . . . . . . . . . . . . . . . . . . . . . . . . . . . . . . . . 5
Chapter 1: Overview of Equity Owners . . . . . . . . . . . . . . . . . . . . . . . . . . . . . . . . . . . . . . . . . . . . . . . . . . 13Ownership of Equities by U.S. Households . . . . . . . . . . . . . . . . . . . . . . . . . . . . . . . . . . . . . . . . . . . . . . . . .13
Characteristics of Equity Owners . . . . . . . . . . . . . . . . . . . . . . . . . . . . . . . . . . . . . . . . . . . . . . . . . . . . . . . . .14
Characteristics of Equity Investing . . . . . . . . . . . . . . . . . . . . . . . . . . . . . . . . . . . . . . . . . . . . . . . . . . . . . . . .16
Views on Equity Investing . . . . . . . . . . . . . . . . . . . . . . . . . . . . . . . . . . . . . . . . . . . . . . . . . . . . . . . . . . . . . .19
Equity Transaction Activity in 1998 . . . . . . . . . . . . . . . . . . . . . . . . . . . . . . . . . . . . . . . . . . . . . . . . . . . . . . .21
Equity Owners by Level of Transaction Activity in 1998 . . . . . . . . . . . . . . . . . . . . . . . . . . . . . . . . . . . . . . .23
Equity Owners by Purchase of Equities in 1998 . . . . . . . . . . . . . . . . . . . . . . . . . . . . . . . . . . . . . . . . . . . . .24
Equity Owners Who Sold 12 or More Equities in 1998 . . . . . . . . . . . . . . . . . . . . . . . . . . . . . . . . . . . . . . .29
Equity Owners by Internet Purchase or Sale of Equities in 1998 . . . . . . . . . . . . . . . . . . . . . . . . . . . . . . . . .29
Chapter 2: Owners of Individual Stock Outside Employer-sponsored Retirement Plans . . . . . . . . . . . . . 33 Characteristics of Owners of Individual Stock Outside Employer Plans . . . . . . . . . . . . . . . . . . . . . . . . . . .33
Individual Stock Transaction Activity Outside Employer Plans in 1998 . . . . . . . . . . . . . . . . . . . . . . . . . . .36
Most Recent Individual Stock Purchase or Sale Outside Employer Plans . . . . . . . . . . . . . . . . . . . . . . . . . .38
Chapter 3: Owners of Stock Mutual Funds Outside Employer-sponsored Retirement Plans . . . . . . . . . . 41Characteristics of Owners of Stock Mutual Funds Outside Employer Plans . . . . . . . . . . . . . . . . . . . . . . . .41
Stock Mutual Fund Transaction Activity Outside Employer Plans in 1998 . . . . . . . . . . . . . . . . . . . . . . . . .44
Most Recent Stock Mutual Fund Purchase or Sale Outside Employer Plans . . . . . . . . . . . . . . . . . . . . . . . .48
Chapter 4: Owners of Individual Stock and Stock Mutual Funds Inside Employer-sponsored Retirement Plans . . . . . . . . . . . . . . . . . . . . . . . . . . . . . . . . . . . . . . . . . 49Characteristics of Owners of Individual Stock Inside Employer Plans . . . . . . . . . . . . . . . . . . . . . . . . . . . . .49Characteristics of Owners of Stock Mutual Funds Inside Employer Plans . . . . . . . . . . . . . . . . . . . . . . . . . .52Equity Owner Changes to Employer Plans in 1998 . . . . . . . . . . . . . . . . . . . . . . . . . . . . . . . . . . . . . . . . . . .52
Appendix A: Detailed Research Methodology . . . . . . . . . . . . . . . . . . . . . . . . . . . . . . . . . . . . . . . . . . . . . 57
Equity Ownership in America iii

Appendix B: Detailed Tabulations for All Equity Owners, Individual Stock Owners, and Stock Mutual Fund Shareholders . . . . . . . . . . . . . . . . . . . . . . . . . . . . . . . . . . . . 59
Appendix C: Detailed Tabulations for All Equity Owners by Key Demographic Variables . . . . . . . . . . . . . . . . . . . . . . . . . . . . . . . . . . . . . . . . . 67Investment Decisionmaker . . . . . . . . . . . . . . . . . . . . . . . . . . . . . . . . . . . . . . . . . . . . . . . . . . . . . . . . . . . . . .68
Household Income . . . . . . . . . . . . . . . . . . . . . . . . . . . . . . . . . . . . . . . . . . . . . . . . . . . . . . . . . . . . . . . . . . . .70
Household Financial Assets . . . . . . . . . . . . . . . . . . . . . . . . . . . . . . . . . . . . . . . . . . . . . . . . . . . . . . . . . . . . .72
Generation . . . . . . . . . . . . . . . . . . . . . . . . . . . . . . . . . . . . . . . . . . . . . . . . . . . . . . . . . . . . . . . . . . . . . . . . . .74
Region . . . . . . . . . . . . . . . . . . . . . . . . . . . . . . . . . . . . . . . . . . . . . . . . . . . . . . . . . . . . . . . . . . . . . . . . . . . . .76
Appendix D: Detailed Tabulations for Individual Stock Owners by Key Demographic Variables . . . . . . . . . . . . . . . . . . . . . . . . . . . . . . . . . . . . 79Investment Decisionmaker . . . . . . . . . . . . . . . . . . . . . . . . . . . . . . . . . . . . . . . . . . . . . . . . . . . . . . . . . . . . . .80
Household Income . . . . . . . . . . . . . . . . . . . . . . . . . . . . . . . . . . . . . . . . . . . . . . . . . . . . . . . . . . . . . . . . . . . .82
Household Financial Assets . . . . . . . . . . . . . . . . . . . . . . . . . . . . . . . . . . . . . . . . . . . . . . . . . . . . . . . . . . . . .84
Generation . . . . . . . . . . . . . . . . . . . . . . . . . . . . . . . . . . . . . . . . . . . . . . . . . . . . . . . . . . . . . . . . . . . . . . . . . .86
Region . . . . . . . . . . . . . . . . . . . . . . . . . . . . . . . . . . . . . . . . . . . . . . . . . . . . . . . . . . . . . . . . . . . . . . . . . . . . .88
Appendix E: Detailed Tabulations for Stock Mutual Fund Shareholders by Key Demographic Variables . . . . . . . . . . . . . . . . . . . . . . . . . . . . . . . . 91Investment Decisionmaker . . . . . . . . . . . . . . . . . . . . . . . . . . . . . . . . . . . . . . . . . . . . . . . . . . . . . . . . . . . . . .92
Household Income . . . . . . . . . . . . . . . . . . . . . . . . . . . . . . . . . . . . . . . . . . . . . . . . . . . . . . . . . . . . . . . . . . . .94
Household Financial Assets . . . . . . . . . . . . . . . . . . . . . . . . . . . . . . . . . . . . . . . . . . . . . . . . . . . . . . . . . . . . .96
Generation . . . . . . . . . . . . . . . . . . . . . . . . . . . . . . . . . . . . . . . . . . . . . . . . . . . . . . . . . . . . . . . . . . . . . . . . . .98
Region . . . . . . . . . . . . . . . . . . . . . . . . . . . . . . . . . . . . . . . . . . . . . . . . . . . . . . . . . . . . . . . . . . . . . . . . . . . .100
iv Equity Ownership in America

List of Figures
Introduction
Figure 1 30-Year Treasury Yield, 1980-1998 . . . . . . . . . . . . . . . . . . . . . . . . . . . . . . . . . . . . . . . . . . . . . . . . . . . . . . . . 2
Figure 2 Stock Market Performance Indices, 1980-1998 . . . . . . . . . . . . . . . . . . . . . . . . . . . . . . . . . . . . . . . . . . . . . . 2
Figure 3 Household Ownership of Equities, 1953-1998 . . . . . . . . . . . . . . . . . . . . . . . . . . . . . . . . . . . . . . . . . . . . . . 3
Summary of Findings
Figure 4 Equity Ownership in the U.S. in 1999 . . . . . . . . . . . . . . . . . . . . . . . . . . . . . . . . . . . . . . . . . . . . . . . . . . . . . 5
Figure 5 Year of First Equity Purchase . . . . . . . . . . . . . . . . . . . . . . . . . . . . . . . . . . . . . . . . . . . . . . . . . . . . . . . . . . . . . 6
Figure 6 Summary of Characteristics of Equity Owners by Generation . . . . . . . . . . . . . . . . . . . . . . . . . . . . . . . . . . . 7
Figure 7 Household Assets in Equities . . . . . . . . . . . . . . . . . . . . . . . . . . . . . . . . . . . . . . . . . . . . . . . . . . . . . . . . . . . . 8
Figure 8 Equity Transaction Activity in 1998 . . . . . . . . . . . . . . . . . . . . . . . . . . . . . . . . . . . . . . . . . . . . . . . . . . . . . . . 9
Figure 9 Summary of Characteristics of Equity Owners Who Made Transactions in 1998. . . . . . . . . . . . . . . . . . . . 10
Figure 10 Individual Stock Assets of Investors Owning Individual Stocks . . . . . . . . . . . . . . . . . . . . . . . . . . . . . . . . . 11
Figure 11 Stock Mutual Fund Assets of Investors Owning Stock Mutual Funds . . . . . . . . . . . . . . . . . . . . . . . . . . . . 11
Chapter 1: Overview of Equity Owners
Figure 12 U.S. Household Ownership of Equities in 1999. . . . . . . . . . . . . . . . . . . . . . . . . . . . . . . . . . . . . . . . . . . . . 13
Figure 13 Characteristics of Equity Owners . . . . . . . . . . . . . . . . . . . . . . . . . . . . . . . . . . . . . . . . . . . . . . . . . . . . . . . . 15
Figure 14 Assets in All Equities, Individual Stock, and Stock Mutual Funds . . . . . . . . . . . . . . . . . . . . . . . . . . . . . . . 17
Figure 15 Number of All Equities, Individual Stocks, and Stock Mutual Funds Owned . . . . . . . . . . . . . . . . . . . . . . 18
Figure 16 Ownership of Individual Stock in Foreign Companies and International or Global Mutual Funds . . . . . . 19
Figure 17 Views on Equity Investing. . . . . . . . . . . . . . . . . . . . . . . . . . . . . . . . . . . . . . . . . . . . . . . . . . . . . . . . . . . . . . 20
Figure 18 Transactions in 1998 . . . . . . . . . . . . . . . . . . . . . . . . . . . . . . . . . . . . . . . . . . . . . . . . . . . . . . . . . . . . . . . . . . 21
Figure 19 Types of Individual Stock Transactions Conducted by Individual Stock Owners in 1998 . . . . . . . . . . . . . 22
Figure 20 Types of Stock Mutual Fund Transactions Conducted by Stock Mutual Fund Shareholders in 1998. . . . . 23
Figure 21 Transaction Activity in 1998 by Number of Equity Transactions . . . . . . . . . . . . . . . . . . . . . . . . . . . . . . . . 25
Figure 22 Characteristics of Equity Owners by Number of Equity Transactions . . . . . . . . . . . . . . . . . . . . . . . . . . . . 26
Figure 23 Transaction Activity in 1998 by Equity Purchasers . . . . . . . . . . . . . . . . . . . . . . . . . . . . . . . . . . . . . . . . . . . 27
Figure 24 Characteristics of Equity Owners Who Purchased Equities in 1998. . . . . . . . . . . . . . . . . . . . . . . . . . . . . . 28
Figure 25 Characteristics of Equity Owners Who Conducted 12 or More Equity Sales in 1998 . . . . . . . . . . . . . . . . 30
Figure 26 Characteristics of Equity Owners by Use of the Internet to Conduct Equity Transactions in 1998 . . . . . . 32
Equity Ownership in America v

vi Equity Ownership in America
Chapter 2: Owners of Individual Stock Outside Employer-sponsored Retirement Plans
Figure 27 Investor Characteristics—Ownership of Individual Stock Outside Employer-sponsored Retirement Plans . . . . . . . . . . . . . . . . . . . . . . . . . . . . . . . . . . . . . . . . . . . . . 34
Figure 28 Investment Characteristics—Ownership of Individual Stock Outside Employer-sponsored Retirement Plans . . . . . . . . . . . . . . . . . . . . . . . . . . . . . . . . . . . . . . . . . . . . . 35
Figure 29 Purchase Channels Used—Ownership of Individual Stock Outside Employer-sponsored Retirement Plans . . . . . . . . . . . . . . . . . . . . . . . . . . . . . . . . . . . . . . . . . . . . . 36
Figure 30 Transaction Activity in 1998—Ownership of Individual StockOutside Employer-sponsored Retirement Plans . . . . . . . . . . . . . . . . . . . . . . . . . . . . . . . . . . . . . . . . . . . . . 37
Figure 31 Purchases and Sales in 1998—Ownership of Individual Stock Outside Employer-sponsored Retirement Plans . . . . . . . . . . . . . . . . . . . . . . . . . . . . . . . . . . . . . . . . . . . . . 38
Figure 32 Internet Use for Purchases and Sales in 1998—Ownership of Individual Stock Outside Employer-sponsored Retirement Plans . . . . . . . . . . . . . . . . . . . . . . . . . . . . . . . . . . . . . . . . 39
Figure 33 Number of Internet Purchases or Sales in 1998—Ownership of Individual Stock Outside Employer-sponsored Retirement Plans . . . . . . . . . . . . . . . . . . . . . . . . . . . . . . . . . . . . . . . . 39
Figure 34 Source of Money for Most Recent Purchase in 1998—Ownership of Individual Stock Outside Employer-sponsored Retirement Plans. . . . . . . . . . . . . . . . . . . . . . . . . . . . . . . . 39
Figure 35 Disposition of Proceeds from Most Recent Sale in 1998—Ownership of Individual Stock Outside Employer-sponsored Retirement Plans. . . . . . . . . . . . . . . . . . . . . . . . . . . . . . . . 40
Chapter 3: Owners of Stock Mutual Funds Outside Employer-sponsored Retirement Plans
Figure 36 Investor Characteristics—Ownership of Stock Mutual Funds Outside Employer-sponsored Retirement Plans . . . . . . . . . . . . . . . . . . . . . . . . . . . . . . . . . . . . . . . . . . . . . 42
Figure 37 Investment Characteristics—Ownership of Stock Mutual Funds Outside Employer-sponsored Retirement Plans . . . . . . . . . . . . . . . . . . . . . . . . . . . . . . . . . . . . . . . . . . . . . 43
Figure 38 Purchase Channels Used—Ownership of Stock Mutual Funds Outside Employer-sponsored Retirement Plans . . . . . . . . . . . . . . . . . . . . . . . . . . . . . . . . . . . . . . . . . . . . . 44
Figure 39 Transaction Activity in 1998—Ownership of Stock Mutual Funds Outside Employer-sponsored Retirement Plans . . . . . . . . . . . . . . . . . . . . . . . . . . . . . . . . . . . . . . . . . . . . . 45
Figure 40 Purchases and Sales in 1998—Ownership of Stock Mutual Funds Outside Employer-sponsored Retirement Plans . . . . . . . . . . . . . . . . . . . . . . . . . . . . . . . . . . . . . . . . . . . . . 45
Figure 41 Internet Use for Purchases and Sales in 1998—Ownership of Stock Mutual Funds Outside Employer-sponsored Retirement Plans . . . . . . . . . . . . . . . . . . . . . . . . . . . . . . . . . . . . . . . . 46
Figure 42 Number of Internet Purchases or Sales in 1998—Ownership of Stock Mutual Funds Outside Employer-sponsored Retirement Plans . . . . . . . . . . . . . . . . . . . . . . . . . . . . . . . . . . . . . . . . 46
Figure 43 Source of Money for Most Recent Purchase in 1998—Ownership of Stock Mutual Funds Outside Employer-sponsored Retirement Plans. . . . . . . . . . . . . . . . . . . . . . . . . . . . . 47
Figure 44 Disposition of Proceeds from Most Recent Sale in 1998—Ownership of Stock Mutual Funds Outside Employer-sponsored Retirement Plans. . . . . . . . . . . . . . . . . . . . . . . . . . . . . 47

Chapter 4: Owners of Individual Stock and Stock Mutual Funds Inside Employer-sponsored Retirement Plans
Figure 45 Investor Characteristics—Ownership of Individual Stock Inside Employer-sponsored Retirement Plans . . . . . . . . . . . . . . . . . . . . . . . . . . . . . . . . . . . . . . . . . . . . . . . 50
Figure 46 Investment Characteristics—Ownership of Individual Stock Inside Employer-sponsored Retirement Plans . . . . . . . . . . . . . . . . . . . . . . . . . . . . . . . . . . . . . . . . . . . . . . . 51
Figure 47 Investor Characteristics—Ownership of Stock Mutual Funds Inside Employer-sponsored Retirement Plans . . . . . . . . . . . . . . . . . . . . . . . . . . . . . . . . . . . . . . . . . . . . . . . 53
Figure 48 Investment Characteristics—Ownership of Stock Mutual Funds Inside Employer-sponsored Retirement Plans . . . . . . . . . . . . . . . . . . . . . . . . . . . . . . . . . . . . . . . . . . . . . . . 54
Figure 49 Payroll Contribution Changes in 1998—Ownership of Equities Inside Employer-sponsored Retirement Plans . . . . . . . . . . . . . . . . . . . . . . . . . . . . . . . . . . . . . . . . . . . . . . . 55
Figure 50 Number of Payroll Contribution Changes Made in 1998—Ownership of Equities Inside Employer-sponsored Retirement Plans . . . . . . . . . . . . . . . . . . . . . . . . . . . . . . . . . . . . . . . . 55
Figure 51 Characteristics of Payroll Changes in 1998—Ownership of Equities Inside Employer-sponsored Retirement Plans . . . . . . . . . . . . . . . . . . . . . . . . . . . . . . . . . . . . . . . . . . . . . . . 55
Figure 52 Allocation Changes Made to Account Balance in 1998—Ownership of Equities Inside Employer-sponsored Retirement Plans . . . . . . . . . . . . . . . . . . . . . . . . . . . . . . . . . . . . . . . . 56
Figure 53 Number of Allocation Changes Made to Account Balance in 1998—Ownership of Equities Inside Employer-sponsored Retirement Plans . . . . . . . . . . . . . . . . . . . . . . . . . . . . . . . . . . . . . . . . 56
Figure 54 Characteristics of Account Balance Allocation Changes—Ownership of Equities Inside Employer-sponsored Retirement Plans . . . . . . . . . . . . . . . . . . . . . . . . . . . . . . . . . . . . . . . . 56
Appendix A: Detailed Research Methodology
Figure 55 Sampling Error at the 95 Percent Confidence Level for Selected Percentages of Responses, by Sample Size . . . . . . . . . . . . . . . . . . . . . . . . . . . . . . . . . . . . . . . . . . . . . . . . . . 58
Appendix B: Detailed Tabulations for All Equity Owners, Individual Stock Owners, and Stock Mutual Fund Shareholders
Figure 56 Demographic Characteristics of All Equity Owners, Individual Stock Owners, and Stock Mutual Fund Shareholders . . . . . . . . . . . . . . . . . . . . . . . . . . . . . . . . . . . . . . 60-61
Figure 57 Financial Characteristics of All Equity Owners, Individual Stock Owners, and Stock Mutual Fund Shareholders . . . . . . . . . . . . . . . . . . . . . . . . . . . . . . . . . . . . . . 62-66
Appendix C: Detailed Tabulations for All Equity Owners by Key Demographic Variables
Figure 58 Characteristics of Equity Owners by Investment Decisionmaker . . . . . . . . . . . . . . . . . . . . . . . . . . . . . . . . 68
Figure 59 Equity Ownership Characteristics by Investment Decisionmaker . . . . . . . . . . . . . . . . . . . . . . . . . . . . . . . 69
Figure 60 Characteristics of Equity Owners by Household Income . . . . . . . . . . . . . . . . . . . . . . . . . . . . . . . . . . . . . . 70
Figure 61 Equity Ownership Characteristics by Household Income. . . . . . . . . . . . . . . . . . . . . . . . . . . . . . . . . . . . . . 71
Figure 62 Characteristics of Equity Owners by Household Financial Assets. . . . . . . . . . . . . . . . . . . . . . . . . . . . . . . . 72
Figure 63 Equity Ownership Characteristics by Household Financial Assets . . . . . . . . . . . . . . . . . . . . . . . . . . . . . . . 73
Equity Ownership in America vii

Figure 64 Characteristics of Equity Owners by Generation . . . . . . . . . . . . . . . . . . . . . . . . . . . . . . . . . . . . . . . . . . . . 74
Figure 65 Equity Ownership Characteristics by Generation . . . . . . . . . . . . . . . . . . . . . . . . . . . . . . . . . . . . . . . . . . . . 75
Figure 66 Characteristics of Equity Owners by Region. . . . . . . . . . . . . . . . . . . . . . . . . . . . . . . . . . . . . . . . . . . . . . . . 76
Figure 67 Equity Ownership Characteristics by Region . . . . . . . . . . . . . . . . . . . . . . . . . . . . . . . . . . . . . . . . . . . . . . . 77
Appendix D: Detailed Tabulations for Individual Stock Owners by Key Demographic Variables
Figure 68 Characteristics of Individual Stock Owners by Investment Decisionmaker . . . . . . . . . . . . . . . . . . . . . . . . 80
Figure 69 Individual Stock Ownership Characteristics by Investment Decisionmaker . . . . . . . . . . . . . . . . . . . . . . . . 81
Figure 70 Characteristics of Individual Stock Owners by Household Income . . . . . . . . . . . . . . . . . . . . . . . . . . . . . . 82
Figure 71 Individual Stock Ownership Characteristics by Household Income . . . . . . . . . . . . . . . . . . . . . . . . . . . . . . 83
Figure 72 Characteristics of Individual Stock Owners by Household Financial Assets . . . . . . . . . . . . . . . . . . . . . . . . 84
Figure 73 Individual Stock Ownership Characteristics by Household Financial Assets . . . . . . . . . . . . . . . . . . . . . . . 85
Figure 74 Characteristics of Individual Stock Owners by Generation. . . . . . . . . . . . . . . . . . . . . . . . . . . . . . . . . . . . . 86
Figure 75 Individual Stock Ownership Characteristics by Generation . . . . . . . . . . . . . . . . . . . . . . . . . . . . . . . . . . . . 87
Figure 76 Characteristics of Individual Stock Owners by Region . . . . . . . . . . . . . . . . . . . . . . . . . . . . . . . . . . . . . . . . 88
Figure 77 Individual Stock Ownership Characteristics by Region . . . . . . . . . . . . . . . . . . . . . . . . . . . . . . . . . . . . . . . 89
Appendix E: Detailed Tabulations for Stock Mutual Fund Shareholders by Key Demographic Variables
Figure 78 Characteristics of Stock Mutual Fund Shareholders by Investment Decisionmaker . . . . . . . . . . . . . . . . . . 92
Figure 79 Stock Mutual Fund Ownership Characteristics by Investment Decisionmaker . . . . . . . . . . . . . . . . . . . . . 93
Figure 80 Characteristics of Stock Mutual Fund Shareholders by Household Income . . . . . . . . . . . . . . . . . . . . . . . . 94
Figure 81 Stock Mutual Fund Ownership Characteristics by Household Income . . . . . . . . . . . . . . . . . . . . . . . . . . . 95
Figure 82 Characteristics of Stock Mutual Fund Shareholders by Household Financial Assets. . . . . . . . . . . . . . . . . . 96
Figure 83 Stock Mutual Fund Ownership Characteristics by Household Financial Assets . . . . . . . . . . . . . . . . . . . . . 97
Figure 84 Characteristics of Stock Mutual Fund Shareholders by Generation . . . . . . . . . . . . . . . . . . . . . . . . . . . . . . 98
Figure 85 Stock Mutual Fund Ownership Characteristics by Generation. . . . . . . . . . . . . . . . . . . . . . . . . . . . . . . . . . 99
Figure 86 Characteristics of Stock Mutual Fund Shareholders by Region. . . . . . . . . . . . . . . . . . . . . . . . . . . . . . . . . 100
Figure 87 Stock Mutual Fund Ownership Characteristics by Region . . . . . . . . . . . . . . . . . . . . . . . . . . . . . . . . . . . . 101
viii Equity Ownership in America
Equity Ownership in America 1
Introduction
Bull Market, Other Developments Fuel Growth In Equity Ownership
Equity ownership in the United States has grown dramatically over the past two decades. In 1983, an estimated 42.4 million Americans owned stocks directly or through mutualfunds.1 By 1999, the number grew to almost 78.7 million, an 85.6 percent increase.2
Several developments have contributed to the expansion of equity ownership.Declining interest rates and the 19-year bull market of rising stock prices promptedmany U.S. households to purchase and hold equities. For example, the yield on 30-yearTreasury bonds declined to 5.1 percent in 1998 from 11.9 percent in 1980. The DowJones Industrial Average, the S&P 500, and the Nasdaq Composite indices each gainedmore than 900 percent between 1980 and 1998 (Figures 1 and 2). Total holdings ofequities by U.S. households rose from 17.2 percent of household financial assets in 1980to 34.9 percent in 1998, the highest percentage of total household assets in the post-World War II era (Figure 3).3 In addition, the shift from employer-directed, defined-benefit pension plans to self-directed, defined-contribution plans —most of whichinclude equity investment options — introduced many U.S. workers to individual stockand stock mutual funds. As of 1997, 66 percent of U.S. workers participated in retire-ment programs that offer tax-deferred accounts.4 Also in that year, nearly all (97 percent)401(k) plans offered equity investments,5 and in 1998, more than four-fifths of 401(k)plan participants held equities in their plan portfolios.6 Moreover, many members of theBaby Boom Generation, the first of whom turn 65 in 2011, began investing in equitiesto finance their retirement years. Finally, financial services companies have made it easierto purchase stocks and mutual funds, for example, by offering online portfolio manage-ment, automatic investment programs, and low minimums to open an account.
1 Shareownership 1985 (New York Stock Exchange).2 The number of individuals owning stocks in the U.S. in 1999 is based on data from the survey presented in
this report.3 Federal Reserve Board, Employee Benefit Research Institute and the Investment Company Institute.4 Retirement Confidence Survey 1998 (Employee Benefit Research Institute and Matt Greenwald and Associates).5 401(k) Plans: Survey Report on Plan Design (Buck Consultants), 1998 Plan Year.6 Unpublished data from a 1998 Investment Company Institute survey of 401(k) plan participants.

0
200
400
600
800
1000
1200
Dow Jones Industrial Average
S&P 500
Nasdaq Composite
1980 1981 1982 1983 1984 1985 1986 1987 1988 1989 1990 1991 1992 1993 1994 1995 1996 1997 1998
0
2
4
6
8
10
12
14
16
1980 1981 1982 1983 1984 1985 1986 1987 1988 1989 1990 1991 1992 1993 1994 1995 1996 1997 1998
2 Equity Ownership in America
FIGURE 1
30-Year Treasury Yield, 1980-1998(percent, year-end)
FIGURE 2
Stock Market Performance Indexes, 1980-1998(percent)
Note: Indexes are set at 100 in 1980.
Source: Securities Industry Association and Bloomberg L.P.
Source: Bloomberg, L.P.

To learn more about Americans who own equities, the Investment Company Institute7
and the Securities Industry Association8 conducted a comprehensive survey that sought to:
� Estimate the incidence of equity ownership among U.S. households, both inside andoutside employer-sponsored retirement plans;9
� Describe the demographic, financial, and stock ownership characteristics of equityowners, and differentiate between those owning stock directly and indirectly throughmutual funds;
� Identify the extent of individual stock and stock mutual fund transaction activity in1998; and,
� Examine the use of the Internet to conduct equity transactions.
0
5
10
15
20
25
30
35
40
1953 1956 1959 1962 1965 1968 1971 1974 1977 1980 1983 1986 1989 1992 1995 1998
Equity Ownership in America 3
7 The Investment Company Institute (ICI) is the national association of the American investment company industry.Its membership as of September 1, 1999 included 7,733 open-end investment companies (“mutual funds”), 483closed-end investment companies, and eight sponsors of unit investment trusts. Its mutual fund members haveassets of about $6.009 trillion, accounting for approximately 95 percent of total industry assets, and have over 73million individual shareholders.
8 The Securities Industry Association (SIA) is the national association of the North American securities industry.Members of SIA include investment banks, broker-dealers, specialists, and mutual fund companies. Collectively,SIA members account for approximately 90 percent of securities firms’ revenue and manage the accounts of morethan 50 million investors and tens of millions of investors indirectly through corporate, thrift, and pension plans.
9 Employer-sponsored retirement plans include 401(k) plans; 403(b) plans; federal, state, or local government plans;SEP-IRAs; SAR-SEPs; or SIMPLE IRAs. Traditional, Roth, and Education IRAs are not employer-sponsored retirement plans.
FIGURE 3
Household Ownership of Equities, 1953-1998(percent of U.S. household financial assets)
Source: Federal Reserve Board, Employee Benefit Research Institute, and the Investment Company Institute.
Note: 1953 is the earliest date for which data is available.

4 Equity Ownership in America
Research Methodology
Equity owners are defined in this study as households owning either publicly traded stockor stock mutual funds.10 A random digit dial (RDD) national probability sample was usedto generate a representative sample of equity owners nationwide. All interviews wereconducted in January and February 1999 with the household decisionmaker most knowl-edgeable about savings and investments. A total of 4,842 household financial decision-makers was asked whether their households owned equities. Of these, 2,336decisionmakers, or 48.2 percent, indicated their households did own equities —1,943completed the entire survey and 393 completed part of it. The 393 partial interviews withknown equity owners were included in the estimate of the incidence of equity ownershipamong U.S. households but were not included in any other analyses.
Separately, an additional 393 interviews were conducted with high-net-worth equityowners. Weights were applied to ensure that the high-net-worth interviews were repre-sented in the total sample in proportion to their incidence in the entire U.S. population.The number of individuals who owned equities in a household was determined by askingrespondents how many persons in their households owned each type of equity. The multiplier for number of individuals per household owning equities was 1.6. The overall sampling error for the survey is plus or minus 2 percent at the 95 percent confidence level.11
10 Households include related family members sharing a housing unit, persons living alone, and unrelated personswho are partners. See footnote 32 in Appendix A: Detailed Research Methodology for a detailed definition of theterm “household.”
11 See Appendix A: Detailed Research Methodology for more information.

48.251.8 Own equitiesDo not
own equities
47
15
38 Own both individual stocksand stock mutual funds
Only own individual stocks
Only own stock mutual funds
Overall Ownership
� Equity ownership is on the rise. A total of 78.7 million individuals owned equities inearly 1999, up 85.6 percent from 42.4 million in 1983.12
� Nearly half of all U.S. households own equities. An estimated 49.2 million, or 48.2percent, of all U.S. households owned equities directly or indirectly through stockmutual funds in early 1999 (Figure 4). In 1983, approximately 19.0 percent of all U.S.households owned equities.13 In 1999, 31.8 percent owned equities through employer-sponsored retirement plans and 35.5 percent owned equities outside such plans.
Summary of Findings
Equity Ownership in America 5
FIGURE 4
Equity Ownership in the U.S. in 1999
12The 1983 data is from Shareownership 1985 (New York Stock Exchange) and the 1999 data is from this report.13Robert B. Avery, et. al., “Summary Descriptions of the 1983 Survey Results,” Federal Reserve Bulletin, vol. 70
(September 1984) p. 689.
Number of individuals owning equities = 78.7 million
Note: A total of 4,842 households were interviewed to collect this information. Only the 2,336 who qualified as equity owners participated in the in-depth survey.
U.S. Households that Own Equities(percent of U.S. households)
Types of Equities Owned(percent of all equity owners)

Demographics
� Equity owners tend to be middle-aged with moderate income and assets. The typicalequity owner is 47, has household income of $60,000 and household financial assets of $85,000. Most equity owners are married, employed, and college graduates.Eighty percent are covered by employer-sponsored retirement plans, and 53 percentown IRAs.
� In most equity-owning households, investment decisionmaking is shared. Co-deci-sionmakers, usually married couples, share the responsibility in 54 percent of equity-owning households. Males make the decisions in 26 percent of households, andfemales make the decisions 20 percent of the time.
� Most equity owners are seasoned investors. Fifty-four percent first purchased equitiesbefore 1990, and 28 percent made their first purchase between 1990 and 1995. Only18 percent made their first equity investment after 1995 (Figure 5).
� Nearly half of all equity owners are Baby Boomers. Nineteen percent of equity ownersare members of Generation X (age 19 to 35), 48 percent are Baby Boomers (age 36 to54), 28 percent are from the Silent Generation (age 55 to 74), and 5 percent aremembers of the GI generation (age 75 or older).
� Generation X equity owners have a more aggressive investment approach than oldergenerations. Generation X equity investors typically allocate a greater portion of theirfinancial portfolios to equities than older generations (Figure 6).
� The largest percentage of equity owners reside in the South. Thirty-three percent ofequity owners live in the South, 26 percent in the Midwest, 25 percent in the West,and 16 percent in the Northeast. Although fewest in number, Northeastern equityowners tend to be older, have more household financial assets, and have a greaterownership rate for individual stocks outside retirement plans than other equity owners.
6 Equity Ownership in America
54
28
18
Before 1990
1996 or later
1990-1995
Number of respondents = 2,122
FIGURE 5
Year of First Equity Purchase(percent of all equity owners)

� The majority of equity owners seek investment advice from financial services profes-sionals. Sixty-four percent say they rely on professional financial advisers when makingequity purchase and sales decisions. Nevertheless, most equity investors are not passive;75 percent closely follow the value of their investments.
Ownership Patterns
� More equity owners own stock mutual funds than individual stocks. Fifty-fourpercent of equity-owning households own stocks directly and 85 percent own stockmutual funds. Furthermore, 15 percent hold only individual stocks, 47 percent holdonly stock mutual funds, and 38 percent own individual stocks and stock mutual funds(see Figure 4).
� Equity ownership characteristics differ by the gender of the household’s investmentdecisionmaker. Co-decisionmaking equity owners have a median of $50,000 investedin four equities; male equity owners have a median of $55,000 invested in five equities.Although female equity owners tend to hold a similar number of equities in their port-folios, the median value of their portfolios is typically smaller than that of co-decision-making or male equity owners. In addition, more male equity owners than female orco-decisionmaking equity owners hold individual stocks. More female and co-decision-making equity owners than male equity owners hold stock mutual funds.
Equity Ownership in America 7
FIGURE 6
Summary of Characteristics of Equity Owners by Generation1
Baby Boom Silent GIGeneration X Generation Generation Generation(age 19 to 35) (age 36 to 54) (age 55 to 74) (age 75 or older)
Median
Age 29 years 44 years 61 years 78 years
Household income $47,000 $62,500 $53,000 $30,000
Household financial assets2 $25,000 $88,000 $200,000 $200,000
Household financial assets in equities $20,000 $50,000 $85,000 $74,000
Number of individual stocks and stock mutual funds owned 3 4 5 5
Percent
Own:
Individual stock (net)3 45 52 58 63
Inside employer-sponsored retirement plans 21 23 17 6
Outside employer-sponsored retirement plans 35 43 51 59
Stock mutual funds (net)3 83 88 84 80
Inside employer-sponsored retirement plans 64 67 47 12
Outside employer-sponsored retirement plans 45 57 62 72
1 Refers to the household’s responding financial decisionmaker for investments. Equity investments include individual stock and stock mutual funds. 2 Includes assets in employer-sponsored retirement plans but excludes value of primary residence.3 Multiple responses included.
Note: Number of respondents varies.

� The size of equity portfolios varies among U.S. households. Many equity owners holdsmall-to-moderate amounts of equities, and only a small number hold exceptionallyhigh asset levels. For example, 50 percent of household owners have equity assets of lessthan $50,000, and 7 percent have equity assets of $500,000 or more (Figure 7).
� Equity owners with employer-sponsored retirement plans favor equity investments in those plans. Equity investors with holdings in employer-sponsored defined-contri-bution plans on average, allocate 61 percent of plan assets to equity investments.
� Ownership of stock in non-U.S. companies is widespread. More than 60 percent ofstock mutual fund shareholders own international or global stock funds, and 15percent of individual stock owners hold stock in foreign companies.
� Investors’ first equity purchase was usually a stock mutual fund. Fifty-nine percent ofequity owners initially bought a stock mutual fund, 31 percent purchased individualstock, and 10 percent bought stock mutual funds and individual stock.
Equity Transactions14
� The majority of equity owners did not buy or sell equities in 1998. Only 45 percentconducted equity transactions in 1998 (Figure 8). Of these, buyers outnumbered sellers three to two.
8 Equity Ownership in America
FIGURE 7
Household Assets in Equities(percent of all equity owners)
Less than $10,000 15
$10,000 to $24,999 15
$25,000 to $49,999 20
$50,000 to $74,999 12
$75,000 to $99,999 7
$100,000 to $249,999 16
$250,000 to $499,999 8
$500,000 to $999,999 4
$1 million or more 3
Mean $167,100
Median $50,000
Number of respondents 2,230
14 In this report, an equity transaction excludes regular, automatic payroll contributions to employer-sponsoredretirement plans but includes employee allocation changes to a particular equity within these plans —eitherthrough payroll contribution changes or account balance changes. An equity transaction also includes reinvestmentof dividends and automatic payroll or savings account purchases of stock funds outside employer plans.
Within this definition, an individual stock transaction excludes regular, automatic payroll contributions toemployer-sponsored retirement plans but includes employee allocation changes within these plans —eitherthrough payroll contribution changes or account balance changes —affecting individual stock holdings.
Also within this definition, a stock mutual fund transaction excludes regular, automatic payroll contributions toemployer-sponsored retirement plans but includes employee allocation changes within these plans —eitherthrough payroll contribution changes or account balance changes —affecting stock mutual fund holdings.

Equity Ownership in America 9
� More individual stock owners than stock mutual fund owners conducted transac-tions in 1998. Outside employer-sponsored retirement plans, 48 percent of individualstock owners bought or sold individual stocks in 1998, compared with 35 percent ofstock mutual fund shareholders who bought or sold stock mutual fund shares.
� More equity owners conducted transactions outside employer-sponsored retirementplans than inside such plans in 1998. Thirty-seven percent conducted equity transac-tions outside retirement plans, compared with 17 percent inside retirement plans.
� Household equity purchases are often financed by accumulated savings. About half ofequity owners purchasing equities outside employer-sponsored retirement plans in1998 used accumulated savings to finance their most recent purchase.
� Proceeds from the sale of equities outside employer plans are often reinvested inother equities. In 1998, 82 percent of individual stock sellers and 74 percent of stockmutual fund sellers outside employer plans reinvested at least some of the proceeds intoother equity investments. Individual stock fund sellers typically reinvested in shares ofother individual stock; stock fund sellers, in shares of other stock funds.
� Use of the Internet to conduct equity transactions is still in its infancy. Only 11percent of investors conducting equity transactions executed trades over the Internet in1998. Internet transactors tend to be high-volume traders. For example, a median of10 individual stock transactions were conducted by Internet transactors, comparedwith one individual stock transaction undertaken by those using conventional tradingmethods (Figure 9).
36
6
58
4555 YesNo
Purchases of equities
Sales of equities
Purchases and sales of equities
FIGURE 8
Equity Transaction Activity in 19981
Number of respondents = 1,989 Number of respondents = 895
1See text footnote 14 on page 8 for the definition of an equity transaction.
Conducted an Equity Transaction(percent of all equity owners)
Types of Equity Transactions Conducted(percent of equity owners who made transactions)

10 Equity Ownership in America
Individual Stock Owners
� Assets in individual stocks rise with age and household income. The median stockassets for those under age 35 is $11,900 while the median stock assets for those 65 orolder is $62,500 (Figure 10).
� Individual stock investors usually own more than one stock. Just 25 percent of indi-vidual stock owners hold stock in a single company. Twenty-eight percent own stock intwo or three companies, and 47 percent own stock in four or more companies.
Stock Mutual Fund Shareholders
� Assets in stock mutual funds rise with age and household income. The median stockfund assets for those earning less than $50,000 is $20,000 while the median stock fundassets for those with incomes of $150,000 or more is $150,000 (Figure 11).
� Stock mutual fund shareholders usually own more than one stock mutual fund. Only19 percent own one stock fund. Thirty-four percent own two or three stock funds, and48 percent own four or more stock funds.
FIGURE 9
Summary of Characteristics of Equity Owners Who Made Transactions in 19981,2
Conduct ConductEquity Equity
Transactions Transactionsover the but not overInternet the Internet
Median
Age 41 years 48 years
Household income $73,800 $65,000
Household financial assets3 $229,000 $125,000
Household financial assets in equities $127,600 $70,000
Number of individual stock transactions in 1998 10 1
Number of stock mutual fund transactions in 1998 2 1
Percent
Own individual stock (net)4 93 64
Inside employer-sponsored retirement plans 33 22
Outside employer-sponsored retirement plans 93 59
Own stock mutual funds (net)4 85 88
Inside employer-sponsored retirement plans 67 57
Outside employer-sponsored retirement plans 63 69
1 Refers to the household’s responding financial decisionmaker for investments.2 See text footnote 14 on page 8 for the definition of an equity transaction.3 Includes assets in employer-sponsored retirement plans but excludes value of primary residence.4 Multiple responses included.
Note: Number of respondents varies.

Equity Ownership in America 11
FIGURE 10
Individual Stock Assets of Investors Owning Individual Stocks(percent of all individual stock owners)
All Age IncomeIndividual Less 35 45 65 Less $50,000 $100,000
Stock than to to or than to to $150,000Owners 35 44 64 Older $50,000 $99,999 $149,999 or More
Less than $10,000 21 39 27 14 12 37 21 16 7
$10,000 to $24,999 17 21 21 16 11 22 24 11 4
$25,000 to $49,999 19 20 20 18 17 15 16 13 11
$50,000 to $74,999 10 8 9 11 12 6 9 12 3
$75,000 to $99,999 9 4 6 12 13 5 8 9 11
$100,000 to $249,999 13 6 11 16 15 9 15 20 20
$250,000 to $499,999 5 1 4 7 8 4 4 9 18
$500,000 to $999,999 4 1 3 4 6 3 3 6 10
$1 million or more 2 1 1 3 6 1 1 4 16
Mean $152,000 $51,300 $70,400 $179,300 $296,100 $82,500 $87,900 $229,800 $546,800
Median $30,000 $11,900 $25,000 $50,000 $62,500 $12,600 $28,500 $61,100 $181,900
Number of respondents 1,200 218 256 488 238 282 357 107 85
FIGURE 11
Stock Mutual Fund Assets of Investors Owning Stock Mutual Funds(percent of all stock mutual fund shareholders)
All Stock Age Income
Mutual Less 35 45 65 Less $50,000 $100,000 Fund than to to or than to to $150,000
Shareholders 35 44 64 Older $50,000 $99,999 $149,999 or More
Less than $10,000 15 30 16 9 8 29 14 5 3
$10,000 to $24,999 18 25 22 14 13 27 18 10 9
$25,000 to $49,999 24 27 26 21 26 20 54 14 10
$50,000 to $74,999 14 9 14 16 16 9 14 12 9
$75,000 to $99,999 7 4 5 8 12 4 7 9 9
$100,000 to $249,999 14 5 12 20 14 7 15 25 28
$250,000 to $499,999 5 1 3 8 9 2 6 16 18
$500,000 to $999,999 2 1 1 4 1 1 1 5 11
$1 million or more 1 0 1 1 2 1 1 3 5
Mean $100,400 $36,200 $75,100 $142,300 $116,900 $49,500 $82,700 $247,900 $298,600
Median $38,000 $20,000 $30,000 $56,000 $50,000 $20,000 $40,000 $94,100 $150,000
Number of respondents 1,935 394 470 766 304 513 627 156 94

CHAPTER 1
Overview of Equity Owners
Ownership of Equities by U.S. Households
Nearly Half of All U.S. Households Own Equities
An estimated 49.2 million, or 48.2 percent, of U.S. households owned equities as ofJanuary 1999 (Figure 12).15 In 1983, 19.0 percent of U.S. households owned equities.16
Over the same period, the number of individual owners rose to 78.7 million from 42.4million, a gain of 85.6 percent.17
Equity Ownership in America 13
FIGURE 12
U.S. Household Ownership of Equities in 1999
Number ofNumber of Individual
Percent of All Households InvestorsU.S. Households (millions) (millions)
Any type of equity (net)1 48.2 49.2 78.7
Any equity inside employer-sponsored retirement plans 31.8 32.5 52.0
Any equity outside employer-sponsored retirement plans 35.5 36.3 61.6
Individual stock (net)1 26.1 26.7 40.0
Individual stock inside employer-sponsored retirement plans 10.5 10.7 14.0
Individual stock outside employer-sponsored retirement plans 21.4 21.9 32.8
Stock mutual funds (net)1 40.9 41.8 66.8
Stock mutual funds inside employer-sponsored retirement plans 27.9 28.5 39.9
Stock mutual funds outside employer-sponsored retirement plans 27.2 27.8 44.4
1 Multiple responses included.
Note: A total of 4,842 households were interviewed to collect this information. Only the 2,336 who qualified as equity owners participated in the in-depth survey.
15The U.S. had approximately 102,118,600 households in 1999, according to the U.S. Bureau of the Census, Current Population Reports, P25-1129. 16Robert B. Avery, et. al., “Summary Descriptions of the 1983 Survey Results,” Federal Reserve Bulletin, vol. 70 (September 1984) p. 689.17The 1983 data is from Shareownership 1985 (New York Stock Exchange) and the 1999 data is from this report.

14 Equity Ownership in America
More U.S. Investors Own Stock Mutual Funds than Individual Stock
An estimated 41.8 million U.S. households — representing 66.8 million individuals and85 percent of all equity investors —owned stock mutual funds in January 1999. Morethan 28 million of those households held stock mutual funds through employer-spon-sored retirement plans, and 27.8 million held stock mutual funds outside retirementplans. In contrast, 26.7 million U.S. households — representing 40 million individualsand 54 percent of all equity owners —held individual stock in January 1999. Nearly 11million households owned individual stock through employer-sponsored retirement plans,and 21.9 million households held individual stock outside these plans.
Characteristics of Equity Owners
Equity Owners Tend to Be Middle-aged, Seasoned Investors with Moderate Income and Assets
The median equity owner is 47 years old, with household income of $60,000 and house-hold financial assets of $85,000 (Figure 13). Most equity owners are married, employed,and college graduates. About one-fifth are retired from their lifetime occupations. Four-fifths have employer-sponsored retirement plans, usually 401(k) plans. Slightly more thanhalf own IRAs.
Equity owners are typically seasoned investors. Fifty-four percent first purchased equi-ties before 1990; 28 percent, between 1990 and 1995; and the remaining 18 percent, after1995. The first purchase typically occurred outside an employer-sponsored retirementplan, usually through a stock mutual fund. Besides owning equities, 39 percent of equityowners hold hybrid mutual funds; 26 percent, investment real estate; and 22 percent,individual bonds or bond mutual funds.
Individual Stock Investors and Stock Mutual Fund Shareholders Differ
Individual stock owners differ in several ways from stock mutual fund shareholders.Individual stock owners tend to have greater household financial assets than stock mutualfund shareholders; their median assets are $125,000 versus $87,500 for stock mutual fundshareholders. In addition, more individual stock owners bought their first equity before1990, more have college degrees, and more own investment real estate than do stockmutual fund shareholders.
Equity Ownership Characteristics Differ by the Gender of the Household’s Investment Decisionmaker
Co-decisionmakers, usually married couples, make the investment decisions in 54 percentof equity-owning households.18 Males make the decisions in 26 percent of these house-holds, and females make the decisions 20 percent of the time.19
Female equity owners have a median age of 50, whereas male and co-decisionmakingequity owners tend to be in their mid-forties (see Figure 58 in Appendix C). The median
18Referred to as co-decisionmaking equity owners.19Referred to as male equity owners and female equity owners, respectively.

FIGURE 13
Characteristics of Equity Owners1
Type of Equity OwnedStock
All Equity Individual Mutual Owners Stock Funds
Median Age 47 years 48 years 47 yearsHousehold income $60,000 $62,500 $60,000 Household financial assets2 $85,000 $125,000 $87,500
Percent Household investment decisionmaker:
Male 26 29 25Female 20 17 20Co-decisionmakers 54 54 55
Married 67 69 68College or postgraduate degree 53 58 53Employed 80 77 81Retired from lifetime occupation 21 24 20Equity investments owned:
Individual stock (net)3 54 100 43Inside employer-sponsored retirement plans 20 37 16Outside employer-sponsored retirement plans 44 83 39
Stock mutual funds (net)3 85 72 100Inside employer-sponsored retirement plans 58 49 69Outside employer-sponsored retirement plans 57 55 67
Bought first equity:Before 1990 54 67 541990 to 1995 28 22 291996 or later 18 11 17
Source of first equity purchase:Inside employer-sponsored retirement plan 44 32 46Outside employer-sponsored retirement plan 56 68 54
Type of equity first purchased:Individual stock only 31 59 18Stock mutual fund only 59 22 70Both individual stock and stock mutual funds 10 19 12
Non-equity investments owned:3
Savings accounts, money market deposit accounts, or certificates of deposit 83 84 83Bond investments (net)3 22 24 24
Individual bonds 9 12 9Bond mutual funds 16 17 19
Fixed or variable annuities 21 23 22Hybrid mutual funds 39 38 44Money market mutual funds 26 30 29Investment real estate 26 32 27
Have employer-sponsored retirement plan coverage 80 79 82Have IRA 53 57 56Ethnic background:4
Caucasian 90 91 90African-American 5 3 5Asian 2 2 1Hispanic 5 3 3Other 2 3 2
1 Refers to the household's responding financial decisionmaker for investments.2 Includes assets in employer-sponsored retirement plans but excludes value of primary residence.3 Multiple responses included.4 Multiple responses included because Hispanics can be of any race.Note: Number of respondents varies. Refer to Appendix B for more details on the demographic and financial characteristics of all equity owners, individual stock owners, and mutual fund shareholders.
Equity Ownership in America 15

16 Equity Ownership in America
household income of female equity owners is $36,000—considerably lower than themedian household incomes of male and co-decisionmaking equity owners, which are$55,000 and $62,500, respectively. Household financial assets follow a similar pattern,except that the median assets of male equity owners is higher than that of co-decisionmak-ing equity owners. Compared with the other two groups, more female equity owners arewidowed and retired. Co-decisionmaking equity owners are the most likely to haveemployer-sponsored retirement plan coverage.
The median equity portfolio of female equity investors is $35,000, compared with$55,000 for male equity owners and $50,000 for co-decisionmaking equity owners (seeFigure 59 in Appendix C). Most female and co-decisionmaking equity owners did notconduct equity transactions in 1998. Male equity owners conducted a median of onetransaction. More male equity owners than female or co-decisionmaking equity ownershold individual stock, and fewer male equity owners hold stock mutual funds. Maleequity owners typically have a higher tolerance for investment risk than either female orco-decisionmaking equity owners.
Equity Ownership, Risk Tolerance Vary by Age
Ownership of equities inside employer-sponsored retirement plans decreases with age,while ownership outside these plans increases with age. Younger equity owners are morewilling to take investment risk, and tend to allocate a greater portion of their financialportfolios to equities than do older owners (see Figures 64 and 65 in Appendix C).
Characteristics of Equity Investing
Household Equity Portfolios Tend to Be Moderately Sized But Diverse
The size of equity portfolios varies widely among U.S. households. The median amountheld in equities is $50,000; the mean amount is $167,100 (Figure 14). The large differ-ence between the median and the mean points to a skewed distribution of equity assets: alarge number of equity owners hold small-to-moderate amounts while a small numberhold exceptionally high levels of equity assets. For example, 7 percent of householdowners have equity assets of $500,000 or more. In contrast, 30 percent have less than$25,000 invested in equities.
Household assets in equities tend to increase with age. Half of equity owners under age35 have less than $25,000 invested in equities, and only about 10 percent have equityassets of $100,000 or more. In contrast, 19 percent of equity owners age 65 or older haveless than $10,000 invested in equities, and 44 percent have $100,000 or more. Themedian assets in equities for equity investors age 65 or older is $81,000, compared with$24,000 for those under age 35.
The value of individual stock portfolios varies considerably among the 26.7 millionhouseholds owning individual stocks. Twenty-one percent have less than $10,000 investedin individual stocks while 24 percent hold individual stocks valued at $100,000 or more.Median individual stock holdings are $30,000; the mean is $152,000.
The median amount held in stock mutual funds versus individual stocks is fairly simi-lar —$38,000 compared with $30,000. However, the mean amounts are very differentprimarily because more individual stock owners have high levels of assets in individualstock than do those who own stock mutual funds. For example, the percentage of owners with individual stock assets of $500,000 or more is double that of owners of stockmutual fund assets.

FIGURE 14
Assets in All Equities, Individual Stock, and Stock Mutual Funds
Equity Assets of Investors Owning Equities(percent of all equity owners)
Less than $10,000 15
$10,000 to $24,999 15
$25,000 to $49,999 20
$50,000 to $74,999 12
$75,000 to $99,999 7
$100,000 to $249,999 16
$250,000 to $499,999 8
$500,000 to $999,999 4
$1 million or more 3
Mean $167,100
Median $50,000
Number of respondents 2,230
Individual Stock Assets of Investors Owning Individual Stocks(percent of all individual stock owners)
Less than $10,000 21
$10,000 to $24,999 17
$25,000 to $49,999 19
$50,000 to $74,999 10
$75,000 to $99,999 9
$100,000 to $249,999 13
$250,000 to $499,999 5
$500,000 to $999,999 4
$1 million or more 2
Mean $152,000
Median $30,000
Number of respondents 1,200
Stock Mutual Fund Assets of Investors Owning Stock Mutual Funds(percent of all stock mutual fund shareholders)
Less than $10,000 15
$10,000 to $24,999 18
$25,000 to $49,999 24
$50,000 to $74,999 14
$75,000 to $99,999 7
$100,000 to $249,999 14
$250,000 to $499,999 5
$500,000 to $999,999 2
$1 million or more 1
Mean $100,400
Median $38,000
Number of respondents 1,935
Equity Ownership in America 17

18 Equity Ownership in America
Over Three-quarters Hold Two or More Equities
Most equity owners own more than one equity security (Figure 15).20 Only 17 percentown one; 49 percent have two to six; and 34 percent hold seven or more. The mediannumber of equities held is four, and the mean is seven.
The typical individual stock investor owns more than one individual stock. Just 25percent hold stock in a single company. Twenty-eight percent own stock in two or threecompanies, and 47 percent own stock in four or more companies. Individual stock ownershold a median of three individual stocks and a mean of seven.
FIGURE 15
Number of All Equities, Individual Stock, and Stock Mutual Funds Owned
Total Number of Equities Owned by Investors Owning Equities(percent of all equity owners)
One 17
Two 15
Three 12
Four to six 22
Seven or more 34
Mean 7
Median 4
Number of respondents 1,835
Number of Individual Stocks Owned by Investors Owning Individual Stock(percent of all individual stock owners)
One 25
Two 16
Three 12
Four to six 20
Seven or more 27
Mean 7
Median 3
Number of respondents 1,074
Number of Stock Mutual Funds Owned by Investors Owning Stock Mutual Funds(percent of all stock mutual fund shareholders)
One 19
Two 19
Three 15
Four to six 26
Seven or more 22
Mean 5
Median 3
Number of respondents 1,593
20Each stock mutual fund is counted as an equity holding.

Equity Ownership in America 19
Similarly, stock mutual fund shareholders tend to own more than one stock mutualfund. Twenty-two percent own at least seven different stock mutual funds. Stock fundinvestors hold a median of three stock mutual funds and a mean of five.
Ownership of International Equities Is Largely Through Mutual Funds
Ownership of non-U.S. equities is more prevalent among stock mutual fund investorsthan individual stock investors. More than three-fifths of stock mutual fund shareholdersown international or global stock mutual funds (Figure 16). In contrast, just 15 percent of individual stock holders own stock in foreign companies.
Views on Equity Investing
Equity Owners Are Long-term Investors Saving for Retirement
Equity owners tend to adopt a long-range investment outlook (Figure 17). Ninety-sixpercent view their equity holdings as long-term investments, and 87 percent say theyfollow a buy-and-hold investment philosophy. In response to a separate question,however, 19 percent say they like to cash out their investments to make short-term profits.Two-thirds list saving for retirement as a primary financial goal. Eighty-three percent arenot concerned with short-term fluctuations in their equity investments.
Equity Investors Say They Can Tolerate Investment Risk
Equity owners tolerate investment risk to some degree. Nine percent are willing to takesubstantial risk for substantial gain, and 31 percent are willing to take above-average riskfor above-average gain. The largest portion of equity owners, 48 percent, are willing totake average risk for average gain. The remaining 13 percent prefer to take below-averageor no risk.
Sixty-four percent rely on professional financial advisers when purchasing and sellingequities. Nevertheless, 75 percent closely follow the value of their investments. The major-ity indicate they have at least a basic understanding of investing in individual stocks andstock mutual funds.
FIGURE 16
Ownership of Individual Stock in Foreign Companies and International or Global Mutual Funds
Own Individual Stock in Foreign Companies or International or Global Mutual Funds(percent of all equity owners)
Yes 55
No 45
Own Individual Stock in Foreign Companies (percent of all individual stock owners)
Yes 15
No 85
Own International or Global Mutual Funds(percent of all stock mutual fund shareholders)
Yes 62
No 38
Note: Number of respondents varies.

20 Equity Ownership in America
FIGURE 17
Views on Equity Investing(percent)
Type of Equity Owned
StockAll Equity Individual Mutual Owners Stock Funds
Strongly or somewhat agree:1
I view my equity investments as savings for the long term 96 95 97
I tend to follow a buy-and-hold investment strategy 87 88 88
I am not concerned about short-term fluctuations in my equity investments 83 83 84
I closely follow the value of my equity investments 75 77 75
I tend to rely on advice from a professional financial adviser when making
equity purchase and sales decisions 64 59 66
I like to cash out my investments if I make a short-term profit 19 20 19
Willingness to take financial risk with equity investments:
Substantial risk for substantial gain 9 9 9
Above-average risk for above-average gain 31 32 32
Average risk for average gain 48 46 48
Below-average risk for below-average gain 7 6 6
Unwilling to take any risk 6 4 5
Primary financial goal for equity investments:
Retirement 66 65 68
Education 11 11 11
Current income 6 7 5
Emergency 5 4 5
Home purchase 4 4 4
Other 8 9 7
Self-assessed understanding of individual stock:
Comprehensive 18 25 17
Basic 54 55 54
Limited 26 19 26
None 2 2 2
Self-assessed understanding of stock mutual funds:
Comprehensive 17 19 18
Basic 53 50 55
Limited 27 26 25
None 4 5 2
1 Multiple responses included.
Note: Number of responses varies.

Equity Transaction Activity in 199821
Few Investors Conducted Equity Transactions in 1998
More than half of equity owners did not conduct an equity transaction in 1998. Twenty-five percent conducted one to five transactions; 9 percent, six to 12 transactions; and 11percent, more than 12 transactions (Figure 18). Because a small number of equity ownersconducted many transactions, the average number of transactions in 1998 is five while themedian is zero.
FIGURE 18
Transactions in 19981
Number of Equity Transactions in 1998(percent of all equity owners)
None 55
1 to 2 15
3 to 5 10
6 to 12 9
More than 12 11
Mean 5
Median 0
Number of respondents 1,989
Number of Individual Stock Transactions in 1998(percent of all individual stock owners)
None 52
1 to 2 15
3 to 5 14
6 to 12 10
More than 12 9
Mean 6
Median 0
Number of respondents 1,104
Number of Stock Mutual Fund Transactions in 1998(percent of all stock mutual fund shareholders)
None 65
1 to 2 16
3 to 5 8
6 to 12 7
More than 12 4
Mean 2
Median 0
Number of respondents 1,767
1 See text footnote 14 on page 8 for the definition of an equity transaction.
21 See text footnote 14 on page 8 for the definition of an equity transaction.
Equity Ownership in America 21

22 Equity Ownership in America
Similar patterns emerge when considering transaction activity separately for individualstocks and stock mutual funds. Most of the owners of both types of equities —52 percentof individual stock investors and 65 percent of stock mutual fund investors —did notconduct transactions. However, more individual stock owners than stock mutual fundowners conducted six or more individual stock transactions. Consequently, the meannumber of individual stock transactions in 1998 is significantly higher than the meannumber of stock mutual fund transactions (six for the former, two for the latter).
Most Individual Stock Transactions Occur Outside Employer Plans, Purchases Outnumber Sales
Forty-eight percent of individual stock investors bought or sold individual stock in 1998(Figure 19). The transactions primarily occurred outside employer-sponsored retirementplans: 44 percent bought or sold outside employer-sponsored retirement plans, comparedwith 12 percent who transacted within such plans. Purchasers outnumbered sellers in1998: 46 percent bought individual stock and 33 percent sold individual stock.
The majority of owners purchasing individual stock outside an employer-sponsoredretirement plan in 1998 used accumulated savings to finance their most recent purchase.Other frequently mentioned sources of funds were reinvested dividends and proceedsfrom the sale of shares of other individual stock. (See Figure 34 on page 39.)
More than four-fifths of those who sold individual stock outside employer-sponsoredretirement plans in 1998 reinvested at least part of the proceeds they received. Mostpurchased shares in other individual stocks. (See Figure 35 on page 40.)
FIGURE 19
Types of Individual Stock Transactions Conducted by Individual Stock Owners in 19981
(percent of all individual stock owners)
Conducted an individual stock transaction (net)2 48
Bought individual stock 46
Sold individual stock 33
Conducted an individual stock transaction inside an employer-sponsored retirement plan (net)2,3 12
Bought individual stock inside an employer-sponsored retirement plan 10
Sold individual stock inside an employer-sponsored retirement plan 6
Conducted an individual stock transaction outside an employer-sponsored retirement plan (net)2 44
Bought individual stock outside an employer-sponsored retirement plan 39
Sold individual stock outside an employer-sponsored retirement plan 28
1 See text footnote 14 on page 8 for the definition of an individual stock transaction.2 Multiple responses included.3 Employer-sponsored retirement plans include 401(k) plans; 403(b) plans; federal, state, or local government plans; SEP-IRAs; SAR-SEPs; and SIMPLE IRAs.
Note: Number of respondents varies.

Stock Mutual Fund Owners Transact Similarly to Individual Stock Owners
Thirty-five percent of stock mutual fund shareholders bought or sold stock fund shares in1998 (Figure 20), with purchasers outnumbering sellers three to two. One-quarter boughtor sold stock fund shares outside retirement plans in 1998, compared with 18 percentwho made transactions inside such plans.
Forty-eight percent of stock mutual fund shareholders who bought stock mutual fundshares outside employer-sponsored retirement plans in 1998 cited accumulated savings asthe source of money for the most recent purchase. Forty-eight percent also mentionedreinvested dividends, while only 12 percent mentioned sales proceeds from other stockmutual funds. (See Figure 43 on page 47.)
Of those who sold mutual fund shares outside employer-sponsored retirement plans in 1998, 57 percent reinvested all of the proceeds from their most recent sale, and 17percent reinvested some but not all of the proceeds. Of the group reinvesting proceeds,three-quarters purchased shares of other stock mutual funds. (See Figure 44 on page 47.)
Equity Owners by Level of Transaction Activity in 199822
About One in Ten Equity Owners Were High-volume Buyers or Sellers in 1998
Eleven percent of all equity owners conducted a high volume (more than 12) of equitytransactions in 1998 . Ninety-nine percent of high-volume buyers or sellers boughtequities in 1998, and 87 percent sold equities (Figure 21). Eighty percent bought or sold individual stock in 1998, and 75 percent bought or sold stock mutual funds. Thesehigh-volume buyers or sellers typically bought eight individual stocks in 1998 and soldfour; they typically bought shares in five stock funds and sold shares in one. More thanone-quarter conducted an equity transaction over the Internet in 1998.
Equity Ownership in America 23
FIGURE 20
Types of Stock Mutual Fund Transactions Conducted by Stock Mutual Fund Shareholders in 19981
(percent of all stock mutual fund shareholders)
Conducted a stock mutual fund transaction (net)2 35
Bought stock mutual funds 34
Sold stock mutual funds 18
Conducted stock mutual fund transaction inside an employer-sponsored retirement plan (net)2,3 18
Bought stock mutual fund inside an employer-sponsored retirement plan 16
Sold stock mutual fund inside an employer-sponsored retirement plan 8
Conducted stock mutual fund transaction outside an employer-sponsored retirement plan (net)2 25
Bought stock mutual fund outside an employer-sponsored retirement plan 21
Sold stock mutual fund outside an employer-sponsored retirement plan 11
1 See text footnote 14 on page 8 for the definition of a stock mutual fund transaction.2 Multiple responses included.3 Employer-sponsored retirement plans include 401(k) plans; 403(b) plans; federal, state, or local government plans; SEP-IRAs; SAR-SEPs; and SIMPLE IRAs.
Note: Number of respondents varies.
22See text footnote 14 on page 8 for the definition of an equity transaction.

Those who buy or sell equities in high volume tend to be in their late forties, marriedand employed, with more income and assets than other equity owners (Figure 22). Theirmedian household income is $87,500 and median household financial assets are$280,000. This group has more assets invested in equities than any other group. Eighty-five percent own individual stock and 88 percent hold stock mutual funds.
More of these individuals purchased their first equity outside an employer-sponsoredretirement plan than did other transaction groups. They typically purchased their firstequity earlier, and are the most willing to assume higher levels of financial risk. Morehigh-volume traders closely follow the value of their investments, and say they do not relyon professional financial advisers, than other transaction groups.
About One-third of Equity Owners Conducted Between One and Twelve Transactions in 1998
Individuals conducting between one and 12 transactions in 1998 represent 34 percent ofequity owners. They bought more often than they sold equities, and were more likely tobuy or sell stock funds than individual stocks (Figure 21). Only 6 percent conducted anequity transaction on the Internet in 1998.
Low-to-moderate volume buyers or sellers tend to be in their late forties, married, andemployed (Figure 22). The majority are college graduates, and tend to have greaterincomes and household financial assets than those not making transactions. Typically,nearly half of the household assets of those in the 1-to-12-transactions group are investedin equities. Nearly 90 percent own stock mutual funds, and more than 60 percent holdindividual stocks. Most purchased their first equity before 1990, usually outside anemployer-sponsored retirement plan. The majority rely on professional financial adviserswhen making investment decisions, and closely follow the value of their investments.
More Than Half of Equity Owners Conducted No Transactions in 1998
Fifty-five percent of equity owners did not conduct any equity transactions in 1998. Thisgroup is slightly younger and has lower household income and assets than those whomade equity transactions during the year (Figure 22). Most are married and employed,and 45 percent are college graduates. Eighty-two percent own stock mutual funds and 42percent own individual stock. Nearly one-quarter purchased their first equity after 1995,and thirty percent bought between 1990 and 1995. This group was evenly split betweenbuying their first equity through an employer plan or outside such a plan.
More members of this group say they consult professional financial advisers whenmaking investment decisions and fewer closely monitor the value of their portfolios thanthose who bought or sold equities. Members of this group are also the most inclined tofind investing in individual stocks or stock mutual funds complicated.
Equity Owners by Purchase of Equities in 199823
Six in Ten Equity Owners Did Not Purchase Equities in 1998
Sixty percent of equity owners did not purchase an equity in 1998. Most members of thisgroup did not engage in equity sales, either (Figure 24). They have a median age of 46,with median household income of $50,000 and household financial assets of $65,000.
24 Equity Ownership in America
23See text footnote 14 on page 8 for the definition of an equity transaction.,

About three-fifths are married, and less than half have earned a four-year college degree.About one-fifth are retired. Less than half have an IRA. Median assets in equities are$30,000, typically allocated to three equities.
Eighty-two percent of this group own stock mutual funds and 42 percent own individ-ual stock. More own equities outside employer plans than inside such plans. More than half purchased their first equity in 1990 or later. Most are willing to take averagefinancial risk. Compared with investors who purchased equities in 1998, more of thosewho did not buy equities found investing in individual stock or stock mutual funds to be complicated.
Four in Ten Equity Owners Bought Equities in 1998
Investors who purchased equities in 1998 represent 40 percent of all equity owners. Thisgroup conducted a median of two individual stock transactions and two stock mutualfund transactions in 1998 (Figure 23). About one in ten conducted equity transactionsover the Internet in 1998.
Investors who purchased equities in 1998 tend to be older and more affluent thanthose who did not buy equities during the year (Figure 24). The median age of equitypurchasers is 48, and median household income is $65,000 and household financial assetsare $125,000. More equity purchasers than nonpurchasers are married, college-educated,and own IRAs.
Investors who bought equities in 1998 typically have $81,000, or 65 percent of house-hold financial assets, allocated to two individual stocks and four stock mutual funds.
FIGURE 21
Transaction Activity in 1998 by Number of Equity Transactions1
Made Made 1 to 12 More Than
Transactions 12 Transactionsin 1998 in 1998
Median
Number of individual stock transactions 1 13
Number of individual stock buys 0 8
Number of individual stock sells 0 4
Number of stock mutual fund transactions 1 9
Number of stock mutual fund buys 1 5
Number of stock mutual fund sells 0 1
Percent
Equity transactions executed in 1998:2
Purchase of equities 87 99
Sale of equities 50 87
Purchase or sale of individual stock 52 80
Purchase or sale of stock mutual funds 63 75
Conducted an equity transaction over the Internet in 1998 6 28
1 See text footnote 14 on page 8 for the definition of an equity transaction.2 Multiple responses included.
Equity Ownership in America 25

26 Equity Ownership in America
FIGURE 22
Characteristics of Equity Owners by Number of Equity Transactions1,2
Made Made Made 1 to 12 More Than
No Transactions Transactions 12 Transactionsin 1998 in 1998 in 1998
Percent of all equity owners 55 34 11
Median Age 45 years 47 years 47 years
Household income $50,000 $62,500 $87,500
Household financial assets3 $65,000 $118,500 $280,000
Household financial assets in equities $30,000 $56,000 $167,500
Number of equities owned 3 6 13
Number of individual stocks owned 0 1 6
Number of stock mutual funds owned 2 3 6
PercentMarried 63 70 76
College or postgraduate degree 45 60 78
Employed 79 82 84
Retired from lifetime occupation 21 19 18
Equity investments owned:
Individual stock (net)4 42 62 85
Inside employer-sponsored retirement plans 16 21 34
Outside employer-sponsored retirement plans 32 56 83
Stock mutual funds (net)4 82 88 88
Inside employer-sponsored retirement plans 54 61 58
Outside employer-sponsored retirement plans 47 66 81
Bought first equity:
Before 1990 48 59 65
1990 to 1995 30 26 25
1996 or later 23 15 9
Source of first equity purchase:
Inside employer-sponsored retirement plan 50 38 23
Outside employer-sponsored retirement plan 50 62 77
Type of equity first purchased:
Individual stock only 28 32 44
Stock mutual funds only 66 56 41
Both individual stock and stock mutual funds 8 12 15
Willing to take:
Substantial risk for substantial gain 8 8 14
Above-average risk for above-average gain 24 37 52
Average risk for average gain 52 47 31
Below-average risk for below-average gain 7 4 3
Unwilling to take any risk 9 4 0
Have employer-sponsored retirement plan coverage 78 82 78
Have IRA 46 58 70
1 Refers to the household’s responding financial decisionmaker for investments.
2 See text footnote 14 on page 8 for the definition of an equity transaction.
3 Includes assets in employer-sponsored retirement plans but excludes value of primary residence.4 Multiple responses included.

More equity purchasers than nonpurchasers own individual stock, but similar percentagesown stock mutual funds. The majority of equity purchasers bought their first equitybefore 1990. More than half will accept above-average or substantial financial risk.
More than One-quarter of Equity Owners Purchased Individual Stock in 1998
Twenty-seven percent of equity owners purchased individual stock in 1998. Theyconducted a median of five individual stock transactions, most of which were purchasesrather than sales (Figure 23). Nearly one-fifth used the Internet in 1998 to conduct anequity transaction.
Investors who bought individual stock in 1998 tend to be in their late forties, married,and employed (Figure 24). Two-thirds hold college degrees. They typically have moreincome and assets than those who purchased stock mutual funds. The median householdincome of individual stock purchasers is $72,000, and median household financial assetsare $176,000. They typically have $111,000 invested in six individual stocks and fourstock mutual funds. Equity holdings typically account for 63 percent of this group’shousehold financial assets. Four-fifths own stock funds.
The majority of investors who bought individual stock in 1998 purchased their initialequity before 1990, usually an individual stock. Two-thirds of this group’s initialpurchases were conducted outside employer plans.
FIGURE 23
Transaction Activity in 1998 by Equity Purchasers1
Type ofEquity Purchased*
All Stock AllEquity Individual Mutual Equity
Purchasers Stock Funds Nonpurchasers
Median
Number of individual stock transactions 2 5 0 0
Number of individual stock buys 1 3 0 0
Number of individual stock sells 0 1 0 0
Number of stock mutual fund transactions 2 0 3 0
Number of stock mutual fund buys 1 0 2 0
Number of stock mutual fund sells 0 0 0 0
Percent
Equity transactions executed in 1998:2
Purchase of equities 100 100 100 0
Sale of equities 59 69 52 5
Purchase or sale of individual stock 63 100 43 3
Purchase or sale of stock mutual funds 71 46 100 3
Conducted an equity transaction over the Internet in 1998 12 19 10 0
1 See text footnote 14 on page 8 for the definition of an equity transaction.2 Multiple responses included.
* Ten percent of equity owners who purchased equities in 1998 bought both individual stock and stock mutual funds.
Equity Ownership in America 27

28 Equity Ownership in America
FIGURE 24
Characteristics of Equity Owners Who Purchased Equities in 19981
Type ofEquity Purchased*
All Stock AllEquity Individual Mutual Equity
Purchasers Stock Funds Nonpurchasers
Percent of all equity owners 40 27 23 60
Median Age 48 years 48 years 46 years 46 years
Household income $65,000 $72,000 $65,000 $50,000
Household financial assets2 $125,000 $176,000 $114,500 $65,000
Household financial assets in equities $81,000 $111,000 $75,000 $30,000
Number of equities owned 8 11 7 3
Number of individual stocks owned 2 6 1 0
Number of stock mutual funds owned 4 4 5 2
Percent Married 72 74 72 62
College or postgraduate degree 64 66 65 45
Employed 83 81 87 79
Retired from lifetime occupation 18 22 13 21
Equity investments owned:
Individual stock (net)3 69 100 53 42
Inside employer-sponsored retirement plans 25 39 22 16
Outside employer-sponsored retirement plans 63 93 48 32
Stock mutual funds (net)3 89 80 100 82
Inside employer-sponsored retirement plans 63 58 73 55
Outside employer-sponsored retirement plans 69 63 79 47
Bought first equity:
Before 1990 62 68 60 48
1990 to 1995 25 21 27 30
1996 or later 13 10 13 22
Source of first equity purchase:
Inside employer-sponsored retirement plan 36 33 41 50
Outside employer-sponsored retirement plan 64 67 59 50
Type of equity first purchased:
Individual stock only 35 54 19 27
Stock mutual funds only 51 26 67 65
Both individual stock and stock mutual funds 13 19 14 8
Willing to take:
Substantial risk for substantial gain 11 12 11 8
Above-average risk for above-average gain 40 39 43 25
Average risk for average gain 43 43 41 51
Below-average risk for below-average gain 4 3 4 8
Unwilling to take any risk 2 3 2 8
Have employer-sponsored retirement plan coverage 83 80 86 79
Have IRA 60 63 62 47
1 Refers to the household’s responding financial decisionmaker for investments.2 Includes assets in employer-sponsored retirement plans but excludes value of primary residence.3 Multiple responses included.
* Ten percent of equity owners who purchased equities in 1998 bought both individual stock and stock mutual funds.

Less than One-quarter of Equity Owners Purchased Shares of Stock Mutual Funds in 1998
Twenty-three percent of equity owners purchased shares in stock mutual funds in 1998.Stock fund purchasers typically conducted fewer transactions than individual stock fundpurchasers in 1998 (Figure 23). Stock fund purchasers also tend to own fewer equitiesthan those who bought individual stocks (a median of seven and 11, respectively). Aboutone in 10 stock fund purchasers conducted equity transactions over the Internet in 1998,compared with two in ten individual stock fund purchasers.
The median age of those who purchased stock mutual fund shares is 46 — two yearsyounger than that of individual stock purchasers (Figure 24). Stock fund purchasers have a median income of $65,000. This group’s financial holdings are about one-third smaller than those of investors who bought individual stock. Sixty percent of investors whopurchased stock mutual fund shares bought their initial equity before 1990, usually astock mutual fund.
Equity Owners Who Sold 12 or More Equities in 1998
Equity owners who sold more than 12 equities in 1998 represent 3 percent of all equityowners (Figure 25). They tend to be affluent, with median household financial assets of$402,700 and equity assets of $270,900. These equity investors typically own 15 individ-ual stocks and five stock mutual funds. Their transaction activity in 1998 primarilyinvolved individual stock, not stock mutual funds. This group undertook a median of 43individual stock transactions, fairly evenly split between stock sales and purchases. Incontrast, the median number of stock mutual fund transactions conducted by this groupwas four.
Nearly all high-volume equity sellers own individual stock outside employer plans, andabout two-fifths own individual stock inside these plans. Four-fifths own stock mutualfunds. Most high-volume equity sellers are experienced investors: more than three-fifthspurchased their first equity before 1990. Nearly all purchased their first equity, usually anindividual stock, outside an employer plan.
Equity Owners by Internet Purchase or Sale of Equities in 1998
Internet Transactions by Equity Owners Were Infrequent in 1998
Only 11 percent of equity buyers or sellers (or 5 percent of all equity owners) used theInternet to conduct equity transactions in 1998 (Figure 26). Investors who used theInternet for an equity transaction conducted a median of ten individual stock transactionsand two stock mutual funds transactions in 1998. Altogether, 99 percent bought equitiesin 1998, and 88 percent sold equities. Most Internet equity transactors whose most recenttransaction was a sale outside an employer plan reinvested the proceeds from the sale.
Investors who use the Internet to buy or sell equities tend to be younger and moreaffluent than conventional equity buyers or sellers. Internet transactors have a median ageof 41, median household income of $73,800, and median household financial assets of$229,000. More are college-educated than conventional equity buyers or sellers, andnearly 90 percent are employed. The typical Internet transactor has $127,600 invested inequities, and owns seven individual stocks and five stock mutual funds.
Equity Ownership in America 29
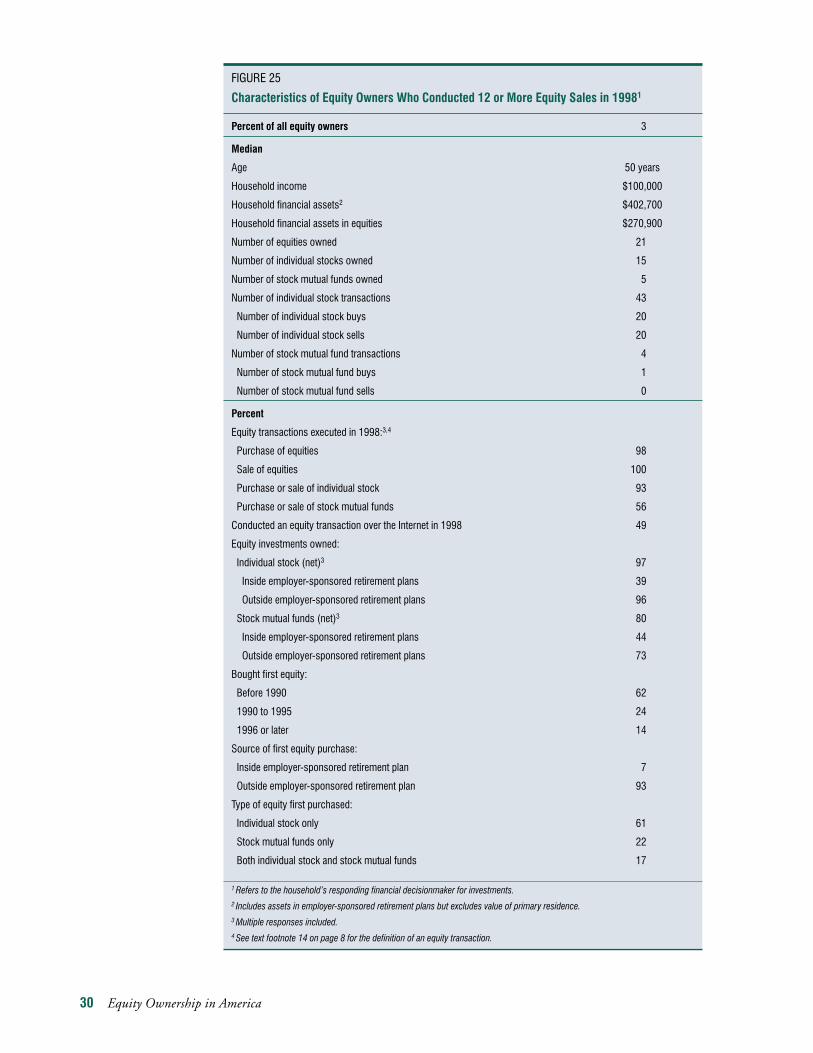
FIGURE 25
Characteristics of Equity Owners Who Conducted 12 or More Equity Sales in 19981
Percent of all equity owners 3
Median
Age 50 years
Household income $100,000
Household financial assets2 $402,700
Household financial assets in equities $270,900
Number of equities owned 21
Number of individual stocks owned 15
Number of stock mutual funds owned 5
Number of individual stock transactions 43
Number of individual stock buys 20
Number of individual stock sells 20
Number of stock mutual fund transactions 4
Number of stock mutual fund buys 1
Number of stock mutual fund sells 0
Percent
Equity transactions executed in 1998:3,4
Purchase of equities 98
Sale of equities 100
Purchase or sale of individual stock 93
Purchase or sale of stock mutual funds 56
Conducted an equity transaction over the Internet in 1998 49
Equity investments owned:
Individual stock (net)3 97
Inside employer-sponsored retirement plans 39
Outside employer-sponsored retirement plans 96
Stock mutual funds (net)3 80
Inside employer-sponsored retirement plans 44
Outside employer-sponsored retirement plans 73
Bought first equity:
Before 1990 62
1990 to 1995 24
1996 or later 14
Source of first equity purchase:
Inside employer-sponsored retirement plan 7
Outside employer-sponsored retirement plan 93
Type of equity first purchased:
Individual stock only 61
Stock mutual funds only 22
Both individual stock and stock mutual funds 17
1 Refers to the household’s responding financial decisionmaker for investments.2 Includes assets in employer-sponsored retirement plans but excludes value of primary residence.3 Multiple responses included.4 See text footnote 14 on page 8 for the definition of an equity transaction.
30 Equity Ownership in America

The majority of investors who use the Internet for equity transactions say they do notrely on professional financial advisers when making investment decisions. Eighty-threepercent employ a buy-and-hold investment philosophy. In response to a separate question,however, 36 percent say they prefer cashing out investments to make a short-term profit.More than three-quarters are willing to take above-average or substantial risk with theirequity investments.
Nine in Ten Who Bought, Sold Equities in 1998 Did Not Use the Internet
Eighty-nine percent of those who conducted an equity transaction (or 40 percent ofequity owners) in 1998 conducted transactions through methods other than the Internet(Figure 26). They bought or sold less frequently than Internet transactors, conducting amedian of one stock transaction and one stock mutual fund transaction. More than 90percent bought equities in 1998, and 57 percent sold equities. Most of those whose mostrecent transaction was a sale reinvested the proceeds.
The typical non-Internet transactor is 48 years old, with household income of $65,000and household financial assets of $125,000. They are more often retired, and tend to havesmaller equity portfolios than Internet transactors. The typical non-Internet transactor has$70,000 invested in two individual stocks and four mutual funds.
Most of these conventional transactors rely on professional financial advisers whenmaking investment decisions. Fewer conventional than Internet transactors say they liketo take short-term profits (19 percent, compared with 36 percent), and in response to aseparate question, slightly more say they adhere to a buy-and-hold investment philosophy(90 percent, compared with 83 percent). Ninety-three percent of conventional transactorsare willing to take at least average risk with their equity investments.
Equity Ownership in America 31

FIGURE 26
Characteristics of Equity Owners by Use of the Internet to Conduct Equity Transactions in 19981,2
Conduct Equity Transactions Conduct Equity Transactions over the Internet but not over the Internet
Percent of all equity transactors 11 89
Median Age 41 years 48 yearsHousehold income $73,800 $65,000Household financial assets3 $229,000 $125,000Household financial assets in equities $127,600 $70,000Number of equities owned 13 7Number of individual stocks owned 7 2Number of stock mutual funds owned 5 4Number of individual stock transactions in 1998 10 1
Number of individual stock buys 6 0Number of individual stock sells 4 0
Number of stock mutual fund transactions in 1998 2 1Number of stock mutual fund buys 1 1Number of stock mutual fund sells 0 0
Percent Married 75 70College or postgraduate degree 80 61Employed 88 81Retired from lifetime occupation 11 20Equity investments owned:
Individual stock (net)4 93 64Inside employer-sponsored retirement plans 33 22Outside employer-sponsored retirement plans 93 59
Stock mutual funds (net)4 85 88Inside employer-sponsored retirement plans 67 57Outside employer-sponsored retirement plans 63 69
Year of first equity purchase:Before 1990 57 601990 to 1995 27 261996 or later 16 14
Source of first equity purchase:Inside employer-sponsored retirement plan 25 35Outside employer-sponsored retirement plan 75 65
Type of equity first purchased:Individual stock only 37 35Stock mutual funds only 44 52Both individual stock and stock mutual funds 18 13
Willing to take:Substantial risk for substantial gain 25 8Above-average risk for above-average gain 51 40Average risk for average gain 22 45Below-average risk for below-average gain 2 4Unwilling to take any risk 0 3
Have employer-sponsored retirement plan coverage 82 80Have IRA 71 591 Refers to the household’s responding financial decisionmaker for investments.2 See text footnote 14 on page 8 for the definition of an equity transaction.3 Includes assets in employer-sponsored retirement plans but excludes value of primary residence.4 Multiple responses included.
Note: Number of respondents varies.
32 Equity Ownership in America

CHAPTER 2
Owners of Individual Stock Outside Employer-sponsoredRetirement Plans
Characteristics of Owners of Individual Stock Outside Employer Plans
One-fifth of U.S. Households Own Individual Stock Outside Employer Plans
Nearly 22 million U.S. households, or 21.4 percent of all U.S. households, and 32.8million individuals owned individual stock outside employer-sponsored retirement plansin 1999 (see Figure 12 on page 13). The financial decisionmakers in these householdshave a median age of 49, with median household income of $62,500 and median house-hold financial assets of $140,000 (Figure 27). Most are married, employed, and collegegraduates. Slightly more than three-quarters are covered by employer-sponsored retire-ment plans and three-fifths own IRAs.
Most owners of individual stock outside employer plans describe themselves as long-term investors who employ a buy-and-hold investment philosophy. The majority are notconcerned by short-term market fluctuations or interested in cashing out short-termgains. Only one-fifth say they frequently make individual stock trades.
Most are experienced equity investors: 70 percent made their first equity investmentbefore 1990. Nearly four-fifths made their initial equity purchase outside an employerplan, and nearly three-fifths solely bought a stock mutual fund as their first equity. Nearly90 percent are willing to take average, above-average, or substantial risk with their equityinvestments.
A large majority of investors with individual stock outside employer plans also ownstock mutual funds. In addition, investors holding individual stock outside employerplans often own investments besides equities. Between 30 percent and 40 percent ownmoney market funds, investment real estate, and hybrid mutual funds. Few invest inbonds —18 percent own bond mutual funds and 13 percent have individual bonds.
Individual Stock Portfolios Outside Employer Plans Are Typically Small
Owners of individual stock outside employer plans hold a median of $26,000 in individ-ual stock, which represents 19 percent of their median household financial assets (Figure28). Assets held in individual stock outside employer plans increase with age, education, household income, and household financial assets.
Forty-four percent own one or two individual stocks outside employer plans, and 37 percent own three to nine; and 19 percent own 10 or more. The median number ofindividual stocks owned outside such plans is three; the mean is six. Thirteen percent ofthese investors own stock in a foreign company.
Equity Ownership in America 33

FIGURE 27
Investor Characteristics—Ownership of Individual Stock Outside Employer-sponsored Retirement Plans1
Median Age 49 years
Household income $62,500
Household financial assets2 $140,000
Percent Household investment decisionmaker:
Male 29
Female 17
Co-decisionmakers 53
Married 69
College or postgraduate degree 62
Employed 76
Retired from lifetime occupation 25
Equity investments owned:
Individual stock (net)3 100
Inside employer-sponsored retirement plans 28
Outside employer-sponsored retirement plans 100
Stock mutual funds (net)3 75
Inside employer-sponsored retirement plans 50
Outside employer-sponsored retirement plans 60
Bought first equity:
Before 1990 70
1990 to 1995 20
1996 or later 10
Source of first equity purchase:
Inside employer-sponsored retirement plan 21
Outside employer-sponsored retirement plan 79
Type of equity first purchased:
Individual stock only 31
Stock mutual funds only 59
Both individual stock and stock mutual funds 10
Non-equity investments held:3
Savings accounts, money market deposit accounts, or certificates of deposit 83
Bond investments (net)3 26
Individual bonds 13
Bond mutual funds 18
Fixed or variable annuities 24
Hybrid mutual funds 32
Money market mutual funds 39
Investment real estate 34
Have employer-sponsored retirement plan coverage 76
Have IRA 60
Willing to take:
Substantial risk for substantial gain 9
Above-average risk for above-average gain 33
Average risk for average gain 46
Below-average risk for below-average gain 6
Unwilling to take any risk 6
1 Refers to the household’s responding financial decisionmaker for investments.2 Includes assets in employer-sponsored retirement plans but excludes value of primary residence.3 Multiple responses included.
Note: Number of respondents varies.
34 Equity Ownership in America

Individual Stock Assets Held Outside Employer-sponsored Retirement Plans
Less than $1,000 9
$1,000 to $4,999 13
$5,000 to $9,999 10
$10,000 to $29,999 19
$30,000 to $99,999 23
$100,000 to $199,999 9
$200,000 to $499,999 9
$500,000 to $999,999 4
$1,000,000 or more 4
Mean $173,000
Median $26,000
Number of respondents 769
Number of Individual Stocks Owned Outside Employer-sponsored Retirement Plans
1 27
2 17
3 to 5 26
6 to 9 11
10 to 19 12
20 or more 7
Mean 6
Median 3
Number of respondents 971
Ownership of Foreign Stock Outside Employer-sponsored Retirement Plans
Own foreign stock 13
Do not own foreign stock 87
Number of respondents 995
Length of Ownership of Individual Stock Outside Employer-sponsored Retirement Plans
2 years or less 13
3 to 5 years 15
6 to 10 years 18
11 to 15 years 14
16 to 20 years 12
21 to 30 years 12
More than 30 years 16
Mean 10 years
Median 8 years
Number of respondents 973
FIGURE 28
Investment Characteristics—Ownership of Individual Stock Outside Employer-sponsored Retirement Plans(percent of equity owners with individual stock outside employer-sponsored retirement plans)
Equity Ownership in America 35

Most investors with individual stock outside employer plans have owned these invest-ments for quite some time. In fact, 40 percent have held individual stock outside retire-ment plans for more than 15 years. Their median tenure is eight years; the mean is ten.
Many Investors Bought Individual Stock Outside Employer Plans from a Full-service Broker
Forty-four percent of owners of individual stock outside employer plans purchased thosestocks from a full-service broker, 23 percent bought directly from the issuer, and 20percent purchased from a discount broker (Figure 29). Almost one-fifth received the stockthey own outside such plans as a gift or inheritance. About one in ten bought stock eitherfrom an independent financial planner or an online firm.
Individual Stock Transaction Activity Outside Employer Plans in 199824
About Half of the Investors with Individual Stock Outside Employer Plans Executed Trades in 1998
Fifty-two percent of investors who own individual stock outside employer plans bought orsold stock outside such plans in 1998 (Figure 30). About 60 percent both bought and soldstock, 32 percent only bought individual stock, and 7 percent only sold stock.
36 Equity Ownership in America
FIGURE 29
Purchase Channels Used—Ownership of Individual Stock Outside Employer-sponsored Retirement Plans1
(percent of equity owners with individual stock outside employer-sponsored retirement plans)
Full-service brokerage 44
Directly from the company issuing the stock 23
Discount brokerage 20
Gift or inheritance 17
Independent financial planner 11
Online brokerage firm2 9
Bank or savings institution 7
Insurance company 2
Number of respondents 1,023
1 Multiple responses included.2 Includes firms such as E-Trade or Ameritrade that only offer online investing. Excludes full-service brokerages, discount brokerages,independent financial planners, banks or savings institutions, or insurance companies offering online brokerage services.
24See text footnote 14 on page 8 for the definition of an individual stock transaction.
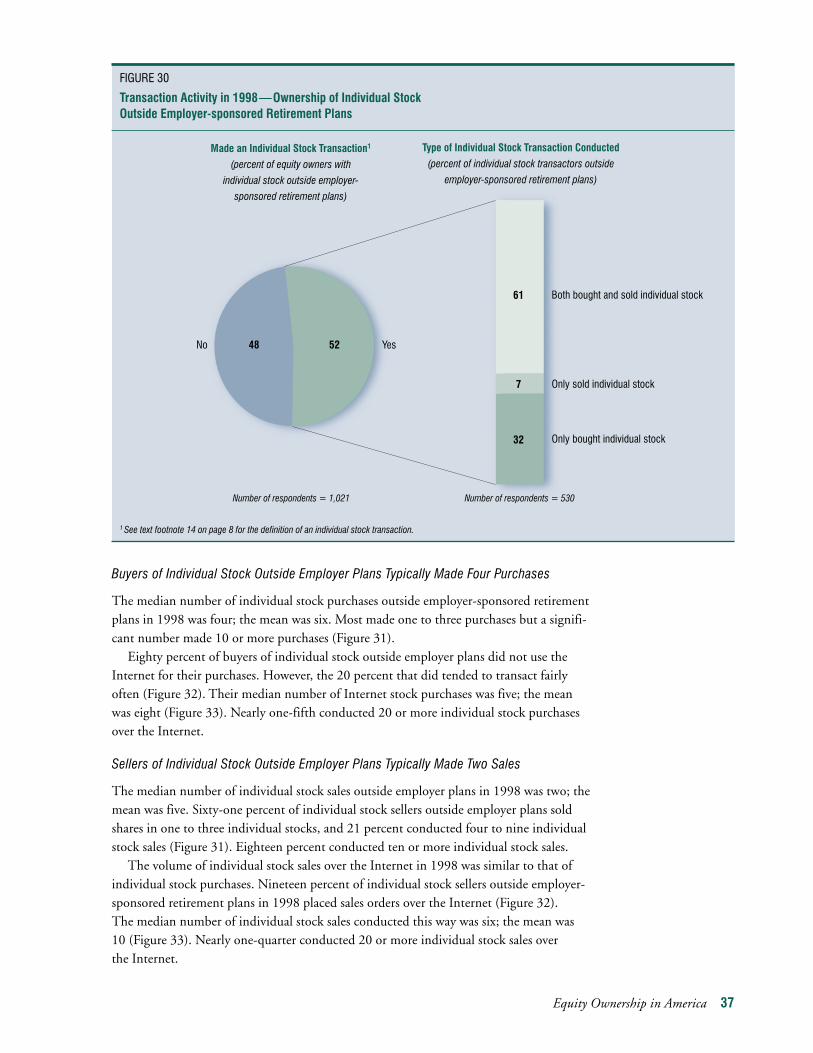
Buyers of Individual Stock Outside Employer Plans Typically Made Four Purchases
The median number of individual stock purchases outside employer-sponsored retirementplans in 1998 was four; the mean was six. Most made one to three purchases but a signifi-cant number made 10 or more purchases (Figure 31).
Eighty percent of buyers of individual stock outside employer plans did not use theInternet for their purchases. However, the 20 percent that did tended to transact fairlyoften (Figure 32). Their median number of Internet stock purchases was five; the meanwas eight (Figure 33). Nearly one-fifth conducted 20 or more individual stock purchasesover the Internet.
Sellers of Individual Stock Outside Employer Plans Typically Made Two Sales
The median number of individual stock sales outside employer plans in 1998 was two; themean was five. Sixty-one percent of individual stock sellers outside employer plans soldshares in one to three individual stocks, and 21 percent conducted four to nine individualstock sales (Figure 31). Eighteen percent conducted ten or more individual stock sales.
The volume of individual stock sales over the Internet in 1998 was similar to that ofindividual stock purchases. Nineteen percent of individual stock sellers outside employer-sponsored retirement plans in 1998 placed sales orders over the Internet (Figure 32). The median number of individual stock sales conducted this way was six; the mean was10 (Figure 33). Nearly one-quarter conducted 20 or more individual stock sales over the Internet.
Equity Ownership in America 37
32
7
61
5248 YesNo
Both bought and sold individual stock
Only sold individual stock
Only bought individual stock
FIGURE 30
Transaction Activity in 1998—Ownership of Individual StockOutside Employer-sponsored Retirement Plans
Number of respondents = 1,021 Number of respondents = 530
1 See text footnote 14 on page 8 for the definition of an individual stock transaction.
Made an Individual Stock Transaction1
(percent of equity owners with
individual stock outside employer-
sponsored retirement plans)
Type of Individual Stock Transaction Conducted(percent of individual stock transactors outside
employer-sponsored retirement plans)

Most Recent Individual Stock Purchase or Sale Outside Employer Plans
Savings Are Most Often the Source of Money for Individual Stock Purchases Outside Employer Plans
Fifty-two percent of investors who bought individual stock outside employer-sponsoredretirement plans in 1998 said they used accumulated savings to finance the purchase (Figure 34). Thirty-eight percent used proceeds from the sale of another investment, inmost instances the sale of shares of other publicly traded stock. Thirty-four percent reinvested dividends they had received.25
Proceeds from the Sale of Individual Stock Outside Employer Plans Are Usually Reinvested
More than two-thirds of those who sold shares of individual stock outside employer-spon-sored retirement plans reinvested all of the proceeds (Figure 35). Eighteen percent rein-vested some of the proceeds and spent the rest. Just 14 percent spent all of the proceeds.More than three-quarters of those who reinvested the proceeds used the money to buyshares of other stock; less than a quarter used the proceeds to purchase stock mutual fund shares.
38 Equity Ownership in America
FIGURE 31
Purchases and Sales in 1998—Ownership of Individual Stock Outside Employer-sponsored Retirement Plans
Number of Purchases Number of Sales(percent of equity owners conducting individual (percent of equity owners conducting individualstock purchases outside employer-sponsored retirement plans) stock sales outside employer-sponsored retirement plans)
1 18 1 33
2 to 3 30 2 to 3 28
4 to 5 19 4 to 5 13
6 to 9 10 6 to 9 8
10 to 19 12 10 to 19 7
20 or more 11 20 or more 11
Mean 6 Mean 5
Median 4 Median 2
Number of respondents 455 Number of respondents 324
25 Includes automatic reinvestment of dividends through dividend reinvestment plans (DRIPs).

Equity Ownership in America 39
FIGURE 32
Internet Use for Purchases and Sales in 1998—Ownership of Individual Stock Outside Employer-sponsored Retirement Plans
Use of the Internet for Individual Stock Purchases Use of the Internet for Individual Stock Sales(percent of individual stock purchasers transacting (percent of individual stock sellers transacting outside employer-sponsored retirement plans) outside employer-sponsored retirement plans)
Yes, used the Internet 20 Yes, used the Internet 19
No, did not use the Internet 80 No, did not use the Internet 81
Number of respondents 455 Number of respondents 325
Individual Stock Purchases Made Over the Internet Individual Stock Sales Made Over the Internet(percent of Internet individual stock purchasers transacting (percent of Internet individual stock sellers transactingoutside employer-sponsored retirement plans) outside employer-sponsored retirement plans)
1 to 2 25 1 to 2 24
3 to 5 29 3 to 5 21
6 to 9 8 6 to 9 17
10 to 19 16 10 to 19 14
20 or more 19 20 or more 24
Mean 8 Mean 10
Median 5 Median 6
Number of respondents 90 Number of respondents 58
Note: Small sample sizes.
FIGURE 33
Number of Internet Purchases or Sales in 1998—Ownership of Individual Stock Outside Employer-sponsored Retirement Plans
Accumulated savings 52
Proceeds from the sale of other investments (net)1 38
Shares of other publicly traded stock 30
Shares of stock mutual funds 6
Non-equity investments 4
Reinvestment of dividends 34
Regular, automatic deductions from a paycheck 11
Bonus 8
Inheritance or gift 8
Regular, automatic deductions from savings 5
Tax refund 2
Some other source 7
1 Multiple responses included.
Note: Number of respondents varies
FIGURE 34
Source of Money for Most Recent Purchase in 1998—Ownership of Individual Stock Outside Employer-sponsored Retirement Plans1
(percent of individual stock purchasers transacting outside employer-sponsored retirement plans)

40 Equity Ownership in America
Spent all the proceeds Spent part of the
proceeds and reinvested part of the proceeds
Reinvested all the proceeds
Purchased some other type
of investment
Purchased shares of stock
mutual funds
Purchased shares of other
individual stock
14
68
18
76
22 22
FIGURE 35
Disposition of Proceeds from Most Recent Sale in 1998—Ownership of Individual Stock Outside Employer-sponsored Retirement Plans
Number of respondents = 316
Disposition of Proceeds(percent of individual stock
sellers outside employer-sponsored
retirement plans)
How Proceeds were Reinvested1
(percent of individual stock sellers
who reinvested the proceeds)
1Multiple responses included.Number of respondents varies.

CHAPTER 3
Owners of Stock Mutual FundsOutside Employer-sponsoredRetirement Plans
Characteristics of Owners of Stock Mutual Funds Outside Employer Plans
More than One-fourth of U.S. Households Own Stock Mutual Funds Outside Employer Plans
Nearly 28 million households — representing 27.2 percent of all U.S. households —and44.4 million individuals owned stock mutual funds outside employer plans in January1999 (see Figure 12 on page 13). The typical investor with stock mutual funds outsideemployer plans is 48 years old, with household income of $63,000 and household finan-cial assets of $120,000 (Figure 36). Nearly 70 percent are married, more than three-quarters are employed, and almost three-fifths are college graduates. The majority arecovered by employer-sponsored retirement plans and most own IRAs.
Stock mutual fund shareholders outside employer plans tend to employ a long-rangefinancial strategy. Ninety-eight percent view their equity investments as savings for thelong-term, and 89 percent say they adhere to a buy-and-hold investment philosophy.Most say they consult a professional financial adviser when making investment decisions.Only 14 percent say they frequently make stock mutual fund trades.
Sixty percent purchased their first equity before 1990. Most bought their first equity,usually a stock fund, outside an employer plan. Eighty percent will take average or above-average risk with their equity investments.
More than half also own stock mutual funds inside employer-sponsored retirementplans, and own individual stock, usually outside such plans. Many owners of stock mutualfunds outside employer-sponsored retirement plans own other types of mutual funds —50percent own hybrid funds; 35 percent, money market funds; and 22 percent, bond funds.About one-third own investment real estate, and roughly one in 10 own individual bonds.
Stock Mutual Fund Portfolios Outside Employer Plans Are Typically Small
Owners of stock mutual funds outside employer-sponsored retirement plans hold amedian of $26,000 in stock funds, which represents 22 percent of their household finan-cial assets (Figure 37). Assets held in stock mutual funds outside employer plans increasewith age, education, household income, and household financial assets.
Equity Ownership in America 41

FIGURE 36
Investor Characteristics—Ownership of Stock Mutual Funds Outside Employer-sponsored Retirement Plans1
Median Age 48 years
Household income $63,000
Household financial assets2 $120,000
Percent Household investment decisionmaker:
Male 26
Female 21
Co-decisionmakers 54
Married 69
College or postgraduate degree 58
Employed 77
Retired from lifetime occupation 24
Equity investments owned:
Individual stock (net)3 52
Inside employer-sponsored retirement plans 17
Outside employer-sponsored retirement plans 48
Stock mutual funds (net)3 100
Inside employer-sponsored retirement plans 53
Outside employer-sponsored retirement plans 100
Bought first equity:
Before 1990 60
1990 to 1995 26
1996 or later 15
Source of first equity purchase:
Inside employer-sponsored retirement plan 22
Outside employer-sponsored retirement plan 78
Type of equity first purchased:
Individual stock only 20
Stock mutual funds only 66
Both individual stock and stock mutual funds 14
Non-equity investments held:3
Savings accounts, money market deposit accounts, or certificates of deposit 84
Bond investments (net)3 28
Individual bonds 11
Bond mutual funds 22
Fixed or variable annuities 26
Hybrid mutual funds 50
Money market mutual funds 35
Investment real estate 32
Have employer-sponsored retirement plan coverage 78
Have IRA 65
Willing to take:
Substantial risk for substantial gain 8
Above-average risk for above-average gain 31
Average risk for average gain 49
Below-average risk for below-average gain 7
Unwilling to take any risk 4
1Refers to the household’s responding financial decisionmaker for investments.2 Includes assets in employer-sponsored retirement plans but excludes value of primary residence.3 Multiple responses included.
Note: Number of respondents varies.
42 Equity Ownership in America
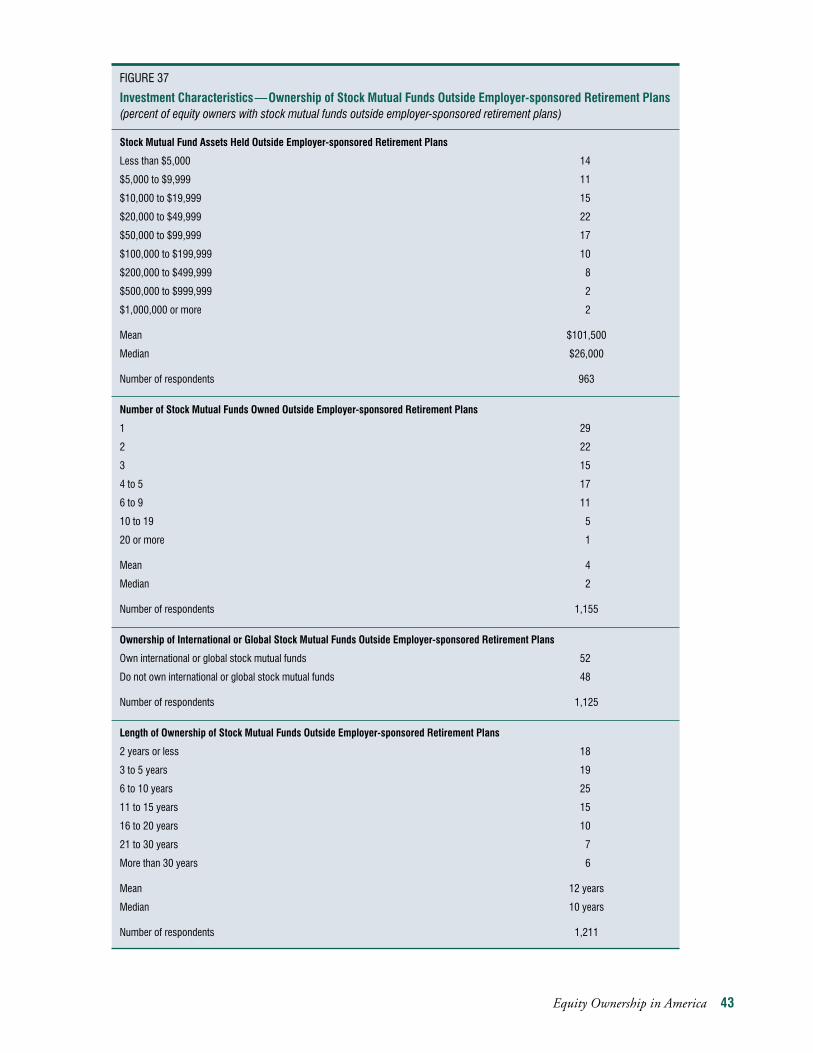
Equity Ownership in America 43
Stock Mutual Fund Assets Held Outside Employer-sponsored Retirement Plans
Less than $5,000 14
$5,000 to $9,999 11
$10,000 to $19,999 15
$20,000 to $49,999 22
$50,000 to $99,999 17
$100,000 to $199,999 10
$200,000 to $499,999 8
$500,000 to $999,999 2
$1,000,000 or more 2
Mean $101,500
Median $26,000
Number of respondents 963
Number of Stock Mutual Funds Owned Outside Employer-sponsored Retirement Plans
1 29
2 22
3 15
4 to 5 17
6 to 9 11
10 to 19 5
20 or more 1
Mean 4
Median 2
Number of respondents 1,155
Ownership of International or Global Stock Mutual Funds Outside Employer-sponsored Retirement Plans
Own international or global stock mutual funds 52
Do not own international or global stock mutual funds 48
Number of respondents 1,125
Length of Ownership of Stock Mutual Funds Outside Employer-sponsored Retirement Plans
2 years or less 18
3 to 5 years 19
6 to 10 years 25
11 to 15 years 15
16 to 20 years 10
21 to 30 years 7
More than 30 years 6
Mean 12 years
Median 10 years
Number of respondents 1,211
FIGURE 37
Investment Characteristics—Ownership of Stock Mutual Funds Outside Employer-sponsored Retirement Plans(percent of equity owners with stock mutual funds outside employer-sponsored retirement plans)

Two-thirds of these households own three or fewer stock mutual funds outsideemployer plans. Seventeen percent own four or five funds, and another 17 percent own sixor more. The median number of stock mutual funds owned outside employer plans istwo; the mean is four. More than half own global or international stock mutual funds.
Owners of stock mutual funds outside employer plans tend to be experiencedinvestors. Sixty-three percent have owned stock funds outside retirement plans for morethan five years; the median tenure in these funds is 10 years.
Owners of Stock Funds Outside Employer Plans Use Various Purchase Channels
Full-service brokers and mutual fund companies are the chief channels used to purchase stock mutual funds outside employer plans (Figure 38). Less frequent sources includeindependent financial planners, discount brokers, banks, insurance agents, and onlinebrokerage firms.26
Stock Mutual Fund Transaction Activity Outside Employer Plans in 1998
Most Investors Did Not Execute Stock Fund Transactions in 1998
Outside employer plans, stock mutual fund transaction activity was less extensive thanindividual stock transaction activity in 1998. Nearly two-thirds of stock fund ownersoutside employer plans made no transactions during the year. Thirty-seven percentbought or sold stock fund shares outside such plans (Figure 39). In contrast, 52 percent ofindividual stock owners outside retirement plans bought or sold individual stock duringthe year.
44 Equity Ownership in America
FIGURE 38
Purchase Channels Used—Ownership of Stock Mutual Funds Outside Employer-sponsored Retirement Plans1
(percent of equity owners with stock mutual funds outside employer-sponsored retirement plans)
Full-service brokerage 33
Directly from the fund company 26
Independent financial planner 20
Discount brokerage 10
Bank or savings institution 10
Insurance company 8
Gift or inheritance 5
Online brokerage firm2 1
Number of respondents 1,289
1 Multiple responses included.2 Includes firms such as E-Trade or Ameritrade that only offer online investing. Excludes full-service brokerages, discount brokerages,independent financial planners, banks or savings institutions, or insurance companies offering online brokerage services.
26 Includes firms such as E-Trade or Ameritrade that only offer online investing. Excludes full-service brokerages,discount brokerages, independent financial planners, banks or savings institutions, or insurance companies offeringonline brokerage services.

Both bought and soldstock mutual funds
3763 YesNo
49
8
43
Only sold stockmutual funds
Only bought stockmutual funds
Equity Ownership in America 45
FIGURE 39
Transaction Activity in 1998—Ownership of Stock Mutual Funds Outside Employer-sponsored Retirement Plans
FIGURE 40
Purchases and Sales in 1998—Ownership of Stock Mutual Funds Outside Employer-sponsored Retirement Plans
Number of Purchases1 Number of Sales
(percent of equity owners conducting stock mutual (percent of equity owners conducting stock mutualfund purchases outside employer-sponsored retirement plans) fund sales outside employer-sponsored retirement plans)
1 28 1 47
2 to 3 27 2 to 3 29
4 to 5 11 4 to 5 11
6 to 9 6 6 to 9 6
10 to 19 20 10 to 19 6
20 or more 8 20 or more 1
Mean 6 Mean 3
Median 3 Median 2
Number of respondents 395 Number of respondents 216
1 Includes automatic payroll or savings account purchases of stock funds outside employer plans.
Number of respondents = 1,270 Number of respondents = 461
1 See text footnote 14 on page 8 for the definition of a stock mutual fund transaction.
Made a Stock Fund Transaction1
(percent of equity owners with stock mutual funds
outside employer-sponsored retirement plans)
Type of Stock Fund Transaction Conducted(percent of stock mutual fund transactors outside
employer-sponsored retirement plans)

Forty-nine percent of those who made stock mutual fund transactions outside retire-ment plans bought only stock funds, 43 percent bought and sold stock funds, and 8percent sold only stock funds.
Buyers of Stock Funds Outside Employer Plans Typically Made Three Purchases
The median number of stock mutual fund purchases outside employer-sponsored retire-ment plans in 1998 was three. More than half of stock fund owners who made purchasesbought on three or fewer occasions (Figure 40). More than one-quarter made 10 or more purchases.
These investors rarely used the Internet to purchase stock funds (Figure 41). Of thosewho did, the median number of Internet stock mutual fund purchases was four, and only6 percent conducted 20 or more stock mutual fund purchases (Figure 42).27
46 Equity Ownership in America
Stock Mutual Fund Purchases Made Over the Internet Stock Mutual Fund Sales Made Over the Internet(percent of Internet stock mutual fund purchasers (percent of Internet stock mutual fund sellers outside employer-sponsored retirement plans) outside employer-sponsored retirement plans)
1 to 2 33 1 14
3 to 5 27 2 47
6 to 9 4 3 to 5 14
10 to 19 30 6 or more 26
20 or more 6
Mean 7 Mean 5
Median 4 Median 2
Number of respondents 19 Number of respondents 15
Note: Small sample sizes.
FIGURE 42
Number of Internet Purchases or Sales in 1998—Ownership of Stock Mutual Funds Outside Employer-sponsored Retirement Plans
Use of the Internet for Stock Mutual Fund Purchases Use of the Internet for Stock Mutual Fund Sales(percent of stock mutual fund purchasers transacting (percent of stock mutual fund sellers transactingoutside employer-sponsored retirement plans) outside employer-sponsored retirement plans)
Yes, used the Internet 5 Yes, used the Internet 7
No, did not use the Internet 95 No, did not use the Internet 93
Number of respondents 396 Number of respondents 216
FIGURE 41
Internet Use for Purchases and Sales in 1998—Ownership of Stock Mutual Funds Outside Employer-sponsored Retirement Plans
27The sample size for this analysis was very small.

Spent all the proceeds Spent part of the
proceeds and reinvested part of the proceeds
Reinvested all the proceeds
Purchased some other type of investment
Purchased shares of individual stock
Purchased shares of other stock mutual funds
26
57
17
75
34 19
Equity Ownership in America 47
Accumulated savings 48
Reinvestment of dividends 48
Proceeds from the sale of other investments (net)1 23
Shares of other stock mutual funds 12
Shares of publicly traded stock 8
Non-equity investments 3
Regular, automatic deductions from a savings 18
Inheritance or gift 10
Bonus 8
Regular, automatic deductions from a paycheck 6
Tax refund 2
Some other source 10
1 Multiple responses included.
Note: Number of respondents varies.
FIGURE 43
Source of Money for Most Recent Purchase in 1998—Ownership of Stock Mutual Funds Outside Employer-sponsored Retirement Plans1
(percent of stock mutual fund purchasers outside employer-sponsored retirement plans)
FIGURE 44
Disposition of Proceeds from Most Recent Sale in 1998—Ownership of Stock Mutual Funds Outside Employer-sponsored Retirement Plans
Number of respondents = 210
Disposition of Proceeds(percent of stock mutual fund sellers
outside employer-sponsored
retirement plans)
How Proceeds were Reinvested1
(percent of stock mutual fund sellers
who reinvested the proceeds)
1 Multiple responses included.
Note: Number of respondents varies.

Sellers of Stock Funds Outside Employer Plans Typically Made Two Sales
The median number of stock mutual fund sales outside employer plans in 1998 was two.More than three-quarters of investors selling stock mutual funds outside employer plansmade three or fewer transactions (Figure 40). Only 7 percent conducted 10 or more stockmutual fund sales. These investors rarely sold stock funds over the Internet (Figures 41and Figure 42).
Most Recent Stock Mutual Fund Purchase or Sale Outside Employer Plans
Investors who bought stock mutual funds outside employer-sponsored retirement plansmost often used accumulated savings and reinvested dividends to finance their mostrecent purchases of stock mutual funds (Figure 43).28 Nearly one-quarter used proceedsfrom the sale of other investments, usually the sale of shares of other stock mutual funds,and 18 percent employed regular, automatic deductions from a savings plan.
Proceeds from the Sale of Stock Funds Outside Employer Plans Are Usually Reinvested
The vast majority of those who sold shares of stock mutual funds outside employer plansreinvested some or all of the proceeds from the sale (Figure 44). About one-quarter spent all of the proceeds they received. Seventy-five percent of those who reinvested theproceeds used the money to buy shares of other stock mutual funds, and 34 percentbought shares of individual stock.
48 Equity Ownership in America
28 Includes automatic reinvestment of dividends.

CHAPTER 4
Owners of Individual Stock and Stock Mutual Funds Inside Employer-Sponsored Retirement Plans29
Characteristics of Owners of Individual Stock Inside Employer Plans
One in 10 U.S. Households Own Individual Stock Inside Employer Plans
A total of 10.7 million households — representing 10.5 percent of U.S. households —and14.0 million individuals owned individual stock inside employer-sponsored retirementplans in 1999 (see Figure 12 on page 13). The financial decisionmakers in these house-holds are a median of 45 years old, with median household income of $65,000 andmedian household financial assets of $96,500 (Figure 45). The majority are married,employed, and college graduates. More than half own IRAs.
The majority of investors with individual stock inside employer plans first purchasedequities in these plans. Most made their initial equity purchase before 1990, usually indi-vidual stock. Most have a long-term investment outlook, do not perceive themselves asfrequent stock traders, and can accept short-term market fluctuations.
The vast majority of these investors also own individual stock outside employer plansand own stock mutual funds. Among their non-equity investments, these investors aremost likely to have certificates of deposit, money market deposit accounts, or savingsaccounts. Some also own money market funds, hybrid and bond funds, and investmentreal estate.
Individual Stock Typically Represents Less than One-third of Assets of Investors with Individual Stock in Employer Plans
Investors with individual stock in employer plans have a median of $30,000 in two stocks in these plans (Figure 46). This amount represents 31 percent of their medianhousehold financial assets. Nearly three-fifths own one or two stocks in employer plans.One-fifth own three to five, and another fifth own six or more.30 Very few hold foreignstock inside their retirement plans. Investors owning individual stock in employer plansowned individual stock in these plans for a median of 12 years.
Equity Ownership in America 49
29The format of this chapter differs from those of Chapters 2 and 3 because transactions conducted inside andoutside employer-sponsored retirement plans by owners of individual stock and stock mutual funds are dissimilar.
30Approximately three-quarters of equity investors owning individual stock inside employer plans indicated they ownstock other than their company’s stock through such plans.

FIGURE 45
Investor Characteristics—Ownership of Individual Stock Inside Employer-sponsored Retirement Plans1
Median Age 45 years
Household income $65,000
Household financial assets2 $96,500
Percent Household investment decisionmaker:
Male 30
Female 12
Co-decisionmakers 58
Married 74
College or postgraduate degree 55
Employed 88
Retired from lifetime occupation 14
Equity investments owned:
Individual stock (net)3 100
Inside employer-sponsored retirement plans 100
Outside employer-sponsored retirement plans 62
Stock mutual funds (net)3 91
Inside employer-sponsored retirement plans 89
Outside employer-sponsored retirement plans 47
Bought first equity:
Before 1990 63
1990 to 1995 24
1996 or later 13
Source of first equity purchase:
Inside employer-sponsored retirement plan 62
Outside employer-sponsored retirement plan 38
Type of equity first purchased:
Individual stock only 60
Stock mutual funds only 12
Both individual stock and stock mutual funds 27
Non-equity investments held:3
Savings accounts, money market deposit accounts, or certificates of deposit 85
Bond investments (net)3 23
Individual bonds 11
Bond mutual funds 16
Fixed or variable annuities 20
Hybrid mutual funds 30
Money market mutual funds 39
Investment real estate 29
Have IRA 58
Willing to take:
Substantial risk for substantial gain 11
Above-average risk for above-average gain 34
Average risk for average gain 45
Below-average risk for below-average gain 4
Unwilling to take any risk 6
1 Refers to the household’s responding financial decisionmaker for investments.2 Includes assets in employer-sponsored retirement plans but excludes value of primary residence.3 Multiple responses included.
Note: Number of respondents varies.
50 Equity Ownership in America

Individual Stock Assets Held Inside Employer-sponsored Retirement Plans
Less than $1,000 6
$1,000 to $4,999 9
$5,000 to $9,999 10
$10,000 to $29,999 12
$30,000 to $99,999 27
$100,000 to $199,999 14
$200,000 to $499,999 7
$500,000 to $999,999 2
$1,000,000 or more 2
Mean $105,800
Median $30,000
Number of respondents 336
Number of Individual Stocks Owned Inside Employer-sponsored Retirement Plans
1 40
2 18
3 to 5 20
6 to 9 7
10 to 19 9
20 or more 5
Mean 5
Median 2
Number of respondents 376
Ownership of Foreign Stock Inside Employer-sponsored Retirement Plans
Own foreign stock 12
Do not own foreign stock 88
Number of respondents 414
Length of Ownership of Individual Stock Inside Employer-sponsored Retirement Plans
2 years or less 14
3 to 5 years 16
6 to 10 years 21
11 to 15 years 18
16 to 20 years 14
21 to 30 years 12
More than 30 years 5
Mean 16 years
Median 12 years
Number of respondents 433
FIGURE 46
Investment Characteristics—Ownership of Individual Stock Inside Employer-sponsored Retirement Plans(percent of equity owners with individual stock inside employer-sponsored retirement plans)
Equity Ownership in America 51

Characteristics of Owners of Stock Mutual Funds Inside Employer Plans
Nearly Three in 10 U.S. Households Own Stock Mutual Funds Inside Employer Plans
Approximately 29 million households — representing 27.9 percent of U.S. households —and 39.9 million individuals owned stock mutual funds inside employer-sponsored retire-ment plans in 1999 (see Figure 12 on page 13). The typical investor with stock mutualfunds in these plans is 44 years old, with household income of $63,000 and householdfinancial assets of $80,000 (Figure 47). More than 70 percent are married, 90 percent areemployed, and more than half are college graduates. Most have an IRA.
Nearly 70 percent of investors owning stock mutual funds inside employer planspurchased their first equity there, usually a stock mutual fund. More than half purchasedtheir first equity before 1990, and like owners of stock mutual funds outside employerplans, nearly all describe themselves as long-term equity investors. They say they follow abuy-and-hold investment approach, and are unconcerned about short-term market fluctuations.
Fifty-one percent of this group also own stock mutual funds outside employer-spon-sored retirement plans. Less than half own individual stock or hybrid funds, and evenfewer own bond funds. About one-quarter own investment real estate.
Stock Mutual Funds Typically Represent About One-third of Assets of Investors with Stock Mutual Funds in Employer Plans
Shareholders owning stock mutual funds inside employer plans have a median of $30,000invested in three stock mutual funds through these plans, representing 38 percent of theirmedian household financial assets (Figure 48). The majority own international or globalstock mutual funds through their retirement plans.
Equity Owner Changes to Employer Plans in 1998
Payroll Contribution Changes Usually Led to Increased Stock Mutual Fund Purchases
Most equity owners did not make changes to employer-sponsored retirement plan contri-butions in 1998 (Figure 49). Of those who did, 70 percent made one change (Figure50).31 The type of equity owned had little effect on changes in payroll contributions.
Nearly two-thirds of payroll contribution changes by equity owners resulted inincreased purchases of stock mutual fund shares (Figure 51). Very few payroll changesinvolved individual stock.
Asset Allocation Changes Typically Involved Stock Mutual Fund Shares
Most investors with equities inside employer-sponsored retirement plans did not reallo-cate assets in these plans in 1998 (Figure 52). Among those who did, nearly two-thirdsmade one change, and less than 20 percent made three or more changes (Figure 53).
As with payroll contribution changes, asset allocation changes tended to involve stock mutual funds, mostly purchases. Twenty-eight percent of asset allocation changesresulted in the purchase of individual stock, and 24 percent in the sale of individual stock(Figure 54).
52 Equity Ownership in America
31Twenty-two percent of investors owning equities inside employer plans made a payroll contribution change and anasset allocation change in 1998.

FIGURE 47
Investor Characteristics—Ownership of Stock Mutual Funds Inside Employer-sponsored Retirement Plans1
Median Age 44 years
Household income $63,000
Household financial assets2 $80,000
Percent Household investment decisionmaker:
Male 25
Female 17
Co-decisionmakers 58
Married 72
College or postgraduate degree 56
Employed 90
Retired from lifetime occupation 11
Equity investments owned:
Individual stock (net)3 45
Inside employer-sponsored retirement plans 22
Outside employer-sponsored retirement plans 38
Stock mutual funds (net)3 100
Inside employer-sponsored retirement plans 100
Outside employer-sponsored retirement plans 51
Bought first equity:
Before 1990 55
1990 to 1995 30
1996 or later 15
Source of first equity purchase:
Inside employer-sponsored retirement plan 69
Outside employer-sponsored retirement plan 31
Type of equity first purchased:
Individual stock only 17
Stock mutual funds only 72
Both individual stock and stock mutual funds 11
Non-equity investments held:3
Savings accounts, money market deposit accounts, or certificates of deposit 83
Bond investments (net)3 22
Individual bonds 8
Bond mutual funds 17
Fixed or variable annuities 21
Hybrid mutual funds 43
Money market mutual funds 27
Investment real estate 24
Have employer-sponsored retirement plan coverage 100
Have IRA 56
Willing to take:
Substantial risk for substantial gain 10
Above-average risk for above-average gain 36
Average risk for average gain 45
Below-average risk for below-average gain 5
Unwilling to take any risk 4
1 Refers to the household’s responding financial decisionmaker for investments.2 Includes assets in employer-sponsored retirement plans but excludes value of primary residence.3 Multiple responses included.
Note: Number of respondents varies.
Equity Ownership in America 53

Stock Mutual Fund Assets Held Inside Employer-sponsored Retirement Plans
Less than $5,000 16
$5,000 to $9,999 9
$10,000 to $19,999 14
$20,000 to $49,999 24
$50,000 to $99,999 18
$100,000 to $199,999 11
$200,000 to $499,999 6
$500,000 to $999,999 1
$1,000,000 or more 1
Mean $73,900
Median $30,000
Number of respondents 986
Number of Stock Mutual Funds Owned Inside Employer-sponsored Retirement Plans
1 25
2 24
3 13
4 to 5 21
6 to 9 11
10 to 19 4
20 or more 1
Mean 4
Median 3
Number of respondents 1,084
Ownership of International or Global Stock Mutual Funds Inside Employer-sponsored Retirement Plans
Own international or global stock mutual funds 59
Do not own international or global stock mutual funds 41
Number of respondents 1,061
Length of Ownership of Stock Mutual Funds Inside Employer-sponsored Retirement Plans
2 years or less 15
3 to 5 years 21
6 to 10 years 28
11 to 15 years 17
16 to 20 years 10
21 to 30 years 7
More than 30 years 2
Mean 11 years
Median 8 years
Number of respondents 1,268
FIGURE 48
Investment Characteristics—Ownership of Stock Mutual Funds Inside Employer-sponsored Retirement Plans(percent of equity owners with stock mutual funds inside employer-sponsored retirement plans)
54 Equity Ownership in America

Equity Ownership in America 55
Type of Equity Owned InsideAll Owners of Equities Employer-sponsored Retirement Plans
Inside Employer-sponsored Individual Stock MutualRetirement Plans Stock Funds
Yes, made payroll contribution changes 24 26 24
No, did not make payroll contribution changes 76 73 75
Number of respondents 1,493 762 1,347
FIGURE 49
Payroll Contribution Changes in 1998—Ownership of Equities Inside Employer-sponsored Retirement Plans(percent of equity owners with equities inside employer-sponsored retirement plans)
Type of Equity Owned InsideEquity Owners Who Employer-sponsored Retirement Plans
Made a Payroll Individual Stock MutualContribution Change Stock Funds
1 70 65 68
2 21 23 22
3 to 5 7 8 8
6 or more 0 3 2
Mean 2 2 2
Median 1 1 1
Number of respondents 351 198 326
FIGURE 50
Number of Payroll Contribution Changes Made in 1998—Ownership of Equities Inside Employer-sponsored Retirement Plans(percent of equity owners with equities inside employer-sponsored retirement plans who made payroll contribution changes)
FIGURE 51
Characteristics of Payroll Changes in 1998—Ownership of Equities Inside Employer-sponsored Retirement Plans1
(percent of equity owners with equities inside employer-sponsored retirement plans who made payroll contribution changes)
Purchase of more individual stock shares 24
Purchase of less individual stock shares 10
Purchase of more stock mutual fund shares 64
Purchase of less stock mutual fund shares 16
1 Multiple responses included.
Note: Number of respondents varies.

56 Equity Ownership in America
Type of Equity Owned InsideAll Owners of Equities Employer-sponsored Retirement Plans
Inside Employer-sponsored Individual Stock MutualRetirement Plans Stock Funds
Yes, made allocation change to account balance 22 26 22
No, did not make allocation change to account balance 77 73 77
Number of respondents 1,491 759 1,346
FIGURE 52
Allocation Changes Made to Account Balance in 1998—Ownership of Equities Inside Employer-sponsored Retirement Plans(percent of equity owners with equities inside employer-sponsored retirement plans)
Type of Equity Owned InsideEquity Owners Who Made Employer-sponsored Retirement Plans
Allocation Changes Individual Stock Mutualto Account Balance Stock Funds
1 64 62 62
2 19 19 21
3 to 5 13 13 14
6 or more 3 5 4
Mean 2 2 2
Median 1 1 1
Number of respondents 324 196 297
FIGURE 53
Number of Allocation Changes Made to Account Balance in 1998—Ownership of Equities Inside Employer-sponsored Retirement Plans(percent of equity owners with equities inside employer-sponsored retirement plans who made allocation changes to account balance)
FIGURE 54
Characteristics of Account Balance Allocation Changes—Ownership of Equities Inside Employer-sponsored Retirement Plans1
(percent of equity owners with equities inside employer-sponsored retirement plans who made allocation changes to account balance)
Purchase of individual stock shares 28
Sale of individual stock shares 24
Purchase of stock mutual fund shares 64
Sale of stock mutual fund shares 38
1 Multiple responses included.
Note: Number of respondents varies.

APPENDIX A
Detailed Research Methodology
This report summarizes results of a survey conducted by the Boston Research Group underthe direction of the Investment Company Institute and the Securities Industry Association.The survey identified demographic, financial, and individual stock and stock mutual funddata on equity owners nationwide.
The survey collected detailed information on individual stock and stock mutual fundownership inside and outside employer-sponsored retirement plans. The survey includedsections on ownership of: 1) individual stock inside employer-sponsored retirement plans, 2)stock mutual funds inside employer-sponsored retirement plans, 3) individual stock outsideemployer-sponsored retirement plans, and 4) stock mutual funds outside employer-spon-sored retirement plans. Another section included equity owner views on various aspects ofequity investing: financial goals of equity investing, willingness to take financial risk withequity investments, and understanding of individual stock and stock mutual funds. The finalsection of the survey collected demographic data on equity owners: age, household income,household financial assets, education, and marital status. The questionnaire included ques-tions to check the consistency of the data reported by respondents, and was pretested exten-sively to ensure that the questions were understandable to respondents.
Interviewing and Sampling Procedures
Interviews were conducted by telephone and were completed in January and February 1999.Eligible respondents owned individual, publicly traded stock or stock mutual funds, eitherinside or outside retirement plans at work. All interviews were conducted with the householddecisionmaker most knowledgeable about savings and investments.32 The number of indi-viduals who owned equities in a household was determined by asking respondents how manyindividuals in the household owned each type of equity. The multiplier for number of indi-viduals per household was 1.6.
A random digit dial (RDD) national probability sample was used to generate a representa-tive sample of equity owners nationwide. A total of 4,842 household financial decisionmak-ers were asked whether their households owned equities. Of these, 2,336 decisionmakers, or48.2 percent, indicated that their households owned equities —1,943 completed the entiresurvey and 393 completed part of it. The 393 partial interviews with known equity owners
Equity Ownership in America 57
32Households consist of all persons who occupy a housing unit. A house, an apartment or other group of rooms, or asingle room is regarded as a housing unit when it is occupied or intended for occupancy as separate living quarters.A household includes related family members and all unrelated persons, if any, such as lodgers, foster children,wards, or employees who share a housing unit. A person living alone in a housing unit, or a group of unrelatedpersons sharing a housing unit as partners, is also counted as a household.
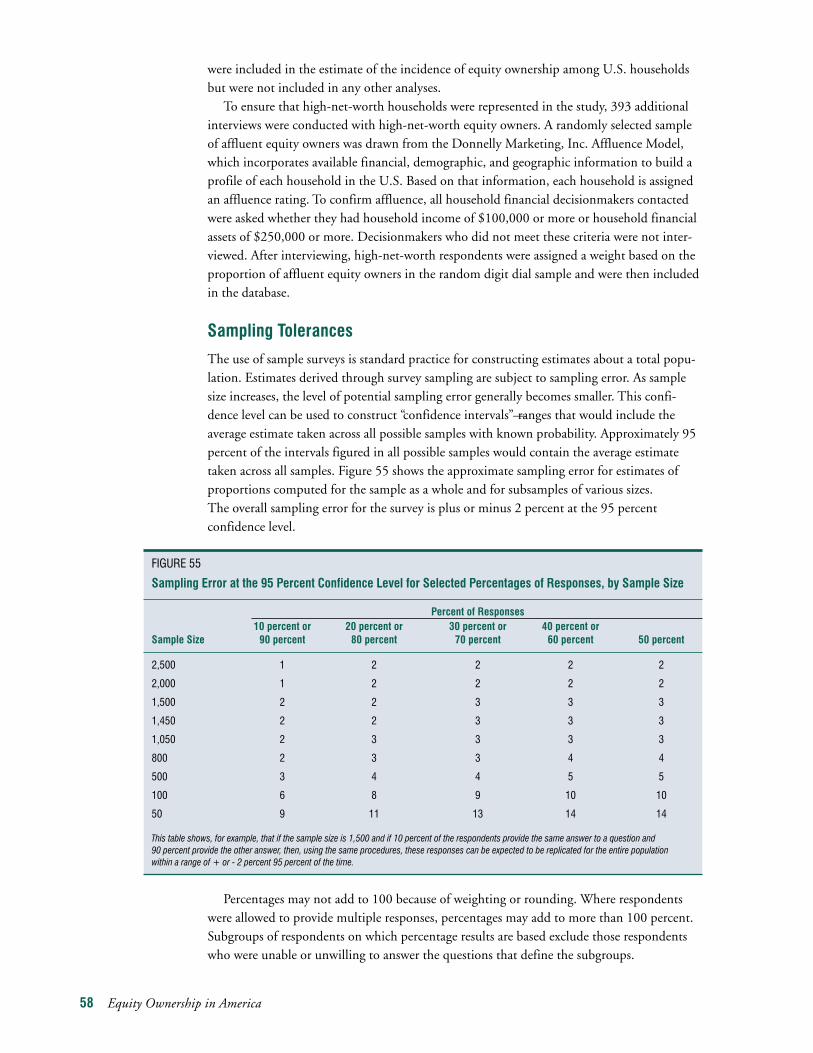
were included in the estimate of the incidence of equity ownership among U.S. householdsbut were not included in any other analyses.
To ensure that high-net-worth households were represented in the study, 393 additionalinterviews were conducted with high-net-worth equity owners. A randomly selected sampleof affluent equity owners was drawn from the Donnelly Marketing, Inc. Affluence Model,which incorporates available financial, demographic, and geographic information to build aprofile of each household in the U.S. Based on that information, each household is assignedan affluence rating. To confirm affluence, all household financial decisionmakers contactedwere asked whether they had household income of $100,000 or more or household financialassets of $250,000 or more. Decisionmakers who did not meet these criteria were not inter-viewed. After interviewing, high-net-worth respondents were assigned a weight based on theproportion of affluent equity owners in the random digit dial sample and were then includedin the database.
Sampling Tolerances
The use of sample surveys is standard practice for constructing estimates about a total popu-lation. Estimates derived through survey sampling are subject to sampling error. As samplesize increases, the level of potential sampling error generally becomes smaller. This confi-dence level can be used to construct “confidence intervals” — ranges that would include theaverage estimate taken across all possible samples with known probability. Approximately 95percent of the intervals figured in all possible samples would contain the average estimatetaken across all samples. Figure 55 shows the approximate sampling error for estimates ofproportions computed for the sample as a whole and for subsamples of various sizes. The overall sampling error for the survey is plus or minus 2 percent at the 95 percent confidence level.
Percentages may not add to 100 because of weighting or rounding. Where respondentswere allowed to provide multiple responses, percentages may add to more than 100 percent.Subgroups of respondents on which percentage results are based exclude those respondentswho were unable or unwilling to answer the questions that define the subgroups.
58 Equity Ownership in America
FIGURE 55
Sampling Error at the 95 Percent Confidence Level for Selected Percentages of Responses, by Sample Size
Percent of Responses10 percent or 20 percent or 30 percent or 40 percent or
Sample Size 90 percent 80 percent 70 percent 60 percent 50 percent
2,500 1 2 2 2 2
2,000 1 2 2 2 2
1,500 2 2 3 3 3
1,450 2 2 3 3 3
1,050 2 3 3 3 3
800 2 3 3 4 4
500 3 4 4 5 5
100 6 8 9 10 10
50 9 11 13 14 14
This table shows, for example, that if the sample size is 1,500 and if 10 percent of the respondents provide the same answer to a question and 90 percent provide the other answer, then, using the same procedures, these responses can be expected to be replicated for the entire population within a range of + or - 2 percent 95 percent of the time.

APPENDIX B
Detailed Tabulations for All EquityOwners, Individual Stock Owners,and Stock Mutual Fund Shareholders
Equity Ownership in America 59

60 Equity Ownership in America
Type of Equity OwnedAll Equity Owners Individual Stock Stock Mutual Funds
Household Investment Decisionmaker
Male is sole decisionmaker 26 29 25
Female is sole decisionmaker 20 17 20
Co-decisionmakers 54 54 55
Number of respondents 2,336 1,236 1,980
Age of Respondent
Less than 30 years 11 9 10
30 to 34 years 10 9 10
35 to 39 years 12 10 12
40 to 44 years 12 11 12
45 to 49 years 14 14 14
50 to 54 years 12 13 12
55 to 59 years 8 8 8
60 to 64 years 6 7 6
65 to 74 years 10 12 10
75 years or older 5 6 5
Mean age 48 years 49 years 47 years
Median age 47 years 48 years 47 years
Number of respondents 2,278 1,196 1,935
Household Income in 1998
Less than $10,000 3 2 2
$10,000 to $19,999 4 3 3
$20,000 to $29,999 8 6 8
$30,000 to $39,999 13 10 12
$40,000 to $49,999 13 13 12
$50,000 to $74,999 28 27 29
$75,000 to $99,999 15 16 16
$100,000 to $149,999 11 13 11
$150,000 to $199,999 3 4 3
$200,000 to $499,999 3 4 3
$500,000 to $749,999 <1 <1 <1
$750,000 to $999,999 <1 <1 <1
$1 million or more <1 1 <1
Mean $74,700 $87,300 $74,900
Median $60,000 $62,500 $60,000
Number of respondents 1,668 852 1,418
Marital Status
Married 67 69 68
Divorced or separated 11 10 12
Widowed 7 7 6
Single 15 14 14
Number of respondents 2,294 1,217 1,946
FIGURE 56
Demographic Characteristics of All Equity Owners, Individual Stock Owners, and Stock Mutual Fund Shareholders(percent)

Living with a Partner
Yes 5 5 5
No 95 95 95
Number of respondents 2,294 1,217 1,946
Education of Respondent
Some high school or less 1 2 1
High school graduate 16 14 15
Some college or associate’s degree 30 26 31
Completed four years of college 26 28 26
Some graduate school 8 7 8
Completed graduate school 19 17 19
Number of respondents 2,317 1,223 1,963
Employment Status of Respondent
Employed full-time 71 68 72
Employed part-time 9 9 8
Not employed 20 23 19
Number of respondents 2,318 1,223 1,968
Retirement Status of Respondent
Retired from lifetime occupation 21 24 20
Not retired from lifetime occupation 79 76 80
Number of respondents 2,317 1,223 1,966
Employment Status of Spouse or Partner1
Employed full-time 63 58 64
Employed part-time 10 12 10
Not employed 26 30 26
Number of respondents 1,619 881 1,389
Retirement Status of Spouse or Partner1
Retired from lifetime occupation 17 20 16
Not retired from lifetime occupation 83 80 84
Number of respondents 1,618 880 1,428
Ethnic Background2
Caucasian 90 91 90
African-American 5 3 5
Asian 2 2 1
Hispanic 4 3 3
Other 2 3 2
1 Percent of respondents married or living with a partner.
2 Multiple responses included because Hispanics can be of any race.
Equity Ownership in America 61
Type of Equity Owned
All Equity Owners Individual Stock Stock Mutual Funds
FIGURE 56 (continued)

Type of Equity Owned
All Equity Owners Individual Stock Stock Mutual Funds
Household Financial Assets1
Less than $5,000 5 3 18$5,000 to $9,999 5 4 10$10,000 to $24,999 13 9 15$25,000 to $49,999 12 10 13$50,000 to $74,999 12 11 11$75,000 to $99,999 8 7 5$100,000 to $149,999 10 11 7$150,000 to $199,999 7 6 5$200,000 to $499,999 16 20 10$500,000 to $749,999 5 7 3$750,000 to $999,999 2 3 1$1 million or more 5 9 3
Mean $232,900 $318,900 $232,300Median $85,000 $125,000 $87,500
Number of respondents 1,315 691 1,119
Household Financial Assets Held Through Employer-sponsored Retirement PlansLess than $5,000 25 25 22$5,000 to $9,999 6 5 7$10,000 to $24,999 14 13 15$25,000 to $49,999 14 14 14$50,000 to $74,999 10 9 10$75,000 to $99,999 6 5 6$100,000 to $149,999 8 9 8$150,000 to $199,999 3 4 4$200,000 to $499,999 8 9 9$500,000 to $749,999 2 3 2$750,000 to $999,999 1 1 1$1 million or more 2 3 1
Mean $91,600 $111,100 $93,400 Median $30,000 $35,000 $33,000
Number of respondents 1,488 785 1,259
Household Financial Assets Held Outside Employer-sponsored Retirement PlansLess than $5,000 19 12 18$5,000 to $9,999 10 8 10$10,000 to $24,999 15 14 15$25,000 to $49,999 13 12 13$50,000 to $74,999 10 10 11$75,000 to $99,999 4 4 5$100,000 to $149,999 6 8 7$150,000 to $199,999 4 5 5$200,000 to $499,999 10 13 10$500,000 to $749,999 4 5 3$750,000 to $999,999 1 2 1$1 million or more 3 6 3
Mean $159,300 $239,300 $151,900 Median $30,000 $50,000 $35,000
Number of respondents 1,453 751 1,234
FIGURE 57
Financial Characteristics of All Equity Owners, Individual Stock Owners, and Stock Mutual Fund Shareholders(percent)
62 Equity Ownership in America

Equity Ownership in America 63
Non-equity Investments Owned2
U.S. savings bonds 39 41 39Bank deposit accounts 83 84 83Individual corporate or government bonds 9 8 9Bond mutual funds 16 16 19Hybrid mutual funds 39 38 44Money market mutual funds 26 30 29Variable annuities 15 14 16Fixed annuities 10 11 10Investment real estate 26 32 27
Assets in U.S. Savings Bonds3
Less than $1,000 30 27 29$1,000 to $2,499 27 25 27$2,500 to $4,999 9 11 9$5,000 to $9,999 14 14 15$10,000 to $14,999 8 10 8$15,000 to $19,999 3 3 2$20,000 to $29,999 5 5 5$30,000 to $49,999 1 1 2$50,000 to $74,999 2 1 2$75,000 to $99,999 <1 1 <1$100,000 to $149,999 1 1 <1$150,000 to $199,999 <1 <1 <1$200,000 or more 4 3 <1
Mean $7,900 $9,800 $7,300 Median $2,000 $2,000 $2,000
Number of respondents 625 341 526
Assets in Bank Deposit Accounts4
Less than $1,000 14 11 14$1,000 to $2,499 16 13 16$2,500 to $4,999 11 9 10$5,000 to $9,999 16 16 16$10,000 to $14,999 11 12 10$15,000 to $19,999 5 5 6$20,000 to $29,999 9 8 9$30,000 to $49,999 6 6 6$50,000 to $74,999 6 8 6$75,000 to $99,999 2 2 2$100,000 to $149,999 3 4 2$150,000 to $199,999 1 1 1$200,000 or more 2 3 2
Mean $23,600 $28,800 $22,600 Median $7,500 $10,000 $7,500
Number of respondents 1,312 673 1,113
Type of Equity Owned
All Equity Owners Individual Stock Stock Mutual Funds
FIGURE 57 (continued)

Assets in Individual Corporate or Government Bonds5
Less than $1,000 2 3 3$1,000 to $2,499 6 4 6$2,500 to $4,999 3 4 4$5,000 to $9,999 8 8 9$10,000 to $14,999 15 13 16$15,000 to $19,999 6 5 6$20,000 to $29,999 18 17 17$30,000 to $49,999 8 9 9$50,000 to $74,999 9 11 9$75,000 to $99,999 2 0 2$100,000 to $149,999 8 10 9$150,000 to $199,999 5 5 4$200,000 or more 9 11 7
Mean $68,400 $78,300 $55,300 Median $20,000 $25,000 $20,000
Number of respondents 78 60 68
Assets in Bond Mutual Funds6
Less than $1,000 1 1 2$1,000 to $2,499 9 11 9$2,500 to $4,999 12 12 12$5,000 to $9,999 13 11 14$10,000 to $14,999 14 13 14$15,000 to $19,999 8 6 8$20,000 to $29,999 10 11 10$30,000 to $49,999 11 13 11$50,000 to $74,999 11 10 11$75,000 to $99,999 <1 0 <1$100,000 to $149,999 5 6 5$150,000 to $199,999 1 1 1$200,000 or more 6 3
Mean $34,600 $40,900 $34,500 Median $15,000 $15,000 $12,500
Number of respondents 171 92 166
Assets in Hybrid Mutual Funds7
Less than $1,000 3 2 3$1,000 to $2,499 9 6 9$2,500 to $4,999 9 8 9$5,000 to $9,999 13 12 13$10,000 to $14,999 12 11 12$15,000 to $19,999 7 8 7$20,000 to $29,999 12 15 12$30,000 to $49,999 8 8 8$50,000 to $74,999 9 9 9$75,000 to $99,999 3 2 3$100,000 to $149,999 7 7 7$150,000 to $199,999 2 2 2$200,000 or more 7 9 7
Mean $48,900 $60,400 $50,000 Median $16,000 $20,000 $16,000
Number of respondents 470 239 452
64 Equity Ownership in America
Type of Equity Owned
All Equity Owners Individual Stock Stock Mutual Funds
FIGURE 57 (continued)

Assets in Money Market Mutual Funds8
Less than $1,000 7 5 7$1,000 to $2,499 13 12 14$2,500 to $4,999 11 12 11$5,000 to $9,999 16 14 16$10,000 to $14,999 13 14 13$15,000 to $19,999 5 6 5$20,000 to $29,999 12 12 13$30,000 to $49,999 8 7 8$50,000 to $74,999 6 8 6$75,000 to $99,999 2 2 2$100,000 to $149,999 3 4 3$150,000 to $199,999 1 1 1$200,000 or more 2 3 2
Mean $24,800 $29,100 $25,400 MedianNumber of respondents 318 199 297
Assets in Variable Annuities9
Less than $1,000 2 2 2$1,000 to $2,499 7 6 8$2,500 to $4,999 9 9 9$5,000 to $9,999 13 14 13$10,000 to $14,999 8 7 9$15,000 to $19,999 5 5 4$20,000 to $29,999 12 8 12$30,000 to $49,999 16 17 16$50,000 to $74,999 13 13 12$75,000 to $99,999 4 6 4$100,000 to $149,999 5 8 5$150,000 to $199,999 3 3 3$200,000 or more 3 3 2
Mean $39,500 $42,400 $38,700 Median $21,000 $25,000 $20,000
Number of respondents 185 101 170
Assets in Fixed Annuities10
Less than $1,000 2 5 1$1,000 to $2,499 7 5 6$2,500 to $4,999 7 2 8$5,000 to $9,999 12 10 13$10,000 to $14,999 11 9 11$15,000 to $19,999 5 2 6$20,000 to $29,999 17 20 17$30,000 to $49,999 13 18 12$50,000 to $74,999 10 10 10$75,000 to $99,999 5 4 6$100,000 to $149,999 4 4 3$150,000 to $199,999 1 1 1$200,000 or more 6 10 7
Mean $43,400 $55,800 $43,800 Median $20,000 $25,000 $20,000
Number of respondents 103 52 89
Equity Ownership in America 65
Type of Equity Owned
All Equity Owners Individual Stock Stock Mutual Funds
FIGURE 57 (continued)

Assets in Investment Real Estate11
Less than $1,000 1 1 1$1,000 to $2,499 1 1 1$2,500 to $4,999 3 2 2$5,000 to $9,999 3 3 3$10,000 to $14,999 7 5 7$15,000 to $19,999 4 3 4$20,000 to $29,999 9 7 10$30,000 to $49,999 12 10 14$50,000 to $74,999 17 14 18$75,000 to $99,999 5 6 6$100,000 to $149,999 10 11 9$150,000 to $199,999 6 8 6$200,000 or more 21 28 20
Mean $197,500 $271,700 $204,200 Median $55,000 $80,000 $50,000
Number of respondents 410 252 345
1 Excludes primary residence but includes assets in employer-sponsored retirement plans.2 Multiple responses included.3 Percent of respondents owning U.S. savings bonds.4 Percent of respondents owning bank deposit accounts.5 Percent of respondents owning individual corporate or government bonds.6 Percent of respondents owning bond mutual funds.7 Percent of respondents owning hybrid mutual funds.8 Percent of respondents owning money market mutual funds.9 Percent of respondents owning variable annuities.10 Percent of respondents owning fixed annuities.11 Percent of respondents owning investment real estate.
66 Equity Ownership in America
Type of Equity Owned
All Equity Owners Individual Stock Stock Mutual Funds
FIGURE 57 (continued)

APPENDIX C
Detailed Tabulations for All Equity Owners by Key Demographic Variables
Equity Ownership in America 67

Male is Sole Female is Sole Co-decision-Decisionmaker Decisionmaker makers
Median
Age 46 years 50 years 46 years
Household income $55,000 $36,000 $62,500
Household financial assets2 $104,000 $60,000 $87,000
Percent
Married 50 19 92
Living with a partner 4 7 5
Widowed 7 24 1
College or postgraduate degree 60 48 51
Completed graduate school 22 16 18
Employed 82 69 83
Spouse or partner employed3 59 80 77
Retired from lifetime occupation 23 29 18
Spouse or partner retired from lifetime occupation3 20 23 16
Non-equity investments held:4
Savings accounts, money market deposit accounts, or certificates of deposit 80 85 84
Bond investments (net)4 21 24 21
Individual bonds 11 9 8
Bond mutual funds 15 19 16
Fixed or variable annuities 17 27 21
Hybrid mutual funds 40 38 39
Money market mutual funds 26 27 26
Investment real estate 27 21 28
Have employer-sponsored retirement plan coverage (net)4 77 75 83
Traditional defined-benefit pension plan 36 34 41
401(k) plan 55 48 60
403(b) plan 5 10 9
State, local, or federal government plan 13 14 22
Other5 12 14 13
Have IRA (net)4 53 48 54
Traditional IRA 47 44 48
Roth IRA 12 10 11
Ethnic background:6
Caucasian 91 89 90
African-American 3 7 5
Asian 2 0 2
Hispanic 3 3 4
Other 3 3 2
1 Refers to the household’s responding financial decisionmaker for investments.2 Includes assets in employer-sponsored retirement plans but excludes value of primary residence.3 Percent of shareholders married or living with a partner.4 Multiple responses included.5 Other includes employee stock ownership plans (ESOPs) and SEP-IRAs.6 Multiple responses included because Hispanics can be of any race.
Note: Number of respondents varies.
FIGURE 58
Characteristics of Equity Owners by Investment Decisionmaker1
68 Equity Ownership in America

Equity Ownership in America 69
Male is Sole Female is Sole Co-decision-Decisionmaker Decisionmaker makers
Median
Household financial assets in equities $55,000 $35,000 $50,000
Number of equities owned 5 4 4
Number of equity transactions in 19981 1 0 0
Percent
Own:
Individual stock (net)2 59 47 53
Inside employer-sponsored retirement plans 23 13 21
Outside employer-sponsored retirement plans 51 40 44
Stock mutual funds (net)2 81 87 87
Inside employer-sponsored retirement plans 55 50 62
Outside employer-sponsored retirement plans 56 60 56
Year of first equity purchase:
Before 1990 54 50 55
1990 to 1995 28 26 28
1996 or later 18 24 16
Source of first equity purchase:
Inside employer-sponsored retirement plans 38 41 48
Outside employer-sponsored retirement plans 62 59 52
Type of equity first purchased:
Individual stock only 36 29 29
Stock mutual funds only 53 64 61
Both individual stock and stock mutual funds 6 11 10
Willing to take:
Substantial risk for substantial gain 13 6 8
Above-average risk for above-average gain 34 25 31
Average risk for average gain 43 56 47
Below-average risk for below-average gain 5 8 7
Unwilling to take any risk 5 6 7
1 See text footnote 14 on page 8 for the definition of an equity transaction.2 Multiple responses included.
Note: Number of respondents varies.
FIGURE 59
Equity Ownership Characteristics by Investment Decisionmaker

Household IncomeLess than $50,000 to $100,000$50,000 $99,999 or More
Median Age 45 years 44 years 48 yearsHousehold income $34,000 $65,000 $125,000Household financial assets2 $42,500 $89,000 $300,000
Percent Household investment decisionmaker:
Male 28 25 28Female 32 12 8Co-decisionmakers 40 63 64
Married 44 77 86Living with a partner 7 5 5Widowed 12 2 1College or postgraduate degree 38 55 75Completed graduate school 11 19 36Employed 74 88 88Spouse or partner employed3 62 80 75Retired from lifetime occupation 24 15 14Spouse or partner retired from lifetime occupation3 25 12 14Non-equity investments held:4
Savings accounts, money market deposit accounts, or certificates of deposit 79 84 86
Bond investments (net)4 15 19 31Individual bonds 4 7 15Bond mutual funds 12 15 23
Fixed or variable annuities 17 20 25Hybrid mutual funds 33 42 46Money market mutual funds 20 26 38Investment real estate 18 26 40
Have employer-sponsored retirement plan coverage (net)4 73 86 84Traditional defined-benefit pension plan 30 43 46401(k) plan 47 65 63403(b) plan 7 8 13State, local, or federal government plan 16 21 19Other5 12 14 19
Have IRA (net)4 41 55 67Traditional IRA 36 48 63Roth IRA 8 12 15
Ethnic background:6
Caucasian 91 88 91African-American 4 5 4Asian 1 2 3Hispanic 2 5 2Other 3 2 1
1 Refers to the household’s responding financial decisionmaker for investments.2 Includes assets in employer-sponsored retirement plans but excludes value of primary residence.3 Percent of shareholders married or living with a partner.4 Multiple responses included.5 Other includes employee stock ownership plans (ESOPs) and SEP-IRAs.6 Multiple responses included because Hispanics can be of any race.
Note: Number of respondents varies.
FIGURE 60
Characteristics of Equity Owners by Household Income1
70 Equity Ownership in America

Household IncomeLess than $50,000 to $100,000$50,000 $99,999 or More
Median
Household financial assets in equities $20,000 $50,000 $200,000
Number of equities owned 3 4 7
Number of equity transactions in 19981 0 0 3
Percent
Own:
Individual stock (net)2 44 52 67
Inside employer-sponsored retirement plans 15 20 29
Outside employer-sponsored retirement plans 34 44 61
Stock mutual funds (net)2 81 89 88
Inside employer-sponsored retirement plans 49 66 69
Outside employer-sponsored retirement plans 51 55 66
Year of first equity purchase:
Before 1990 42 51 71
1990 to 1995 29 33 22
1996 or later 29 16 7
Source of first equity purchase:
Inside employer-sponsored retirement plans 44 49 42
Outside employer-sponsored retirement plans 56 51 58
Type of equity first purchased:
Individual stock only 30 27 36
Stock mutual funds only 64 62 54
Both individual stock and stock mutual funds 6 11 10
Willing to take:
Substantial risk for substantial gain 7 12 9
Above-average risk for above-average gain 27 34 43
Average risk for average gain 50 45 41
Below-average risk for below-average gain 8 6 4
Unwilling to take any risk 7 4 2
1 See text footnote 14 on page 8 for the definition of an equity transaction.2 Multiple responses included.
Note: Number of respondents varies.
FIGURE 61
Equity Ownership Characteristics by Household Income
Equity Ownership in America 71

Household Financial AssetsLess than $25,000 to $100,000 $500,000$25,000 $99,999 or $499,999 or More
Median Age 35 years 42 years 48 years 56 years
Household income $40,000 $52,000 $70,000 $100,000
Household financial assets2 $10,100 $56,000 $195,000 $840,000
Percent Household investment decisionmaker:
Male 25 26 31 41
Female 25 18 14 11
Co-decisionmakers 51 56 55 48
Married 54 66 72 78
Living with a partner 10 4 3 5
Widowed 2 5 5 9
College or postgraduate degree 39 49 60 71
Completed graduate school 10 13 28 36
Employed 90 88 82 70
Spouse or partner employed3 82 82 77 54
Retired from lifetime occupation 7 13 21 37
Spouse or partner retired from lifetime occupation3 11 9 14 26
Non-equity investments held:4
Savings accounts, money market deposit accounts, or certificates of deposit 80 85 83 85
Bond investments (net)4 14 10 24 39
Individual bonds 3 3 9 22
Bond mutual funds 12 8 18 29
Fixed or variable annuities 9 15 26 28
Hybrid mutual funds 30 37 42 50
Money market mutual funds 11 22 34 46
Investment real estate 8 20 33 56
Have employer-sponsored retirement plan coverage (net)4 77 85 83 76
Traditional defined-benefit pension plan 25 35 45 40
401(k) plan 60 67 59 48
403(b) plan 7 7 10 10
State, local, or federal government plan 16 18 18 17
Other5 16 13 15 15
Have IRA (net)4 30 49 63 70
Traditional IRA 24 45 56 67
Roth IRA 7 9 15 16
Ethnic background:6
Caucasian 86 90 92 94
African-American 6 4 3 2
Asian 2 1 3 2
Hispanic 5 4 3 <1
Other 3 3 1 2
1 Refers to the household’s responding financial decisionmaker for investments.2 Includes assets in employer-sponsored retirement plans but excludes value of primary residence.3 Percent of shareholders married or living with a partner.4 Multiple responses included.5 Other includes employee stock ownership plans (ESOPs) and SEP-IRAs.6 Multiple responses included because Hispanics can be of any race.
Note: Number of respondents varies.
FIGURE 62
Characteristics of Equity Owners by Household Financial Assets1
72 Equity Ownership in America

Household Financial AssetsLess than $25,000 to $100,000 $500,000$25,000 $99,999 or $499,999 or More
Median
Household financial assets in equities $7,000 $35,000 $104,000 $437,500
Number of equities owned 2 4 6 12
Number of equity transactions in 19981 0 0 1 5
Percent
Own:
Individual stock (net)2 38 47 59 77
Inside employer-sponsored retirement plans 17 22 19 29
Outside employer-sponsored retirement plans 25 37 55 71
Stock mutual funds (net)2 81 87 90 81
Inside employer-sponsored retirement plans 57 68 62 52
Outside employer-sponsored retirement plans 41 49 64 69
Year of first equity purchase:
Before 1990 22 47 66 84
1990 to 1995 32 37 25 11
1996 or later 46 17 9 5
Source of first equity purchase:
Inside employer-sponsored retirement plans 56 55 40 23
Outside employer-sponsored retirement plans 44 45 60 77
Type of equity first purchased:
Individual stock only 25 26 31 50
Stock mutual funds only 69 64 60 38
Both individual stock and stock mutual funds 6 9 10 12
Willing to take:
Substantial risk for substantial gain 12 11 7 8
Above-average risk for above-average gain 33 31 36 36
Average risk for average gain 45 47 46 49
Below-average risk for below-average gain 5 7 7 4
Unwilling to take any risk 5 5 4 2
1 See text footnote 14 on page 8 for the definition of an equity transaction.2 Multiple responses included.
Note: Number of respondents varies.
FIGURE 63
Equity Ownership Characteristics by Household Financial Assets
Equity Ownership in America 73

Baby Boom Silent GIGeneration X Generation Generation Generation
(ages 19 to 35) (ages 36 to 54) (ages 55 to 74) (ages 75 or older)
Median Age 29 years 44 years 61 years 78 years
Household income $47,000 $62,500 $53,000 $30,000
Household financial assets2 $25,000 $88,000 $200,000 $200,000
Percent Household investment decisionmaker:
Male 28 25 25 32
Female 15 17 24 40
Co-decisionmakers 57 58 51 28
Married 58 72 69 47
Living with a partner 13 4 2 0
Widowed 1 1 13 42
College or postgraduate degree 53 55 48 51
Completed graduate school 10 21 22 15
Employed 95 94 58 12
Spouse or partner employed3 85 85 54 15
Retired from lifetime occupation 1 5 49 90
Spouse or partner retired from lifetime occupation3 2 6 40 81
Non-equity investments held:4
Savings accounts, money market deposit accounts,or certificates of deposit 82 84 82 86
Bond investments (net)4 14 21 24 44
Individual bonds 4 8 11 25
Bond mutual funds 11 16 19 30
Fixed or variable annuities 9 20 30 35
Hybrid mutual funds 33 42 41 35
Money market mutual funds 17 26 32 30
Investment real estate 17 26 34 24
Have employer-sponsored plan coverage (net)4 83 86 73 49
Traditional defined-benefit pension plan 28 41 41 37
401(k) plan 69 67 39 10
403(b) plan 6 10 8 4
State, local, or federal government plan 16 20 17 11
Other5 15 15 10 3
Have IRA (net)4 37 53 67 39
Traditional IRA 27 47 64 39
Roth IRA 12 13 10 1
Ethnic background:6
Caucasian 84 88 96 97
African-American 7 5 2 2
Asian 3 2 1 2
Hispanic 6 4 1 1
Other 2 3 1 0
1 Refers to the household’s responding financial decisionmaker for investments.2 Includes assets in employer-sponsored retirement plans but excludes value of primary residence.3 Percent of shareholders married or living with a partner.4 Multiple responses included.5 Other includes employee stock ownership plans (ESOPs) and SEP-IRAs.6 Multiple responses included because Hispanics can be of any race.
Note: Number of respondents varies.
FIGURE 64
Characteristics of Equity Owners by Generation1
74 Equity Ownership in America

Baby Boom Silent GIGeneration X Generation Generation Generation
(ages 19 to 35) (ages 36 to 54) (ages 55 to 74) (ages 75 or older)
Median
Household financial assets in equities $20,000 $50,000 $85,000 $74,000
Number of equities owned 3 4 5 5
Number of equity transactions in 19981 0 0 0 0
Percent
Own:
Individual stock (net)2 45 52 58 63
Inside employer-sponsored retirement plans 21 23 17 6
Outside employer-sponsored retirement plans 35 43 51 59
Stock mutual funds (net)2 83 88 84 80
Inside employer-sponsored retirement plans 64 67 47 12
Outside employer-sponsored retirement plans 45 57 62 72
Year of first equity purchase:
Before 1990 18 57 73 72
1990 to 1995 43 28 18 15
1996 or later 39 15 9 13
Source of first equity purchase:
Inside employer-sponsored retirement plans 54 50 33 7
Outside employer-sponsored retirement plans 46 50 77 93
Type of equity first purchased:
Individual stock only 25 27 38 49
Stock mutual funds only 65 63 52 43
Both individual stock and stock mutual funds 10 10 10 8
Willing to take:
Substantial risk for substantial gain 15 9 4 4
Above-average risk for above-average gain 37 36 21 7
Average risk for average gain 39 46 57 55
Below-average risk for below-average gain 4 5 9 18
Unwilling to take any risk 4 4 9 16
1 See text footnote 14 on page 8 for the definition of an equity transaction.2 Multiple responses included.
Note: Number of respondents varies.
FIGURE 65
Equity Ownership Characteristics by Generation
Equity Ownership in America 75

Northeast Midwest South West
Median Age 48 years 47 years 47 years 45 years
Household income $60,000 $55,000 $56,000 $60,000
Household financial assets2 $107,000 $90,000 $80,000 $70,000
Percent Household investment decisionmaker:
Male 24 25 26 28
Female 24 21 19 17
Co-decisionmakers 52 54 55 55
Married 65 69 69 65
Living with a partner 8 4 4 6
Widowed 8 6 7 6
College or postgraduate degree 55 47 53 57
Completed graduate school 21 16 20 19
Employed 81 81 77 81
Spouse or partner employed3 78 75 70 73
Retired from lifetime occupation 20 20 24 20
Spouse or partner retired from lifetime occupation3 16 13 21 17
Non-equity investments held:4
Savings accounts, money market deposit accounts, or certificates of deposit 84 84 83 81
Bond investments (net)4 23 20 23 21
Individual bonds 10 7 11 8
Bond mutual funds 17 17 16 16
Fixed or variable annuities 20 24 21 21
Hybrid mutual funds 39 39 39 41
Money market mutual funds 25 26 26 29
Investment real estate 25 23 29 28
Have employer-sponsored retirement plan coverage (net)4 84 80 77 80
Traditional defined-benefit pension plan 48 42 35 34
401(k) plan 57 58 55 56
403(b) plan 10 10 7 7
State, local, or federal government plan 14 14 21 20
Other5 13 13 14 11
Have IRA (net)4 53 55 53 50
Traditional IRA 47 49 47 45
Roth IRA 12 11 10 12
Ethnic background:6
Caucasian 93 93 87 88
African-American 4 3 9 2
Asian 1 1 1 3
Hispanic 3 1 2 8
Other 1 2 2 3
1 Refers to the household’s responding financial decisionmaker for investments.2 Includes assets in employer-sponsored retirement plans but excludes value of primary residence.3 Percent of shareholders married or living with a partner.4 Multiple responses included.5 Other includes employee stock ownership plans (ESOPs) and SEP-IRAs.6 Multiple responses included because Hispanics can be of any race.
Note: Number of respondents varies.
FIGURE 66
Characteristics of Equity Owners by Region1
76 Equity Ownership in America

Northeast Midwest South West
Median
Household financial assets in equities $50,000 $49,000 $50,000 $45,500
Number of equities owned 5 4 4 4
Number of equity transactions in 19981 0 0 0 0
Percent
Own:
Individual stock (net)2 58 50 52 57
Inside employer-sponsored retirement plans 23 20 18 22
Outside employer-sponsored retirement plans 51 42 44 46
Stock mutual funds (net)2 82 87 86 84
Inside employer-sponsored retirement plans 57 60 58 58
Outside employer-sponsored retirement plans 52 60 57 56
Year of first equity purchase:
Before 1990 58 54 55 51
1990 to 1995 28 26 29 28
1996 or later 14 20 17 21
Source of first equity purchase:
Inside employer-sponsored retirement plans 62 44 45 45
Outside employer-sponsored retirement plans 38 56 55 55
Type of equity first purchased:
Individual stock only 36 27 30 30
Stock mutual funds only 54 62 59 59
Both individual stock and stock mutual funds 10 8 11 11
Willing to take:
Substantial risk for substantial gain 10 7 8 11
Above-average risk for above-average gain 27 34 29 32
Average risk for average gain 50 47 48 47
Below-average risk for below-average gain 7 6 8 5
Unwilling to take any risk 6 6 7 5
1 See text footnote 14 on page 8 for the definition of an equity transaction.2 Multiple responses included.
Note: Number of respondents varies.
FIGURE 67
Equity Ownership Characteristics by Region
Equity Ownership in America 77

APPENDIX D
Detailed Tabulations for Individual Stock Owners by Key Demographic Variables
Equity Ownership in America 79

80 Equity Ownership in America
Male is Sole Female is Sole Co-decision-Decisionmaker Decisionmaker makers
Median
Age 47 years 55 years 47 years
Household income $62,500 $45,000 $70,000
Household financial assets2 $133,000 $100,000 $120,000
Percent
Married 52 22 92
Living with a partner 4 7 5
Widowed 7 28 1
College or postgraduate degree 64 52 57
Completed graduate school 23 18 22
Employed 81 60 80
Spouse or partner employed3 59 85 72
Retired from lifetime occupation 25 34 21
Spouse or partner retired from lifetime occupation3 21 21 20
Non-equity investments held:4
Savings accounts, money market deposit accounts, or certificates of deposit 81 85 85
Bond investments (net)4 25 26 24
Individual bonds 14 11 11
Bond mutual funds 17 20 17
Fixed or variable annuities 18 31 23
Hybrid mutual funds 31 32 29
Money market mutual funds 37 32 40
Investment real estate 30 28 33
Have employer-sponsored retirement plan coverage (net)4 77 71 82
Traditional defined-benefit pension plan 41 37 43
401(k) plan 56 42 59
403(b) plan 5 11 9
State, local, or federal government plan 10 11 20
Other5 14 15 16
Have IRA (net)4 58 56 58
Traditional IRA 51 52 52
Roth IRA 14 11 12
Ethnic background:6
Caucasian 92 91 91
African-American 3 3 4
Asian 2 1 2
Hispanic 3 2 3
Other 3 4 3
1 Refers to the household’s responding financial decisionmaker for investments.2 Includes assets in employer-sponsored retirement plans but excludes value of primary residence.3 Percent of shareholders married or living with a partner.4 Multiple responses included.5 Other includes employee stock ownership plans (ESOPs) and SEP-IRAs.6 Multiple responses included because Hispanics can be of any race.
Note: Number of respondents varies.
FIGURE 68
Characteristics of Individual Stock Owners by Investment Decisionmaker1

Equity Ownership in America 81
Male is Sole Female is Sole Co-decision-Decisionmaker Decisionmaker makers
Median
Household financial assets in individual stock $40,000 $29,500 $30,000
Number of individual stocks owned 4 3 3
Number of individual stock transactions in 19981 1 0 0
Percent
Own:
Individual stock (net)2 100 100 100
Inside employer-sponsored retirement plans 40 27 41
Outside employer-sponsored retirement plans 87 87 84
Stock mutual funds (net)2 67 71 75
Inside employer-sponsored retirement plans 48 36 53
Outside employer-sponsored retirement plans 53 56 55
Year of first individual stock purchase:
Before 1990 60 59 59
1990 to 1995 26 25 22
1996 or later 14 16 19
Source of first individual stock purchase:
Inside employer-sponsored retirement plans 26 31 36
Outside employer-sponsored retirement plans 74 69 64
Type of equity first purchased:
Individual stock only 62 65 56
Stock mutual funds only 19 18 24
Both individual stock and stock mutual funds 19 17 20
Willing to take:
Substantial risk for substantial gain 14 6 7
Above-average risk for above-average gain 34 25 33
Average risk for average gain 42 55 46
Below-average risk for below-average gain 5 10 7
Unwilling to take any risk 5 4 7
1 See text footnote 14 on page 8 for the definition of an individual stock transaction.2 Multiple responses included.
Note: Number of respondents varies.
FIGURE 69
Individual Stock Ownership Characteristics by Investment Decisionmaker

Household IncomeLess than $50,000 to $100,000$50,000 $99,999 or More
Median Age 46 years 45 years 49 years
Household income $35,000 $65,000 $135,000
Household financial assets2 $55,000 $107,000 $320,000
Percent Household investment decisionmaker:
Male 31 28 31
Female 29 12 8
Co-decisionmakers 40 60 61
Married 46 75 85
Living with a partner 8 4 7
Widowed 14 4 1
College or postgraduate degree 41 62 75
Completed graduate school 11 22 38
Employed 70 87 86
Spouse or partner employed3 58 77 71
Retired from lifetime occupation 29 16 13
Spouse or partner retired from lifetime occupation3 27 15 16
Non-equity investments held:4
Savings accounts, money market deposit accounts, or certificates of deposit 79 82 86
Bond investments (net)4 16 21 31
Individual bonds 6 10 18
Bond mutual funds 11 15 21
Fixed or variable annuities 16 19 26
Hybrid mutual funds 25 42 44
Money market mutual funds 24 27 39
Investment real estate 24 27 42
Have employer-sponsored retirement plan coverage (net)4 68 85 83
Traditional defined-benefit pension plan 34 43 45
401(k) plan 43 65 65
403(b) plan 5 8 12
State, local, or federal government plan 15 19 15
Other5 12 17 21
Have IRA (net)4 40 59 71
Traditional IRA 36 52 67
Roth IRA 6 15 16
Ethnic background:6
Caucasian 90 91 92
African-American 3 4 3
Asian 1 1 3
Hispanic 2 3 1
Other 4 2 2
1 Refers to the household’s responding financial decisionmaker for investments.2 Includes assets in employer-sponsored retirement plans but excludes value of primary residence.3 Percent of shareholders married or living with a partner.4 Multiple responses included.5 Other includes employee stock ownership plans (ESOPs) and SEP-IRAs.6 Multiple responses included because Hispanics can be of any race.
Note: Number of respondents varies.
FIGURE 70
Characteristics of Individual Stock Owners by Household Income1
82 Equity Ownership in America

Equity Ownership in America 83
Household IncomeLess than $50,000 to $100,000$50,000 $99,999 or More
Median
Household financial assets in individual stock $12,500 $28,500 $99,700
Number of individual stocks owned 2 3 5
Number of individual stock transactions in 19981 0 1 3
Percent
Own:
Individual stock (net)2 100 100 100
Inside employer-sponsored retirement plans 35 40 43
Outside employer-sponsored retirement plans 79 86 91
Stock mutual funds (net)2 55 79 83
Inside employer-sponsored retirement plans 28 59 64
Outside employer-sponsored retirement plans 43 56 64
Year of first individual stock purchase:
Before 1990 52 54 68
1990 to 1995 25 29 19
1996 or later 23 17 13
Source of first individual stock purchase:
Inside employer-sponsored retirement plans 30 37 34
Outside employer-sponsored retirement plans 70 63 66
Type of equity first purchased:
Individual stock only 72 53 54
Stock mutual funds only 14 26 31
Both individual stock and stock mutual funds 14 21 15
Willing to take:
Substantial risk for substantial gain 8 12 10
Above-average risk for above-average gain 28 36 43
Average risk for average gain 47 44 42
Below-average risk for below-average gain 8 6 4
Unwilling to take any risk 9 2 1
1 See text footnote 14 on page 8 for the definition of an individual stock transaction.2 Multiple responses included.
Note: Number of respondents varies.
FIGURE 71
Individual Stock Ownership Characteristics by Household Income

Household Financial AssetsLess than $25,000 to $100,000 $500,000$25,000 $99,999 or $499,999 or More
Median Age 35 years 39 years 48 years 57 years
Household income $40,000 $60,000 $70,000 $100,000
Household financial assets2 $10,500 $55,000 $200,000 $850,000
Percent Household investment decisionmaker:
Male 24 30 31 43
Female 22 15 17 11
Co-decisionmakers 54 55 52 46
Married 55 70 70 77
Living with a partner 11 4 3 6
Widowed 3 5 5 9
College or postgraduate degree 45 55 67 70
Completed graduate school 9 15 30 36
Employed 88 91 79 66
Spouse or partner employed3 78 80 75 49
Retired from lifetime occupation 10 12 20 40
Spouse or partner retired from lifetime occupation3 19 9 13 31
Non-equity investments held:4
Savings accounts, money market deposit accounts, or certificates of deposit 87 84 80 84
Bond investments (net)4 11 10 24 42
Individual bonds 3 3 11 26
Bond mutual funds 9 8 16 30
Fixed or variable annuities 12 14 25 26
Hybrid mutual funds 24 36 41 47
Money market mutual funds 14 24 38 44
Investment real estate 8 23 34 59
Have employer-sponsored retirement plan coverage (net)4 69 86 84 71
Traditional defined-benefit pension plan 26 42 47 36
401(k) plan 55 69 60 46
403(b) plan 5 7 9 8
State, local, or federal government plan 14 15 17 16
Other5 16 17 18 15
Have IRA (net)4 34 50 67 71
Traditional IRA 28 46 59 69
Roth IRA 7 11 17 14
Ethnic background:6
Caucasian 85 91 92 96
African-American 4 5 3 1
Asian 3 0 2 2
Hispanic 7 1 2 0
Other 4 4 2 2
1 Refers to the household’s responding financial decisionmaker for investments.2 Includes assets in employer-sponsored retirement plans but excludes value of primary residence.3 Percent of shareholders married or living with a partner.4 Multiple responses included.5 Other includes employee stock ownership plans (ESOPs) and SEP-IRAs.6 Multiple responses included because Hispanics can be of any race.
Note: Number of respondents varies.
FIGURE 72
Characteristics of Individual Stock Owners by Household Financial Assets1
84 Equity Ownership in America

Household Financial AssetsLess than $25,000 to $100,000 $500,000$25,000 $99,999 or $499,999 or More
Median
Household financial assets in individual stock $4,400 $18,500 $60,000 $298,000
Number of individual stocks owned 1 2 4 8
Number of individual stock transactions in 19981 0 0 1 4
Percent
Own:
Individual stock (net)2 100 100 100 100
Inside employer-sponsored retirement plans 46 47 33 38
Outside employer-sponsored retirement plans 68 79 94 91
Stock mutual funds (net)2 46 71 83 75
Inside employer-sponsored retirement plans 33 57 56 47
Outside employer-sponsored retirement plans 32 47 65 65
Year of first individual stock purchase:
Before 1990 30 47 64 79
1990 to 1995 28 36 23 13
1996 or later 42 17 13 8
Source of first individual stock purchase:
Inside employer-sponsored retirement plans 46 42 31 21
Outside employer-sponsored retirement plans 54 58 69 79
Type of equity first purchased:
Individual stock only 70 57 52 64
Stock mutual funds only 13 22 31 21
Both individual stock and stock mutual funds 17 21 17 15
Willing to take:
Substantial risk for substantial gain 13 12 7 9
Above-average risk for above-average gain 37 32 39 36
Average risk for average gain 40 44 44 47
Below-average risk for below-average gain 3 7 7 6
Unwilling to take any risk 7 5 3 2
1 See text footnote 14 on page 8 for the definition of an individual stock transaction.2 Multiple responses included.
Note: Number of respondents varies.
FIGURE 73
Individual Stock Ownership Characteristics by Household Financial Assets
Equity Ownership in America 85

Baby Boom Silent GIGeneration X Generation Generation Generation
(ages 19 to 35) (ages 36 to 54) (ages 55 to 74) (ages 75 or older)
Median Age 29 years 44 years 61 years 79 years
Household income $50,000 $70,000 $60,000 $34,000
Household financial assets2 $32,000 $120,000 $300,000 $357,000
Percent Household investment decisionmaker:
Male 31 29 27 30
Female 10 13 22 34
Co-decisionmakers 59 58 50 36
Married 59 74 70 55
Living with a partner 13 5 2 0
Widowed 1 1 14 34
College or postgraduate degree 59 63 51 56
Completed graduate school 11 24 23 19
Employed 95 93 56 15
Spouse or partner employed3 81 83 53 20
Retired from lifetime occupation 2 6 50 90
Spouse or partner retired from lifetime occupation3 3 7 40 77
Non-equity investments held:4
Savings accounts, money market deposit accounts, or certificates of deposit 81 85 82 87
Bond investments (net)4 13 24 27 44
Individual bonds 5 11 14 31
Bond mutual funds 9 17 20 25
Fixed or variable annuities 12 19 30 37
Hybrid mutual funds 30 40 40 25
Money market mutual funds 19 31 33 31
Investment real estate 20 32 39 26
Have employer-sponsored retirement plan coverage (net)4 84 85 71 49
Traditional defined-benefit pension plan 31 45 42 39
401(k) plan 71 68 38 13
403(b) plan 3 11 6 5
State, local, or federal government plan 13 18 16 13
Other5 19 19 12 2
Have IRA (net)4 41 58 69 42
Traditional IRA 32 51 66 42
Roth IRA 13 15 10 1
Ethnic background:6
Caucasian 85 89 96 97
African-American 6 4 2 0
Asian 3 2 1 3
Hispanic 4 4 1 0
Other 2 4 1 0
1 Refers to the household’s responding financial decisionmaker for investments.2 Includes assets in employer-sponsored retirement plans but excludes value of primary residence.3 Percent of shareholders married or living with a partner.4 Multiple responses included.5 Other includes employee stock ownership plans (ESOPs) and SEP-IRAs.6 Multiple responses included because Hispanics can be of any race.
Note: Number of respondents varies.
FIGURE 74
Characteristics of Individual Stock Owners by Generation1
86 Equity Ownership in America
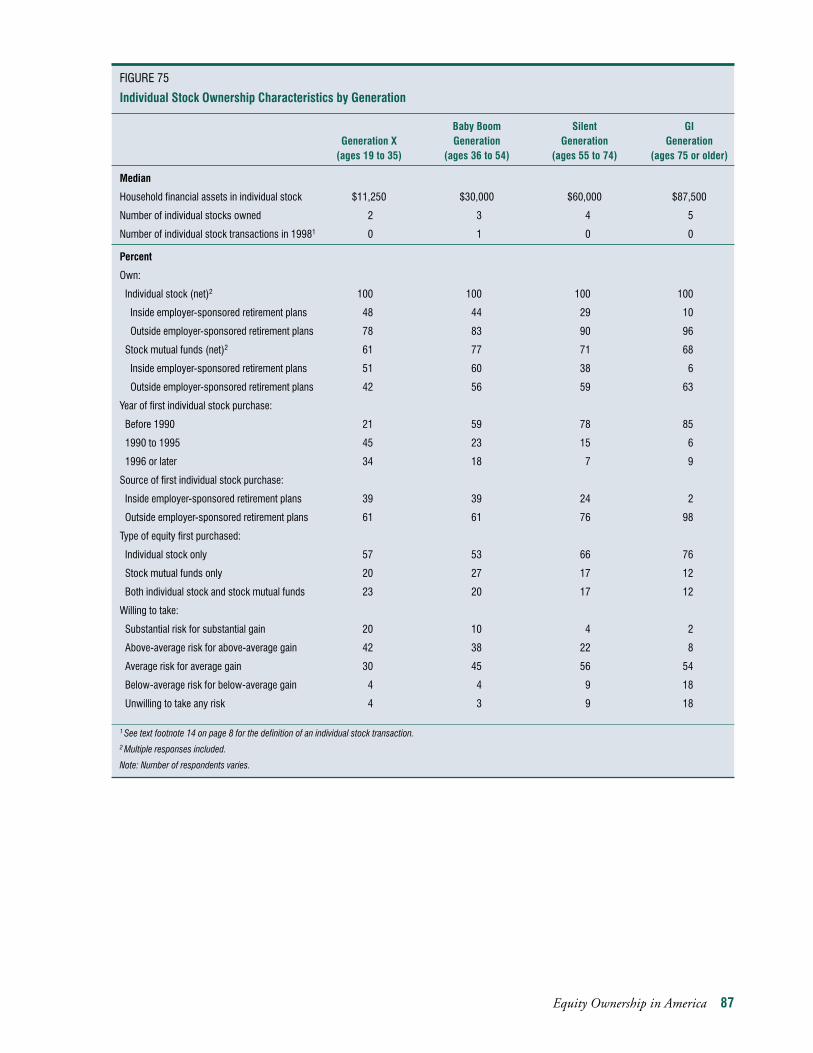
Baby Boom Silent GIGeneration X Generation Generation Generation
(ages 19 to 35) (ages 36 to 54) (ages 55 to 74) (ages 75 or older)
Median
Household financial assets in individual stock $11,250 $30,000 $60,000 $87,500
Number of individual stocks owned 2 3 4 5
Number of individual stock transactions in 19981 0 1 0 0
Percent
Own:
Individual stock (net)2 100 100 100 100
Inside employer-sponsored retirement plans 48 44 29 10
Outside employer-sponsored retirement plans 78 83 90 96
Stock mutual funds (net)2 61 77 71 68
Inside employer-sponsored retirement plans 51 60 38 6
Outside employer-sponsored retirement plans 42 56 59 63
Year of first individual stock purchase:
Before 1990 21 59 78 85
1990 to 1995 45 23 15 6
1996 or later 34 18 7 9
Source of first individual stock purchase:
Inside employer-sponsored retirement plans 39 39 24 2
Outside employer-sponsored retirement plans 61 61 76 98
Type of equity first purchased:
Individual stock only 57 53 66 76
Stock mutual funds only 20 27 17 12
Both individual stock and stock mutual funds 23 20 17 12
Willing to take:
Substantial risk for substantial gain 20 10 4 2
Above-average risk for above-average gain 42 38 22 8
Average risk for average gain 30 45 56 54
Below-average risk for below-average gain 4 4 9 18
Unwilling to take any risk 4 3 9 18
1 See text footnote 14 on page 8 for the definition of an individual stock transaction.2 Multiple responses included.
Note: Number of respondents varies.
FIGURE 75
Individual Stock Ownership Characteristics by Generation
Equity Ownership in America 87
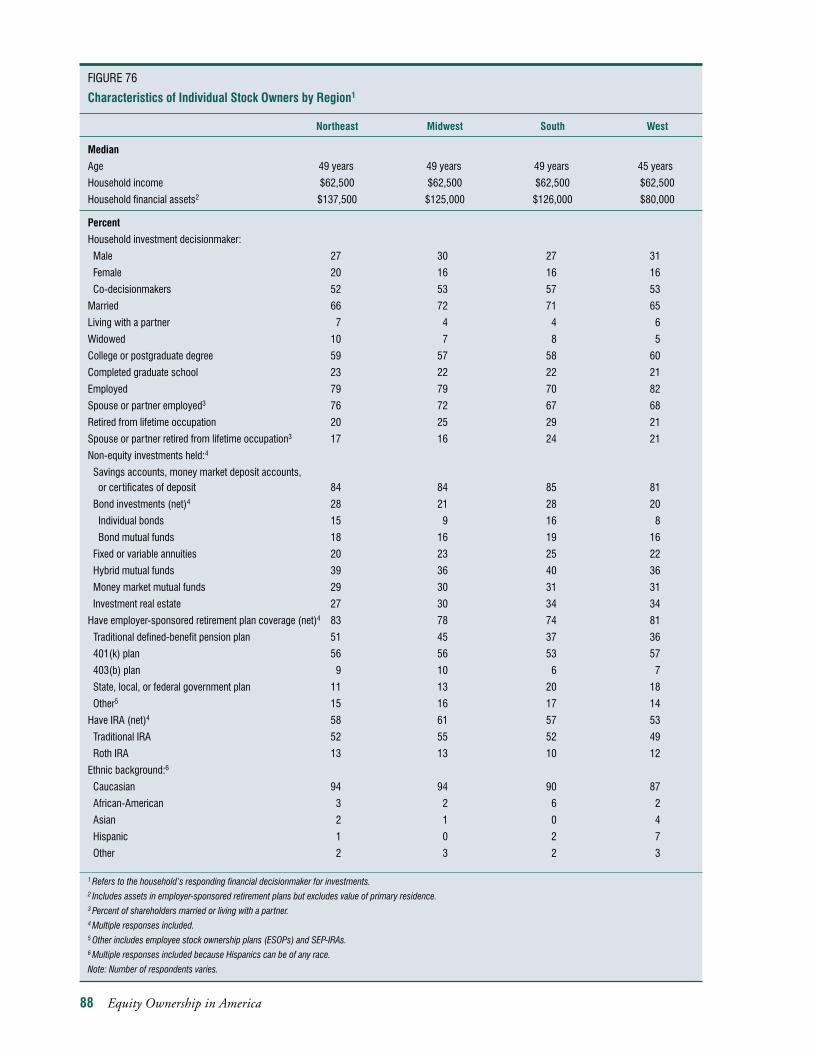
Northeast Midwest South West
Median
Age 49 years 49 years 49 years 45 years
Household income $62,500 $62,500 $62,500 $62,500
Household financial assets2 $137,500 $125,000 $126,000 $80,000
Percent
Household investment decisionmaker:
Male 27 30 27 31
Female 20 16 16 16
Co-decisionmakers 52 53 57 53
Married 66 72 71 65
Living with a partner 7 4 4 6
Widowed 10 7 8 5
College or postgraduate degree 59 57 58 60
Completed graduate school 23 22 22 21
Employed 79 79 70 82
Spouse or partner employed3 76 72 67 68
Retired from lifetime occupation 20 25 29 21
Spouse or partner retired from lifetime occupation3 17 16 24 21
Non-equity investments held:4
Savings accounts, money market deposit accounts, or certificates of deposit 84 84 85 81
Bond investments (net)4 28 21 28 20
Individual bonds 15 9 16 8
Bond mutual funds 18 16 19 16
Fixed or variable annuities 20 23 25 22
Hybrid mutual funds 39 36 40 36
Money market mutual funds 29 30 31 31
Investment real estate 27 30 34 34
Have employer-sponsored retirement plan coverage (net)4 83 78 74 81
Traditional defined-benefit pension plan 51 45 37 36
401(k) plan 56 56 53 57
403(b) plan 9 10 6 7
State, local, or federal government plan 11 13 20 18
Other5 15 16 17 14
Have IRA (net)4 58 61 57 53
Traditional IRA 52 55 52 49
Roth IRA 13 13 10 12
Ethnic background:6
Caucasian 94 94 90 87
African-American 3 2 6 2
Asian 2 1 0 4
Hispanic 1 0 2 7
Other 2 3 2 3
1 Refers to the household’s responding financial decisionmaker for investments.2 Includes assets in employer-sponsored retirement plans but excludes value of primary residence.3 Percent of shareholders married or living with a partner.4 Multiple responses included.5 Other includes employee stock ownership plans (ESOPs) and SEP-IRAs.6 Multiple responses included because Hispanics can be of any race.
Note: Number of respondents varies.
FIGURE 76
Characteristics of Individual Stock Owners by Region1
88 Equity Ownership in America

Northeast Midwest South West
Median
Household financial assets in individual stock $30,000 $32,800 $30,000 $25,100
Number of individual stocks owned 4 3 3 3
Number of individual stock transactions in 19981 1 0 0 1
Percent
Own:
Individual stock (net)2 100 100 100 100
Inside employer-sponsored retirement plans 39 40 35 40
Outside employer-sponsored retirement plans 88 86 86 82
Stock mutual funds (net)2 69 73 73 71
Inside employer-sponsored retirement plans 45 52 48 51
Outside employer-sponsored retirement plans 52 59 55 54
Year of first individual stock purchase:
Before 1990 63 64 59 53
1990 to 1995 21 23 27 23
1996 or later 16 13 14 24
Source of first individual stock purchase:
Inside employer-sponsored retirement plans 29 35 30 34
Outside employer-sponsored retirement plans 71 65 70 66
Type of equity first purchased:
Individual stock only 63 60 59 55
Stock mutual funds only 19 24 19 25
Both individual stock and stock mutual funds 18 16 22 20
Willing to take:
Substantial risk for substantial gain 9 8 8 12
Above-average risk for above-average gain 30 34 30 34
Average risk for average gain 47 46 49 43
Below-average risk for below-average gain 8 6 7 5
Unwilling to take any risk 6 6 6 6
1 See text footnote 14 on page 8 for the definition of an individual stock transaction.2 Multiple responses included.
Note: Number of respondents varies.
FIGURE 77
Individual Stock Ownership Characteristics by Region
Equity Ownership in America 89

APPENDIX E
Detailed Tabulations for Stock Mutual Fund Shareholders by Key Demographic Variables
Equity Ownership in America 91

92 Equity Ownership in America
Male is Sole Female is Sole Co-decision-Decisionmaker Decisionmaker makers
Median
Age 46 years 50 years 46 years
Household income $59,000 $38,000 $65,000
Household financial assets2 $100,000 $60,000 $90,000
Percent
Married 51 20 93
Living with a partner 4 6 5
Widowed 5 23 1
College or postgraduate degree 61 49 51
Completed graduate school 24 16 18
Employed 83 70 84
Spouse or partner employed3 59 80 78
Retired from lifetime occupation 21 28 17
Spouse or partner retired from lifetime occupation3 19 24 15
Non-equity investments held:4
Savings accounts, money market deposit accounts, or certificates of deposit 79 85 84
Bond investments (net)4 24 26 22
Individual bonds 11 9 8
Bond mutual funds 18 22 18
Fixed or variable annuities 18 28 22
Hybrid mutual funds 29 29 29
Money market mutual funds 47 42 44
Investment real estate 27 21 29
Have employer-sponsored retirement plan coverage (net)4 79 78 85
Traditional defined-benefit pension plan 36 34 43
401(k) plan 57 50 63
403(b) plan 6 10 10
State, local, or federal government plan 13 15 22
Other5 12 14 13
Have IRA (net)4 57 50 57
Traditional IRA 51 46 51
Roth IRA 14 11 12
Ethnic background:6
Caucasian 91 88 90
African-American 3 8 5
Asian 2 0 2
Hispanic 3 2 4
Other 3 2 2
1 Refers to the household’s responding financial decisionmaker for investments.2 Includes assets in employer-sponsored retirement plans but excludes value of primary residence.3 Percent of shareholders married or living with a partner.4 Multiple responses included.5 Other includes employee stock ownership plans (ESOPs) and SEP-IRAs.6 Multiple responses included because Hispanics can be of any race.
Note: Number of respondents varies.
FIGURE 78
Characteristics of Stock Mutual Fund Shareholders by Investment Decisionmaker1

Male is Sole Female is Sole Co-decision-Decisionmaker Decisionmaker makers
Median
Household financial assets in stock mutual funds $40,000 $30,000 $38,000
Number of stock mutual funds owned 4 3 4
Number of stock mutual fund transactions in 19981 0 0 0
Percent
Own:
Individual stock (net)2 49 38 46
Inside employer-sponsored retirement plans 19 10 17
Outside employer-sponsored retirement plans 43 34 40
Stock mutual funds (net)2 100 100 100
Inside employer-sponsored retirement plans 69 58 72
Outside employer-sponsored retirement plans 70 69 65
Year of first stock mutual fund purchase:
Before 1990 48 40 50
1990 to 1995 32 30 33
1996 or later 20 30 17
Source of first stock mutual fund purchase:
Inside employer-sponsored retirement plans 40 44 50
Outside employer-sponsored retirement plans 60 56 50
Type of equity first purchased:
Individual stock only 20 17 18
Stock mutual funds only 66 74 70
Both individual stock and stock mutual funds 14 9 12
Willing to take:
Substantial risk for substantial gain 14 6 8
Above-average risk for above-average gain 35 26 33
Average risk for average gain 44 56 48
Below-average risk for below-average gain 4 7 6
Unwilling to take any risk 3 5 5
1 See text footnote 14 on page 8 for the definition of a stock mutual fund transaction.2 Multiple responses included.
Note: Number of respondents varies.
FIGURE 79
Stock Mutual Fund Ownership Characteristics by Investment Decisionmaker
Equity Ownership in America 93

Household IncomeLess than $50,000 to $100,000$50,000 $99,999 or More
Median Age 46 years 44 years 48 years
Household income $34,000 $65,000 $125,000
Household financial assets2 $42,500 $90,000 $300,000
Percent Household investment decisionmaker:
Male 26 25 27
Female 33 12 7
Co-decisionmakers 40 63 66
Married 44 78 88
Living with a partner 6 5 5
Widowed 11 2 1
College or postgraduate degree 38 55 76
Completed graduate school 11 19 36
Employed 75 88 88
Spouse or partner employed3 63 80 76
Retired from lifetime occupation 23 16 13
Spouse or partner retired from lifetime occupation3 25 12 13
Non-equity investments held:4
Savings accounts, money market deposit accounts, or certificates of deposit 80 83 86
Bond investments (net)4 17 20 32
Individual bonds 4 7 15
Bond mutual funds 14 16 24
Fixed or variable annuities 19 20 25
Hybrid mutual funds 22 27 41
Money market mutual funds 39 46 49
Investment real estate 18 26 40
Have employer-sponsored retirement plan coverage (net)4 76 88 86
Traditional defined-benefit pension plan 29 45 47
401(k) plan 48 67 65
403(b) plan 8 8 14
457 plan 17 22 19
Other5 11 13 20
Have IRA (net)4 45 56 69
Traditional IRA 39 50 65
Roth IRA 10 13 17
Ethnic background:6
Caucasian 91 88 91
African-American 4 5 4
Asian 1 2 3
Hispanic 2 5 3
Other 2 3 1
1 Refers to the household’s responding financial decisionmaker for investments.2 Includes assets in employer-sponsored retirement plans but excludes value of primary residence.3 Percent of shareholders married or living with a partner.4 Multiple responses included.5 Other includes employee stock ownership plans (ESOPs) and SEP-IRAs.6 Multiple responses included because Hispanics can be of any race.
Note: Number of respondents varies.
FIGURE 80
Characteristics of Stock Mutual Fund Shareholders by Household Income1
94 Equity Ownership in America

Household IncomeLess than $50,000 to $100,000$50,000 $99,999 or More
Median Household financial assets in stock mutual funds $20,000 $40,000 $101,000
Number of stock mutual funds owned 3 3 6
Number of stock mutual fund transactions in 19981 0 0 1
Percent Own:
Individual stock (net)2 30 46 63
Inside employer-sponsored retirement plans 8 17 26
Outside employer-sponsored retirement plans 25 41 58
Stock mutual funds (net)2 100 100 100
Inside employer-sponsored retirement plans 61 74 78
Outside employer-sponsored retirement plans 64 62 74
Year of first stock mutual fund purchase:
Before 1990 34 44 63
1990 to 1995 33 38 29
1996 or later 33 18 8
Source of first stock mutual fund purchase:
Inside employer-sponsored retirement plans 46 50 44
Outside employer-sponsored retirement plans 54 50 56
Type of equity first purchased:
Individual stock only 13 18 27
Stock mutual funds only 80 70 62
Both individual stock and stock mutual funds 7 12 11
Willing to take:
Substantial risk for substantial gain 7 12 9
Above-average risk for above-average gain 27 34 45
Average risk for average gain 53 46 40
Below-average risk for below-average gain 8 5 4
Unwilling to take any risk 5 3 2
1 See text footnote 14 on page 8 for the definition of a stock mutual fund transaction.
2 Multiple responses included.
Note: Number of respondents varies.
FIGURE 81
Stock Mutual Fund Ownership Characteristics by Household Income
Equity Ownership in America 95
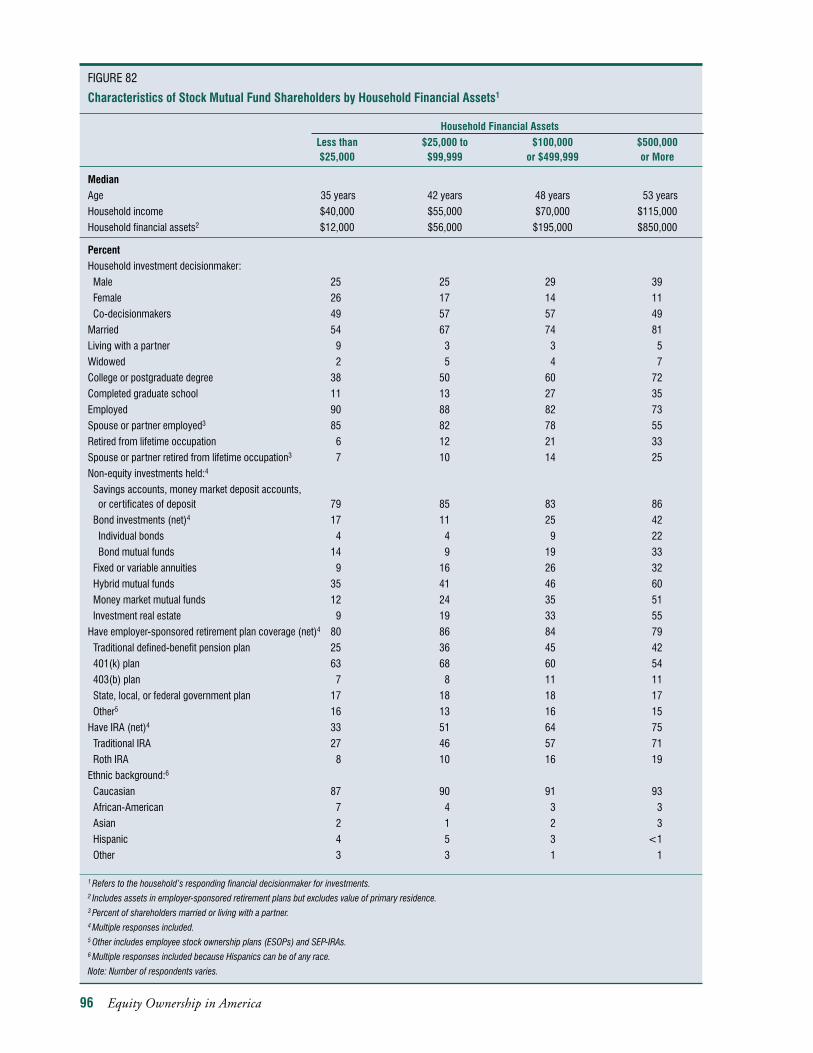
Household Financial AssetsLess than $25,000 to $100,000 $500,000$25,000 $99,999 or $499,999 or More
Median Age 35 years 42 years 48 years 53 years
Household income $40,000 $55,000 $70,000 $115,000
Household financial assets2 $12,000 $56,000 $195,000 $850,000
Percent Household investment decisionmaker:
Male 25 25 29 39
Female 26 17 14 11
Co-decisionmakers 49 57 57 49
Married 54 67 74 81
Living with a partner 9 3 3 5
Widowed 2 5 4 7
College or postgraduate degree 38 50 60 72
Completed graduate school 11 13 27 35
Employed 90 88 82 73
Spouse or partner employed3 85 82 78 55
Retired from lifetime occupation 6 12 21 33
Spouse or partner retired from lifetime occupation3 7 10 14 25
Non-equity investments held:4
Savings accounts, money market deposit accounts, or certificates of deposit 79 85 83 86
Bond investments (net)4 17 11 25 42
Individual bonds 4 4 9 22
Bond mutual funds 14 9 19 33
Fixed or variable annuities 9 16 26 32
Hybrid mutual funds 35 41 46 60
Money market mutual funds 12 24 35 51
Investment real estate 9 19 33 55
Have employer-sponsored retirement plan coverage (net)4 80 86 84 79
Traditional defined-benefit pension plan 25 36 45 42
401(k) plan 63 68 60 54
403(b) plan 7 8 11 11
State, local, or federal government plan 17 18 18 17
Other5 16 13 16 15
Have IRA (net)4 33 51 64 75
Traditional IRA 27 46 57 71
Roth IRA 8 10 16 19
Ethnic background:6
Caucasian 87 90 91 93
African-American 7 4 3 3
Asian 2 1 2 3
Hispanic 4 5 3 <1
Other 3 3 1 1
1 Refers to the household’s responding financial decisionmaker for investments.2 Includes assets in employer-sponsored retirement plans but excludes value of primary residence.3 Percent of shareholders married or living with a partner.4 Multiple responses included.5 Other includes employee stock ownership plans (ESOPs) and SEP-IRAs.6 Multiple responses included because Hispanics can be of any race.
Note: Number of respondents varies.
FIGURE 82
Characteristics of Stock Mutual Fund Shareholders by Household Financial Assets1
96 Equity Ownership in America

Equity Ownership in America 97
Household Financial AssetsLess than $25,000 to $100,000 $500,000$25,000 $99,999 or $499,999 or More
Median Household financial assets in stock mutual funds $7,500 $27,900 $78,000 $203,000
Number of stock mutual funds owned 2 3 4 7
Number of stock mutual fund transactions in 19981 0 0 0 1
Percent Own:
Individual stock (net)2 21 38 54 74
Inside employer-sponsored retirement plans 8 15 18 28
Outside employer-sponsored retirement plans 16 32 51 66
Stock mutual funds (net)2 100 100 100 100
Inside employer-sponsored retirement plans 72 78 69 65
Outside employer-sponsored retirement plans 51 57 72 86
Year of first stock mutual fund purchase:
Before 1990 15 39 60 77
1990 to 1995 36 41 30 15
1996 or later 49 20 10 8
Source of first stock mutual fund purchase:
Inside employer-sponsored retirement plans 60 55 42 29
Outside employer-sponsored retirement plans 40 45 58 71
Type of equity first purchased:
Individual stock only 6 15 23 37
Stock mutual funds only 86 74 67 48
Both individual stock and stock mutual funds 8 11 10 15
Willing to take:
Substantial risk for substantial gain 13 11 8 6
Above-average risk for above-average gain 36 30 37 38
Average risk for average gain 44 48 46 49
Below-average risk for below-average gain 5 6 6 4
Unwilling to take any risk 2 5 2 3
1 See text footnote 14 on page 8 for the definition of a stock mutual fund transaction.
2 Multiple responses included.
Note: Number of respondents varies.
FIGURE 83
Stock Mutual Fund Ownership Characteristics by Household Financial Assets

Baby Boom Silent GIGeneration X Generation Generation Generation
(ages 19 to 35) (ages 36 to 54) (ages 55 to 74) (ages 75 or older)
Median Age 29 years 44 years 61 years 78 years
Household income $50,000 $64,000 $58,000 $30,000
Household financial assets2 $29,000 $90,000 $210,000 $175,000
Percent Household investment decisionmaker:
Male 28 24 23 30
Female 16 17 23 42
Co-decisionmakers 56 59 53 29
Married 59 72 71 47
Living with a partner 11 4 2 0
Widowed 1 1 12 43
College or postgraduate degree 54 56 48 51
Completed graduate school 11 21 23 14
Employed 96 95 58 13
Spouse or partner employed3 85 86 54 14
Retired from lifetime occupation 1 4 49 88
Spouse or partner retired from lifetime occupation3 1 5 38 79
Non-equity investments held:4
Savings accounts, money market deposit accounts, or certificates of deposit 83 84 83 86
Bond investments (net)4 16 22 27 47
Individual bonds 4 8 11 24
Bond mutual funds 12 17 22 34
Fixed or variable annuities 10 20 32 37
Hybrid mutual funds 37 45 48 44
Money market mutual funds 20 28 35 33
Investment real estate 16 26 35 22
Have employer-sponsored retirement plan coverage (net)4 86 88 74 49
Traditional defined-benefit pension plan 30 42 41 38
401(k) plan 70 69 40 10
403(b) plan 7 10 9 4
State, local, or federal government plan 17 21 17 11
Other5 15 15 10 4
Have IRA (net)4 41 55 70 42
Traditional IRA 29 49 67 42
Roth IRA 14 14 11 1
Ethnic background:6
Caucasian 84 88 95 96
African-American 8 5 3 2
Asian 3 1 1 2
Hispanic 6 4 2 1
Other 2 2 1 0
1 Refers to the household’s responding financial decisionmaker for investments.2 Includes assets in employer-sponsored retirement plans but excludes value of primary residence.3 Percent of shareholders married or living with a partner.4 Multiple responses included.5 Other includes employee stock ownership plans (ESOPs) and SEP-IRAs.6 Multiple responses included because Hispanics can be of any race.
Note: Number of respondents varies.
FIGURE 84
Characteristics of Stock Mutual Fund Shareholders by Generation1
98 Equity Ownership in America

Baby Boom Silent GIGeneration X Generation Generation Generation
(ages 19 to 35) (ages 36 to 54) (ages 55 to 74) (ages 75 or older)
Median Household financial assets in stock mutual funds $20,000 $40,000 $60,000 $35,000
Number of stock mutual funds owned 3 4 3 2
Number of stock mutual fund transactions in 19981 0 0 0 0
Percent Own:
Individual stock (net)2 33 45 50 54
Inside employer-sponsored retirement plans 14 18 14 7
Outside employer-sponsored retirement plans 28 40 45 49
Stock mutual funds (net)2 100 100 100 100
Inside employer-sponsored retirement plans 77 76 56 15
Outside employer-sponsored retirement plans 55 65 74 92
Year of first stock mutual fund purchase:
Before 1990 14 51 64 61
1990 to 1995 45 32 23 23
1996 or later 41 17 13 16
Source of first stock mutual fund purchase:
Inside employer-sponsored retirement plans 56 51 36 10
Outside employer-sponsored retirement plans 44 49 64 90
Type of equity first purchased:
Individual stock only 9 17 25 32
Stock mutual funds only 79 72 63 57
Both individual stock and stock mutual funds 12 11 12 11
Willing to take:
Substantial risk for substantial gain 16 9 5 5
Above-average risk for above-average gain 39 37 22 8
Average risk for average gain 39 46 57 58
Below-average risk for below-average gain 3 5 8 17
Unwilling to take any risk 3 3 8 12
1 See text footnote 14 on page 8 for the definition of a stock mutual fund transaction.
2 Multiple responses included.
Note: Number of respondents varies.
FIGURE 85
Stock Mutual Fund Ownership Characteristics by Generation
Equity Ownership in America 99

Northeast Midwest South West
Median
Age 48 years 47 years 47 years 45 years
Household income $62,000 $56,000 $60,000 $63,000
Household financial assets2 $107,000 $90,000 $85,000 $77,500
Percent
Household investment decisionmaker:
Male 23 23 25 27
Female 24 22 20 16
Co-decisionmakers 53 55 55 57
Married 66 69 70 66
Living with a partner 8 4 4 6
Widowed 7 6 6 6
College or postgraduate degree 56 46 54 58
Completed graduate school 22 16 20 19
Employed 82 82 79 81
Spouse or partner employed3 78 76 71 75
Retired from lifetime occupation 20 20 22 19
Spouse or partner retired from lifetime occupation3 16 13 19 15
Non-equity investments held:4
Savings accounts, money market deposit accounts, or certificates of deposit 84 84 83 82
Bond investments (net)4 25 22 24 23
Individual bonds 11 6 11 8
Bond mutual funds 19 19 18 19
Fixed or variable annuities 21 24 21 22
Hybrid mutual funds 44 43 43 48
Money market mutual funds 27 29 27 32
Investment real estate 26 23 30 28
Have employer-sponsored retirement plan coverage(net)4 86 83 79 82
Traditional defined-benefit pension plan 48 44 36 34
401(k) plan 59 60 57 59
403(b) plan 11 11 7 7
State, local, or federal government plan 15 14 22 21
Other5 12 13 14 12
Have IRA (net)4 55 57 56 55
Traditional IRA 50 51 49 49
Roth IRA 13 12 11 14
Ethnic background:6
Caucasian 93 93 87 88
African-American 4 3 9 2
Asian 1 1 1 3
Hispanic 3 1 2 8
Other 1 2 2 3
1 Refers to the household’s responding financial decisionmaker for investments.2 Includes assets in employer-sponsored retirement plans but excludes value of primary residence.3 Percent of shareholders married or living with a partner.4 Multiple responses included.5 Other includes employee stock ownership plans (ESOPs) and SEP-IRAs.6 Multiple responses included because Hispanics can be of any race.
Note: Number of respondents varies.
100 Equity Ownership in America
FIGURE 86
Characteristics of Stock Mutual Fund Shareholders by Region1

Equity Ownership in America 101
Northeast Midwest South West
Median
Household financial assets in stock mutual funds $38,000 $38,000 $35,000 $36,100
Number of stock mutual funds owned 4 3 3 3
Number of stock mutual fund transactions in 19981 0 0 0 0
Percent
Own:
Individual stock (net)2 49 42 44 48
Inside employer-sponsored retirement plans 18 15 15 18
Outside employer-sponsored retirement plans 44 27 39 41
Stock mutual funds (net)2 100 100 100 100
Inside employer-sponsored retirement plans 70 69 67 69
Outside employer-sponsored retirement plans 63 69 66 67
Year of first stock mutual fund purchase:
Before 1990 53 47 48 44
1990 to 1995 30 31 32 34
1996 or later 17 22 20 22
Source of first stock mutual fund purchase:
Inside employer-sponsored retirement plans 46 45 47 47
Outside employer-sponsored retirement plans 54 55 53 53
Type of equity first purchased:
Individual stock only 22 18 18 17
Stock mutual funds only 66 72 69 70
Both individual stock and stock mutual funds 12 10 13 13
Willing to take:
Substantial risk for substantial gain 10 7 8 10
Above-average risk for above-average gain 28 34 29 35
Average risk for average gain 50 48 50 46
Below-average risk for below-average gain 6 6 7 5
Unwilling to take any risk 6 5 6 4
1 See text footnote 14 on page 8 for the definition of a stock mutual fund transaction.2 Multiple responses included.
Note: Number of respondents varies.
FIGURE 87
Stock Mutual Fund Ownership Characteristics by Region

120 BroadwayNew York, NY 10271-0080212/608-1500 Fax: 212/608-16041401 Eye Street, NWWashington, DC 20005-2225202/296-9410www.sia.com
1401 H Street, NWSuite 1200Washington, DC 20005-2148
202/326-5800www.ici.org
Securities Industry AssociationINVESTMENTCOMPANYINSTITUTE®