equity investments of norway´s gpfg: a european … and spend only the real profitability deriving...
TRANSCRIPT

Equity investments
wealth fund for Europe
Javier Capapé
PhD Candidate, ESADE Business School and Researcher, ESADEgeo-Center for Global Economy and Geopolitics
Tomás Guerrero
PhD Candidate, Universidad Carlos III and Researcher, ESADEgeo-Center for Global Economy and Geopolitics
orway´s GPFG:A European sovereign of N
Sovereign Wealth Funds 2014 Equity investments of the Norway’s GPFG: A European sovereign wealth fund for Europe
49

Sovereign Wealth Funds 2014 Equity investments of the Norway’s GPFG: A European sovereign wealth fund for Europe50
5. Equity investments of the Norway’s GPFG: A European sovereign wealth fund for Europe
The Norway Government Pension Fund Global (GPFG) is the World’s
biggest sovereign wealth fund. Managed by an investment unit of
the central bank (NBIM) it counts with $900 billion under
management. To give you some sense of the size of the Fund, it
owns 1.3% of all World’s listed companies. In this chapter we show
the origins of the fund. We also explain something very important:
why the GPFG, despite having the word “pension” in its name, is not
a pension fund. We analyse the investment model peculiar to the
Norwegian fund (already being referred to as the ‘Norway model’)
and we compare it with the better-known Yale model. Our analysis
of the equity fund’s portfolio from 1998 to 2014 is one of a kind: the
first time the fund’s investments have been analysed from its
inception at microeconomic (company) level and also at sector,
country and continent level. The analysis reveals a fundamental
bias: The GPFG is a European fund for Europe. The fund has taken a
deliberate decision to give preference to investments in European
companies and to penalise stakes in North American, especially US,
companies. The chapter also addresses matters such as the
governance of the fund, its investments in the BRICS, how its
Spanish investments have evolved and its presence in tax havens.
history of the world’s biggest sovereign wealth fund
In 1990, the Norwegian government established a fiscal policy
instrument to improve the long-term management of the revenues
from its abundant oil resources: the Petroleum Fund.
Its establishment was the result of years of deliberations in the
Storting (Norwegian parliament). These deliberations had started in
1974 when the Minister of Finance presented the parliamentary report
“The role of petroleum activity in Norwegian society”, which posited
different uses for the country’s oil wealth, and ended in 1983 with the
Tempo Committee’s approval of Report NOU 1983:27, which
proposed the creation of a fund in which the government would be
able to store the profits arising from the exploitation of the oil
resources and spend only the real profitability deriving from them.
Following its establishment, the fund received its first transfer of
capital from the Ministry of Finance in 1996. Until 1997, its
investment strategy was the same as that of the Norwegian central
bank with its foreign currency reserves. The fund, which at that time
managed $20 billion, was invested entirely in fixed income.
In 1997, following a gruelling parliamentary debate, the Ministry of
Finance redefined the fund’s investment strategy and decided to
invest 40% of its assets in equities. Consequently, on 1 January 1998
Norges Bank Investment Management (NBIM) was established to
manage the fund under the supervision of the Ministry of Finance. In
that first year it made 7,851 investments, most of them in the US
(2,265), Japan (1,363) and the UK (454).
In the period from 2000 to 2008, higher oil prices led to more and
bigger transfers of capital from the Ministry of Finance, causing the
fund to grow more than expected (from $44 billion to $322 billion).
During this period the fund also changed its name to Government
Pension Fund Global (GPFG), and the Ministry of Finance decided to
increase the weight of equities in the portfolio by 20% to 60%.
In 2009 the fund’s ethical standards were evaluated, investments in
equities reached 60% of the portfolio in June, and the fund
published a return of 25.6%, a record at the time.
In the past four years the fund has reoriented its investment strategy,
taking in more sophisticated assets and emerging market equities. In
2010 it introduced a mandate for the fund to be allowed to invest up to
5% in the real estate sector1, and in 2012 the Ministry of Finance
announced a plan to gradually reduce its European exposure to 40% and
increase investments in emerging markets to 10%. The fund recently took
a further step in its strategy of diversification by announcing that it would
allocate around 1% to investments in frontier markets2 such as Nigeria
and Pakistan. This is aimed not only at diversifying the portfolio, but also
at generating greater returns in the coming years.
clarification: the Government Pension fund Global is not a pension fund
In 2006 the fund changed its name to Government Pension Fund
Global. With this change the Norwegian government was hinting at
the fund’s possible role in a future characterised by an ageing
population: defraying the increased costs of public pensions. And
yet despite the change of name and the declaration of intent
implicit therein, the fund has never operated as a pension fund.
Unlike the traditional pension funds, such as those of Canada or
Japan, the GPFG has no pension obligations. In fact the Norwegian
government has not yet taken any decision on how to finance its
existing pension commitments. It has not even decided the date
from which the fund can be used to cover the costs arising from
future pensions. This, together with the limitations on the
Norwegian executive’s use of the fund’s resources, not only ensure
the fund’s long-term view but also determine the nature of the
vehicle: For many commentators, this absence of pension
commitments is what defines a sovereign wealth fund3.
1 Last August, GPFG changed its investment units aiming to increase in-house investment capabilities. It named three new CIOs and strengthened its real estate team (See http://www.ipe.com/norwegian-oil-fund-restructures-investment-team-grows-property/10002781.fullarticle)2 See http://blogs.ft.com/beyond-brics/2014/05/22/guest-post-frontier-markets-more-profitable-less-volatile/3 Capapé, Javier and Guerrero, Tomás, “More Layers than an Onion: Looking for a Definition of Sovereign Wealth Funds” (June 1, 2013). SovereigNET Research Papers; ESADE Business School Research Paper No. 21. Available at SSRN: http://ssrn.com/abstract=2391165 or http://dx.doi.org/10.2139/ssrn.2391165.
Sovereign Wealth Funds 2014Equity investments of the Norway’s GPFG: A European sovereign wealth fund for Europe
51
However, the absence of current pension obligations does not
prevent some sovereign wealth funds from aiming to meet future
pension contingencies (what in 2008 the IMF called ‘contingent
pension reserve funds’). Two clear examples of this type of sovereign
wealth funds are in Australia and New Zealand. Australia’s Future
Fund ($97.57 billion) and New Zealand’s sovereign wealth fund,
New Zealand Superannuation Fund ($25.51 billion) were set up with
the purpose of serving as a deposit to face future pension
obligations, although they do not currently pay any pensions. The
Irish sovereign wealth fund (National Pensions Reserve Fund) was
also created with this intention of accumulating returns to face the
future cost of pensions. However, following the serious crisis the
country has come through, in 2009 the Ministry of Finance decided
to change the purpose of the NPRF as reserve for pensions and to
use it to recapitalise the two stricken major banks: Allied Irish Banks
(AIB) and Bank of Ireland. They invested $20.7 billion in this
operation. At the end of 2013, the positions and cash generated by
the sale of stakes in the two banks were valued at €15.4 billion4.
They lost 26% of the value of the initial investment in the
transaction. The question that still hangs in the air is: Will Australia,
New Zealand or Chile resist the temptation to apply short-term
economic policies if their economies or key sectors run into serious
problems?
From the Yale to the Norway model
The workings of the GPFG and the returns it obtains have not gone
unnoticed by institutional investors around the world. In the past
few years, the management of the Norwegian fund has not only
become a reference in terms of transparency and corporate
governance for other sovereign wealth funds, but an exemplary
model of asset management for private investors, given the track
record.
But what investment principles can private investors incorporate in
order to follow a strategy similar to that of the Norwegian fund? The
white paper5 “Yale versus Norway”6 published in September 2012 by
Curtis Greycourt, addresses this matter, comparing the investment
strategies followed by David Swensen at the head of the Yale
endowment portfolio with those of Yngve Slyngstad at the head of
Norges Bank Investment Management.
The Yale model bases its strategy on concentrating its investments
in illiquid assets such as property, infrastructure and private equity.
This investment model, designed by David Swensen, has generated
an average annual return of 13.7% for the Yale endowment over the
past twenty years. As a result, the Yale model, which also informs
4 More information on the website of the (still existent) NPRF on its transition to a public strategic investment fund: http://www.nprf.ie/DirectedInvestments/directedInvestments.htm5 Based on Chambers, Dimson and Ilmanen’s “The Norway Model” http://www.iijournals.com/doi/full/10.3905/jpm.2012.38.2.0676 http://www.greycourt.com/wp-content/uploads/2012/09/WhitePaperNo55-YaleVersusNorway.pdf
the investment style of the Harvard and Stanford endowments, has
consolidated its position in recent decades as the main investment
strategy among institutional investors.
However, the model appears to be exhausted, or at least not to
have successfully come through the crisis and its consequences. The
Yale endowment has posted returns below the S&P 500 for five
years in a row, and we are seeing a change of paradigm. The poor
results being posted by the asset management industry since the
onset of the crisis have led many investors to explore new models.
One of those gaining most favour is the model behind the workings
of the Government Pension Fund Global. The Norwegian model,
unlike the Yale one, is showing that attractive returns can be
obtained by investing a good part of the portfolio in equities (more
than 60%), and with a reduced exposure to illiquid assets (up to 5%
in real estate).
From the comparison carried out by Greycourt, we can draw
several conclusions allowing us to pinpoint the differences and
similarities between the two models. In fact the two models are
not so very different, sharing as they do a number of investment
principles such as:
(1) Markets are mostly efficient (2) diversification is one of the best ways of controlling risk (3) the profitability of equities is the main source of returns (4) the fund must be administered on the basis of a specific benchmark and (5) external managers are important.
Nonetheless, the Norwegian model presents a series of differences
compared with the Yale model:
(1) It stresses risk reduction though diversification (2) it has very little or no exposure to short-term bonds (3) it has a much smaller exposure to illiquid assets such as real estate or invest-ments in timber (4) it has rigorous allocation of assets, which significantly reduces tracking error and protects the investment strategy (5) it follows socially responsible investment criteria (6) it plays the role of activist shareholder to improve the gover-nance of the companies in which it invests (7) it has less complex management and significantly lower costs (8) it has a gover-nance structure designed to follow a clear investment strategy, avoiding improvised changes (9) it reduces possible principal-agent problems (between the owner and the manager of the as-sets) since the valuation of the assets is carried out by the market and is easily identifiable.
Furthermore, as we noted in the second difference, the majority of
sovereign wealth funds do not have defined liabilities (pensions)
and therefore do not suffer the problems of asset and liability
mismatch seen in the Yale model. It therefore seems logical for
sovereign wealth funds to follow the Norwegian model rather than
the Yale one. In other words, to follow the model designed by one
Sovereign Wealth Funds 2014 Equity investments of the Norway’s GPFG: A European sovereign wealth fund for Europe52
5. Equity investments of the Norway’s GPFG: A European sovereign wealth fund for Europe
of their peers, which also does not face defined commitments and
which has a long-term investment horizon.
Of course, the Norwegian model, despite being behind the
management of what is considered to be one of the world’s most
transparent sovereign wealth funds and with the best corporate
governance7, is neither perfect nor universally applicable. Not all
investors can adopt the investment principles followed by the fund,
because among other things they do not have the institutional and
organisational framework of the Norwegian fund (parliamentary
support or in-house investment teams). Nor can these principles be
applied unaltered by managers who have to meet recurring short-
term obligations. Even so, the model presents a number of
advantages compared with the Yale one, which could be used by
institutional investors to improve and modernise their investment
strategies.
corporate governance
The Norwegian fund is a world reference for good governance. As
well as heading the ranking of sovereign wealth funds by assets
under management, the GPFG is a reference for good governance,
both corporate (with regard to the manager, NBIM) and in its
relations with its other stakeholders: parliament, central bank,
ministry of finance and Norwegian society.
Moreover, the GPFG is also a reference as regards transparency.
None of the other funds in the top ten by volume of assets has a
similar level of transparency. This is in stark contrast to the
opaqueness of its counterparts in the Middle East or South-east
Asia. The Norwegian fund publishes information, updated in real
time on the value of its portfolio. Every year it also discloses the
content of its portfolio in detail, with the names of all companies
and bodies receiving its fixed income and equity investments. It also
recently started to provide breakdowns of its activity in the real
estate sector. In the case of equities, on which we focus in this
chapter, it has equity investments in 8,213 companies in 74 different
countries. For each one of them it details the volume of the
investment, the percentage of the capital that it represents, and the
percentage of voting rights it can exercise. The fund has an upper
limit of 10 percent of ownership in any given listed company. As at
31 December 2013 the five companies in which GPFG holds the
largest ownership positions were Irish packaging Smurfit Kappa
Group (9.40%), British property and development Great Portland
Estates (8.86%), two Finnish companies in the paper, bio and
forestry industries, Stora Enso (8.16%) and UPM-Kymmene (7.76%);
lastly, American financial giant BlackRock (7.08%).
7 Truman, E. M. (2011). Sovereign Wealth Funds: Threat or Salvation? Peterson Institute for International Economics.
This same transparency extends to the rules governing entries to
and exits from the fund’s capital. Norway is one of the world’s
biggest exporters of oil (seventh) and natural gas (third, behind
Russia and Canada). Therefore clear rules on contributions to the
fund are essential. Specifically, since 2001 the fund’s “spending
rule” establishes that not more than 4% of the fund may be spent
on the government’s annual budget.
Together with this transparency and good corporate governance it
used to be argued that the Norwegian fund was an example for
other funds as regards the non-interference of political
considerations in the NBIM’s investment decisions. However, even
the Norwegian fund is subject to this political interference.
In October 2008 in Santiago de Chile, the then members of the
International Working Group of Sovereign Wealth Funds signed a
declaration of 24 Principles on the practices that should govern
sovereign wealth funds. This non-binding declaration, known since
then as the ‘Santiago Principles’, had a clear intention: to dispel the
fears that many governments then had about sovereign wealth
funds’ possibly investing for political reasons. Balance, to date
appears satisfactory, given Heathrow airport’s current shareholders
(including three SWFs) or Qatar Holding’s leading role in the $66
billion Glencore Xstrata mega-merge in 2012 (the fifth-largest in the
history of the natural resources sector).
However, this same declaration leaves room for discretionality in
many highly significant aspects. Specifically, sub-principle 19.1
stipulates that “If investment decisions are subject to other than
economic and financial considerations, these should be clearly set
out in the investment policy and be publicly disclosed.” When a
fund, for example Mubadala, decides to serve as a financial lever in
changing its country’s production base, it does not specify which
activities are in pursuit of a purely economic and/or financial
objective and which serve a political interest that facilitates (or in
some cases hinders) this diversification.
By this we do not mean to assert that there is necessarily anything
wrong with pursuing objectives that go beyond economic-financial
ones. Sometimes funds can be used as instruments in international
relations, for example, establishing alliances with globally influential
governments so as to facilitate the establishment of trading,
learning and investment relations, for example.
It is therefore logical that the finance industry, multilateral bodies,
receiving countries and regulators should seek to minimise the
effect of these other objectives of the sovereign wealth funds.
However, isolating public entities, which in the final analysis are
governed by politicians, from political interests, is something really
hard to achieve. Furthermore, it will be difficult to correct in the
context of this new “state capitalism” on which many emerging
Sovereign Wealth Funds 2014Equity investments of the Norway’s GPFG: A European sovereign wealth fund for Europe
53
economies have embarked, in which the connections between
governments and corporate managers are so ingrained: former
politicians managing state companies, former managers of state
companies going on to manage public investment agencies, etc.
In the case of Norway, the risk of political interference is limited, but
it does exist. The procedures and accountability to which the NBIM-
managed fund is subject, both to the Ministry of Finance itself and
ultimately to Parliament, ensure that investment policies are not
dictated by short-term political considerations. Furthermore, in
Norway, the fact that the fund does not invest in any domestic
assets (equities, debt or real estate), reduces the incentive to
interfere in particular industries or companies for political reasons.8
However, the Norwegian fund’s determination to become a global
reference as a “responsible investor” exposes it to non-economic-
financial interference or influence. In 2002, the Parliament set up a
committee of experts, the Graver Committee, to implement a
mechanism to ensure responsible investment by the fund. Two years
later, the fund’s lines of action in the field of ethics were defined
and the Board of Ethics was set up. The Board, composed of five
persons with varied profiles (a lawyer, an engineering agronomist, a
biologist and two economists from different fields), is charged with
reviewing all the GPFG’s investments and assessing which, if any, are
inconsistent with the fund’s ethical approach. These
recommendations are submitted to the Ministry of Finance, which
decides, based on the recommendations received, whether to
exclude these investments or place them on a watch list.
The Committee’s recommendations have led to the exclusion of 21
companies in the tobacco sector. Moreover, those which the Ethics
Committee described as causing serious environmental damage (as in
the case of Rio Tinto in 2008), or having seriously or systematically
violated human rights (Walmart being the best-known case, with its
exclusion in May 2006), or producing nuclear weapons (EADS, Boeing
and Lockheed Martin), have also been excluded from the GPFG’s
investment universe by the Ministry of Finance.
It is in this area that the Committee, and ultimately the GPFG may be or
may have been subject to significant political or other influence. In fact,
when the new government came to power, it attempted to dissolve this
independent Committee and incorporate it into the central bank (where
NBIM operates). Although this move was not approved, because it did
not receive majority parliamentary support, a significant reform has
nevertheless been proposed. The recommendations of the Committee,
which will continue to operate independently, would be submitted
directly to the central bank, not passing through the Ministry of Finance.
The main reason given in support of this change is to avoid projecting
8 For more information on how political interference affects funds’ returns and investment decisions, see Bernstein, S., Lerner, J., & Schoar, A. (2013). The Investment Strategies of Sovereign Wealth Funds. Journal of Economic Perspectives, 27(2), 219–238.
an image of the fund as an instrument of Norway’s foreign policy. If this
change comes about based on the reason put forward, then it is hard to
avoid thinking that at some time in the past the fund has been used as
an instrument of foreign policy.
Therefore we may conclude that at least the “responsible
investment” decisions are not necessarily based on strictly economic
or financial considerations. The case of the Norwegian fund
demonstrates that the “risk” of being subjected to non-economic
influence in its investment decisions is real; whether to exclude
individual companies or certain entire sectors, or to include
mandates in ‘responsible’ investment sectors. And all this in the
context of a fund that operates with very well defined and
transparent internal policies. Therefore, in light of the Norwegian
case, we may conclude that the likelihood of a public financial
instrument’s being used as a tool of the country in the pursuit of
other (more or less laudable) objectives is still very significant.
investment strategy: long-term investor, the European bias and external managers
The GPFG was created in order to provide the Norwegian
government with an instrument with which to handle the country’s
fiscal policy in the event that oil prices should fall or Norway’s
onshore economy (i.e. excluding oil and gas) should contract.
In order to safeguard the fund’s founding mandate, the Ministry of
Finance established a clear investment strategy from the outset,
with the objective of taking advantage of its long-term view to
generate high profitability and preserve the country’s wealth for
future generations.
The long-term view is the cornerstone on which the Norwegian
sovereign wealth fund’s investment strategy rests. The NBIM has no
short-term commitments. It identifies long-term investment
opportunities in sectors and specific companies, invests in assets
that it expects to generate high returns over time, and is able to
withstand periods of high volatility in the capital markets. It thus
takes advantage of opportunities that arise, while other investors
find themselves constrained to take short-term decisions.
Geographical spread of the fund’s investments: preference for Europe
Another of the key elements in the fund’s strategy is the setting of
benchmarks for its investments. The fund’s investments are valued
against the benchmark indices for equities, bonds and real estate
compiled by FTSE Group, Barclays Capital and Investment Property
Databank (IPD) respectively. At present, the fund holds 60% of its
assets in equities, 35% in fixed income and up to 5% in real estate.
All GPFG’s investments are made outside Norway.

Sovereign Wealth Funds 2014 Equity investments of the Norway’s GPFG: A European sovereign wealth fund for Europe54
5. Equity investments of the Norway’s GPFG: A European sovereign wealth fund for Europe
Source: ESADEgeo (2014)
1º
2º
3º
4º
5º
6º
7º
8º
9º
10º
Nestlé
Shell
Novartis
HSBC
Vodafone
Roche
BlackRock
BG Group
Apple
BP
Basic materials Consumer goods Consumer services Financials Health care Industrials Oil&gas Technology Telecommunications Utilities
1998 1999 2000 2001 2002 2003 2004 2005 2006 2007 2008 2009 2010 2011 2012 2013
GPFG Top 10: Conquering the world´s largest companies
Infographic 4
6,412.4108.9
92.9
89.3
87.9
87.7
80.9
79.1
71.9
67.4
61.5
4,258.5
4,077.2
4,019.3
3,949.1
3,709.7
3,615.7
3,441.6
3,290.6
4,728.8
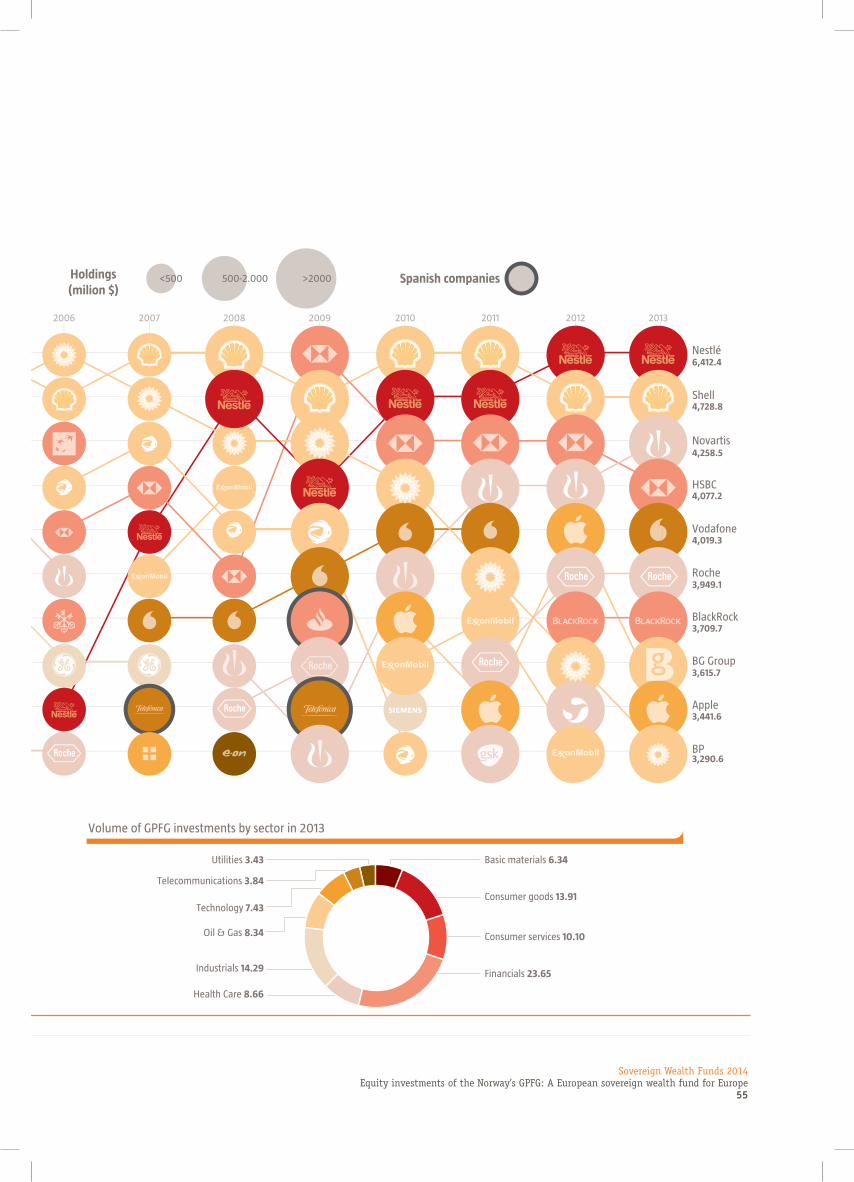
Basic materials 6.34
Consumer goods 13.91
Consumer services 10.10
Financials 23.65
Health Care 8.66
Industrials 14.29
Oil & Gas 8.34
Technology 7.43
Telecommunications 3.84
Utilities 3.43
Major investments in emerging-markets companies in 2013 Volume of GPFG investments by sector in 2013
1º
TaiwanSemicond.Manufact.Company
1.001.1
2º
ChinaPacific
InsuranceGroup
922.2
VTBBank
3º
891.9
Tencent
4º
655.1
Petrobras
5º
588.5
Vale
6º
563.6
ICBC
7º
561.2
Gazprom
8º
540.6
ChinaConstruction
Bank
9º
459.0
ChinaMobile
10º
433.1
Holdings(milion $)
Spanish companies<500 500-2.000 >2000
.
Sovereign Wealth Funds 2014Equity investments of the Norway’s GPFG: A European sovereign wealth fund for Europe
55
Source: ESADEgeo (2014)
1º
2º
3º
4º
5º
6º
7º
8º
9º
10º
Nestlé
Shell
Novartis
HSBC
Vodafone
Roche
BlackRock
BG Group
Apple
BP
Basic materials Consumer goods Consumer services Financials Health care Industrials Oil&gas Technology Telecommunications Utilities
1998 1999 2000 2001 2002 2003 2004 2005 2006 2007 2008 2009 2010 2011 2012 2013
GPFG Top 10: Conquering the world´s largest companies
Infographic 4
6,412.4108.9
92.9
89.3
87.9
87.7
80.9
79.1
71.9
67.4
61.5
4,258.5
4,077.2
4,019.3
3,949.1
3,709.7
3,615.7
3,441.6
3,290.6
4,728.8
Basic materials 6.34
Consumer goods 13.91
Consumer services 10.10
Financials 23.65
Health Care 8.66
Industrials 14.29
Oil & Gas 8.34
Technology 7.43
Telecommunications 3.84
Utilities 3.43
Major investments in emerging-markets companies in 2013 Volume of GPFG investments by sector in 2013
1º
TaiwanSemicond.Manufact.Company
1.001.1
2º
ChinaPacific
InsuranceGroup
922.2
VTBBank
3º
891.9
Tencent
4º
655.1
Petrobras
5º
588.5
Vale
6º
563.6
ICBC
7º
561.2
Gazprom
8º
540.6
ChinaConstruction
Bank
9º
459.0
ChinaMobile
10º
433.1
Holdings(milion $)
Spanish companies<500 500-2.000 >2000
.

Sovereign Wealth Funds 2014 Equity investments of the Norway’s GPFG: A European sovereign wealth fund for Europe56
5. Equity investments of the Norway’s GPFG: A European sovereign wealth fund for Europe
According to the latest annual report of the NBIM (31 December
2013), the fund measures the relative returns of its portfolio against
the FTSE Global All Cap index, which contains 7,476 large-, mid- and
small-cap companies from 47 countries. It includes frontier markets
such as Pakistan, Morocco and the Philippines (with a total weight
in the portfolio of less than 1%).
The analysis of the NBIM’s portfolio at the end of 2013 also allows us
to evaluate the geographical distribution of the shares. The Fund
held shares in 8,213 different companies in 74 countries (or
territories, as we shall see).
From this group of 8,000 companies we have filtered the Top 10
investments yearly since 1998 (See Infographic 4). Many trends can
be identified. First, some telecoms simply disappear from the Top 10
(the most prominent case is Nokia which topped in 1999, but British
Telecom, NTT, Cisco, Ericsson, fell too). Second, The oil company BP
is the only firm which endured in the Top 10 since the beginning of
the Fund’s activity in 1998 (the trend shows that most probably it
will not be the case in 2014). Third, two pharmaceutical Swiss
companies represent well the Swiss GPFG’s preference, now
including consumer goods Nestle as top investment destination,
too. Fourth, analyzing sectors, many conclusions arise but current
diversification remains on top. This diversification is even more
evident now if compared with recent 2008, when four over five
largest holdings were oil&gas companies.
If we compare the geographical distribution of the FTSE index with
that of the NBIM, we find some very significant differences. Most of
these differences are explained by deliberate decisions: NBIM
applies a different geographical weighting from that of the FTSE
Global All Cap index. NBIM receives the investment mandate drawn
up by the Ministry of Finance and applies it to its management of
the GPFG. Specifically, NBIM applies an over-weighting of 2.5 to
European equities, relative to the weight assigned by the FTSE index.
It does likewise with “other developed markets” (1.5) and
“emerging markets” (1.5). However it maintains the weighting of
the US and Canada unchanged. In other words, according to the
FTSE index, Europe should account for 23% of the portfolio.
However, applying the NBIM’s weighting, it must represent 40% of
its portfolio. The current weight of Europe in the portfolio is 40.3%.
So in aggregate terms, the GPFG maintains its European investment
in excess of its benchmark. In the opposite extreme is the US, with a
weight of 49% in the FTSE index, assigned just 34% in the new
weighting and accounting for only 29% of the GPFG’s investment.
The following figures show the deviations. First, we compare the
FTSE benchmarks with those of the NBIM (Chart 1). We see an
almost perfect offsetting between the extra weight allocated to
Europe and the penalisation of the US. Specifically, the UK, with
5.52% more, is the clear winner from the adjusted index used by the
NBIM. In monetary terms, the new index increases exposure to the
UK by more than $28.2 billion given the Fund’s current market
value. France, Germany and Switzerland also gain in this respect. At
the other extreme, the US sees its benchmark reduced by just over
15%, which in monetary terms is more than €79.5 billion. In terms
of the benchmark then, the European bias is patent.
5.5
2.3
2.2
2.1
0.9
0.8
0.7
0.7
-1.2
-15.7
Source: Prepared by the authors, with data from FTSE and NBIM (2014).
Percentage
Chart 1
Gap between FTSE and NBIM benchmarksfor selected countries
United States
Canada
Italy
Netherlands
Sweden
Spain
Switzerland
Germany
France
United Kingdom
Millions of euros
Chart 2
Gap between NBIM's adjusted benchmarkand investment received
United States
Japan
Australia
Canada
India
South Africa
Spain
Russia
Finland
Netherlands
China
Sweden
Switzerland
France
Germany
United Kingdom
Source: Prepared by the authors, with data from FTSE and NBIM (2014)
8,283
7,416
5,764
4,660
4,149
2,595
1,349
1,321
1,050
-1,102
-1,128
-1,206
-1,947
-4,422
-5,066
-23,081
AsiaNorth AmericaEurope Middle East Oceania Latin America Africa
Source: Prepared by the authors, with annual report data from NBIM
Billions of dollars
Chart 3
Distribution of the portfolio by continents
0
100
200
300
400
500
600
2013201220112010200920082007200620052004200320022001200019991998
2013201020052000
Source: Prepared by the authors, with annual report data from NBIM
Chart 4
Changes in top ten investments in Europe
Billions of dollars
0
50
100
150
200
FranceGermanyUK Switzerland Sweden
Spain Finland RussiaNetherland Italy
China Brazil Russia India South Africa
Source: Prepared by the authors, with annual report data from NBIM.
Billions of dollars
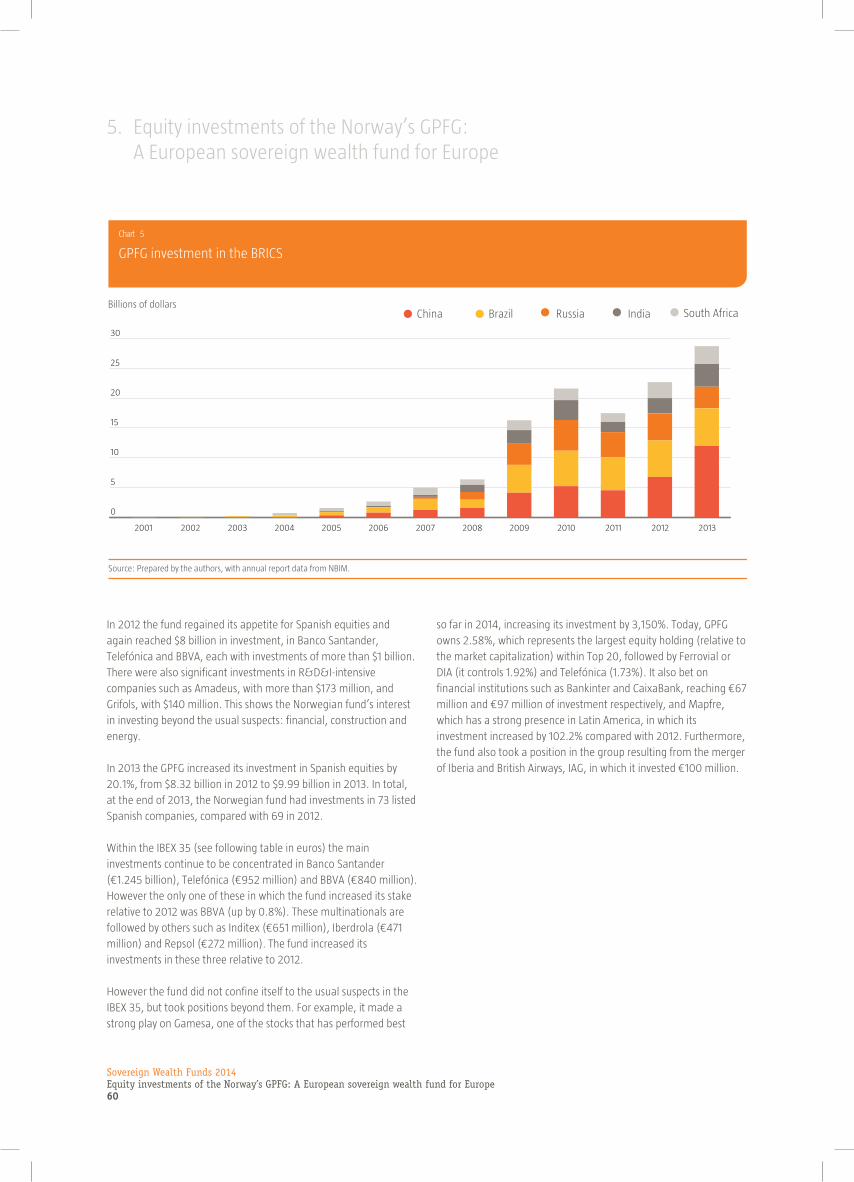
Chart 5
GPFG investment in the BRICS
0
5
10
15
20
25
30
2013201220112010200920082007200620052004200320022001
.
.
.
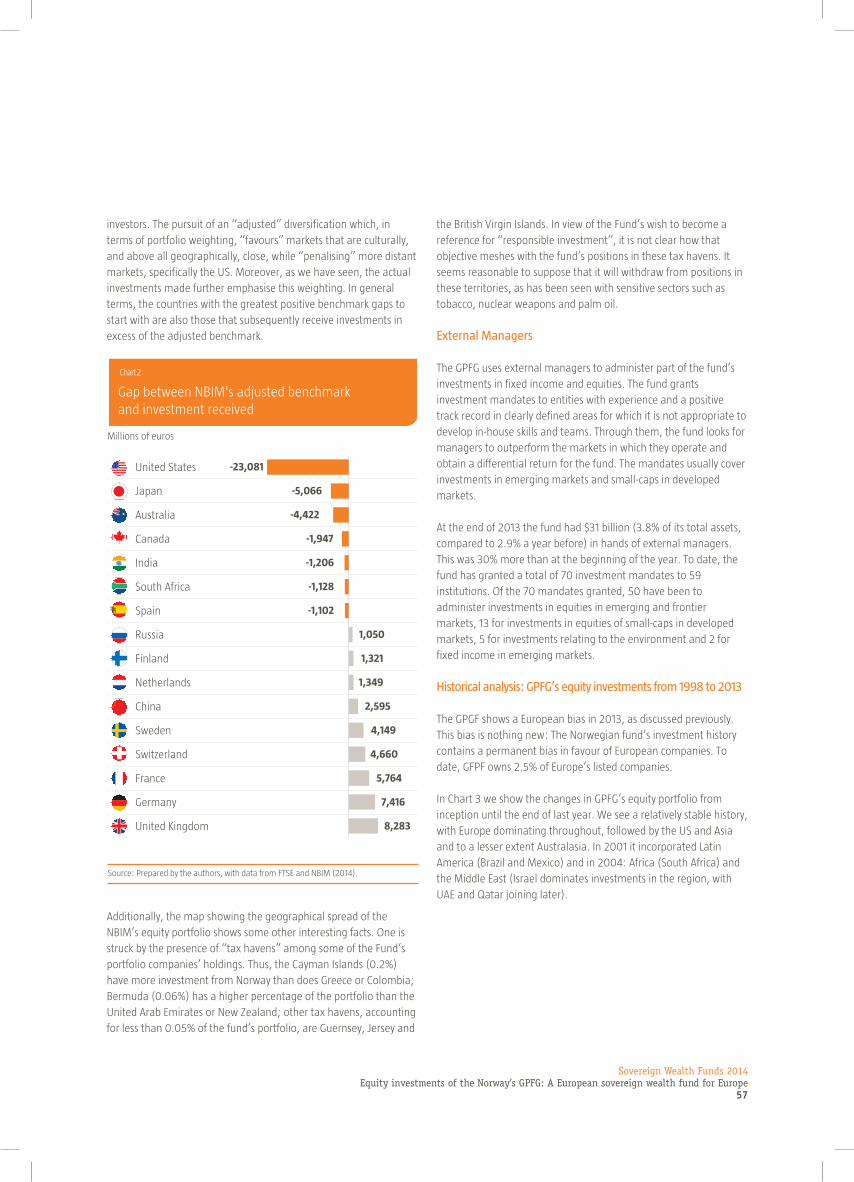
We can also see the fund’s real position in comparison with the
adjusted benchmark (Chart 2). In other words, we can see which
countries receive greater or lesser amounts than those determined
by the adjusted benchmark. In this regard, the US again comes out
as the main loser. The gap or difference between the benchmark
and the amount invested in the country is $23 billion. Japan and
Australia ($5 billion and $4.4 billion respectively), are the other two
countries affected by this. We should also highlight two European
countries receiving less investment than envisaged in 2013. These
are Spain, with a negative gap of $1.1 billion, and Denmark, with
$544 million. At the other extreme, the UK ($8.3 billion), Germany
($7.4 billion), France ($5.7 billion), Switzerland ($4.7 billion) and
Sweden ($4.1 billion), received a “surplus” in 2013. Also notable on
the “surplus” side are investments in two emerging countries, China
and Russia, with “surpluses” of $2.6 billion and $1.05 billion
respectively.
This therefore constitutes a deliberate play on investment in Europe.
This domestic (regional) bias is also seen in other institutional
Sovereign Wealth Funds 2014Equity investments of the Norway’s GPFG: A European sovereign wealth fund for Europe
57
investors. The pursuit of an “adjusted” diversification which, in
terms of portfolio weighting, “favours” markets that are culturally,
and above all geographically, close, while “penalising” more distant
markets, specifically the US. Moreover, as we have seen, the actual
investments made further emphasise this weighting. In general
terms, the countries with the greatest positive benchmark gaps to
start with are also those that subsequently receive investments in
excess of the adjusted benchmark.
5.5
2.3
2.2
2.1
0.9
0.8
0.7
0.7
-1.2
-15.7
Source: Prepared by the authors, with data from FTSE and NBIM (2014).
Percentage
Chart 1
Gap between FTSE and NBIM benchmarksfor selected countries
United States
Canada
Italy
Netherlands
Sweden
Spain
Switzerland
Germany
France
United Kingdom
Millions of euros
Chart 2
Gap between NBIM's adjusted benchmarkand investment received
United States
Japan
Australia
Canada
India
South Africa
Spain
Russia
Finland
Netherlands
China
Sweden
Switzerland
France
Germany
United Kingdom
Source: Prepared by the authors, with data from FTSE and NBIM (2014)
8,283
7,416
5,764
4,660
4,149
2,595
1,349
1,321
1,050
-1,102
-1,128
-1,206
-1,947
-4,422
-5,066
-23,081
AsiaNorth AmericaEurope Middle East Oceania Latin America Africa
Source: Prepared by the authors, with annual report data from NBIM
Billions of dollars
Chart 3
Distribution of the portfolio by continents
0
100
200
300
400
500
600
2013201220112010200920082007200620052004200320022001200019991998
2013201020052000
Source: Prepared by the authors, with annual report data from NBIM
Chart 4
Changes in top ten investments in Europe
Billions of dollars
0
50
100
150
200
FranceGermanyUK Switzerland Sweden
Spain Finland RussiaNetherland Italy
China Brazil Russia India South Africa
Source: Prepared by the authors, with annual report data from NBIM.
Billions of dollars
Chart 5
GPFG investment in the BRICS
0
5
10
15
20
25
30
2013201220112010200920082007200620052004200320022001
.
.
.
Additionally, the map showing the geographical spread of the
NBIM’s equity portfolio shows some other interesting facts. One is
struck by the presence of “tax havens” among some of the Fund’s
portfolio companies’ holdings. Thus, the Cayman Islands (0.2%)
have more investment from Norway than does Greece or Colombia;
Bermuda (0.06%) has a higher percentage of the portfolio than the
United Arab Emirates or New Zealand; other tax havens, accounting
for less than 0.05% of the fund’s portfolio, are Guernsey, Jersey and
the British Virgin Islands. In view of the Fund’s wish to become a
reference for “responsible investment”, it is not clear how that
objective meshes with the fund’s positions in these tax havens. It
seems reasonable to suppose that it will withdraw from positions in
these territories, as has been seen with sensitive sectors such as
tobacco, nuclear weapons and palm oil.
External Managers
The GPFG uses external managers to administer part of the fund’s
investments in fixed income and equities. The fund grants
investment mandates to entities with experience and a positive
track record in clearly defined areas for which it is not appropriate to
develop in-house skills and teams. Through them, the fund looks for
managers to outperform the markets in which they operate and
obtain a differential return for the fund. The mandates usually cover
investments in emerging markets and small-caps in developed
markets.
At the end of 2013 the fund had $31 billion (3.8% of its total assets,
compared to 2.9% a year before) in hands of external managers.
This was 30% more than at the beginning of the year. To date, the
fund has granted a total of 70 investment mandates to 59
institutions. Of the 70 mandates granted, 50 have been to
administer investments in equities in emerging and frontier
markets, 13 for investments in equities of small-caps in developed
markets, 5 for investments relating to the environment and 2 for
fixed income in emerging markets.
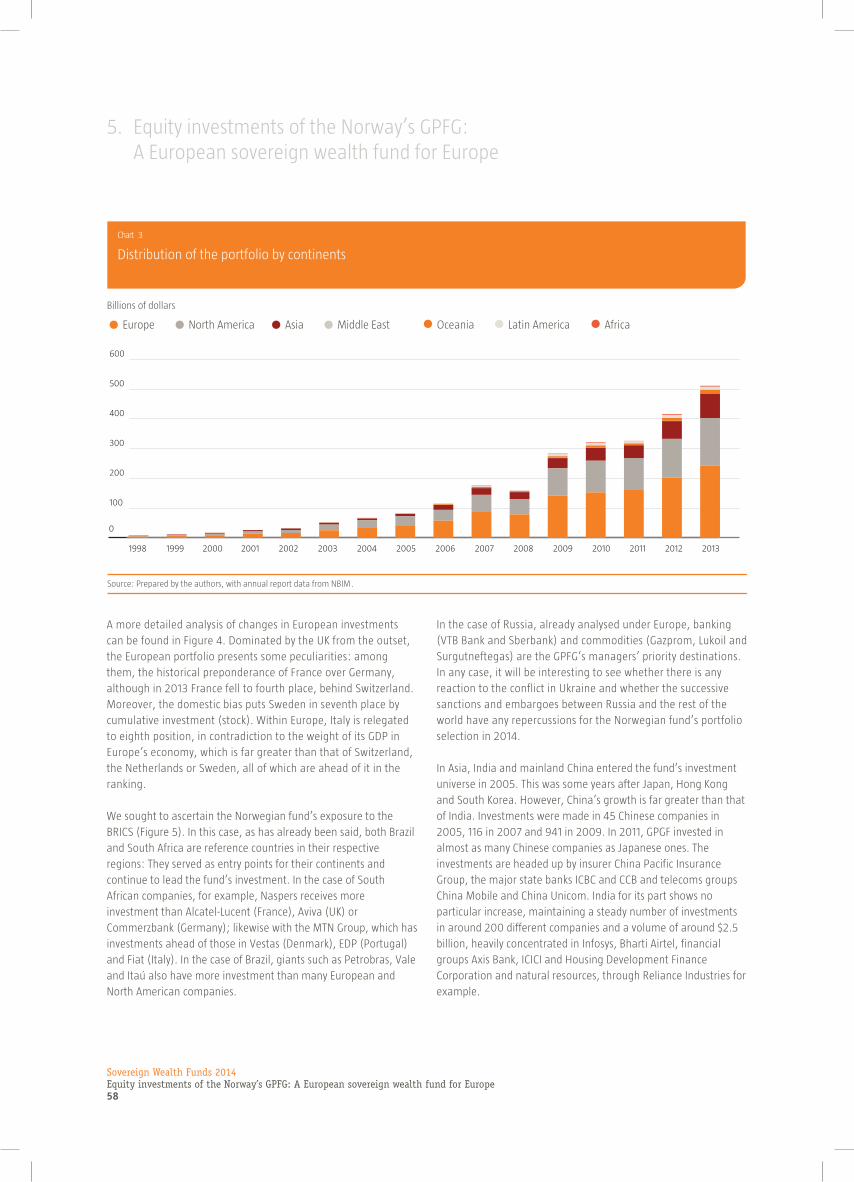
Historical analysis: GPFG’s equity investments from 1998 to 2013
The GPGF shows a European bias in 2013, as discussed previously.
This bias is nothing new: The Norwegian fund’s investment history
contains a permanent bias in favour of European companies. To
date, GFPF owns 2.5% of Europe’s listed companies.
In Chart 3 we show the changes in GPFG’s equity portfolio from
inception until the end of last year. We see a relatively stable history,
with Europe dominating throughout, followed by the US and Asia
and to a lesser extent Australasia. In 2001 it incorporated Latin
America (Brazil and Mexico) and in 2004: Africa (South Africa) and
the Middle East (Israel dominates investments in the region, with
UAE and Qatar joining later).
Sovereign Wealth Funds 2014 Equity investments of the Norway’s GPFG: A European sovereign wealth fund for Europe58
5. Equity investments of the Norway’s GPFG: A European sovereign wealth fund for Europe
5.5
2.3
2.2
2.1
0.9
0.8
0.7
0.7
-1.2
-15.7
Source: Prepared by the authors, with data from FTSE and NBIM (2014).
Percentage
Chart 1
Gap between FTSE and NBIM benchmarksfor selected countries
United States
Canada
Italy
Netherlands
Sweden
Spain
Switzerland
Germany
France
United Kingdom
Millions of euros
Chart 2
Gap between NBIM's adjusted benchmarkand investment received
United States
Japan
Australia
Canada
India
South Africa
Spain
Russia
Finland
Netherlands
China
Sweden
Switzerland
France
Germany
United Kingdom
Source: Prepared by the authors, with data from FTSE and NBIM (2014)
8,283
7,416
5,764
4,660
4,149
2,595
1,349
1,321
1,050
-1,102
-1,128
-1,206
-1,947
-4,422
-5,066
-23,081
AsiaNorth AmericaEurope Middle East Oceania Latin America Africa
Source: Prepared by the authors, with annual report data from NBIM
Billions of dollars
Chart 3
Distribution of the portfolio by continents
0
100
200
300
400
500
600
2013201220112010200920082007200620052004200320022001200019991998
2013201020052000
Source: Prepared by the authors, with annual report data from NBIM
Chart 4
Changes in top ten investments in Europe
Billions of dollars
0
50
100
150
200
FranceGermanyUK Switzerland Sweden
Spain Finland RussiaNetherland Italy
China Brazil Russia India South Africa
Source: Prepared by the authors, with annual report data from NBIM.
Billions of dollars
Chart 5
GPFG investment in the BRICS
0
5
10
15
20
25
30
2013201220112010200920082007200620052004200320022001
.
.
.
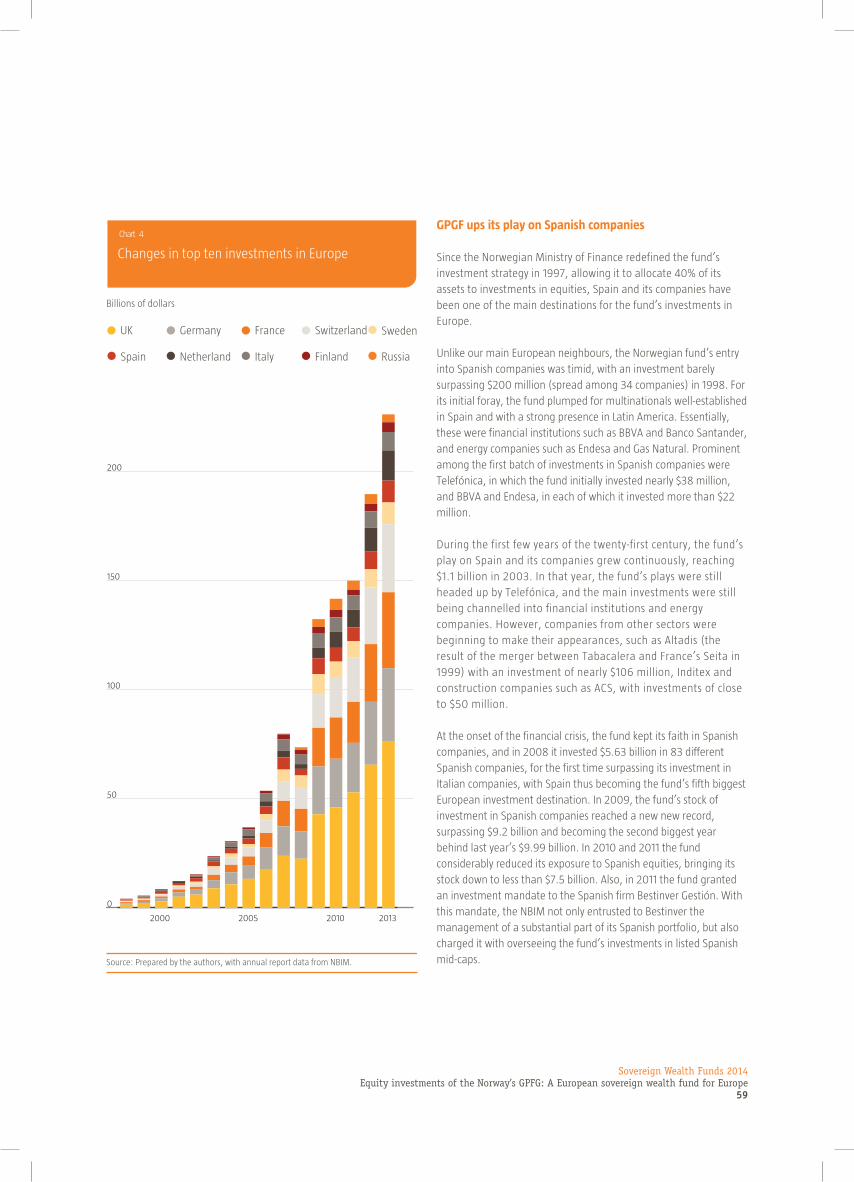
A more detailed analysis of changes in European investments
can be found in Figure 4. Dominated by the UK from the outset,
the European portfolio presents some peculiarities: among
them, the historical preponderance of France over Germany,
although in 2013 France fell to fourth place, behind Switzerland.
Moreover, the domestic bias puts Sweden in seventh place by
cumulative investment (stock). Within Europe, Italy is relegated
to eighth position, in contradiction to the weight of its GDP in
Europe’s economy, which is far greater than that of Switzerland,
the Netherlands or Sweden, all of which are ahead of it in the
ranking.
We sought to ascertain the Norwegian fund’s exposure to the
BRICS (Figure 5). In this case, as has already been said, both Brazil
and South Africa are reference countries in their respective
regions: They served as entry points for their continents and
continue to lead the fund’s investment. In the case of South
African companies, for example, Naspers receives more
investment than Alcatel-Lucent (France), Aviva (UK) or
Commerzbank (Germany); likewise with the MTN Group, which has
investments ahead of those in Vestas (Denmark), EDP (Portugal)
and Fiat (Italy). In the case of Brazil, giants such as Petrobras, Vale
and Itaú also have more investment than many European and
North American companies.
In the case of Russia, already analysed under Europe, banking
(VTB Bank and Sberbank) and commodities (Gazprom, Lukoil and
Surgutneftegas) are the GPFG’s managers’ priority destinations.
In any case, it will be interesting to see whether there is any
reaction to the conflict in Ukraine and whether the successive
sanctions and embargoes between Russia and the rest of the
world have any repercussions for the Norwegian fund’s portfolio
selection in 2014.
In Asia, India and mainland China entered the fund’s investment
universe in 2005. This was some years after Japan, Hong Kong
and South Korea. However, China’s growth is far greater than that
of India. Investments were made in 45 Chinese companies in
2005, 116 in 2007 and 941 in 2009. In 2011, GPGF invested in
almost as many Chinese companies as Japanese ones. The
investments are headed up by insurer China Pacific Insurance
Group, the major state banks ICBC and CCB and telecoms groups
China Mobile and China Unicom. India for its part shows no
particular increase, maintaining a steady number of investments
in around 200 different companies and a volume of around $2.5
billion, heavily concentrated in Infosys, Bharti Airtel, financial
groups Axis Bank, ICICI and Housing Development Finance
Corporation and natural resources, through Reliance Industries for
example.
Sovereign Wealth Funds 2014Equity investments of the Norway’s GPFG: A European sovereign wealth fund for Europe
59
GPGf ups its play on Spanish companies
Since the Norwegian Ministry of Finance redefined the fund’s
investment strategy in 1997, allowing it to allocate 40% of its
assets to investments in equities, Spain and its companies have
been one of the main destinations for the fund’s investments in
Europe.
Unlike our main European neighbours, the Norwegian fund’s entry
into Spanish companies was timid, with an investment barely
surpassing $200 million (spread among 34 companies) in 1998. For
its initial foray, the fund plumped for multinationals well-established
in Spain and with a strong presence in Latin America. Essentially,
these were financial institutions such as BBVA and Banco Santander,
and energy companies such as Endesa and Gas Natural. Prominent
among the first batch of investments in Spanish companies were
Telefónica, in which the fund initially invested nearly $38 million,
and BBVA and Endesa, in each of which it invested more than $22
million.
During the first few years of the twenty-first century, the fund’s
play on Spain and its companies grew continuously, reaching
$1.1 billion in 2003. In that year, the fund’s plays were still
headed up by Telefónica, and the main investments were still
being channelled into financial institutions and energy
companies. However, companies from other sectors were
beginning to make their appearances, such as Altadis (the
result of the merger between Tabacalera and France’s Seita in
1999) with an investment of nearly $106 million, Inditex and
construction companies such as ACS, with investments of close
to $50 million.
At the onset of the financial crisis, the fund kept its faith in Spanish
companies, and in 2008 it invested $5.63 billion in 83 different
Spanish companies, for the first time surpassing its investment in
Italian companies, with Spain thus becoming the fund’s fifth biggest
European investment destination. In 2009, the fund’s stock of
investment in Spanish companies reached a new new record,
surpassing $9.2 billion and becoming the second biggest year
behind last year’s $9.99 billion. In 2010 and 2011 the fund
considerably reduced its exposure to Spanish equities, bringing its
stock down to less than $7.5 billion. Also, in 2011 the fund granted
an investment mandate to the Spanish firm Bestinver Gestión. With
this mandate, the NBIM not only entrusted to Bestinver the
management of a substantial part of its Spanish portfolio, but also
charged it with overseeing the fund’s investments in listed Spanish
mid-caps.
5.5
2.3
2.2
2.1
0.9
0.8
0.7
0.7
-1.2
-15.7
Source: Prepared by the authors, with data from FTSE and NBIM (2014).
Percentage
Chart 1
Gap between FTSE and NBIM benchmarksfor selected countries
United States
Canada
Italy
Netherlands
Sweden
Spain
Switzerland
Germany
France
United Kingdom
Millions of euros
Chart 2
Gap between NBIM's adjusted benchmarkand investment received
United States
Japan
Australia
Canada
India
South Africa
Spain
Russia
Finland
Netherlands
China
Sweden
Switzerland
France
Germany
United Kingdom
Source: Prepared by the authors, with data from FTSE and NBIM (2014)
8,283
7,416
5,764
4,660
4,149
2,595
1,349
1,321
1,050
-1,102
-1,128
-1,206
-1,947
-4,422
-5,066
-23,081
AsiaNorth AmericaEurope Middle East Oceania Latin America Africa
Source: Prepared by the authors, with annual report data from NBIM
Billions of dollars
Chart 3
Distribution of the portfolio by continents
0
100
200
300
400
500
600
2013201220112010200920082007200620052004200320022001200019991998
2013201020052000
Source: Prepared by the authors, with annual report data from NBIM
Chart 4
Changes in top ten investments in Europe
Billions of dollars
0
50
100
150
200
FranceGermanyUK Switzerland Sweden
Spain Finland RussiaNetherland Italy
China Brazil Russia India South Africa
Source: Prepared by the authors, with annual report data from NBIM.
Billions of dollars
Chart 5
GPFG investment in the BRICS
0
5
10
15
20
25
30
2013201220112010200920082007200620052004200320022001
.
.
.
Sovereign Wealth Funds 2014 Equity investments of the Norway’s GPFG: A European sovereign wealth fund for Europe60
5. Equity investments of the Norway’s GPFG: A European sovereign wealth fund for Europe
5.5
2.3
2.2
2.1
0.9
0.8
0.7
0.7
-1.2
-15.7
Source: Prepared by the authors, with data from FTSE and NBIM (2014).
Percentage
Chart 1
Gap between FTSE and NBIM benchmarksfor selected countries
United States
Canada
Italy
Netherlands
Sweden
Spain
Switzerland
Germany
France
United Kingdom
Millions of euros
Chart 2
Gap between NBIM's adjusted benchmarkand investment received
United States
Japan
Australia
Canada
India
South Africa
Spain
Russia
Finland
Netherlands
China
Sweden
Switzerland
France
Germany
United Kingdom
Source: Prepared by the authors, with data from FTSE and NBIM (2014)
8,283
7,416
5,764
4,660
4,149
2,595
1,349
1,321
1,050
-1,102
-1,128
-1,206
-1,947
-4,422
-5,066
-23,081
AsiaNorth AmericaEurope Middle East Oceania Latin America Africa
Source: Prepared by the authors, with annual report data from NBIM
Billions of dollars
Chart 3
Distribution of the portfolio by continents
0
100
200
300
400
500
600
2013201220112010200920082007200620052004200320022001200019991998
2013201020052000
Source: Prepared by the authors, with annual report data from NBIM
Chart 4
Changes in top ten investments in Europe
Billions of dollars
0
50
100
150
200
FranceGermanyUK Switzerland Sweden
Spain Finland RussiaNetherland Italy
China Brazil Russia India South Africa
Source: Prepared by the authors, with annual report data from NBIM.
Billions of dollars
Chart 5
GPFG investment in the BRICS
0
5
10
15
20
25
30
2013201220112010200920082007200620052004200320022001
.
.
.
In 2012 the fund regained its appetite for Spanish equities and
again reached $8 billion in investment, in Banco Santander,
Telefónica and BBVA, each with investments of more than $1 billion.
There were also significant investments in R&D&I-intensive
companies such as Amadeus, with more than $173 million, and
Grifols, with $140 million. This shows the Norwegian fund’s interest
in investing beyond the usual suspects: financial, construction and
energy.
In 2013 the GPFG increased its investment in Spanish equities by
20.1%, from $8.32 billion in 2012 to $9.99 billion in 2013. In total,
at the end of 2013, the Norwegian fund had investments in 73 listed
Spanish companies, compared with 69 in 2012.
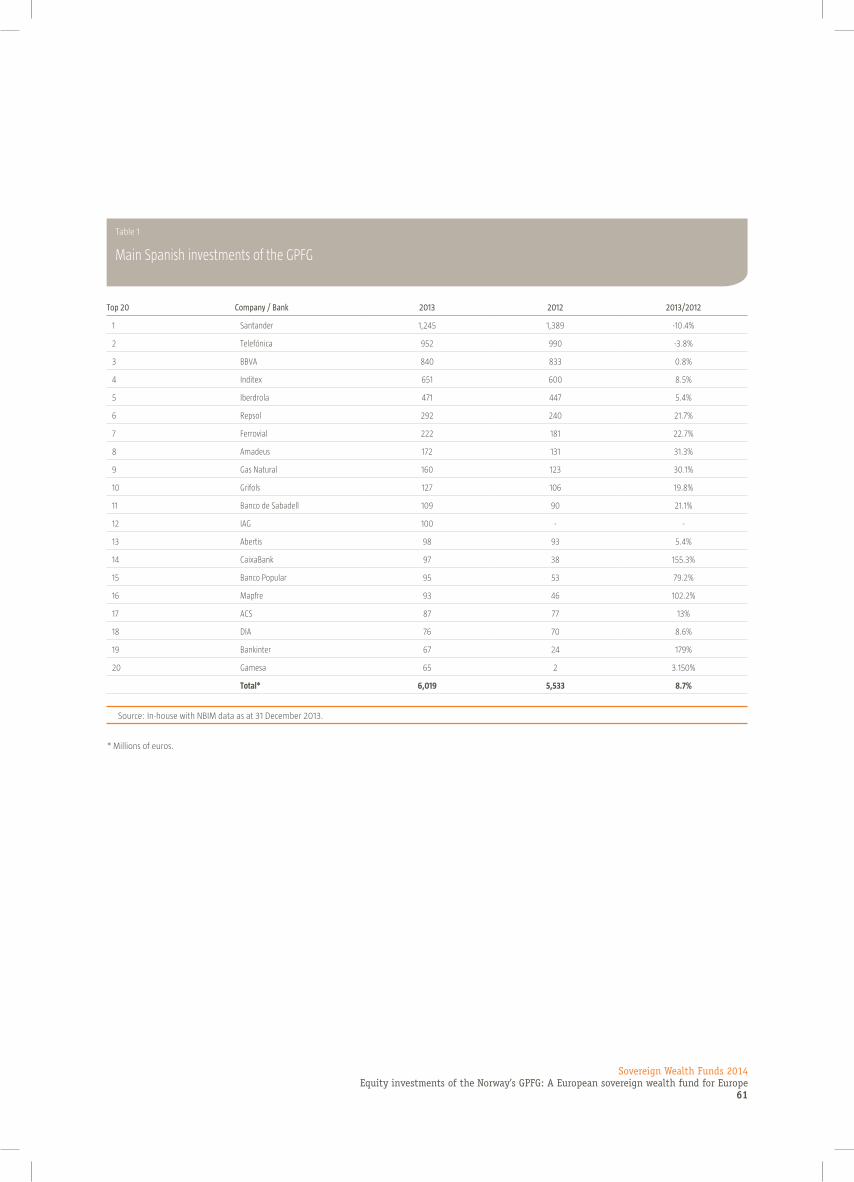
Within the IBEX 35 (see following table in euros) the main
investments continue to be concentrated in Banco Santander
(€1.245 billion), Telefónica (€952 million) and BBVA (€840 million).
However the only one of these in which the fund increased its stake
relative to 2012 was BBVA (up by 0.8%). These multinationals are
followed by others such as Inditex (€651 million), Iberdrola (€471
million) and Repsol (€272 million). The fund increased its
investments in these three relative to 2012.
However the fund did not confine itself to the usual suspects in the
IBEX 35, but took positions beyond them. For example, it made a
strong play on Gamesa, one of the stocks that has performed best
so far in 2014, increasing its investment by 3,150%. Today, GPFG
owns 2.58%, which represents the largest equity holding (relative to
the market capitalization) within Top 20, followed by Ferrovial or
DIA (it controls 1.92%) and Telefónica (1.73%). It also bet on
financial institutions such as Bankinter and CaixaBank, reaching €67
million and €97 million of investment respectively, and Mapfre,
which has a strong presence in Latin America, in which its
investment increased by 102.2% compared with 2012. Furthermore,
the fund also took a position in the group resulting from the merger
of Iberia and British Airways, IAG, in which it invested €100 million.
Sovereign Wealth Funds 2014Equity investments of the Norway’s GPFG: A European sovereign wealth fund for Europe
61
Table 1
Main Spanish investments of the GPFG
Top 20 Company / Bank 2013 2012 2013/2012
1 Santander 1,245 1,389 -10.4%
2 Telefónica 952 990 -3.8%
3 BBVA 840 833 0.8%
4 Inditex 651 600 8.5%
5 Iberdrola 471 447 5.4%
6 Repsol 292 240 21.7%
7 Ferrovial 222 181 22.7%
8 Amadeus 172 131 31.3%
9 Gas Natural 160 123 30.1%
10 Grifols 127 106 19.8%
11 Banco de Sabadell 109 90 21.1%
12 IAG 100 - -
13 Abertis 98 93 5.4%
14 CaixaBank 97 38 155.3%
15 Banco Popular 95 53 79.2%
16 Mapfre 93 46 102.2%
17 ACS 87 77 13%
18 DIA 76 70 8.6%
19 Bankinter 67 24 179%
20 Gamesa 65 2 3.150%
total* 6,019 5,533 8.7%
Source: In-house with NBIM data as at 31 December 2013.
* Millions of euros.