equity in health in tanzania - the network on equity … · project (tehip) had motivated attention...
TRANSCRIPT

Equity in Health in Tanzania:
Translating national goals to district realities
Selemani Mbuyita and Ahmed Makemba
Ifakara Health Research and Development Centre, Tanzania
with the Regional Network for Equity in Health in
East and Southern Africa (EQUINET)
EQUINET DISCUSSION PAPER 54
December 2007
With support from Training and Research Support Centre (TARSC)
and SIDA (Sweden)

1
Table of contents Executive summary.....................................................................2 1. Introduction .............................................................................4 1.1 The context.................................................................................... 5 2. Methods ..................................................................................6 3. Health equity at national level .................................................7 3.1 Country profile ............................................................................... 7 3.2 Health systems profile ................................................................. 13 3.3 Access to health services............................................................ 16 3.4 Fair financing of health services.................................................. 19 3.5 Fair distribution and treatment of health workers ........................ 23 3.6 People centred participatory health systems .............................. 25 4. Features that promote or impede equity in the current health system.......................................................................................29 4.1 Equity promoting features ........................................................... 29 4.2 Equity impeding features............................................................. 29 4.3 Issues for district health systems ................................................ 30 5. Results from district level assessments: Rufiji and Kilombero districts ......................................................................................31 5.1 General profile............................................................................. 31 5.2 Social and community infrastructures ......................................... 32 5.3 Health systems............................................................................ 34 5.4 Community roles and health seeking behaviour ......................... 41 6. Realising equity at district level .............................................42 List of acronyms ........................................................................44 References................................................................................46

2
Executive summary In 2007, the EQUINET steering committee produced a Regional analysis of Equity in Health in East and Southern Africa, that provided evidence of three ways in which “reclaiming” the resources for health can improve health equity: • for poor people to claim a fairer share of national resources to improve their health; • for a more just return for ESA countries from the global economy to increase the
resources for health; and • for a larger share of global and national resources to be invested in redistributive health
systems to overcome the impoverishing effects of ill health. Drawing on a diversity of evidence and experience from the region, the analysis describes the comprehensive, primary health care oriented, people-centred and publicly led health systems that have been found to improve health, particularly for the most disadvantaged people with greatest health needs (EQUINET SC, 2007). The argument is that, in order to improve access to social services including health, and to implement held values of equity, social justice and the right to health, good policies are required. However, good policies and strategies do not imply and guarantee implementation of those policies and strategies - ensuring equity at the same time. As a contribution to this debate, the report unfolds areas where equity is enhanced or impeded and suggests action points towards improvements on health equity. Drawing on the analytic framework of the regional analysis, an analysis of equity in health at district level was implemented in Tanzania, through secondary review and field work. The objectives of this work were: • To examine the economic context for equity in health at district level; • To outline national policies that have impact on health equity, particularly in terms of the
district health systems and particularly the universal, comprehensive, people centred, solidarity and primary health care based features that EQUINET has identified as central to promoting equity.
• To examine the level of equity in financing health, resource allocation to and within the districts and in the adequacy, relevance and distribution of health personnel
• To explore the extent to which the district system is people centred- i.e. primary health care based and providing for meaningful involvement and authority of people;
• To draw conclusions on the key areas where equity is being advanced or impeded based on available evidence and stakeholder views in the district.
The evidence for this was gathered through secondary data review at national level and secondary and primary data collection by interviews with key informants and focus group discussions with community members in Kilombero and Rufiji districts. The later was recommended as one where work such as the Tanzania Essential Health Interventions Project (TEHIP) had motivated attention to equity, while the former was selected as a typical rural district. With limited resources, the selection was made to observe how policies are affected in different settings within the same country. We found a clear policy commitment to equity, the administrative means to implement it and a political stability that enables this. A number of features of Tanzania’s context and health system make reducing differentials in health and access to health care possible, including the investment of debt relief resources in health and education, increased public spending in health, methods for managing external funds that pool resources for wider reallocation to areas of need and a resource allocation formula that considers access, poverty and disease burden in the allocation of resources and provides guidelines for spending to protect areas of equity oriented spending.

3
Having the community level as a cost centre in health financing taking between 10-20 percent of district budgets enables action on community health priorities and needs, and planning tools and district health accounts innovations have been devised to support effective use of these resources. Decentralization policies and the establishment of health facility committees and health boards provide access for community representation in planning and decision making process in the health sector. In the context of a gap between the steady rate of growth in the Tanzania economy and improvements in human development and poverty reduction, the health system is a necessary means to reducing poverty and protecting against impoverishing heath spending. Challenges to playing this role were found in the shortfall and poor distribution of key health workers in rural and remote areas and in primary care levels of the heath system, the costs of care due to transport and costs of care, particularly in the private sector, user fee charges and poorly designed and functioning waiver and incentives systems. Community uptake of services was also found to be limited by poor community knowledge of their entitlements to health care or how to access resources such as waivers and gaps in the use and functioning of participatory mechanisms for participation in health. The review of equity in the two districts confirmed that health improvements are not simply related to aggregate levels of poverty, but are mediated by the distribution of economic and social resources and the actions of health systems. The field assessment found many examples of equity oriented health action, through community roles, health worker activities, health system allocations and the tools and mechanisms for linking resources to health needs. However equity oriented national plans and strategies were not always carried through to district level, such as in the management of waivers and exemptions, the equitable allocation of resources or the involvement of communities in health planning. Good policies also face obstacles at the operational level if other inputs and systems issues are not taken into account. Drug and health worker shortages, delayed disbursement of funds impacted negatively on the delivery of Health Sector Reforms. Some major challenges to health care access emerged, particularly seems the gaps in health workers, cost barriers to services and the communication between health workers and planners and communities. The analysis suggested that the gains of equity oriented policies and improved public financing in health at national level would reach the poorest communities in districts more effectively if clear guidelines and tools were more widely applied to track and allocate all sources of resources to health need, to areas identified in policy (e.g. community and PHC levels) and as priorities by communities; if user charges were removed at point of care, if effective incentives for deployment and retention of health workers identified in districts were more widely applied, and if mechanisms for participatory planning were supported by improved communication, meaningful community consultation in planning and wider civil society involvement to enhance their functioning. We suggest these areas be revisited- to increase the participation of CSOs in policy formulation, implementation and evaluation stages; to revisit the health financing policy in the same way education financing was revised and if possible provide public health services free. Finally, purposeful efforts need to be made to strengthen community participation and enhance accountability through well functioning structures that effectively represent and communicate with communities.

4
1. Introduction The district health equity analysis in Tanzania is being implemented within the regional equity analysis framework of the Regional Network for Equity in health in east and southern Africa (EQUINET). The work aims at drawing together perspective, evidence, experiences, and views, to strengthen dialogue and networking and to build shared learning and analysis in the east and southern Africa region. It further aims at sharing evidence, debates, policies, and programmes relevant to priority health equity issues across the region. The Regional network for Equity in Health in east and southern Africa (EQUINET) is dedicated to influencing and supporting national and regional policies and practices of the countries of east and southern Africa to promote equity in health. EQUINET has identified the major areas of focus to take forward the agenda of “Reclaiming the state, advancing people’s health, challenging injustice” as set at its June 2004 regional conference (EQUINET, 2004a). Focusing on the east and southern African region and drawing on common values of equity, social justice and the right to health - key challenges have been identified to be revitalizing and building national peoples’ health systems that are publicly-funded, comprehensive and building people centred and universal health systems. In 2007, the EQUINET steering committee produced a Regional analysis of Equity in Health in East and Southern Africa, that provided evidence of three ways in which “reclaiming” the resources for health can improve health equity: • for poor people to claim a fairer share of national resources to improve their health; • for a more just return for ESA countries from the global economy to increase the
resources for health; and • for a larger share of global and national resources to be invested in redistributive health
systems to overcome the impoverishing effects of ill health. Drawing on a diversity of evidence and experience from the region, the analysis describes the comprehensive, primary health care oriented, people-centred and publicly led health systems that have been found to improve health, particularly for the most disadvantaged people with greatest health needs (EQUINET SC, 2007). This report of a district health equity analysis in Tanzania is part of the regional equity analysis work undertaken in the region in 2006/7. The report was motivated within EQUINET to better understand the manner in which regional and national trends reflect at district level, how far equity issues at district level are visible at these higher levels and how far policies to address them at global, national and regional levels impact at district level. The report is organised into five sections: • Section one provides the background context and evidence for a district health equity
analysis in Tanzania • Section two presents the methodology used for the analysis • Section three presents national evidence and highlights health equity issues and policies
at national level • Section four presents evidence on areas where equity is advanced or impeded within the
district health system • Section five with presents the conclusions and recommendations. The work was carried out by the Ifakara Health Research and Development Centre (www.ihrdc.or.tz), a non profit, independent, district based health research and resource centre, generating knowledge and information on priority problems in health systems at district, national and international level through research, training and service support and aiming at better health and community development. The work was peer reviewed by TARSC and two external peer reviewers, whose role is gratefully acknowledged. Technical and copy edit of the final report was carried out through Training and Research Support Centre.
5
1.1 The context Tanzania, like many other countries in east and southern Africa, has used policy and programme initiatives to improve access to social services including health, and to implement held values of equity, social justice and the right to health (Mbuyita, 2005). These have responded to both local needs and global agendas. Health equity in this context refers to providing priority to those with greatest needs and those with least ability to pay for health services… while avoiding unnecessary avoidable and unfair differences in health and in access to health care (Loewenson, 1999). For example, regional work in EQUINET has identified the importance of people’s centred health systems and organizing people’s power for health equity (EQUINET SC, 2007). This is also recognized in Tanzania’s Health Sector Reforms, through policy measures to support decentralized planning, active community participation and community ownership and resource mobilisation (MOH, 2002a). Tools were developed to enhance implementation of these ambitions, such as the development and introduction of the Client Service Charter (MOH, 2002b) to inform the public at large as well as the health providers of their rights and obligations in the public health system and to each other. Health financing strategies such as user charges through out of pockets payments, community health funds and health insurance schemes were put in place to facilitate participation of citizens in running of the facilities through cost sharing (MOH, 2003a). District Health Boards and Facility Health Committees were introduced to improve accountability and good governance of the health system and to help manage running of the health facilities (MOH, 2001). There are, however, challenges to translating policy intentions to local practice (Gilson et al 1998). Sometimes in the design of policies equity is a secondary objective (Bennet and Gilson, 2001). The main objective of health financing reforms were to raise more, or more stable, revenues for health care. However some of the policy measures for improving adequacy of financing produce barriers in access to health services by poor people, while not significantly improving resource adequacy. In Kilombero district, for example, revenues collected through user fees contributed less than 7% of total district health budgets (Manzi et al, 2004; Singh, 2003) and the national figure is less than 2% (Mamdani and Bangser, 2004). Hence despite enhanced spending, satisfaction surveys show poorer perceptions of the impacts of reforms in health than in education, where user fees are not applied (REPOA, 2004). Pro-poor policy implementation may be weakened by lack of adequate tools and guidelines for implementation. Exemptions and waivers for cost sharing schemes have been found to be difficult to implement with high implementation costs (MOH, 2006). The mix of financing mechanisms and sources for the health sector has been found to vary between and within regions, with guidelines not available, known or abided to as a means of ensuring policy implementation (Bennett and Gilson, 2001; Manzi et al 2004). There are few tools or guidelines for community participation or for involving communities (TARSC, IHRDC and EQUINET, 2006) resulting in ad hoc means of talking to communities, with scattered efforts and undocumented successes. We use the term “community” in this report to mean people in rural and or marginalized areas who have common geographical (usually villages) and cultural attributes. Barriers exist in how to meaningfully involve and reach communities, particularly in rural and marginalized areas; how to implement and sustain initiatives and how to build strategic management systems to monitor, evaluate and amend them (Lomas et al, 1997). Prior research showed for example that the client service charter is little known to health providers or communities and not well used to empower communities (IHRDC and WHO-AFRO, 2006a). District Health Boards and Health Facility Committees are not well established and

6
in districts where these have been established, do not get regular training and follow up, and are not regularly monitored or evaluated are lacking (MOH, 2006). These gaps between policy and practice may in part arise due to the perceptions and feelings of the implementers. For example, community leaders may be sceptical about community participation for fear of losing their power and authority (MOH and IHRDC, 2005). The EQUINET equity analysis at regional level has pointed to a number of ways of strengthening equity in health, including through: • protecting public health in economic policies and trade agreements through legal and
policy measures; • strengthening financing of public health sectors, with at least 15% of government
spending on health, excluding external financing, debt cancellation and reducing out of pocket financing for health;
• allocating a significantly greater share of health spending to district health systems and to primary health care;
• using incentives to train, retain and ensure effective and motivated work of health workers, and bilateral agreements and compensatory investments to support these incentives; and
• empowering people, stimulating social action and informing and strengthening alliances to advance public interests in health (EQUINET SC, 2007).
The context outlined above indicates that such approaches need to be further explored at district level, to explore: • what the equity challenges are at district level; • how current policies and programmes address these challenges; and • how far equity oriented policies and programmes are implemented and are effective in
addressing equity at district level. A district equity analysis thus provides a means of interrogating the extent to which national and regional trends and policies related to equity have relevance at district level, and what new learning emerges from this district level learning.
2. Methods This analysis was implemented in stages. Desk review was done of secondary evidence from national research institutions and medical schools; civil society, health workers, national and regional state actors, parliamentarians, and others. Positive examples and concrete case studies, evidence and data, experiences and voices from civil society (real stories from community life), ministers and parliament, government commitments, resolutions, photographs and graphics were used as sources of evidence. The district level is the functional unit in Tanzanian health system. Two districts were selected for data collection at district level namely Kilombero and Rufiji. The later was recommended as a district which benefited from the Tanzania Essential Health Interventions Project (TEHIP) with healthy policy and health intervention capacity gains; the former was recommended as a typical rural district that has had no specific interventions outside the existing health system operations. The two districts give a sampled assessment of the conditions and performance of the same policies in different settings within the same country. Following the desk review a further round of data collection was done from health information systems and secondary evidence in the selected sample districts. Evidence in the health information system and held by non government organisations (NGOs) not yet reported or analyzed were gathered, synthesized and analyzed together with policy and programme documents. Key informant interviews were carried out with health and other authorities, health workers, community leaders at national and district level. At national level informants

included heads and in-charges of task group on health sector reforms, council health services boards and community health funds as well as hospital services. At the district level, informants included District medical officers, District executive directors, District planning officers, Council Chairperson and Chair of Social welfare of the respective district councils. A total of 18 focus group discussions were held with women and men in the selected communities to obtain community perceptions and evidence. Mapping, graphical analysis and collection of photos and testimonials on key issues was also carried out. Following the finalisation of this report a summary of the report is being prepared to be used for feedback to the respective districts and communities from which the study was conducted. A summary for national level feedback will also be developed to be used as a policy brief to initiate and stimulate discussion and dialogue on the findings and to stimulate actions to deal with the issues raised.
3. Health equity at national level
3.1 Country profile F The United Republic of Tanzania in East Africa is
bordered by Kenya and Uganda on
the north, Rwanda, Burundi and the Democratic Republic of the Congo on the west, and Zambia, Malawi and Mozambique on the south. To the east it borders the Indian Ocean. Tanzania is divided in 26 regions of which 21 are in the mainland and five on Zanzibar and Pemba islands. There are 121 local authorities, 99 of which are rural and 22 urban. The country had a population of 37.6 millions in 2004 with an annual growth rate of 1.9% in 2000. The majority of the population (80%) is rural, and the population density varies from 1 person per square kilometer in arid regions, to 51 per square kilometer in the mainland's well-watered highlands to as high as 134 per square kilometer on Zanzibar (Wikimedia, 2007 a-i, k). Table 1 shows that population growth has been declininexpectancy at birth has not improved greatly in the periinfant and child mortality. This relatively static life expecchild mortality suggests high levels of adult mortality ov Table 1: Country profile Tanzania, 2000-2004
Social Indicators 2000 Population, total 34.8 millioPopulation growth (annual %) 2.1 Life expectancy at birth (years) 46.8 Total fertility rate, (births / woman) 5.2 Infant mortality rate, /1,000 live births 88.0 Under 5 year mortality rate/ 1,000 141.0 Source: Economy Watch, 2007. As shown in Table 2, HIV and AIDS was the leading cathrough the period 2000-2004, with 29% of mortality attlikely to be the major reason for the early adult mortalityexpectancy noted above. An estimated 2.2 million Tanz400,000-500,000 people were in need of ARVS. Of the
igure 1: Map of Tanzania
7
Source: Wikimedia, 2007j.
g post 2000, and that although life od, total fertility has declined as have tancy in a context of falling infant and er the period.
2003 2004 n 36.9 million 37.6 million
2.0 1.9 46.1 46.2 4.9 4.8 .. 78.4 .. 126.0
use of mortality in 2002, midway ributed to AIDS in 2002. This is thus and relatively constant and low life anians are living with HIV of which $539 million required to buy ARVs for

8
400,000 patients only $100 million was mobilized in 2004. (Meeting 2004:2). A further $7mn was taken from other health related activities, potentially weakening the health sector. Lower respiratory tract infection and malaria constitute the next leading causes of mortality. Notable however is the fact that while communicable diseases constitute the major burden of disease; chronic non communicable diseases such as cerebrovascular disease and ischaemic heart disease also contribute to a significant share of mortality, indicating the joint public health challenge the country faces.
Table 2: Tanzania Causes of deaths for all ages, 2002 Causes Deaths /1000* % Years of life lost
All causes 503 100 100 HIV and AIDS 166 29 29 Lower Respiratory Infection 67 12 13 Malaria 56 10 12 Diarrhoeal Diseases 31 6 6 Perinatal Conditions 24 4 5 Tuberculosis 18 3 3 Cerebrovascular disease 16 3 1 Ischaemic heart disease 14 3 1 Syphilis 11 2 2 Road Traffic Accidents 10 2 2 *Death and DALY estimates by cause 2002. WHO (2002) Within this aggregate picture it is evident that not all people experience this profile equally. As shown in Figure 2 and 3 and in Table 3, infant and child mortality is variably distributed nationally, as are indicators of human development (primary school enrolment, adult literacy, access to safe water). Poverty levels also distribute differently across the country. There is some evidence that the distribution of consumption poverty is associated with measures of human development (Ministry of Planning, Economy and Empowerment, 2005). Districts with higher poverty levels generally have higher infant mortality, while the inverse is true of those districts with lower levels of poverty. Urban districts generally have lower poverty levels and better performance on human development indicators. Equity is thus a concern, with a need to focus on the particular needs of people in particular parts of the country. These inequalities are not only geographically determined. For example the overall adult literacy rate according to 2002 census is 69% for females and 85% for males, indicating gender differentials in a key area of human development. Some of these differentials are now closing with recent widening in access to services. For example literacy is now significantly improved with rates in the 15-24 year age group 92% for both sexes (NBS, 2002). However for the older age population the gender differentials can impact on health and use of heath services and are thus factors to address. Hence while this analysis notes and explores equity issues across districts, it also notes that within districts different social groups will have different health needs.

Figure 3: Distribution of infant mortality, 2005.
F
D(I
igure 2: Poverty levels, 2005
Source: Ministry of Planning, Economy and Empowerment, 2005.
ata suggests that urban populations have a significantly higher level of access to safe water 90%) and sanitation (99%) than rural (57% and 86% respectively) (World Resources nstitute, 2006).
Continued high use of river water. Source: IHRDC, 2003.
9

Table 3: Human development indicators in Tanzania districts, 2002-2004
However the relationship is not completely linear. For example, Table 3 shows that within different levels of poverty, some districts do better or worse. Ukerewe, Musoma, and Banda districts with higher poverty levels rank higher on primary school enrollment for example. The rural areas immediately next to urban areas with higher performance on social indicators do not seem to benefit from this proximity, with districts like rural Bukoba and rural Lindi having poor performance on under five mortality or access to safe water, despite the above average outcomes for the neighbouring urban areas. 10

11
These differentials emerge from economic conditions. Following sluggish growth and poor economic performance in the 1980’s, Tanzania has experienced consistently high rates of growth in recent years with improving average national income (see Table 4). Following its commitment to IMF monitored Enhanced Structural Adjustment Facility (ESAF) in 1996, Tanzania made significant progress in restoring macro economic stability, with a fiscal surplus of 0.8 to I.2% GDP in the four years following and inflation falling from more than 30% in 1995 to 6.6% in early 2000. Foreign reserves increased from 1.5 months of merchandise imports in 1995 to 4.5 months in 2004 (URT, 2002). Sectors such as tourism have grown rapidly in the past 5 years.
Table 4: Country Economic Indicators, 2000-2004 Year Economic indicators
2000 2003 2004 GNI, Atlas method (current US$) 8.9 billion 10.7 billion 11.6 billion GNI, per capital, (current US$) 280.0 310.0 320.0 GDP (Current US$) 9.1 billion 10.3 billion 10.9 billion GDP growth (annual %) 5.1 7.1 6.3 Inflation, GDP deflator (annual %) 7.5 5.7 4.0 Poverty levels (%) 36 30 Source: Economy Watch, 2007; UNDP, 2003. Tanzania is a member of East African Community (EAC), Southern Africa Development Community (SADC) and the Cotonou Agreement, which links European Union and 77 African, Caribbean and Pacific (ACP) countries. This links Tanzania to countries within and beyond the region, such as through the SADC agreements with the Association of South East Asian Nations (ASEAN) and relationships with the Mercado Comun del Sur (MERCOSUR) in the Latin American sub/region. The impact of these indirect trade relationships on the local population are not yet assessed (Matambalya and Admassie, 2002). While the country has the strategic advantage of being a member of various trading blocks, it faces constraints of limited participation of key actors (especially the private sector), lack of pro-active trade policy to address the supply side problems, lack of capacity and key skills for negotiations and relatively weaker initial position in meeting international trade standards (Kweka, 2004). It is suggested that a one-stop-centre for international trade agreements, with wider participation and public debate in understanding and negotiating them and formal training in negotiation skills would be of benefit. Economic policies post 1993 promoted privatisation of state owned companies, from a high share arising from the country’s socialist background to a situation where up to 80% were sold off by the end of 2002. While privatization is considered by many to be a success in Tanzania, with newly privatized companies providing tax, employment and economic returns (OneWorld.net, 2007) there is also debate on the extent to which this has empowered and facilitated local people to participate in ownership of those assets (ibid). Tanzania has received significant levels of Official Development Assistant (ODA), with ODA 80% of the net total inflow of external capital. This suggests that private capital inflows still remain negligible (Wangwe, 1997), limiting the potential for widening access to employment in value added sectors. ODA has thus assumed increasing importance in poverty reduction, shifting from project to program and recurrent budget support and more attention was given to the effectiveness of ODA and its relationship to the microeconomic policy framework. Despite the improving economic performance, poverty levels in 2004 were ‘still very high with the Human Poverty Index (HPI) of 36.3 and 19.9% and 59.7% of its population living under US$ 1 and 2 respectively (EQUINET SC, 2007). One factor in this outcome is the high level
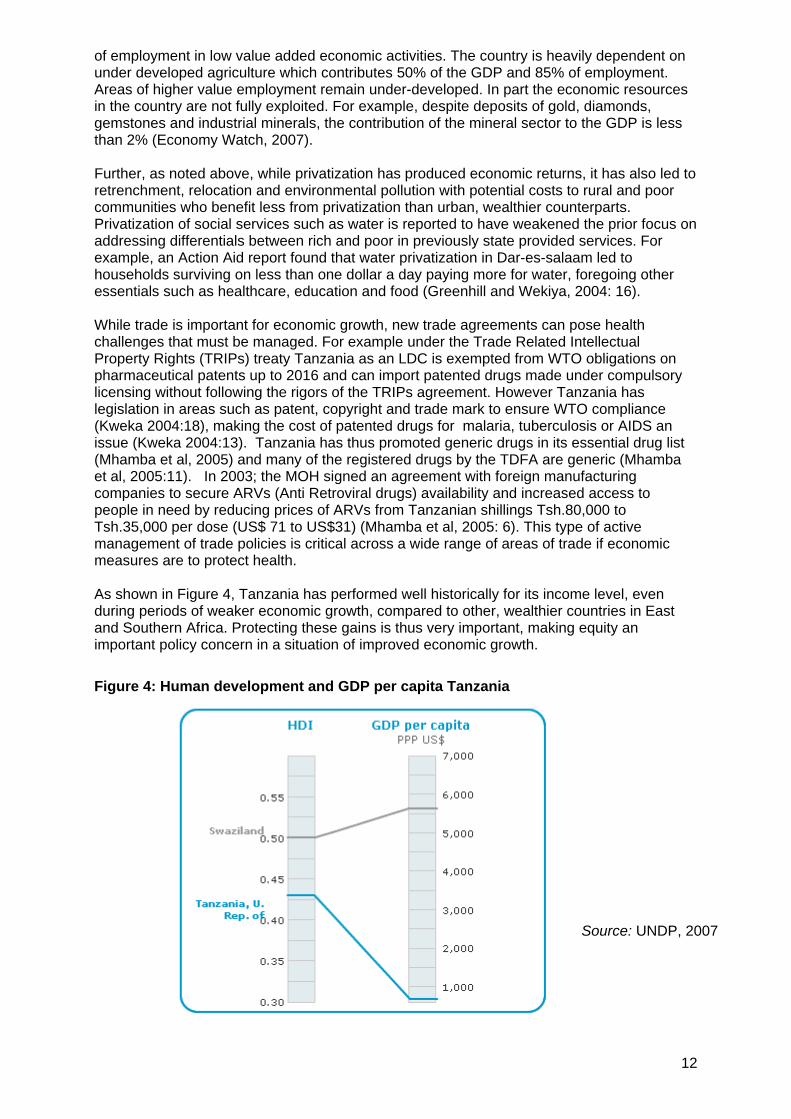
of employment in low value added economic activities. The country is heavily dependent on under developed agriculture which contributes 50% of the GDP and 85% of employment. Areas of higher value employment remain under-developed. In part the economic resources in the country are not fully exploited. For example, despite deposits of gold, diamonds, gemstones and industrial minerals, the contribution of the mineral sector to the GDP is less than 2% (Economy Watch, 2007). Further, as noted above, while privatization has produced economic returns, it has also led to retrenchment, relocation and environmental pollution with potential costs to rural and poor communities who benefit less from privatization than urban, wealthier counterparts. Privatization of social services such as water is reported to have weakened the prior focus on addressing differentials between rich and poor in previously state provided services. For example, an Action Aid report found that water privatization in Dar-es-salaam led to households surviving on less than one dollar a day paying more for water, foregoing other essentials such as healthcare, education and food (Greenhill and Wekiya, 2004: 16). While trade is important for economic growth, new trade agreements can pose health challenges that must be managed. For example under the Trade Related Intellectual Property Rights (TRIPs) treaty Tanzania as an LDC is exempted from WTO obligations on pharmaceutical patents up to 2016 and can import patented drugs made under compulsory licensing without following the rigors of the TRIPs agreement. However Tanzania has legislation in areas such as patent, copyright and trade mark to ensure WTO compliance (Kweka 2004:18), making the cost of patented drugs for malaria, tuberculosis or AIDS an issue (Kweka 2004:13). Tanzania has thus promoted generic drugs in its essential drug list (Mhamba et al, 2005) and many of the registered drugs by the TDFA are generic (Mhamba et al, 2005:11). In 2003; the MOH signed an agreement with foreign manufacturing companies to secure ARVs (Anti Retroviral drugs) availability and increased access to people in need by reducing prices of ARVs from Tanzanian shillings Tsh.80,000 to Tsh.35,000 per dose (US$ 71 to US$31) (Mhamba et al, 2005: 6). This type of active management of trade policies is critical across a wide range of areas of trade if economic measures are to protect health. As shown in Figure 4, Tanzania has performed well historically for its income level, even during periods of weaker economic growth, compared to other, wealthier countries in East and Southern Africa. Protecting these gains is thus very important, making equity an important policy concern in a situation of improved economic growth.
Figure 4: Human development and GDP per capita Tanzania
Source: UNDP, 2007
12

13
This concern is noted in the policies specifically aimed at addressing poverty. Tanzania has formulated a national Poverty Reduction Strategy in 2000 (URT, 2000), followed in 2004 by the National Strategy for Growth and Reduction of Poverty (NSGRP) (NSGRP, 2005), known by its Kiswahili acronym MKUKUTA. There are consultative mechanisms established to enhance local ownership, and encourage broad participation on poverty and related issues. Poverty monitoring is implemented through technical working groups with representations from a wide range of stakeholders. Quarterly Sector Review Meetings and Annual Poverty Reduction Progress Reports involve the participation of relevant stakeholders including NGOs. The National Strategy for Growth and Reduction of Poverty (NSGRP) is the second national strategy that focuses on poverty reduction and the pursuit of the Millennium Goals (MDGs). It aims at achieving equitable and sustainable growth and adopts an outcome based approach in contrast to the priority sector spending approach under the first PRSP. The strategy attempts to pool available resources and direct them to priority areas of poverty eradication.. It points to disparities that disadvantage poor communities and rural areas and the “unequal distribution of resources, inadequate household food security, inadequate caring capacity of the vulnerable groups and inadequacies in quality and quantity of the provision of basic services including health, education, shelter, water and sanitation.” (NSGRP 2005:13). In line with current reforms health has been identified as one of the priority sectors in the poverty reduction efforts within the NSGRP the health sector is expected to increased government funding and share of budget. Specifically in health, the strategy aims at reducing infant mortality, child mortality and malaria that lead into infant and maternal mortality and indicates that addressing equity and access to health service delivery, support and treatment are essential to improve the well being and life expectancy of people living with HIV and AIDS (NSGRP 2005:11). Tanzania has used resources released from debt relief towards improving human development. Before it benefited from debt cancellation, Tanzania spent more money on repaying its debts to rich countries than on education or health care for its people - half of whom are undernourished. When the G8 leaders agreed to cancel $100 billion of debt, Tanzania was one of the first countries to reap the benefits, using the resources saved to undertake major programmes to reduce poverty, including abolishing primary school fees, building new schools and training new teachers (Mkapa, 2005). The abolition of primary school fees led to a 66% increase in attendance (Make Poverty History, undated). There is an important debate about the extent to which the economic policy choices are addressing equitable access to the economic resources for health. The evidence suggests that poverty and inequalities in access to these resources is a significant concern for human development. It also suggests that public policies and spending can make a difference to this, as shown for example in the use of resources from debt relief in education. The rest of this section focuses on this aspect.
3.2 Health systems profile Health systems in Tanzania have been ‘equity oriented’ for over 40 years. The Government of Tanzania adopted the Arusha Declaration in 1967 emphasising health service delivery to the rural population and the beginning of primary health care strategy (Kopoka, 2000). The Decentralization Acts of 1972 and 1982 gave decision making powers to the local authorities and in 1977 Government declared free medical services to all Tanzanians, followed by the expansion of physical infrastructure, health workers and health training institutions (Jibril, 2006). In the same year (1977) the country banned the private practice until the economic and social changes of the 1990s, with the Private Hospital Regulatory Act in 1991(IHRDC and WHO-AFRO, 2006b) and increased investment in private sector services (MOH, 1997; Munishi 1997).
14
Various policies in Tanzania point to this commitment to universal provision of health care with a strong emphasis on access and participation. The National Health Policy (MOH, 2003b) provides the current strategic framework and direction for roles and responsibilities within decentralized health system; the role of the central ministry is policy formulation and quality assurance and the implementation role delegated to council health management teams (CHMTs) at the council level. The policy indicates that there should be community involvement and ownership through active participation in identifying needs, and in planning, implementing, monitoring and evaluating health services. The policy stresses reduction of infant and maternal mortality through provision of an adequate and equitable health service available and accessible to all people. The National Drug Policy (1993) seeks to ensure availability and accessibility of essential drugs and health services near to the people ad the attainment of right to life by ensuring free health services available at affordable costs to the people. The health sector strategy for HIV/AIDS, 2003-2006: (MOH, 2003b) points “to scale up access to HAART stepwise from tertiary centres to district health facilities in the context of training provision, laboratory services strengthened and drug availability”. The National Norms, Guidelines and Standards (NGS) (MOH 2003d) stipulate that “recipients of health services should have their voice heard about their levels of satisfaction and needs in relation to health services: “Health care providers should therefore consult the opinions of clients during the implementing of these norms, guidelines and standards.” The health sector strategic plan (2003-2008) focuses on decentralization and human resources needs at the district level. HSSP (2003c) overall vision is of “assuring quality health services accessible to all Tanzanians and responsive to their needs” where most of the essential health services are provided close to the communities. Quality of service delivery is focused within the context of comprehensive district health planning. Devolution of authority is noted as a means of bringing resources and decision making closer to the people. The plan outlines the need to implement an essential health package according to the local burden of disease in line with available resources. The health system assumes a pyramidal pattern from dispensary to consultant hospital as recommended by health planners (World Bank, 1993; World Bank 1994). The different levels of health care delivery in the country, summarised in Table 4, are: • Preventive services in villages. Each village health post has two village health workers
(one male and one female) chosen by the village government amongst the community and given a short training before they start providing services. Preventive services include health education, monitoring and supervision of hygiene and sanitation activities and maternal and child health services.
• Dispensaries cater for about 6,000 to 10,000 people and supervise the village health posts.
• A health Centre is expected to cater for 50,000 people which is approximately the population of one administrative division. It is expected to provide supervisory role to the dispensaries in its area.
• Each district (with average population of about 250,000) is supposed to have a district hospital. Districts without government hospitals normally negotiate with religious organisations to designate voluntary hospitals and get subventions from the government under contract terms.
• Every region is supposed to have a hospital offering similar services to those agreed at district level, with specialists in various fields and additional referral services.
• There are four referral hospitals namely, the Muhimbili National Hospital which caters for the eastern zone; Kilimanjaro Christian Medical Centre (KCMC) for the Northern zone, Bugando Hospital for the Western zone and Mbeya Hospital which serves the Southern Highlands zone.
The health sector organisation has been affected by on going sector public reforms implemented since 1993 designed to improve the functioning and performance of the health sector and ultimately the health status of the population (Chatora and Tumusiime, 2004).

15
The health sector reform proposals (1994) cover: • decentralisation of health services; • financial reforms focusing on user-charges, introduction of national health insurance
scheme and community health funds; • broadening of partnership base by stressing the public private mix (PPP) and integrating
vertical programs into general health services; and • funding and emphasis on demand oriented research. Table 4 shows the distribution of services by ownership by 2000. It indicates that the southern zone is missing a specialist hospital, and also shows the increased private sector health facilities following the reopening of the health sector to private services.
Table 4: Health facilities by ownership (2000) Agency Facility
Government Parastatal Voluntary/Religious
Private for profit
Others
Consultancy/Specialised Hospitals
4 2 2 0 -
Regional Hospitals 17 0 0 0 -
District Hospitals 55 0 13 0 -
Other Hospitals 2 6 56 20 2
Health Centre 409 6 48 16 -
Dispensaries 2450 202 612 663 28
Specialized Clinics 75 0 4 22 -
Nursing Homes 0 0 0 6 -
Private Laboratories 18 3 9 184 -
Private X-Ray Units 5 3 2 16 1
Source: MOH, 2000. The reforms have promoted public/ private partnership. The private sector at district and lower levels is represented in various committees as full or co-opted members. Government has selected some of faith based hospitals to act as district designated hospitals where there are no government owned hospitals. These hospitals receive 35% of basket fund to assume this role. Government has also included NGOs as cost centres receiving 10% of the budget (MOH 2003a). Table 5 summarizes number of private health facilities by level of care. A higher percentage of private hospitals and health centres are in rural areas compared to urban, while the opposite is true for dispensaries. This figure includes the profit and not for profit facilities.
Table 5: Distribution of private health facilities Rural Urban distribution (%) Level of care Number
Rural Urban Hospitals 121 56 44 Health centers 126 52 48 Dispensaries 134 10 90 Source: MOH, 2007.
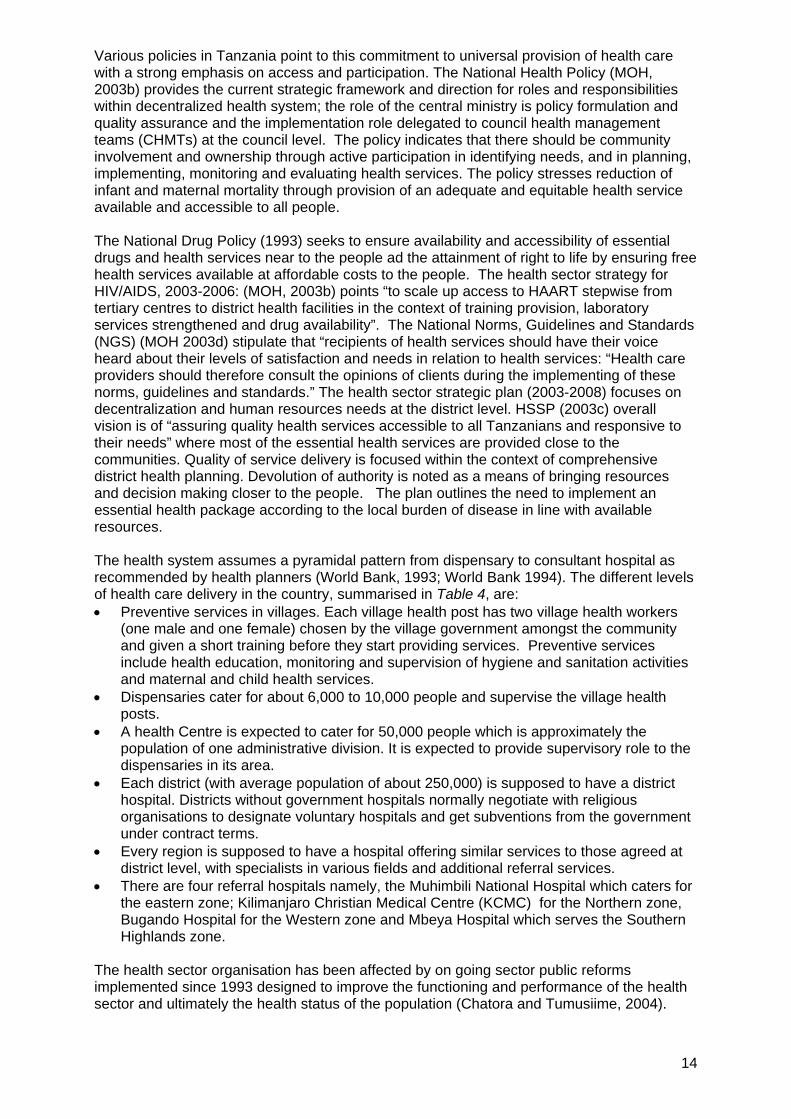
3.3 Access to health services While the supply of services has been widened through public and private sector expansion, access to health care is affected by distance and the cost of transport, the cost of care and the distribution of healthcare financing. According to the figure from National Bureau of Statistics (NBS, 2002) about 70% of the population is within 5km of a health facility and 90% within 10km (Mhamba et al, 2005:4). These figures are encouraging but caution needs to be taken as these national averages hide some disparities. For example, in Rufiji district, poverty mapping of a population of 100,000 people (20,000 households) in the demographic surveillance system showed inequalities in accessing health services in terms of distance between the poorest and the least poor quintiles (De Savingy et al, 2003) (see Figure 5).
Figure 5: Distribution of Travel Times to Health Facilities in the Rufiji DSS by Wealth Quintiles Source: De Savigny et al, 2003. In Rufiji district, average geographic access is good at population level where as the average travel time to health facility is 20 minutes and only 10% of population exceeds 1 hour travel time. A rapid assessment of rural transport in Iringa region showed similar inequalities in distance related access to health care with respect to place of residence (Figures 6 and 7 overleaf). Travelling to health centres is mostly by walking and bicycle. Long distances and poor access to transport increase the costs of seeking care and the difficulty for ill people to access care.
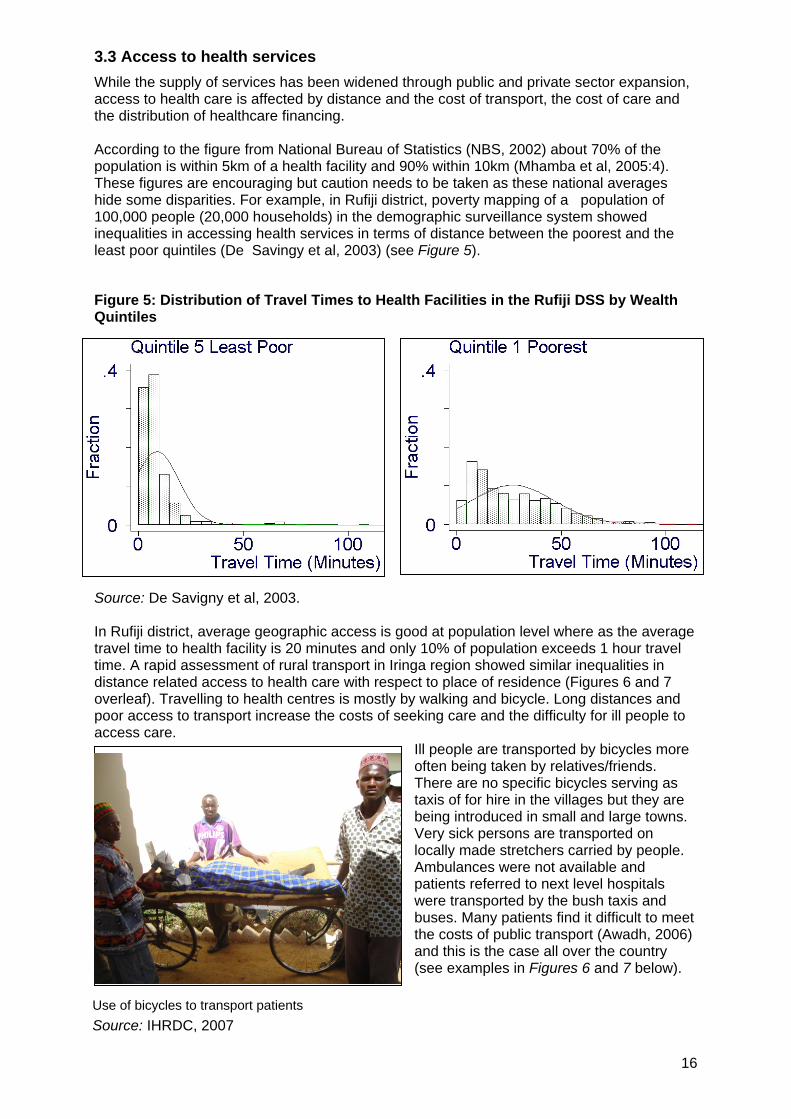
Ill people are transported by bicycles more often being taken by relatives/friends. There are no specific bicycles serving as taxis of for hire in the villages but they are being introduced in small and large towns. Very sick persons are transported on locally made stretchers carried by people. Ambulances were not available and patients referred to next level hospitals were transported by the bush taxis and buses. Many patients find it difficult to meet the costs of public transport (Awadh, 2006) and this is the case all over the country (see examples in Figures 6 and 7 below).
Use of bicycles to transport patients Source: IHRDC, 2007
16

The poorest people are reported to have 3.1 times longer travel times than the least poor. The least poor are reported to be clustered in or near large centres, while the poorest are widely disbursed (De Savigny et al, 2003). Figure 6: An example of transport availability in Iringa district
Source: Awadh, 2006.
Figure 7: An example of means of transport used by purpose in Iringa district
Source: Awadh, 2006. Other factors affect access to services. For the reproductive health services shown in Table 6, rural urban residence affects access, but so too does the education status of a woman. A range of demand and supply side barriers have also been found in surveys: Lower health care consumption by poor people may be explained by a combination of factors, including cost, distance, quality, and ‘social barriers’, as well as demand-side factors. The latter –particularly health beliefs, provider preferences, knowledge and demand (Figure 8) – may be more significant than is commonly supposed. Different policy measures are required to address each of the barriers described (Smithson, 2006).
17

Table 6: Access to reproductive health services by education and residence, 2004
Source: Smithson, 2006 (as analysed from TDHS 2004/05).
Figure 8: Factors explaining barriers to access of health care 1
2
3
4
5
6
7
8
S
Tnqso
.
.
.
.
.
.
.
.
ource: Smithson, 2006.
A delivery room in a rural health facility (left) compared to another in a semi-urban facility located in the premises of the mini state house in Dodoma – Tanzania
Source: IHRDC and WHO-AFRO, 2006a
hese barriers to access indicate that beyond the physical supply of health services, there is eed for public policies to protect against cost barriers to care, and to ensure adequate uality of care such as through the nature and adequacy of health workers. Further demand ide factors call for specific measures to encourage and organize social awareness and use f services, especially in disadvantaged people.
18
19
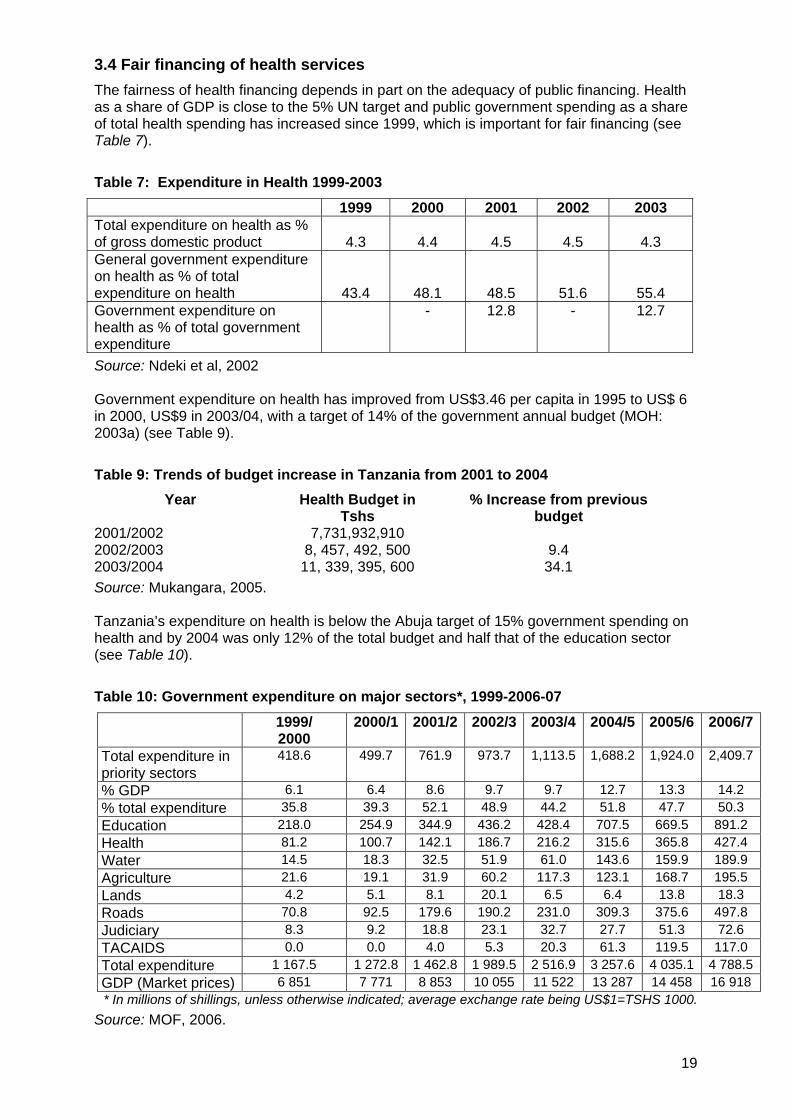
3.4 Fair financing of health services The fairness of health financing depends in part on the adequacy of public financing. Health as a share of GDP is close to the 5% UN target and public government spending as a share of total health spending has increased since 1999, which is important for fair financing (see Table 7).
Table 7: Expenditure in Health 1999-2003
1999 2000 2001 2002 2003 Total expenditure on health as % of gross domestic product 4.3 4.4 4.5 4.5 4.3 General government expenditure on health as % of total expenditure on health 43.4 48.1 48.5 51.6 55.4 Government expenditure on health as % of total government expenditure
- 12.8 - 12.7
Source: Ndeki et al, 2002 Government expenditure on health has improved from US$3.46 per capita in 1995 to US$ 6 in 2000, US$9 in 2003/04, with a target of 14% of the government annual budget (MOH: 2003a) (see Table 9).
Table 9: Trends of budget increase in Tanzania from 2001 to 2004 Year Health Budget in
Tshs % Increase from previous
budget 2001/2002 7,731,932,910 2002/2003 8, 457, 492, 500 9.4 2003/2004 11, 339, 395, 600 34.1 Source: Mukangara, 2005. Tanzania’s expenditure on health is below the Abuja target of 15% government spending on health and by 2004 was only 12% of the total budget and half that of the education sector (see Table 10).
Table 10: Government expenditure on major sectors*, 1999-2006-07 1999/
2000 2000/1 2001/2 2002/3 2003/4 2004/5 2005/6 2006/7
Total expenditure in priority sectors
418.6 499.7 761.9 973.7 1,113.5 1,688.2 1,924.0 2,409.7
% GDP 6.1 6.4 8.6 9.7 9.7 12.7 13.3 14.2 % total expenditure 35.8 39.3 52.1 48.9 44.2 51.8 47.7 50.3 Education 218.0 254.9 344.9 436.2 428.4 707.5 669.5 891.2 Health 81.2 100.7 142.1 186.7 216.2 315.6 365.8 427.4 Water 14.5 18.3 32.5 51.9 61.0 143.6 159.9 189.9 Agriculture 21.6 19.1 31.9 60.2 117.3 123.1 168.7 195.5 Lands 4.2 5.1 8.1 20.1 6.5 6.4 13.8 18.3 Roads 70.8 92.5 179.6 190.2 231.0 309.3 375.6 497.8 Judiciary 8.3 9.2 18.8 23.1 32.7 27.7 51.3 72.6 TACAIDS 0.0 0.0 4.0 5.3 20.3 61.3 119.5 117.0 Total expenditure 1 167.5 1 272.8 1 462.8 1 989.5 2 516.9 3 257.6 4 035.1 4 788.5GDP (Market prices) 6 851 7 771 8 853 10 055 11 522 13 287 14 458 16 918 * In millions of shillings, unless otherwise indicated; average exchange rate being US$1=TSHS 1000.
Source: MOF, 2006.

The health sector in Tanzania has faced budget shortages for many years (Ilomo, 1989). The improvement in public spending is an important potential contribution to addressing this shortfall equitably. In more recent years the opening private sector participation and use contribution of external resources has brought new resources, but raised demands to manage these sectors. In June 2002, Tanzania adopted (Tanzania Assistance Strategy) that provided framework for the management of external resources in collaboration with development partner with the intent of improved effectiveness in aid delivery in a transparency manner and trust between donors and partner government (SWAPs 2005:13). Transparency and Accountability of public expenditure management became the major condition to receive assistance to support the budget in order to improve allocation of resources and efficiency of public expenditures (SWAp 2005:8). The Sector-wide approach (SWAp) is practiced to manage relationships between governments and donors, moving away from the traditional vertical project approach towards broader sector support (World Bank and URT, 2001). These reforms incorporate budgetary frameworks, disease strategies, and policies to guide the new investments. The sector-wide approach aims to increase co-ordination with donors and government for supporting one health sector programme and aims to make systemic improvements, increasing government ownership and supporting rather than fragmenting government systems. Eight donors (DANIDA, DFID, GTZ/KfW, Irish Aid, Netherlands, NORAD, SDC and the World Bank) chose to use a joint funding mechanism - the Health Sector Basket Fund (HSBF) to deliver part of their aid to the health sector. External resources have become less of a dominant share as government expenditures have risen, but out-of-pocket expenditure as a share of total and private expenditure on health is high (Table 8 and Figures 9a-c).
Table 8: Other sources of expenditure on health 1999-2003
External resources for health as % of total
expenditure on health
Social security expenditure on health as
% general govt expenditure on health
Out-of-pocket expenditure as % of private expenditure
on health
1999
2000
2001
2002
2003
1999
2000
2001
2002
2003
1999
2000
2001
2002
2003
29.3 32.1 34.1 29.6 21.9 0 0 5 3.2 2.6 83.5 83.6 83.8 83.5 81.1
Source: Ndeki et al., 2002
Figure 9a: Trend of external resource for health Figure 9b: Trend of government expenditure on heath
External resource for health as % of THE governemnt expenditure as % THE
05
10152025303540
1999 2000 2001 2002 2003
Years
Exte
rnal
reso
urce
s
External resoufor health as %THE
0
10
20
30
40
50
60
1999 2000 2001 2002 2003
Government expenditure on health
Year
s governemntexpenditure as %THE
20

Figure 9c Trend of out of pocket expenditure
Out of pocket expenditure
79.580
80.581
81.582
82.583
83.584
84.5
1999 2000 2001 2002 2003Years
Out
of P
ocke
t exp
endi
ture
Out of pocketexpenditure
Source: Ndeki et al, 2002
In 1993 the government started a phased implementation of user fees for certain health care services that had previously been provided free of charge to citizens in its referral, regional and district hospitals. To ensure that the poorest were not barred from using government hospital care because of their inability to pay, the Ministry of Health developed waiver and exemption guidelines (Newbrander and Sacca, 1996; Mmbuji et al, 1996). Other health care financing mechanisms, alternative to user fees, were established by the Tanzanian government. These include the community health fund (CHF) and national (compulsory) health insurance scheme. All these aimed at ensuring that communities participate in contributing to the cost of provision of some of the health care services sought at government health facilities through direct and /or indirect risk pooling mechanisms (MOH, 1994; MOH, 1997). User fees were introduced in Tanzania in 1993 and community Health Funds was introduced at lowers level in the district councils. A pilot study was conducted in Igunga District for Community health funds in 1996 (MOH, 2005:4). User fee charges were thought to be useful to enable the public sector to provide health care services at lower costs instead of buying them at higher rate in the private sector. In regard to equity principles, it was expected that poor people would benefit more from the government expenditure. Contribution from the community through user fees in health facilities complemented government financing. As a safety net, exemptions were developed with the intention of increasing access of health services to those who cannot afford to pay for the services delivered. The Community Health Fund provided opportunities for community involvement and participation in their own health care. Exemptions and waivers were integrated to the user fees system in 1994. Exemption covers certain population groups such as under 5 children, pregnant women and selected diseases such as typhoid, chronic illness, HIV/AIDS, TB and Leprosy and epidemic. Waivers target the poor and vulnerable based on the ability to pay (MOH, 2005:4). While the exemption and waiver system aimed to protect access to medical services in poor communities challenges remain in their implementation and protection of the targeted group (Manzi et al (2004:13). Evidence from various studies indicate that exemption and waiver mechanisms have problems: • a 1997 study in Kilombero District at the St. Francis Designated Hospital indicated that
there were no clear exemption and waivers guidelines laid out; and • a 1998 study at Mbingu and Sonjo dispensaries revealed that the cost was charged to all
except for the chronically sick and MCH attendances (Manzi et al., 2004:14). A poor auditing system in place led to low accountability and people were poorly informed about the system (Manzi et al., 2004:7).
Poor design and implementation of the scheme, lack of capacity of the village government assigned to execute tasks and limited knowledge of the health workers on how to execute exemptions and waivers were noted problems (Manzi et al., 2004:8).
21

22
Government has used public spending to address inequalities, especially rural-urban, through its resource allocation formula (RAF). The allocation formula applied to the health block grant distributes the grant among local governments based on four allocation factors (MOH, 2003a): • population (70 %) • poverty count (10 %) • district vehicle route (10%) and • under-five mortality (10%). Resource use from block grants have attached conditionalities shown in Tables 9 and 10, to ensure that resources do go to functional areas and levels that support access and use of health services by poor communities and in line with national policies (MoHSW and PORALG, 2004). The formula weights population levels and three further needs categories, namely the special needs of poor population (10% of the grant resources), of rural populations (10%) and of local governments with a higher burden of disease (MOH, 2003b) According to the Burden of Disease Profile the U5M takes up more than 75% of total years of life lost (HERA, 2003). The formula recognizes the higher expenditure needs of rural areas by including the mileage of the route regularly travelled by medical vehicles recognising the higher operational cost of delivering health services to a rural population and to scarcely populated areas; including in drug distribution, immunization and supervision. While these guidelines provide guidance during planning and budgeting, the conditionality attached with them inhibits district flexibility with respect to district specific priorities as one DMO from one of the study districts puts it, “for example, I have some health centres with very high utilization compared to some dispensaries but I can’t play around with these cost centres to assist those health centres hungry for resources although I know that, resources for dispensaries are there and unspent”.
Table 9: Cost centres and allocations for Block Grants
Cost center Allocation range within comprehensive Council Health Plan
District Medical Office 15% -20% Council Hospital, Council Designated Hospital or regional hospital serving as district designated hospital
25% - 35%
Health center (public or of a voluntary agency) 15% - 20% Voluntary agency 10% -15% Dispensary ( public or of a voluntary agency) 15% - 20% Community initiatives 5% - 10% Source: MoHSW and PORALG, 2004.
Table 10: Ranges and guidelines for resource allocation by expenditure type
Type of expenditure Allocation range Example of Expenditure Allowances Maximum 25% Supervision, distribution,
outreach, short trainings Transport Maximum 20% Fuel for supervision, all other
fuel and fares Training Maximum 10% Training at zonal training
centres or Local short term training
Minor repairs/ maintenance 10-20% At health facility level Source: MoHSW and PORALG, 2004.
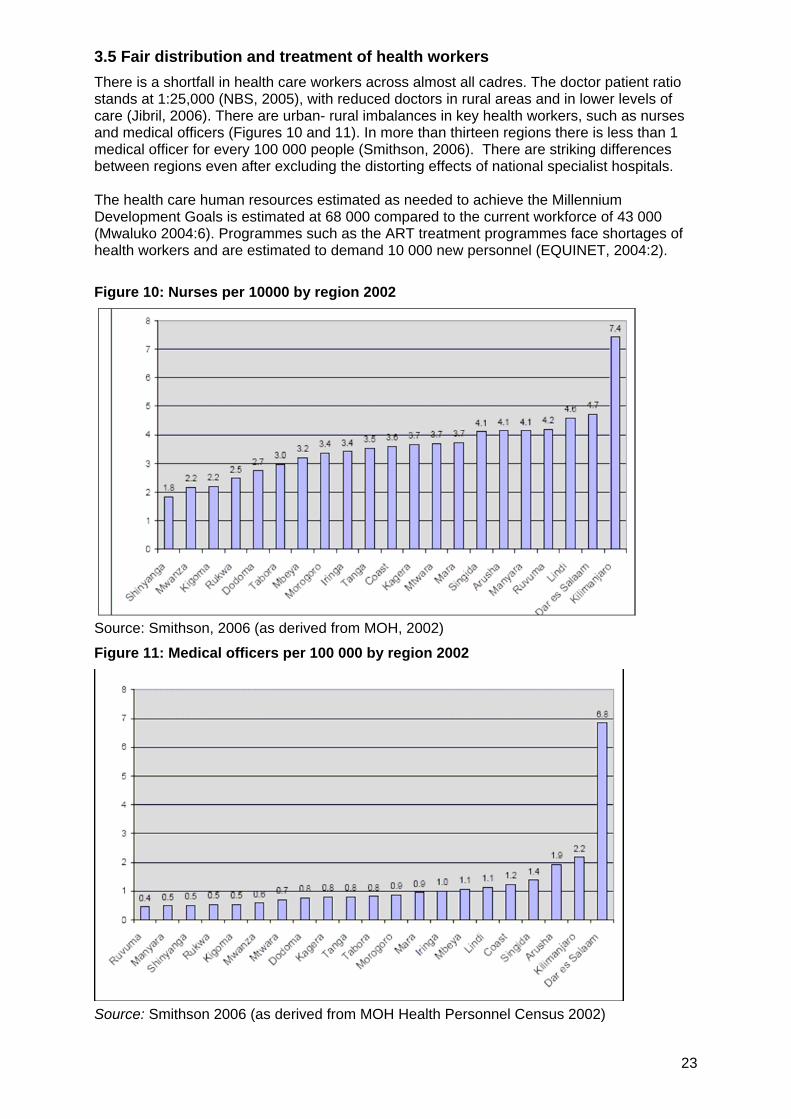
3.5 Fair distribution and treatment of health workers There is a shortfall in health care workers across almost all cadres. The doctor patient ratio stands at 1:25,000 (NBS, 2005), with reduced doctors in rural areas and in lower levels of care (Jibril, 2006). There are urban- rural imbalances in key health workers, such as nurses and medical officers (Figures 10 and 11). In more than thirteen regions there is less than 1 medical officer for every 100 000 people (Smithson, 2006). There are striking differences between regions even after excluding the distorting effects of national specialist hospitals. The health care human resources estimated as needed to achieve the Millennium Development Goals is estimated at 68 000 compared to the current workforce of 43 000 (Mwaluko 2004:6). Programmes such as the ART treatment programmes face shortages of health workers and are estimated to demand 10 000 new personnel (EQUINET, 2004:2).
Figure 10: Nurses per 10000 by region 2002
Source: Smithson, 2006 (as derived from MOH, 2002)
Figure 11: Medical officers per 100 000 by region 2002
Source: Smithson 2006 (as derived from MOH Health Personnel Census 2002)
23

Within regions there are further inequalities and shortfalls within districts and between levels of care. Figures 12a-e depict such this. This shows shortfalls in key categories of personnel for district and primary heath care services, such as nurse midwives, nursing officers and clinical officers. The figures show findings of a 2006 study done in eight regions in Tanzania, that: • staff available was less than the requirement in almost all cadres studied; • rural regions were more poorly staffed than urban regions e.g. Dar-es-salaam has
surplus in almost all the cadres; • the shortages increased at as lower levels of care (Health centres and dispensaries); • 43% of the workforce (dispensaries and health centers) were occupied by less skilled
staff; • medical attendants are three times the requirements; and • the supply through training showed a downward trend (Jibril, 2006). These shortfalls are even more pronounced in the context of the demands for health services due to HIV and AIDS and the impact of AIDS on reduced health workforce availability and performance. Introducing ART in settings where there may be only one doctor for every 10 000 or 20 000 people is a maior challenge, and calls for additional personnel—nurses, laboratory technicians, pharmacists, and counselors—as well as a capacity to provide supporting services such as voluntary counseling and testing (VCT) and the treatment of opportunistic infections (OIs). Very little attention was given to the Human Resource part of health sector reforms until recently, making this an area of important focus for overcoming barriers to health care in poor communities and thus inequalities in access to care. Local government authorities have failed to employ adequate qualified staff and 33% of positions remain vacant; due to inadequate resources and the lack of funded posts (MOH, 2004). Further information is also needed to understand the incentives that would support the retention of health care workers at levels of the health system where they have greatest impact on poorest communities.
Figure 12a: Human resource availability Figure 12b: Human resource supply
STAFFING STATUS GOVERNMENT HOSPITAL KINONDONI DISTRICT
0 10 20 30 40 50 60
Phy sician
AMO General
Clinical Of f icer
Nursing Of f icer
Nurse Midwif e
PHNB
Pharmacist
Pharm Asst
Lab Technician
Lab Asst
H/Secretary
STAFF AVAILABILITY
GAP/SUPLUS
AVAILABLE
REQUIRED
Medical Officers supply 2002 t0 2004 Muhimbili University college
0
20
40
60
80
100
120
2002 2003 2004
years
Nu
mb
er g
rad
uat
ed
Medical Officers
Figure 12c Figure 12d Staffing Status Sumbawanga District -Government Hospital
-100 -50 0 50 100
Physician
AM O General
Clinical Officer
Nursing Officer
Nurse M idwife
PHNB
Pharmacist
Pharm Asst
Lab Technician
Lab Asst
H/Secretary
Staff availability
Gap/SurplusAvailableRequirement
Lab technicians and assistants 2000 to 2004
0
50
100
150
200
250
300
2000 2001 2002 2003 2004
Years
Lab techniciansLab assistant
24
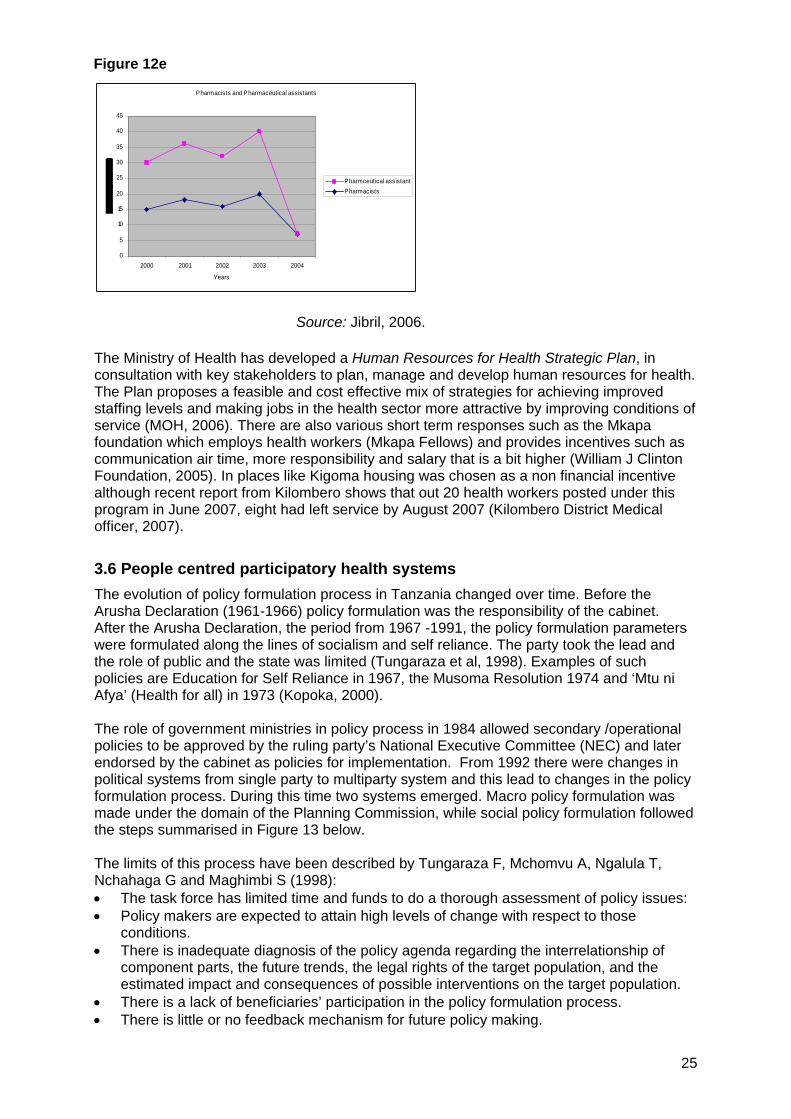
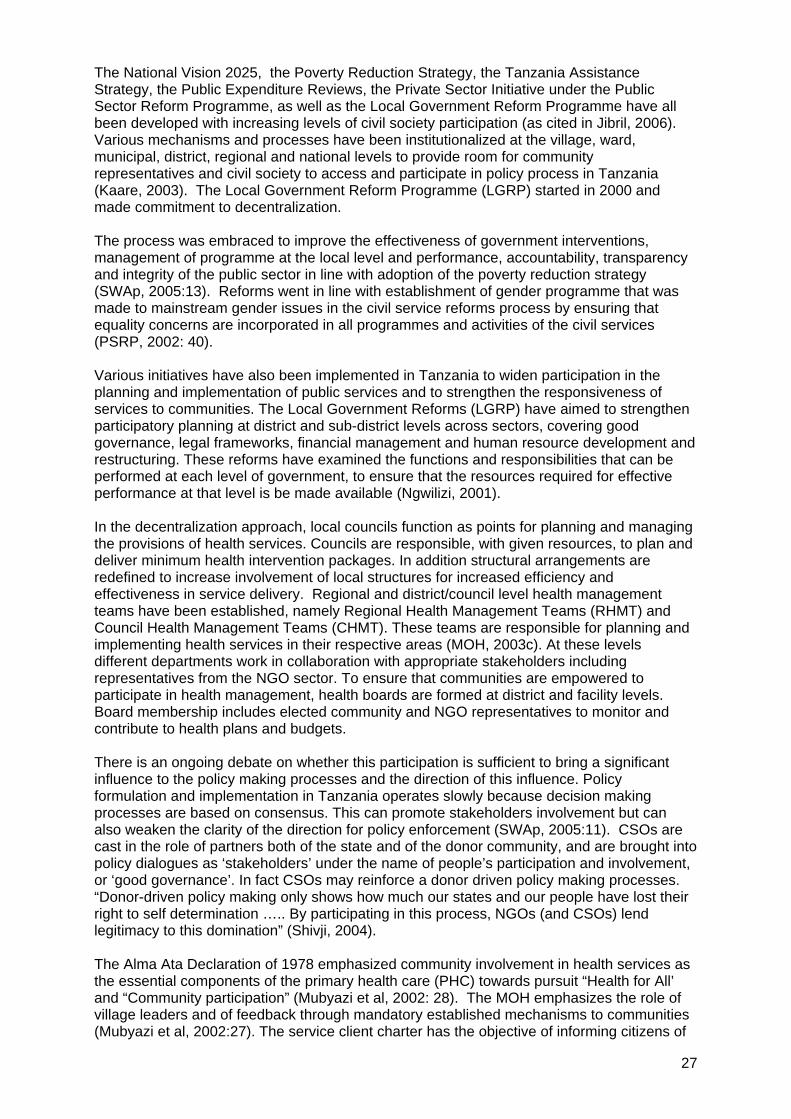
Figure 12e
Pharmacists and Pharmaceutical assistants
0
5
10
15
20
25
30
35
40
45
2000 2001 2002 2003 2004
Years
Pharmceutical assistantPharmacists
Source: Jibril, 2006. The Ministry of Health has developed a Human Resources for Health Strategic Plan, in consultation with key stakeholders to plan, manage and develop human resources for health. The Plan proposes a feasible and cost effective mix of strategies for achieving improved staffing levels and making jobs in the health sector more attractive by improving conditions of service (MOH, 2006). There are also various short term responses such as the Mkapa foundation which employs health workers (Mkapa Fellows) and provides incentives such as communication air time, more responsibility and salary that is a bit higher (William J Clinton Foundation, 2005). In places like Kigoma housing was chosen as a non financial incentive although recent report from Kilombero shows that out 20 health workers posted under this program in June 2007, eight had left service by August 2007 (Kilombero District Medical officer, 2007).
3.6 People centred participatory health systems The evolution of policy formulation process in Tanzania changed over time. Before the Arusha Declaration (1961-1966) policy formulation was the responsibility of the cabinet. After the Arusha Declaration, the period from 1967 -1991, the policy formulation parameters were formulated along the lines of socialism and self reliance. The party took the lead and the role of public and the state was limited (Tungaraza et al, 1998). Examples of such policies are Education for Self Reliance in 1967, the Musoma Resolution 1974 and ‘Mtu ni Afya’ (Health for all) in 1973 (Kopoka, 2000). The role of government ministries in policy process in 1984 allowed secondary /operational policies to be approved by the ruling party’s National Executive Committee (NEC) and later endorsed by the cabinet as policies for implementation. From 1992 there were changes in political systems from single party to multiparty system and this lead to changes in the policy formulation process. During this time two systems emerged. Macro policy formulation was made under the domain of the Planning Commission, while social policy formulation followed the steps summarised in Figure 13 below. The limits of this process have been described by Tungaraza F, Mchomvu A, Ngalula T, Nchahaga G and Maghimbi S (1998): • The task force has limited time and funds to do a thorough assessment of policy issues: • Policy makers are expected to attain high levels of change with respect to those
conditions. • There is inadequate diagnosis of the policy agenda regarding the interrelationship of
component parts, the future trends, the legal rights of the target population, and the estimated impact and consequences of possible interventions on the target population.
• There is a lack of beneficiaries’ participation in the policy formulation process. • There is little or no feedback mechanism for future policy making.
25

More recently, however, there have been changes in the policy process in Tanzania to provide for greater civil society and community participation in policy formulation, implementation, monitoring and evaluation. Major changes began in mid-1990s when the civil society was for the first time recognized as the major stakeholder in policy process in Tanzania. Civil society has been argued to strengthen awareness in communities of rights and entitlements, and links to key areas of oversight of these entitlements, or to policy development around them, such as through parliamentarians (Mukangara 2005:31). Parliamentarians through their committees are set up to track the activities of the government departments and in the sectors such as health, education, agriculture and others. The committee meetings provide opportunities to scrutinize and give the report concerning the activities of the government. Parliamentary committees are responsible for investigating issues and are empowered to summon government officials (Mukangara 2005:31). Parliaments can also scrutinize public spending to ensure implementation of national policy. Parliaments can through budget oversight promote equity in resource allocation, overseeing allocation and spending and assessing how far they support strategic health priorities, such as the 15% government spending on health. This raises the importance of consultation by parliamentarians with communities.
Figure 13: Steps in policy formation in Tanzania
Ministerial Task force (Permanent secretary,
directors plus
Scrutinised to check coherent of goals, objectives
and strategies and whom does the policy target
Initiation
ACTORS
Development
POLICY STAGE
Setting agenda
Ministerial Task force (Permanent secretary,
directors plus professionals)
Fact findings and writing a draft policy
Cabinet Secretariat Comments and Recommendations
Draft Consultation
Inter ministerial Technical Committee
Cabinet Checks political implication and needs for legal
enforcement
Parliament Legal reinforcement
Legitimising the policy
Approval
President or Prime minister or by Sector cabinet
Issuing public statement or actions
ROLE
Source: Ndeki et al, 2002.
26
27
The National Vision 2025, the Poverty Reduction Strategy, the Tanzania Assistance Strategy, the Public Expenditure Reviews, the Private Sector Initiative under the Public Sector Reform Programme, as well as the Local Government Reform Programme have all been developed with increasing levels of civil society participation (as cited in Jibril, 2006). Various mechanisms and processes have been institutionalized at the village, ward, municipal, district, regional and national levels to provide room for community representatives and civil society to access and participate in policy process in Tanzania (Kaare, 2003). The Local Government Reform Programme (LGRP) started in 2000 and made commitment to decentralization. The process was embraced to improve the effectiveness of government interventions, management of programme at the local level and performance, accountability, transparency and integrity of the public sector in line with adoption of the poverty reduction strategy (SWAp, 2005:13). Reforms went in line with establishment of gender programme that was made to mainstream gender issues in the civil service reforms process by ensuring that equality concerns are incorporated in all programmes and activities of the civil services (PSRP, 2002: 40). Various initiatives have also been implemented in Tanzania to widen participation in the planning and implementation of public services and to strengthen the responsiveness of services to communities. The Local Government Reforms (LGRP) have aimed to strengthen participatory planning at district and sub-district levels across sectors, covering good governance, legal frameworks, financial management and human resource development and restructuring. These reforms have examined the functions and responsibilities that can be performed at each level of government, to ensure that the resources required for effective performance at that level is be made available (Ngwilizi, 2001). In the decentralization approach, local councils function as points for planning and managing the provisions of health services. Councils are responsible, with given resources, to plan and deliver minimum health intervention packages. In addition structural arrangements are redefined to increase involvement of local structures for increased efficiency and effectiveness in service delivery. Regional and district/council level health management teams have been established, namely Regional Health Management Teams (RHMT) and Council Health Management Teams (CHMT). These teams are responsible for planning and implementing health services in their respective areas (MOH, 2003c). At these levels different departments work in collaboration with appropriate stakeholders including representatives from the NGO sector. To ensure that communities are empowered to participate in health management, health boards are formed at district and facility levels. Board membership includes elected community and NGO representatives to monitor and contribute to health plans and budgets. There is an ongoing debate on whether this participation is sufficient to bring a significant influence to the policy making processes and the direction of this influence. Policy formulation and implementation in Tanzania operates slowly because decision making processes are based on consensus. This can promote stakeholders involvement but can also weaken the clarity of the direction for policy enforcement (SWAp, 2005:11). CSOs are cast in the role of partners both of the state and of the donor community, and are brought into policy dialogues as ‘stakeholders’ under the name of people’s participation and involvement, or ‘good governance’. In fact CSOs may reinforce a donor driven policy making processes. “Donor-driven policy making only shows how much our states and our people have lost their right to self determination ….. By participating in this process, NGOs (and CSOs) lend legitimacy to this domination” (Shivji, 2004). The Alma Ata Declaration of 1978 emphasized community involvement in health services as the essential components of the primary health care (PHC) towards pursuit “Health for All’ and “Community participation” (Mubyazi et al, 2002: 28). The MOH emphasizes the role of village leaders and of feedback through mandatory established mechanisms to communities (Mubyazi et al, 2002:27). The service client charter has the objective of informing citizens of

their rights and obligations to their health systems as well as the roles and obligations of the health systems to its people. Unfortunately, this has never been sufficiently publicized nor has it been made an official document to hold the health system accountable. There is debate on whether constitutional structures such as district health boards and health facility committees effectively represent people’s voices upwards and hence realize active participation of citizens in policy formulation and implementation. Evidence shows, for example, that most community members are not aware even of their existence (Mubyazi et al, 2007). Other evidence from Rufiji shows positive impacts of CHMTs on district health service quantity, quality and management and on health indicators (Kasale, 2003:6). Greater equity has been possible where districts use a District Health accounts tool that allows CHMTs to integrate all funding into the health plan regardless where funds comes from (multilateral, bilateral, NGO, Government or community sources) and where districts utilize all funding for a single integrated plan. There is also debate on the real points of connection between civil society and the community and their link to policy. At Ward and Municipal Level, the civil society and community may have two access points to policy – through the formation and enactment of by-laws and during planning and budgeting. Civil society and community can access district and municipal levels policy formulation processes through the Council and other-informal channels. The council, which is a body of elected representatives, makes by-laws on the basis of submissions/proposals made by its statutory committees. The current policy reforms have provided room for cooptation of civil society groups into the Statutory Committees of the Council as non-voting members. Unfortunately in all these levels, CSOs’ participation is more “by invitation” rather than by constitutional or government obligation. As a result, one can argue that opportunities for true participation in the initial dialogue of policy drafts is missed and in some cases delayed. Figure 14 below provides a typical example of access nodes for CSOs during budget formulation process giving and evidence to this “participation by merit” (Kaare, 2003). Tanzania’s budget process has been described as lengthy and highly participatory, involving government officials, donors, and the civil society organisations (Ngowi 2005).
Figure 14: Summary of the Budget Preparation Process and CSOs access nodes
Source: Kaare, 2003.28

29
4. Features that promote or impede equity in the current health system The evidence led in the previous section highlights issues in the policy, systems and programme context that advance or impede equity. These are briefly summarised here to set the context for a closer focus at district level in the two sampled districts.
4.1 Equity promoting features Tanzania has a policy commitment to equity and a clear administrative set up which provides a good platform for implementation of formulated policies and interventions. This is further strengthened by a political stability which the country has enjoyed since its independence in 1961. The country is rich in natural resources which if well utilized would contribute significantly to its economic growth and reduce dependency on external funders. A number of features of Tanzania’s context and health system are potential enablers of reducing differentials in health and access to health care, as follows: • A longstanding policy and political commitment to universal access to basic entitlements
and to equity in the country. • Long history of equitable development although with low growth rates. • Debt relief and Poverty reduction strategies that have deliberately focused on absolute
and relative poverty and made investments to reduce inequalities between areas, including through investment in health and education services.
• National Plans and Strategies to improve the delivery and quality of services including to underserved areas and communities.
• A health system structure that provides for access to health care within five kilometres distance.
• Progress towards the Abuja target of 15% government spending on health and an increasing share of public financing in health.
• Methods for managing external funds that pool resources for wider reallocation to areas of need.
• A resource allocation formula that considers access, poverty and disease burden in the allocation of resources and provides guidelines for spending to protect areas of equity oriented spending.
• Community level cost centre in health financing that takes between 10-20 percent of district budget in health for community health priorities.
• Planning tools and district health accounts innovations that pool all sources of district resources and that link district health planning to burden of disease.
• A national strategy to address for shortfalls and provide incentives to retain health workers in key services.
• Policy commitment to participatory planning with processes like the budget process for involvement of civil society, parliaments and the state.
• Decentralization of management and provision of health services for local authorities to manage the health services and involve all providers and communities.
• Health facility committees and health boards that provide access for community representation in planning and decision making process in the health sector.
• Civil society participation to connect community level to national mechanisms.
4.2 Equity impeding features The gap between the steady rate of growth in the Tanzania economy and improvements in human development and poverty reduction are a challenge to equity. We specifically explore than the importance of the health system as an effective means of reducing poverty and protecting against impoverishing heath spending, while also providing a means to redistribute national resources to widen social and economic wellbeing.

30
Section 3 highlighted a number of features of Tanzania’s context and health system that impede or challenge equity or widen differentials in health and access to health care: • wide participation in low value added areas of economic activity reducing incomes in
rural and poor communities; • uneven distribution of economic and human development resources (safe living
environments etc) leading to health inequalities; • high adult mortality due to AIDS and other causes reducing household resources for
health; • inadequate numbers of key health personnel and poor distribution of selected categories
of health workers in rural and remote areas and in primary care levels of the heath system;
• early stages of implementation of strategies to retain health workers at key levels of health systems;
• inequalities in access to health services due to weak transport services, costs of accessing care;
• inequality in the distribution of private for profit sector health services and higher costs of care;
• under funding of health systems weakening delivery on quality health care in lower income communities;
• weak tracking of real allocations of heath resources in relation to policy guidelines; • user fees and poorly designed and functioning waiver and incentives systems posing
barriers to access in poor communities; • poor knowledge in communities of their entitlements to health care or how to access
resources such as waivers; • inadequate resources for fully funding ARV treatment needs and inadequate supply of
essential health workers or resources for prevention and management of HIV and AIDS in rural areas, in public heath care facilities and in remote areas (Hutton 2004:22);
• gaps between the provision of mechanisms for participation of and responsiveness to communities and their use and functioning in districts;
• weak civil society and community links, weak civil society- state links and external funder influence of participatory processes weakening national inputs; and
• communication gaps between health providers and village community levels (Mubyazi et al, 2002:27).
4.3 Issues for district health systems The need for health equity and the policy commitment to health equity in Tanzania is evident. Various potentials and mechanisms exist for this to be translated to district and community level and experiences and examples exist of how this is being done. At the same time various gaps exist between policy and practice that challenge equity in health. The review of current evidence suggests that a focus at district level would be important to assess how far the equity promoting features of health systems are found at that level, how far the equity impeding features are present, and how wide the gaps are between pro-equity policies and their implementation at the district level. The secondary evidence suggests that barriers to equity may exist, such as in how resources are allocated to various targeted groups of the population, in the distribution and role of health workers, and in the extent to which systems and safety nets (such as exemptions and waivers) are protecting poor households. We identify that access is not only an outcome of supply side measures, but also the extent to which people have authority and voice to direct resources towards health needs, or to effectively know about and use services. This leads us to explore at district level how far the features of a people centred health system set in policy commitments are implemented at district level.

5. Results from district level assessments: Rufiji and Kilombero districts This section examines the findings of the field review of Rufiji and Kilombero district health systems in relation to equity features and outcomes. The WHO health systems performance framework defines a health system as all actors, institutions and resources that undertake health actions whose primary intent is to improve health. We therefore examine those aspects of the heath system at district level in these two districts.
5.1 General profile Kilombero district is situated in a wet floodplain, between the Kilombero River in the south-east and the Udzungwa-Mountains in the north-west. On the other side of the Kilombero-River, in the south-east, the floodplain is part of Ulanga district. The Kilombero District is administratively divided into 19 wards: Chisano, Chita, Idete, Ifakara, Kibaoni, Kiberege, Kidatu, Kisawasawa, Lumelo, Mang'ula Masagati, Mbingu, Mchombe, Mkula, Mlimba, Mofu, Sanje, Uchindile, and Utengule. It has an area of 14915sq.km, divided in 5 divisions, 19 wards, 81 villages, 365 hamlets in 43,502 households. Kilombero district has a population of 322,779 with 159,837 female and 162, 942 male and Majority of the wards are rural, with some semi urban wards. The average household size ranges from 5.4 to 3.8 in rural and 4.8 to 4.0 in semi urban wards. Economic activities in Kilombero district include subsistence farming, fishing, lumbering, formal employment and animal husbandry. Cash crops include sugarcane, paddy and banana while food crops are paddy, maize and banana.
Figure 15: Map showing the positions of Rufiji and Kilombero Districts
Source: De Savigny et al, 2003. Rufiji District is one of the six districts in the Coast region. It is situated in the southern part of this region and adjacent to Kilwa and Liwale districts of Lindi region on the southern part and on the western part is adjacent to Morogoro region. Kisarawe and Mkuranga districts are neighboring Rufiji on the northern part while the Indian Ocean is on the eastern side. The size of Rufiji district is 13,339 sq. km. According to 2002 population census Rufiji had a total of 203,102. For 2005 the projected population is 214,794 calculated at 2.9% annual growth rates. The population density is 16 people per square kilometre (NBS, 2002). The district is divided into 19 administrative wards with an average household ranging from 5.2 to 4.0 for rural wards and from 4.7 to 4.4 for semi-urban wards. Rufiji has one division with an urban status and this has average household size of 4.3 persons (Rufiji CCHP, 2005).There are unreliable ferryboats across the Rufiji River. People in Rufiji delta and Coastal zone depend mainly on dhows and canoes as means of transport (Rufiji CCHP, 2005, Rufiji CCHP 2006). 31
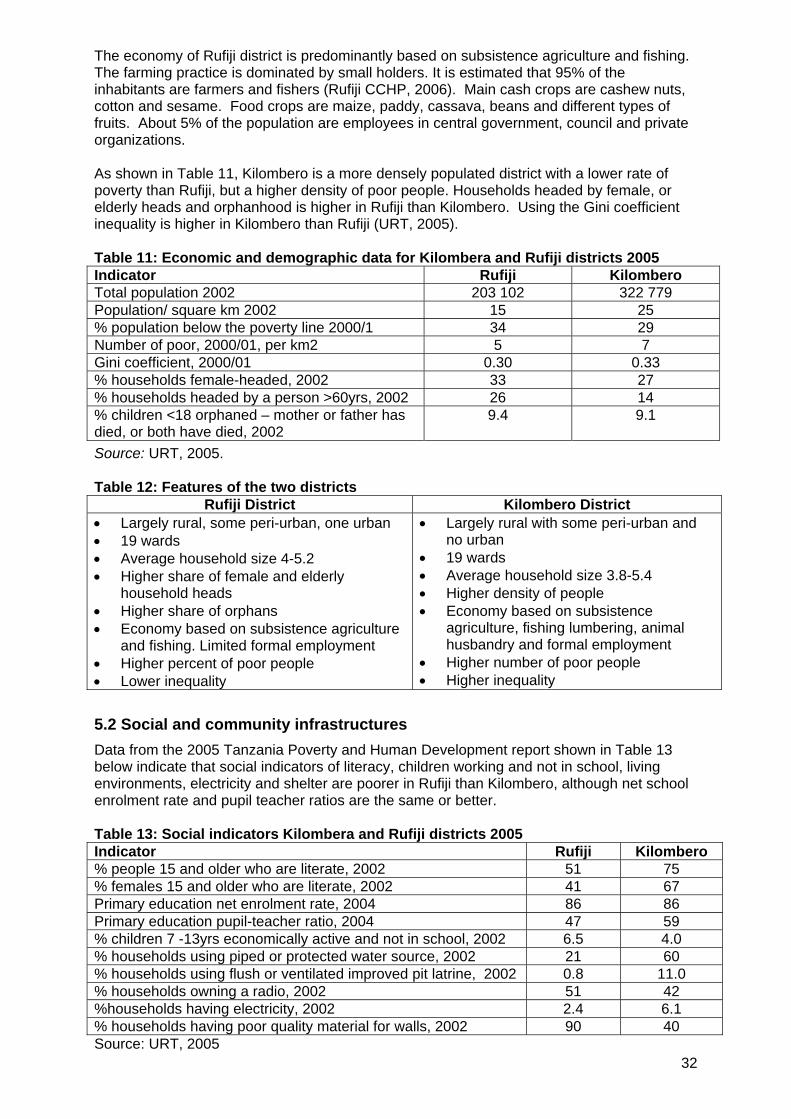
32
The economy of Rufiji district is predominantly based on subsistence agriculture and fishing. The farming practice is dominated by small holders. It is estimated that 95% of the inhabitants are farmers and fishers (Rufiji CCHP, 2006). Main cash crops are cashew nuts, cotton and sesame. Food crops are maize, paddy, cassava, beans and different types of fruits. About 5% of the population are employees in central government, council and private organizations. As shown in Table 11, Kilombero is a more densely populated district with a lower rate of poverty than Rufiji, but a higher density of poor people. Households headed by female, or elderly heads and orphanhood is higher in Rufiji than Kilombero. Using the Gini coefficient inequality is higher in Kilombero than Rufiji (URT, 2005). Table 11: Economic and demographic data for Kilombera and Rufiji districts 2005 Indicator Rufiji Kilombero Total population 2002 203 102 322 779 Population/ square km 2002 15 25 % population below the poverty line 2000/1 34 29 Number of poor, 2000/01, per km2 5 7 Gini coefficient, 2000/01 0.30 0.33 % households female-headed, 2002 33 27 % households headed by a person >60yrs, 2002 26 14 % children <18 orphaned – mother or father has died, or both have died, 2002
9.4 9.1
Source: URT, 2005. Table 12: Features of the two districts
Rufiji District Kilombero District • Largely rural, some peri-urban, one urban • 19 wards • Average household size 4-5.2 • Higher share of female and elderly
household heads • Higher share of orphans • Economy based on subsistence agriculture
and fishing. Limited formal employment • Higher percent of poor people • Lower inequality
• Largely rural with some peri-urban and no urban
• 19 wards • Average household size 3.8-5.4 • Higher density of people • Economy based on subsistence
agriculture, fishing lumbering, animal husbandry and formal employment
• Higher number of poor people • Higher inequality
5.2 Social and community infrastructures Data from the 2005 Tanzania Poverty and Human Development report shown in Table 13 below indicate that social indicators of literacy, children working and not in school, living environments, electricity and shelter are poorer in Rufiji than Kilombero, although net school enrolment rate and pupil teacher ratios are the same or better. Table 13: Social indicators Kilombera and Rufiji districts 2005 Indicator Rufiji Kilombero % people 15 and older who are literate, 2002 51 75 % females 15 and older who are literate, 2002 41 67 Primary education net enrolment rate, 2004 86 86 Primary education pupil-teacher ratio, 2004 47 59 % children 7 -13yrs economically active and not in school, 2002 6.5 4.0 % households using piped or protected water source, 2002 21 60 % households using flush or ventilated improved pit latrine, 2002 0.8 11.0 % households owning a radio, 2002 51 42 %households having electricity, 2002 2.4 6.1 % households having poor quality material for walls, 2002 90 40 Source: URT, 2005

33
Kilombero has 140 primary schools, with 89 of them having pre-primary school classrooms. In 2006, 10 pre primary school classrooms were established and training for pre primary skills conducted for 39 teachers in collaboration with PLAN Morogoro (Kilombero CCHP, 2005). Two of the primary schools are private English medium schools - Lupa (Ifakara town) and Papango (Mlimba Division). The district has near parity in gender attendance. Rufiji’s 111 primary schools are not all registered, with 104 registered and 7 in the process of being registered. There are 9 secondary schools (8 government, and 1 is a private school), and 56 pre-primary schools in the district. As noted above the enrollment rate in Rufiji is as high as Kilombero, despite greater poverty. The introduction of PEDP (Ministry of Education and Culture, 2002) enhanced a greater success in school registration with increasing rates of between 86 and 105% in the district as shown in Table 14.
Table 14: Standard I registration Rufiji, 2001 – 2006
Target Registered Year Boys Girls Total Boys Girls Total %
2001 4540 4083 8623 3905 3525 7430 86.2 2002 4813 4483 9296 5307 4494 9801 105 2003 5996 4608 10602 5309 4847 10156 85.8 2004 4475 3977 8359 4258 4006 8264 98.4 2005 4922 4399 9321 3918 4801 8719 94 2006 3981 3633 7614 4131 3893 8024 105 Source: Rufiji Education Department, 2006 The schools face constraints in essential supplies that challenge the quality of education. As shown in Table 12, classrooms, teacher houses, toilets, stores, tables and chairs are in significant shortfalls in Kilombero. Rufiji has less severe shortages, although it suffers large shortfalls in toilets and desks.
Table 16: School infrastructure – Kilombero and Rufiji districts, 2006
Kilombero district Rufiji district Item Requirements Available Shortage Requirements Available Shortage
Classes 1470 846 554 1157 814 330 Teacher houses
1102 256 818 982 613 363
Toilets (pits) 2851 918 1933 1904 704 1200 Teachers offices
311 154 129 228 145 83
School stores
323 61 262 na na na
Desks 27,625 24,595 3,060 21312 12118 9194 Tables 2,703 973 1,730 1649 728 921 Chairs 2,824 1,047 1,777 1817 680 1137 Kabati 1,688 398 1,290 na na na Na = not available Source: Kilombero Education Department, 2006; Rufiji Education Department, 2006. Table 16 points to evidence that investments in teacher housing and registration in Rufiji have boosted the education services. The shortfall in toilets in schools in both districts is a potential health problem. As shown in Table 13 Rufiji has poorer coverage of safe water, toilets and electricity than Kilombero although a higher share of radio ownership. Kilombero gets its water from 629 tap water points, 108 shallow wells, 8 deep wells and 38 rivers. Rainwater harvesting is also practiced in some of the dispensaries. As noted in Table 17, there is still a significant shortfall on water supply schemes. In Kilombera distrct in 2006,
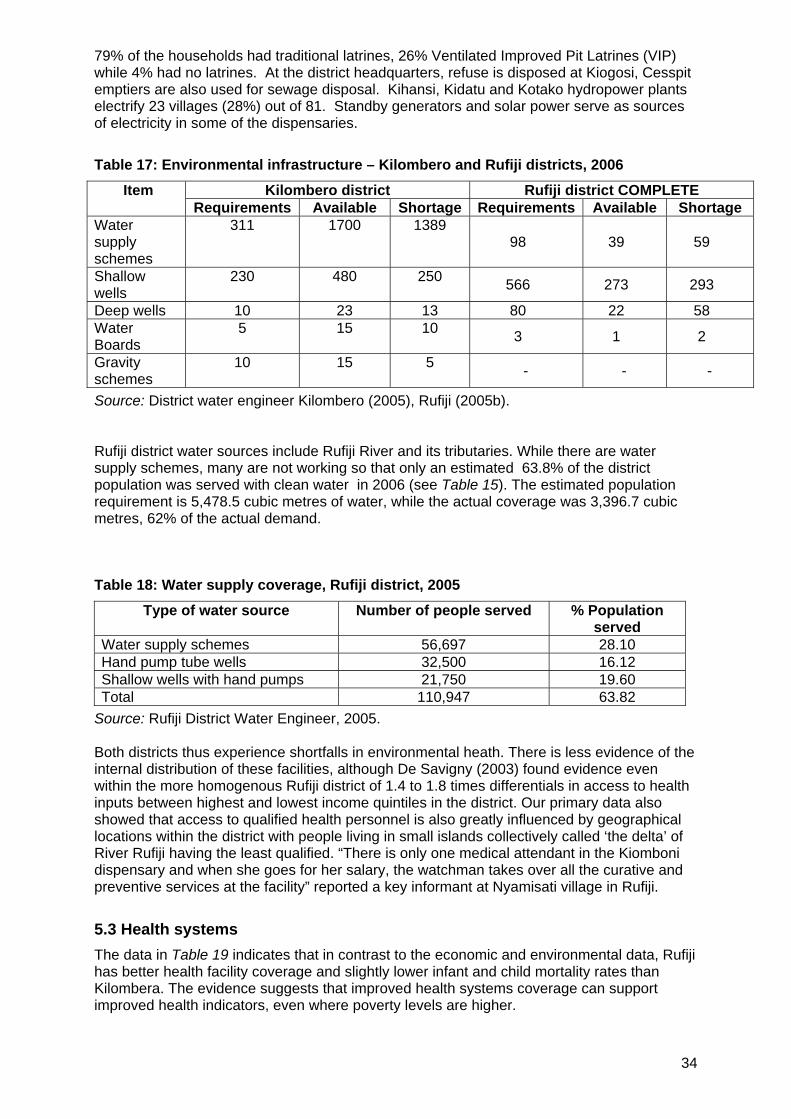
34
79% of the households had traditional latrines, 26% Ventilated Improved Pit Latrines (VIP) while 4% had no latrines. At the district headquarters, refuse is disposed at Kiogosi, Cesspit emptiers are also used for sewage disposal. Kihansi, Kidatu and Kotako hydropower plants electrify 23 villages (28%) out of 81. Standby generators and solar power serve as sources of electricity in some of the dispensaries.
Table 17: Environmental infrastructure – Kilombero and Rufiji districts, 2006
Kilombero district Rufiji district COMPLETE Item Requirements Available Shortage Requirements Available Shortage
Water supply schemes
311 1700 1389 98 39 59
Shallow wells
230 480 250 566 273 293
Deep wells 10 23 13 80 22 58 Water Boards
5 15 10 3 1 2
Gravity schemes
10 15 5 - - -
Source: District water engineer Kilombero (2005), Rufiji (2005b). Rufiji district water sources include Rufiji River and its tributaries. While there are water supply schemes, many are not working so that only an estimated 63.8% of the district population was served with clean water in 2006 (see Table 15). The estimated population requirement is 5,478.5 cubic metres of water, while the actual coverage was 3,396.7 cubic metres, 62% of the actual demand.
Table 18: Water supply coverage, Rufiji district, 2005
Type of water source Number of people served % Population served
Water supply schemes 56,697 28.10 Hand pump tube wells 32,500 16.12 Shallow wells with hand pumps 21,750 19.60 Total 110,947 63.82
Source: Rufiji District Water Engineer, 2005. Both districts thus experience shortfalls in environmental heath. There is less evidence of the internal distribution of these facilities, although De Savigny (2003) found evidence even within the more homogenous Rufiji district of 1.4 to 1.8 times differentials in access to health inputs between highest and lowest income quintiles in the district. Our primary data also showed that access to qualified health personnel is also greatly influenced by geographical locations within the district with people living in small islands collectively called ‘the delta’ of River Rufiji having the least qualified. “There is only one medical attendant in the Kiomboni dispensary and when she goes for her salary, the watchman takes over all the curative and preventive services at the facility” reported a key informant at Nyamisati village in Rufiji.
5.3 Health systems The data in Table 19 indicates that in contrast to the economic and environmental data, Rufiji has better health facility coverage and slightly lower infant and child mortality rates than Kilombera. The evidence suggests that improved health systems coverage can support improved health indicators, even where poverty levels are higher.

35
Table 19: Health data for Kilombera and Rufiji districts 2005
Rufiji Kilombero Infant mortality rate (per 1,000 live births), 2002 97 99 Under-five mortality rate (per 1,000 live births), 2002 158 160 Population per health facility, 2002 3,673 8,934 Number of health facilities per km2 0.004 0.003 Source: URT, 2005. Rufiji district has 61 health facilities: two hospitals - one is government owned and one private; five district council health centres and 54 dispensaries (47 governmental and seven private). Table 20 shows that 70% of government dispensaries were in good condition, and 70% of private - indicating that both are at similar levels (Rufiji CCHP, 2005)
Table 20: Condition of health facilities in Rufiji district
Government facility condition Private facility condition Facility Good Average Bad Good Average Bad
Hospital - 1 1 Health centres 4 Dispensaries 30 10 7 5 2 0
Source: Rufiji CCHP, 2005. In Kilombero health services are provided in 2 hospitals, one religious agency and one privately owned. The former, St. Francis, is the Designated District hospital. There are four government owned health centres (Mang'ula, Mlimba, Kibaoni and Mgenta), and fifteen government, four parastatal, seven private, ten religious and eight NGO/ mission dispensaries. In Kilombero, evidence drawn from the CCHP in 2003, 2004, 2005 and 2006/2007 revealed that the health facilities were undergoing major repair/complete construction using available funds and community contributions. The health centres and dispensaries visited were observed to be in good condition. District officials and community leaders reported that, communities were willing to participate in this exercise as they need services and see the changes as positive. In Rufiji the evidence drawn from the CCHP (2006) revealed that 31.6% of the health facilities are in poor conditions and need major repair or complete reconstruction. All five health centres need some rehabilitation. Currently two dispensaries and the district hospital are under repair/rehabilitation. The physical maintenance depends largely on availability of funds at facility level and community contributions. In both Rufiji and Kilombero the majority of people have access to services within 5km, although not for all. The facility access map shown in Figure 14 shows this distribution for Rufiji, where 88% of the villages and 91% of the population are within five kilometers of health service.

Figure14: Rufiji facility accessibility map
Source: De Savigny et al, 2003. As noted earlier, there are significant gradients in both access and outcome measures across wealth quintiles in Rufiji, even in this relatively homogeneous rural area. Poorest-least poor ratios for infant, child and under-5 mortality were 1.46, 1.41 and 1.53 respectively, while lack of access to mosquito nets was 1.82. Hence even in areas where service provision is better and health indicators generally improved, more attention still needs to be paid to reducing health inequalities, such as through equitable resource allocation within the districts, improvement in the quality of the health services offered to the poor, and ensuring social empowerment to use services. Further, as suggested for Kilombero in Figure 15, the services offered vary across time and potentially in quality.
Figure 15: Interventions at a health centre in Kilombero district
Interventions at health center- Kilombero District
M alaria
M aternal & Child mortality
TB& Leprosy
HIV/AIDS
Dental
Onchocerciasis
Water sanitation & Hygiene
Equipments, construction &Rehabilitation
M ental
Eye-infection
July 06-June 07July 04-June 05January-June 2004January-December 2003
Source: Kilombero CCHP, 2006 Even where facilities are accessible, gaps in health care workers weaken quality of care. The availability of health workers in Kilombero and Rufiji are shown in Figures 16 and 17. Both districts have understaffing in key categories of health workers, indicating that the inequality 36

in access to health personnel in Tanzania is possibly much deeper between districts than within districts, with rural districts more underserved than urban centres.
Figure 16: Health worker availability Kilombero
Human Resource Availability- Kilombero
-20 -10 0 10 20 30
AM O
Clinical Officer
Nurse A.
N/M
PHNB
M CHA
M edical attendant
L. Assistant
Pharm. Assistant
M edical recorder
Dental theurapist
Health Officer
Accounts Assistant
Number available
Overstaffing/ understaffingAstaff availableRequired
Source: Kilombero CCHP, 2006 In Kilombero district semi urban areas such as Kibaoni, Mang’ula health centres have Kilombero Council Health Management Team (2007) reasonable education, water supply, infrastructural and heath services and adequate qualified personnel, compared to the more remote Tanganyika and Masagati where social services and health service resources are poorer. Kiliombero, district officials and health personnel interviewed pointed to shortages of trained clinical officers, nursing officers, nurse midwives, pharmacists, and laboratory technicians. Shortages of health workers were reported to lead to remaining personnel, particularly rural health facilities, working long hours without rest, or to facility closures when workers go for annual leave. The designated district hospital was reported to have unsatisfactory working conditions especially in terms of remuneration and security of tenure. The Kilombero District Medical Officer (DMO) reported that retaining health personnel posted to remote areas was one of the most difficult challenges he faced. For example in 2005/2006, he recruited 24 health personnel but sixteen had left without notice after a year. In Rufiji the CCHP 2006 shows that the district is supposed to have 496 health personnel but it has only 272. Interviews with health personnel indicated shortages of trained health personnel such as Assistant Medical Officers, Nursing officers, Nurse midwife, Pharmacists, Laboratory Technicians and Public Health Nurses for semi urban areas whereas for rural areas demand is mainly for clinical officers, nurse midwives and public health nurses.
37
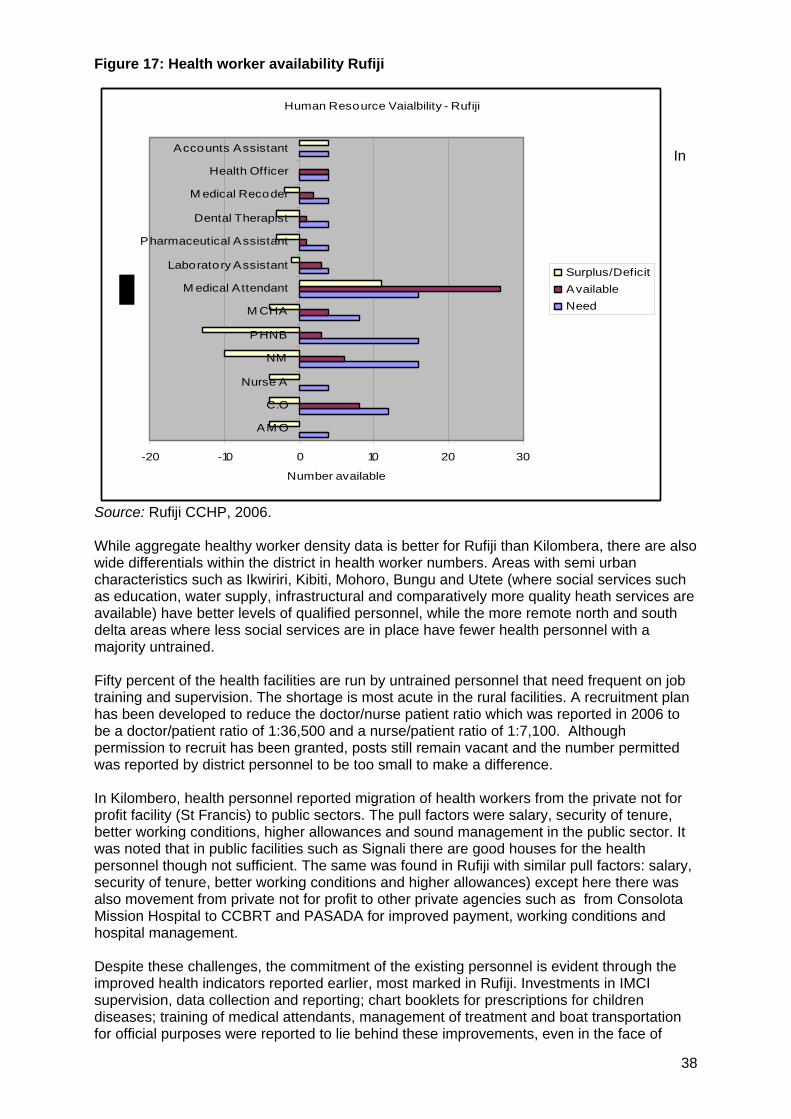
Figure 17: Health worker availability Rufiji
Human Resource Vaialbility - Rufiji
-20 -10 0 10 20 30
AM O
C.O
Nurse A
NM
PHNB
M CHA
M edical Attendant
Laboratory Assistant
Pharmaceutical Assistant
Dental Therapist
M edical Recoder
Health Officer
Accounts Assistant
Number available
Surplus/DeficitAvailableNeed
In
Source: Rufiji CCHP, 2006. While aggregate healthy worker density data is better for Rufiji than Kilombera, there are also wide differentials within the district in health worker numbers. Areas with semi urban characteristics such as Ikwiriri, Kibiti, Mohoro, Bungu and Utete (where social services such as education, water supply, infrastructural and comparatively more quality heath services are available) have better levels of qualified personnel, while the more remote north and south delta areas where less social services are in place have fewer health personnel with a majority untrained. Fifty percent of the health facilities are run by untrained personnel that need frequent on job training and supervision. The shortage is most acute in the rural facilities. A recruitment plan has been developed to reduce the doctor/nurse patient ratio which was reported in 2006 to be a doctor/patient ratio of 1:36,500 and a nurse/patient ratio of 1:7,100. Although permission to recruit has been granted, posts still remain vacant and the number permitted was reported by district personnel to be too small to make a difference. In Kilombero, health personnel reported migration of health workers from the private not for profit facility (St Francis) to public sectors. The pull factors were salary, security of tenure, better working conditions, higher allowances and sound management in the public sector. It was noted that in public facilities such as Signali there are good houses for the health personnel though not sufficient. The same was found in Rufiji with similar pull factors: salary, security of tenure, better working conditions and higher allowances) except here there was also movement from private not for profit to other private agencies such as from Consolota Mission Hospital to CCBRT and PASADA for improved payment, working conditions and hospital management. Despite these challenges, the commitment of the existing personnel is evident through the improved health indicators reported earlier, most marked in Rufiji. Investments in IMCI supervision, data collection and reporting; chart booklets for prescriptions for children diseases; training of medical attendants, management of treatment and boat transportation for official purposes were reported to lie behind these improvements, even in the face of
38

39
gaps in health worker numbers. Kilombero similarly reported the positive effects ion personnel and quality of care of health education i.e. AIDS Control Programme, improved conditions through rehabilitation of health facilities and strengthening the referral services. Health workers in the interviews recommended the following improvements to consolidate good practice:
Rufiji District Kilombero District • Proper monitoring and auditing of
money and ensuring for the money to reach to the right destination.
• A proper upgrading system regardless of the education qualification.
• Health workers to be involved on issues related to funds.
• Health personnel to be involved in planning to fill the gap between policy priorities and implementation.
• Dispensaries propose to have their own account and manage drug supply.
• Council Health Management Team should set particular time for health workers to serve at a particular station especially at the delta area.
• Formal, uniform procedures for the training of health personnel.
• Incentives given to the health workers, i.e. increase of salary.
• Government should increase funds to the district to support allowances for health workers.
• Improve drug supply. • Set reasonable health charges. • Address the insurance scheme non
payment for services. • Allocation of donor funds should be
based on community’s priorities. • Formal uniform procedures for the
training of health personnel.
Focus group discussions with community members revealed that, quality of care is further compromised by the reported poor attitude of some health providers. Community members complained of health workers using abusive language to patients and recommended supervision of health workers to improve quality of care. The evidence on health care use shown in Figure 15 suggests that people use facilities based on the health workers and resources available. For example in Kilombero district interventions such as eye services, mental health, water and sanitation, and HIV and AIDS received low or no allocations and thus provide limited or no services at these levels, so that people experiencing these problems will have to travel further fir health care or use more expensive private services. Both districts reported budgetary constraints. In Rufiji district officials noted that funding for health services is inadequate, little is obtained from fees and council revenues and any income from this is used for procurement of drugs and hospital equipment. The Community Health Fund launched in April 2006 included 50% from external funders and 50% from government. The district officials felt the major resource shortfalls to be in: • shortages of health workers (clinical officers, nurse officer); • shortage of drugs; • shortage of wards for patients admission; • shortage of health training college; and • lack of ambulatory services. The resource allocation over time in Rufiji for different service areas shown in Figure 18 indicates that resources are fluctuating in some priority areas and for some there is a downward trend, with a likely impact on access to services. It may be that areas funded by external funders receive lower resource allocations from government, indicating the importance of district heath accounts to combine all sources of funding in a district.

Figure 18: Resource allocation by priority areas (in Tanzanian Shillings), Rufiji
Resource allocation by Priority Areas- Rufiji
-
50,000,000.00
100,000,000.00
150,000,000.00
200,000,000.00
250,000,000.00
300,000,000.00
2001 2002 2003 2004
Years
Reproductive and child healthHIV/AIDSTBSchool HealthDrugsM alariaHealth Promotion
Source: Rufiji CCHP, 2005. In Kilombero district officials noted that funding for health services is not sufficient to meet health needs, but that through basket funds, contributions from international NGO’s and the Tanzania social Action Fund that they have maintained and improved services in the district, including the rehabilitation of facilities referred to earlier. The Tanzania Social Action Fund (TASAF) contributed to the construction of staff quarters, and external funders have contributed to priority areas such as reproductive and child health services and malaria. In Kilombero district, subsistence farming provides unstable incomes so that people may have difficulty affording services at certain times of year that. With the waiver and exemption policy, 60% of the population are exempt from payment and 40% contribute to the health services. Implementation of the waiver and exemption policy has however been reported to be difficult in the area (Manzi et al, 2003). Interviews with CHMT members revealed that low contributions from the community and late allocation of government funds at times make it difficult to have a predictable flow of resources for primary health care inputs, drug supplies and personnel benefits. Despite this the community has rehabilitated the health centres. In Rufiji, in contrast, while user charges have been introduced at district level and in NGOs’ or private health facilities, all public health centres and dispensaries provide health care free. Interviews with CHMT members revealed that, exemptions and waivers are rarely exercised at the district hospital except for reproductive and child health services and there were no exemption guidelines in place. Kilombero communities generally endorsed removing user fees for services due to the difficulty with the exemption scheme. District officials endorsed removing all charges for health services provision and noted that some civil servants working in rural areas do not benefit from the contribution made through their health insurance schemes, recommending that this also be revisited so that the district services obtain the funds from the schemes. However removing user fees was clearly only one part of the input for improved access. In Rufiji, where services are free at point of care, the community assessment found revealed that there are other quality of care issues to be addressed, including shortages of drugs at primary health level and delays in prescribing and use of drugs. District officials reported that shortages of essential drugs and medical supplies arose from inefficiencies in the Medical Stores Department (MSD).
40

41
Review of local CHMT documents pointed to the profile of common communicable diseases, e.g. malaria and epidemic diseases in the two areas. Key informants in the area reported various barriers to use of heath services. Poor people were reported to tend to ignore their health and not to attend health facilities at the right time either due to lack of awareness or poverty and or both. In both districts shortages of drugs at primary health level was also reported by communities.
5.4 Community roles and health seeking behaviour In Rufiji, health seeking behaviour was reported to be affected by barriers due to poverty and also the decision making power between men and women in the family. As for Kilombero, seasonal economic activities such as small scale farming are carried out by women, and men are predominately engaged in non-farming income generating activities. Unstable income makes it difficult for people to afford the costs of getting to health services and the costs of drugs. Women have weak power to decide on where to take sick people to health facilities and where money to access funds for attending health services in the absence of the men or without men’s consent. In Rufiji, communities reported problems in affording hospital level services due to poverty. While community members primarily blamed cost barriers, health providers pointed to cultural and traditional practices as stronger causes for not seeking care, and reported that communities are willing to spend their earnings for traditional dances, communion and religious celebrations and less so on health. There appears to be a communication gap on the issue between communities and health workers on overcoming the barriers to use of services. Both districts reported community involvement in health services. In Kilombero, communities are represented through health committees from village to district level and participate through quarterly meetings. The CCHP 2003, 2004, 2005, 2006 reports point to community construction of health facilities and staff quarters, digging of wells and protecting of water sources; construction or building of new dispensaries and rehabilitation of old ones. These activities are managed under village authorities and the facility health committee. While these mechanisms and activities were reported to give communities some ownership over the health facilities, there were also reports of communication gaps between health providers and village-community levels. Information flows from health workers to communities through village authorities and health committees at village meetings, but there was report that health workers do not always share information. In fact, there was no evidence in both districts of involvement of communities in dialogue and debate of important issues related to their health or health services. The most common form of participation was through contributions of labour and financial or material resources during facility construction and rehabilitation. In Kilombero district where facility health committees exist, there was no evidence of the community’s involvement in health planning processes except through limited special programmes such as those managed by TASAF or PLAN International. This was also the case in Rufiji. The districts have policies and guidelines for planning using a bottom up approach. In Rufiji the Tanzania Essential Health Intervention Project (TEHIP introduced new planning tools such as the district health accounts and priorities were set in accordance to the magnitude of diseases in the district. In Kilombero district a programme funded by Swiss Development Cooperation had provided capacity building training for health planning. The district health plan is approved by the local authority through its full council. In Rufiji very limited CSO involvement was reported in this process with only one of the 45 registered CSOs participating. In Kilombero slightly more CSO involvement was reported in the planning process, with PLAN and MITIK (two popular NGOs in the district) active in these processes. The district officials in Rufiji reported that the council has been empowered with knowledge and skills on bottom up planning by using Opportunity and Obstacles for Development (O & OD) as well as Participatory Rural Appraisal (PRA) approaches for communities to generate their local ideas and recommendations and to incorporate these into the comprehensive

42
council plan. However there was no record of these inputs being incorporated into district plans, and some report that these plans are edited by district officials and a significant part of the priorities left out. In the local discussions a majority of community members reported low expectations of their inputs being included and thus report becoming less vocal and less demanding. This situation is further intensified by their lack of understanding of their rights, roles and responsibilities. None of the community members (or health personnel in primary facilities visited) knew, for example, about client service charter. The positive contribution of planning using clear tools for mapping resources and needs was evident in Rufiji, as was the positive contribution in both districts of community contributions to improving and using services and of health workers to addressing health service delivery constraints despite shortfalls in numbers and resources. These equity oriented resources are available to both districts. Yet it would seem that they could be more systematically co-ordinated and tapped to make best use of available resources and to address the problems confronting services for remote and poor communities, such as health worker retention, resource mobilization for core services, especially for primary health care. The district analysis shows that inequalities in health, in access to health care and in the distribution of health resources need to be tracked and responded to within districts as much as between districts if health improvements are to be made. The positive impact of health service interventions is evident in the improved heath outcomes in Rufiji despite high poverty levels and poorer environments for health. At the same time the growing gaps in access to care through barriers posed by cost, health worker availability or poor communication point to ways health systems can be strengthened at district level to improve the distribution of health improvements within districts.
6. Realising equity at district level In Section 3 we summarized broadly the facilitators and barriers to heath equity arising from a review of national evidence. Following these issues through to district level showed progress in implementation of equity oriented policies but also gaps. For policy and political commitments to universal access to basic entitlements and to equity in the country to be effectively realised at district level we observed strengths in current practice to build on and weaknesses to address. National Plans and Strategies have played an important role in improving the delivery and quality of services to underserved areas and communities, especially when backed by equitable formulae for allocation of resources. This was not always carried through to district level and can lead to a breakdown of policy intentions at that level. For example poor management of waivers and exemptions can lead to fallout from services of those with greatest need. Where guidelines existed to support equity oriented planning, as in Rufiji, it was more clearly taking place. We therefore suggest that guidelines be made clearer for district levels on identifying and managing inequalities in health within districts, including for allocating resources on the basis of these findings. We also found that good policies might be crippled at the operational level if other inputs and systems issues are not taken into account. For example drug shortage, human resource shortage, delayed disbursement of funds, have been seen to impact negatively the delivery of Health Sector Reforms. Availability of health care seems to be adequate, but greater focus is taking place at district level on rehabilitating service infrastructure, while meeting gaps in health workers, and making services more accessible, more responsive, and removing cost barriers appears to be important for equity.

43
For the gains of improved government spending on health and an increasing share of public financing in health to reach the poorest communities in districts, in an environment of many different types of providers there is need to: • build a district health accounts that tracks all sources of resources for allocation to areas
of need sand uses this in planning; • establish a guide for resource allocation and tracking within the district that ensures that
resources are spent in the areas identified in policy (including community and PHC levels) and that are prioriotised in the burden of disease and by communities;
• track and report to communities on the 10-20 percent of the district budget in health for community health priorities; and
• remove user charges at point of care, especially in the face of poorly managed exemption and waiver schemes. Government needs to revisit the health financing policy in the same way education financing was revised to similarly provide public health services free at point of service.
While a national strategy is needed to address for shortfalls and provide incentives to retain health workers, this is even more urgent at district level, where shortfalls cause service closures or failure to deliver adequate essential care, with costs to poor communities. Incentives for deployment and retention of health workers need to be addressed. Positive examples in the districts included adequate housing and social conditions, good management practices, effective training and supervision, as well as improved incomes and recognition of service in remote areas. This is a matter for all sectors, as migration was noted from private to public and within private services. Incentives that benefit all health workers in a catchment area and a curriculum and orientation of health workers to meet real needs are important. Tapping the resources for health requires participatory planning and capacities to manage this in local and health authorities. While mechanisms existed, poor communication and weak confidence in these undermined their effectiveness, despite the obvious contribution of communities and civil society to health services. Increased participation of CSOs in planning, implementation and evaluation of district plans is needed and CSOs are encouraged to take advantage of the available avenues for this participation at levels closer to communities, and not only at the national level. Both civil society and health and local authorities have obligations to communicate with and strengthen community participation and service accountability. While the mechanisms are there in the health boards and committees, community participation is still largely contribution of resources and labour. This excludes the lowest income groups with greatest poverty. A more interactive and inclusive involvement of communities to identify needs, propose actions and support their implementation may also be more inclusive of less advantaged groups and their needs. This analysis shows that the health sector can address the health impacts of poverty and inequality arising from deeper economic conditions, particularly if policy commitments to equity are made operational at district and community level. The wider challenge is that pointed to by Tanzanian President Jakaya Kikwete – of strengthening capacities to negotiate policies and agreements (Nipashe news, 2007). This challenge needs to be acted on if economic growth paths are to more efficiently yield returns for human development.

44
List of acronyms ACP African, Caribbean and Pacific AIDS Acquired Immune Deficiency Syndrome ARVs Antiretroviral ASEAN Association of South East Asian Nations CCBRT Comprehensive Community Based Rehabilitation Tanzania CCHP Council Comprehensive Health Plan CHF Community Health Fund CHMT Council Health Management Team CSOs Civil Society Organizations DANIDA Danish International Development Agency DFID Department for International Development (UK) DMO District Medical Officer DSS Demographic Surveillance Systems EAC East Africa Community EQUINET Regional network for Equity in Health in east and southern Africa ESAF Enhanced Structural Adjustment Facility ESRF Economic and Social Research Foundation GDP Gross Domestic Product GNI Gross National Income GTZ German Technical Cooperation HAART Highly Active Antiretroviral Therapy HIV Human Immunodeficiency Virus HSBF Health Sector Basket Fund HSSP Health Sector Strategic Plan IHRDC Ifakara Health Research and Development Centre IMCI Integrated Management of Childhood Illness IMF International Monetary Fund ITANs International Trade Agreements and Negotiations KCMC Kilimanjaro Christian Medical Centre LGRP Local Government Reform Programme MCH Mother and Child Health MDGs Millennium Development Goals MERCOSUR Mercado Comun del Sur MOH Ministry of Health MOHSW Ministry of Health and Social Welfare MP Member of Parliament MSD Medical Stores Department MTEF Medium-Term Expenditure Framework NBS National Bureau of Statistics NEC National executive Committee NGO Non Governmental Organizations NGS National Guidelines and Standards NIMR National Institute for Medical Research NORAD Norwegian Agency for Development Cooperation NSGRP National Strategy for Growth and Reduction of Poverty NSGRP National Strategy for Growth and Reduction of Poverty (MKUKUTA) O&OD Opportunities and Obstacles for Development ODA Official Development Assistance OECD Organisation for Economic Co-operation and Development PASADA Pastoral Activities and Services for People with AIDS in Dar es Salaam
Archdiocese PEDP Primary Education Development Plan PER Public Expenditure Review PFP Policy Framework Paper PHC Primary Health Care PHDR Poverty and Human Development Report PORALG Prime Ministers Office, Regional Administration and Local Government PPP Public Private Partnership PRA Participatory Rural Appraisal PRSP Poverty Reduction Strategy Programme RAF Resource Allocation Formula RDSS Rufiji Demographic Surveillance System REPOA Research on Poverty alleviation

45
RHMT Regional Health Management Team SADC Southern Africa Development Community SDC Swiss Agency for Development Cooperation SWAp Sector Wide Approach TACAIDS Tanzania Commission for AIDS TASAF Tanzania Social Action Fund TB Tuberculosis TEHIP Tanzania Essential Health Interventions Project TRIPs Trade Related aspects of Intellectual Property Rights U5M Under-five Mortality URT United Republic of Tanzania USAID United States Agency for International Development VCT Voluntary Counseling and Testing WHO World Health Organization WTO World Trade Organization
Acknowledgements The District health equity analysis was undertaken by Ifakara Health Research and Development Center (IHRDC) under the umbrella of the Regional Network for Equity in Health in East and Southern Africa (EQUINET). We wish to thank the officials at the Ministry of Health and Social Welfare (MOHSW), District Executive Directors (DEDs) and District Medical Officers (DMOs) of Kilombero and Rufiji districts where the study was conducted. We also thank the division, ward and village leaders of the areas involved in the study. Our deep appreciation is to the respondents who voluntarily offered their time for interviews and shared their personal information and who made the survey a success. We are grateful to the residents of Bagamoyo town ward and their leaders who offered us opportunity to pre-test the study tools. We sincerely thank the field team, under the committed supervision of Ms Idda Romore whose devoted efforts and time made the study a success. In a similar line, we sincerely thank Mrs Khadija Kweka for her critical review of the report and her comments which helped to improve the report, as well as the three peer reviewers of the report from TARSC and EQUINET. The support offered by the EQUINET and SIDA for funding the survey is highly appreciated.

46
References 1. Annegien W (2006) ‘The financial impact of formal health insurance schemes: Evidence
from Uganda.’ Vrije Universiteit: Amsterdam, The Netherlands.
2. Awadh A (2006) ‘The rapid assessment of rural transport services in Iringa Region, Tanzania.’ Intermediate Technology Consultants: Dar es Salaam.
3. Bennet S and Gilson L (2001) ‘Health financing: Designing and implementing pro-poor policies.’ DIFID Health Resource Centre: London.
4. Chatora R and Tumusiime P (2004) ‘Health Sector Reform and District Health Systems.’ World Health Organization Regional Office for Africa: Brazzaville.
5. Christian Aid (2004) ‘President of Tanzania praises campaigners,’ Christian Aid Campaigns. Christian Aid: London, available at: http://web.archive.org/web/20060924160315/http://www.christian-aid.org.uk/campaign/debt/040330tanzania.htm
6. Clinton Foundation Tanzania office (2005) ‘President Clinton and President Benjamin Mkapa to Announce Mkapa Medical Fellows Program, July 19 2005,’ http://www.clintonfoundation.org/071905-nr-cf-hs-ai-tza-pr-wjc-and-tanzanian-president-mkapa-announce-medical-fellows-program.htm)
7. De Savigny D, Masanja H, Tanser F, Mwageni E and Minhaj A (2003) ‘Mapping Health Inequalities in the Rufiji DSS Area.’ (Unpublished.) Tanzania Essential Health Intervention Project: Rufiji.
8. Economy Watch (2007) Tanzania Economy. Economy Watch: Janakpuri, New Delhi accessed on 21 January 2007 at http://www.economywatch.com/world_economy/tanzania
9. EQUINET (2004) ‘Country Meeting: Health Systems approaches to treatment access in Tanzania, Dar es Salaam, 26 March 2004,’ EQUINET Meeting Report. EQUINET: Harare.
10. EQUINET and SEATINI (2006) ‘Claiming our Space: Using the flexibilities in the TRIPS agreement to protect access to medicines,’ EQUINET Policy Brief 16. EQUINET: Harare.
11. EQUINET Steering Committee (2007) Reclaiming the Resources for Health: A Regional Analysis of Equity in Health in East and Southern Africa. Fountain Publishers: Kampala, Uganda.
12. EQUINET (2004) ‘Conference resolutions: Reclaiming the state: Advancing people's health, challenging injustice, June 2004, Durban, South Africa.’ EQUINET: Harare.
13. ESA-National Health Accounts Network (2001) ‘National Health Accounts (NHA) in Eastern and Southern Africa (ESA): A comparative Analysis.’ ESA-National Health Accounts Network: Cape Town.
14. Gabriel Mwaluko (2004) ‘ARVs and Rural Communities: A solution or a dilemma?’ (unpublished.) TANESA: Mwanza, Tanzania.
15. Gilson L, Russell S, Rauyajin O (1998) ‘Exempting the poor: A review and evaluation of the Low Income Card Scheme in Thailand,’ PHP Departmental Publication 30. London School of Hygiene and Tropical Medicine: London.
16. Government of Tanzania (2004) ‘Joint External Evaluation of the Health Sector in Tanzania (2004),’ (draft report).
17. Greenhill R and Wekiya I (2004) ‘Turning off the taps: Donor conditionality and water privatisation in Dar es Salaam, Tanzania.’ ActionAid International: Washington DC.
18. Hutton G (2004) ‘Global health initiatives in HIV/AIDS in Tanzania: Situation Analysis and review of key issues,’ A briefing paper established in the frame of the SDC-STI SWAp Mandate 2003-4.

47
19. Hutton G (2005a) ‘The performance and future potential of the user fee exemption and waiver mechanism in Dar es Salaam,’ Public Health Delivery System. Swiss Tropical Institute: Geneva.
20. Hutton G, Weiss S, Forrester Kibuga K, Majapa Z and Mtasiwa D (2005b) ‘Assessment of current application and future potential of user fee exemptions and waivers in the Dar es Salaam Public Health Delivery System’, a paper presented to the 2nd International Conference on Health Financing in Developing Countries in Clermont-Ferrand, 1-2 December 2005.
21. HERA (2003) ‘Technical Review of Health Services Delivery at district level’.
22. Ifakara (2005) Kilombero Comprehensive Council Health Plan (2005). Ifakara: Kilombero, Tanzania.
23. Ifakara (2006) Kilombero Comprehensive Council Health Plan (2006). Ifakara: Kilombero, Tanzania.
24. IHRDC (2003) ‘An Overview of Rufiji Demographic Surveillance System: A presentation to INDEPTH Migration Meeting, South Africa.’
25. IHRDC and WHO-AFRO (2006a) ‘Maternal, Neonatal and Child Health formative research,’ (unpublished final report).
26. IHRDC and WHO-AFRO (2006b) ‘Maternal, neonatal and child health status in Tanzania,’ (unpublished desk review report).
27. IHRDC (2007) ‘Assessment of Child Mortality in Tanzania’, a field report, Dar es Salaam, Tanzania.
28. Ilomo P (1989) ‘An analysis of health financing in Tanzania,’ MA Dissertation. University of Leeds: Leeds, UK.
29. Jibril HE (2006) ‘The status of human resource in the Tanzanian health sector: The case of eight regions,’ (unpublished dissertation for MBA).
30. Kaare S (2003) ‘The policy process and civil society access to that process in Tanzania,’ (unpublished). Economic and Social Research Foundation (ESRF): Dar Es Salam, Tanzania.
31. Kasale H (2003) ‘District Strengthening in Tanzania: Tanzania Essential Health Interventions Project, Tools and Experiences, a paper presented to the Conference on public Health in Cape Town, South Africa, March 24-26, 2003.
32. Kilombero District Council (2005b) Reports of the District Water Engineer (2005/06). Kilombero District Council: Kilombero. Tanzania.
33. Kilombero District Council (2005c) Reports of Kilombero Education Department (2005/06). Kilombero District Council: Kilombero, Tanzania.
34. Kilombero District Medical Officer (2007) ‘ Report to district councilors during introduction and sensitization of the EMPOWER project for reduction of maternal and neonatal mortality in Tanzania, Ifakara – Kilombero District Health Management Team, Tanzania.
35. Kopoka PA (2000) Provision of health services in Tanzania in the twenty first century: Lessons from the past. University of Dar Es Salaam, Institute of Development Studies: Dar es Salaam.
36. Kweka Josephat (2004) ‘Impact of international trade agreements on Tanzania’s trade performance’ ESRF unpublished, Dar es Salaam, Tanzania.
37. Loewenson R (1999) ‘Can research fill the equity gap in southern Africa?’ EQUINET Policy series 1. EQUINET: Harare.
38. Lomas J, Woods J, Veenstra G (1997) ‘Devolving authority for health care in Canada’s provinces: An introduction to the issues, Canadian Medical Association Journal 156: 371-7.

48
39. Make Poverty History (undated) ‘Drop the debt.’ What Do We Want? Make Poverty History: London, accessed on 4 May 2007 at http://www.makepovertyhistory.org/whatwewant/debt.shtml
40. Mamdani M and Bangser M (2004) ‘Poor people’s experiences of health services in Tanzania – A literature review.’ Women Dignity Project: Tanzania.
41. Manzi S, Mbuyita S and Urassa H (2004) ‘Development of a standardised exemption mechanism for Kilombero Council Health Management Team/SDD,’ (unpublished.) IHRDC: Tanzania.
42. Matambalya F (2002) ‘Tanzania and Regional Trade Agreements’, Department of Marketing, University of Dar es Salaam: Dar es Salaam.
43. Matambalya F and Admassie A (2002) ‘Technical efficiency in small and medium scale enterprises: Evidences from a survey of enterprises in Tanzania, East Africa,’ Eastern Africa Social Science Research Review 17(2): 1-29
44. Mbuyita S (2005) ‘One ill, all ill’, Report on Individual Households Interviews on Cost of Illness in Lindi Rural District. IHRDC and Save the Children (UK): Tanzania.
45. Mhamba R, Ezekiel M and Shemdoe G (2005) ‘Protecting rights of access to essential medicines under trade and market policies: The Tanzania case study’, (unpublished EQUINET capacity building paper.) EQUINET: Harare.
46. Ministry of Finance (2006) Budget Digest June 2006. United Republic of Tanzania: Dar Es Salaam.
47. Ministry of Planning, Economy and Empowerment (2005) ‘Poverty and human development report’, Brief 2: Poverty at the District Level in Mainland Tanzania. The Research and Analysis Technical Working Group of the MKUKUTA Monitoring System, Ministry of Planning, Economy and Empowerment: Dar es Salaam, Tanzania.
48. Mkapa B (President) (2005) ‘The address of President of Tanzania to Jubilee Debt Campaign's annual conference, 26 February 2005, London http://www.jubileedebtcampaign.org.uk/?lid=560
49. Mkopi A and Mtenga S (2005) ‘TB and HIV/AIDS survey report in Kilombero and Ulanga Districts,’ (unpublished.). Ifakara: Tanzania.
50. Mmbuji P, Ilomo P and Nswilla A (1996) ‘Implementation of health service user fees in Tanzania: an evaluation of progress and potential impact.’ Ministry of Health, Cost-sharing Implementation Unit: Dar Es Salaam, Tanzania.
51. MOH (1993) ‘National Drug Policy.’ Ministry of Health: Dar Es Salaam, Tanzania.
52. MOH (1994) ‘Proposals for Health Sector Reform.’ Ministry of Health: Dar Es Salaam, Tanzania.
53. MOH (1996) ‘Health Sector Reform Plan of Action 1996-1999.’ Ministry of Health: Dar es Salaam.
54. MOH (1997) ‘Report of Health Sector Reform Program of Work 1998/99-2000/2001’, (unpublished.) Ministry of Health: Dar Es Salaam, Tanzania.
55. MOH (2000) ‘National Package of Essential Health Interventions in Tanzania.’ Ministry of Health: Dar es Salaam.
56. MOH (2001) ‘Council Health Service Board Establishment Instrument: A Model Instrument.’ Ministry of Health: Dar es Salaam.
57. MOH (2001) ‘Nationa Health Accounts.’ Ministry of Health: Dar es Salaam.
58. MOH (2002b) ‘The Client Service Charter.’ Ministry of Health: Dar es Salaam.
59. MOH (2003a) ‘Resources Allocation Formula for Health Basket Fund.’ Ministry of Health: Dar es Salaam.
60. MOH (2003b) National Health Policy.’ Ministry of Health: Dar es Salaam.

49
61. MOH (2003c) ‘Second Health Sector Strategic Plan (HSSP): Reforms towards delivering quality health services and clients satisfaction.’ Ministry of Health: Dar es Salaam.
62. MOH (2003d) ‘National Norms, Guidelines and Standards (NGS) in Crossing-Cutting Issues for Health Care Practice in Tanzania.’ Ministry of Health: Dar es Salaam.
63. MOH (2005) ‘Health Financing workshop: a synthesis of key points.’ Ministry of Health: Dar es Salaam.
64. MOH (2006) ‘Human Resource for Health – Strategic Plan.’ Ministry of Health: Dar es Salaam.
65. MOH (2005) Health Facilities. URT: Dar es Salaam accessed on http://www.moh.go.tz/health%20facilities.php
66. MOH and IHRDC (2005). The Community Voice: An Operational Manual for District Management Teams.’ Ministry of Health: Dar es Salaam.
67. MOHSW and PORALG (2004) ‘Health Basket & Health Block grants, Guidelines for the Disbursement of funds, preparation of Comprehensive Council Health Plans, Financial and Technical Reports and Rehabilitation of PHC Facilities by Council.’ Ministry of Health: Dar es Salaam.
68. Ministry of Education and Culture (2002) The Primary Education Development Plan (2002-2004). Ministry of Education and Culture: Dar Es Salaam, Tanzania.
69. Mubyazi G, Mushi A, Mutagwaba D, Shayo E, Ikingura J, Mdira K, Kato J and Malecela M (2002) ‘Local Primary Health Care Committee and Community Based Health Workers in Mkuranga District, Tanzania: Does the public recognize and appreciate them?’ Ethno-Med 8.
70. Mubyazi G, Mushi AK, Shayo E, Mdira K, Ikingura J, Mutagwaba D, Malecela M and Njunwa KJ (2007) ‘Local Primary Health Care Committees and Community-Based Health Workers in Mkuranga District, Tanzania: Does the Public Recognise and Appreciate Them?’ Ethno-Med 1(1): 27-35.
71. Mukangara D (2005) Strengthening Parliamentary Democracy in SADC Countries: Tanzania Country Report. The southern African Institute of International Affairs: South Africa.
72. Munishi GK (1997) ‘Private health sector growth following liberalization in Tanzania.’ IHPP: Washington DC.
73. Mushi A, Victora C, Schellenberg D, Savigny D, Mshinda H, Bryce J and Schellenberg J (2003) ‘Inequities among the very poor: Health care for children in rural southern Tanzania,’ The Lancet 361 (9357): 561-566.
74. Mwageni E, Masanja H, Juma Z, Momburi D , Mkilindi Y, Mbuya C, Kasale H, Reid G, de Savigny D (2003) ‘Socio-economic Status and Health Inequalities in Rural Tanzania: Evidence from the Rufiji Demographic Surveillance System.’
75. NBS (2002) National Population Census. Government of the United Republic of Tanzania: Dar es Salaam.
76. Ndeki S, Kweka H and Mwesiga J (2002) ‘The Role of NGOs in Health and Health Care in Tanzania and Uganda,’ (unpublished report.)
77. Newbrander W and Sacca S (1996) ‘Equity experience in Tanzania: Cost sharing and access to health, care for the poor,’ Draft report submitted to the Ministry of Health, Tanzania and the USAID Africa Bureau.
78. Ngowi D (2005) Effects of Budgetary Process Reforms on Economic Governance: Evidence from Tanzania. Economic and Social Research Foundation: Dar Es Salaam, Tanzania.
79. Ngwilizi H (2001) ‘Decentralization in Tanzania,’ A paper submitted at the UNCDF Conference on Decentralization and Local Government in Africa, Cape Town, 26-30 March 2001.

50
80. Nipashe news (2007), ‘Rais ataka viongozi wetu kujengewa uwezo zaidi wa kujadili mikataba’, 16 May 2007, Dare Es Salaam, Tanzania.
81. OneWorld.net (2007) Tanzania guide. OneWorld.net: London, accessed on 20 January 2007 at http://uk.oneworld.net/guides/tanzania/development/
82. Partners for Health Reform plus (2002) Insights for Implementers: Decentralization and Health System Reforms.
83. President’s Office Civil Service Department (2002) Public Service Reform Programme (2000-2011). United Republic of Tanzania: Dar es Salaam.
84. REPOA (2004) ‘Policy and service satisfaction survey,’ (unpublished report.)
85. Research and Analysis Working Group (2005) Poverty and Human Development Report (2005). United Republic of Tanzania: Dar es Salaam, Tanzania.
86. Romilly G and Wekiy I (2004) ‘Turning off the taps: Donor conditionality and water Privatization Dar es Salaam, Tanzania’. Action Aid International: Washington DC.
87. Rufiji District Council (2005) Rufiji Comprehensive Council Health Plan (2005). Rufiji District Health Council: Rufiji District, Tanzania.
88. Rufiji District Council (2006) Rufiji Comprehensive Council Health Plan (2006). Rufiji District Health Council: Rufiji District, Tanzania.
89. Rufiji District Council (2005b) Reports of the District Water Engineer (2005/6). Rufiji District Council: Rufiji, Tanzania.
90. Rufiji District Council (2005c) Reports of Rufiji Education Department (2005/06). Rufiji District Council: Rufiji, Tanzania.
91. Semali I (2003) ‘Understanding stakeholders' roles in health sector reform process in Tanzania: the case of decentralizing the immunization programme,’ dissertation for PhD. STI: Basel, Switzerland.
92. Semali I and Minja G (2005) ‘Deprivation and the equitable allocation of health care resources to decentralized districts in Tanzania,’ EQUINET discussion paper 33. EQUINET: Harare.
93. Shemdoe G, Ezekiel M and Mhamba R (2005) ‘Protecting rights of access to essential medicines under trade and Market policies: The Tanzania case study’, paper presented at EQUINET/SEATINI Regional Conference, Johannesburg, South Africa, October 2005. EQUINET: Harare.
94. Shivji I (2004) ‘Reflections on NGOs in Tanzania: What we are, what we are not, and what we ought to be,’ Development in Practice 14, (5).
95. Singh A (2000) ‘Global economic trends and social development,’ Occasional Paper 9. United Nations Research Institute for Social Development: Geneva.
96. Singh A (2003) ‘Reviewing the impact of user fees: The African Experience,’ Health Financing Technical Brief. WHO: Geneva.
97. Smithson P (2006) Fair’s Fair: Health inequalities and equity in Tanzania. Ifakara Health Research and Development Centre and Women Dignity: Dar es Salaam, Tanzania.
98. SWAp (2005) ‘Achievements, Challenges and Lessons Leant,’ Mission Report.
99. TARSC, IHRDC and EQUINET (2006) Organizing People’s Power for Health: A Toolkit of Participatory Methods for Health. EQUINET: Harare.
100. Tungaraza F, Mchomvu A, Ngalula T, Nchahaga G and Maghimbi S (1998) ‘Social policy and research practice in Tanzania,’ Journal of Social Development in Africa 13(2): 45-53.
101. UNDP (2007) ‘Tanzania (United Republic of): The Human Development Index - Going beyond income.’ UNDP: New York, accessed at http://hdrstats.undp.org/countries/country_fact_sheets/cty_fs_TZA.html

51
102. United Republic of Tanzania (2000) Poverty Reduction Strategy Paper. United Republic of Tanzania: Dar es Salaam, Tanzania.
103. URT (2002) The Economic Survey. URT: Dar es Salaam: accessed on 16 January 2007 at http://www.tanzania.go.tz/economicsurveyf.html
104. Vice President’s Office (2005) National Strategy for Growth and Reduction of Poverty. URT: Dar es Salaam.
105. Wangwe S (1997) ‘The Management of Foreign Aid in Tanzania,’ ESRF Discussion Paper 15. ESRF: Dar es Salaam, Tanzania.
106. Wikipedia (2007a) Burundi. Wikipedia Inc: Florida, accessed at http://en.wikipedia.org/wiki/Burundi
107. Wikipedia (2007b) Democratic Republic of the Congo. Wikipedia Inc: Florida, accessed at http://en.wikipedia.org/wiki/Democratic_Republic_of_the_Congo
108. Wikipedia (2007c) East Africa. Wikipedia Inc: Florida, accessed at http://en.wikipedia.org/wiki/East_Africa
109. Wikipedia (2007d) Indian Ocean. Wikipedia Inc: Florida, accessed at http://en.wikipedia.org/wiki/Indian_Ocean
110. Wikipedia (2007e) Kenya. Wikipedia Inc: Florida, accessed at http://en.wikipedia.org/wiki/Kenya
111. Wikipedia (2007f) Malawi. Wikipedia Inc: Florida, accessed at http://en.wikipedia.org/wiki/Malawi
112. Wikipedia (2007g) Mozambique. Wikipedia Inc: Florida, accessed at http://en.wikipedia.org/wiki/Mozambique
113. Wikipedia (2007h) Rwanda. Wikipedia Inc: Florida, accessed at http://en.wikipedia.org/wiki/Rwanda
114. Wikipedia (2007i) Tanzania. Wikipedia Inc: Florida, accessed at http://en.wikipedia.org/wiki/Tanzania
115. Wikipedia (2007j) Uganda. Wikipedia Inc: Florida, accessed at http://en.wikipedia.org/wiki/Uganda
116. Wikipedia (2007k) Zambia. Wikipedia Inc: Florida, accessed at http://en.wikipedia.org/wiki/Zambia
117. William J Clinton Foundation (2005) ‘President Clinton and President Benjamin Mkapa to Announce Mkapa Medical Fellows Program: Program will strengthen the fight against HIV/AIDS in Tanzania,’ HIV/AIDS Initiative. William J Clinton Foundation: Washington DC accessed at http://www.clintonfoundation.org/071905-nr-cf-hs-ai-tza-pr-wjc-and-tanzanian-president-mkapa-announce-medical-fellows-program.htm
118. World Bank (1994) Better Health in Africa: Experience and lessons learned. World Bank: Washington DC.
119. World Bank (1993) World Development Report 1993: Investing in Health. Oxford University Press: New York.
120. World Bank and the United Republic of Tanzania (2001) ‘Decentralization sector work (March 2001). URT: Dar es Salaam, Tanzania.
121. World Health Organisation (WHO) (2002) Death and DALY estimates for 2002 by cause for WHO Member States WHO 2002 http://www.who.int/healthinfo/statistics/bodgbddeathdalyestimates.xls
122. World Resources Institute (2006) ‘Population, health and human well-being: Country profile – Tanzania,’ EarthTrends: The Environmental Information Portal. World Resources Institute: Washington DC accessed at http://earthtrends.wri.org/text/population-health/country-profile-178.htmlT

52
Equity in health implies addressing differences in health status that are unnecessary, avoidable and unfair. In southern Africa, these typically relate to disparities across racial groups, rural/urban status, socio-economic status, gender, age and geographical region. EQUINET is primarily concerned with equity motivated interventions that seek to allocate resources preferentially to those with the worst health status (vertical equity). EQUINET seeks to understand and influence the redistribution of social and economic resources for equity oriented interventions, EQUINET also seeks to understand and inform the power and ability people (and social groups) have to make choices over health inputs and their capacity to use these choices towards health. EQUINET implements work in a number of areas identified as central to health equity in the region:
• Public health impacts of macroeconomic and trade policies • Poverty, deprivation and health equity and household resources for health • Health rights as a driving force for health equity • Health financing and integration of deprivation into health resource allocation • Public-private mix and subsidies in health systems • Distribution and migration of health personnel • Equity oriented health systems responses to HIV/AIDS and treatment access • Governance and participation in health systems • Monitoring health equity and supporting evidence led policy
EQUINET is governed by a steering committee involving institutions and individuals co-ordinating theme, country or process work in EQUINET:
R Loewenson, R Pointer, F Machingura TARSC, Zimbabwe; M Chopra MRC, South Africa; I Rusike, CWGH, Zimbabwe; L Gilson, Centre for Health Policy, South Africa; M Kachima, SATUCC; D McIntyre, Health Economics Unit, Cape Town, South Africa; G Mwaluko, M
Masaiganah, Tanzania; Martha Kwataine, MHEN Malawi; A Ntuli, Health Systems Trust; S Iipinge, University of Namibia; N Mbombo UWC, L London UCT Cape Town, South Africa; A Mabika SEATINI, Zimbabwe; I Makwiza, REACH Trust Malawi; S Mbuyita, Ifakara Tanzania
For further information on EQUINET please contact the secretariat: Training and Research Support Centre (TARSC)
Box CY2720, Causeway, Harare, Zimbabwe Tel + 263 4 705108/708835 Fax + 737220
Email: [email protected] Website: www.equinetafrica.org
Series Editor: Rene Loewenson Issue Editor: Rene Loewenson, Rebecca Pointer