equity in access to healthcare in brunei darussalam
TRANSCRIPT
i
v
Equity in access to healthcare in Brunei Darussalam: Results from the
Brunei Darussalam Health System Survey (HSS)
by
Elizabeth Michelle Tant
Global Health Institute
Duke University
Date:_______________________
Approved:
___________________________
Shenglan Tang, Supervisor
___________________________
Truls Ostbye
___________________________
Myles Elledge
Thesis submitted in partial fulfillment of
the requirements for the degree of
Master of Science in the Global Health
Institute in the Graduate School
of Duke University
2014

ABSTRACT
Equity in access to healthcare in Brunei Darussalam: Results from the
Brunei Darussalam Health System Survey (HSS)
by
Elizabeth Michelle Tant
Global Health Institute
Duke University
Date:_______________________
Approved:
___________________________
Shenglan Tang, Supervisor
___________________________
Truls Ostbye
___________________________
Myles Elledge
An abstract of a thesis submitted in partial
fulfillment of the requirements for the degree
of Master of Science in the Global Health
Institute in the Graduate School
of Duke University
2014

Copyright by
Elizabeth Michelle Tant
2014
iv
Abstract
Background: Universal healthcare has been promoted by organizations
including the World Health Organization and United Nations as a means of ensuring
healthcare access for vulnerable populations. Despite momentum towards universal
healthcare, especially among Southeast Asian nations, little research has been conducted
to understand healthcare equity in nations that have already implemented universal
healthcare. This paper assesses equity in healthcare access in Brunei Darussalam using
results from the Brunei Darussalam Health System Survey (HSS).
Methods: Data were gathered using a nationally-representative survey of 1,197
households across four districts in Brunei Darussalam. The Health System Survey aimed
to measure individual’s expectations and utilization of the Brunei national healthcare
system. Data were analyzed using descriptive statistics and multinomial logistic
regression to identify respondent- and household-level characteristics that affect
healthcare utilization and expenditures.
Results: HSS data suggest that healthcare utilization in Brunei varies by
ethnicity, district of residence, health status, and income. When compared to other
ethnic groups, Chinese households were significantly less likely to utilize public
healthcare and significantly more likely to utilize private healthcare services. Indigenous
groups also demonstrated significantly lower rates of private healthcare utilization
v
compared to other ethnicities. Temburong district had the lowest rates of both private
and public healthcare utilization and was associated with a 2.67 decreased likelihood of
using public healthcare in the past six months. When stratifying for health status, data
indicate that healthcare utilization in Brunei is proportional to healthcare need, with 93
percent of respondents in poor health reporting using government hospitals 12 or more
times in the past six months compared to 76 percent of respondents in excellent health
reporting using healthcare only once in the past six months. Income was also found to
be positively associated with increased healthcare expenditures and private healthcare
use.
Conclusion: This study highlights an example of a universal healthcare system in
Southeast Asia and indicates that a well-funded universal healthcare system can reduce
significant utilization disparities. Substantial financial resources do not, however,
guarantee equity among rural and minority populations and universal healthcare efforts
should incorporate measures to understand and address barriers to healthcare among
these groups.
vi
Contents
Abstract ......................................................................................................................................... iv
List of Tables .............................................................................................................................. viii
List of Figures ............................................................................................................................... ix
Acknowledgements ...................................................................................................................... x
1. Introduction ............................................................................................................................... 1
1.1 Background ....................................................................................................................... 2
1.2 Healthcare System Overview ......................................................................................... 4
1.3 Healthcare Equity and Access ........................................................................................ 7
1.4 Study Purpose ................................................................................................................. 13
2. Methods .................................................................................................................................... 14
2.1 Study Design ................................................................................................................... 14
2.2 Instrument Development .............................................................................................. 14
2.3 Sampling Methodology ................................................................................................. 15
2.4 Survey Implementation ................................................................................................. 16
2.4 Data Analysis .................................................................................................................. 17
2.5 Limitations ....................................................................................................................... 20
3. Results ....................................................................................................................................... 22
3.1 Respondent Characteristics ........................................................................................... 22
3.2 Healthcare Utilization by Respondent Characteristics ............................................. 24
3.3 Healthcare Utilization and Expenditures by Household Characteristics .............. 27

vii
3.3.1 Public Healthcare Utilization ................................................................................... 27
3.3.2 Private Healthcare Utilization ................................................................................. 29
3.3.3 Private Healthcare Expenditures ............................................................................ 31
4. Discussion ................................................................................................................................ 35
4.1 Key Findings ................................................................................................................... 35
4.2 Conclusion and Implications for Future Research .................................................... 38
Author Acknowledgments ........................................................................................................ 41
Appendix. Survey Instrument................................................................................................... 42
References .................................................................................................................................... 61

viii
List of Tables
Table 1. Survey response rate by district ................................................................................. 17
Table 2. Demographic and socioeconomic characteristics of adult respondents by district
....................................................................................................................................................... 23
Table 3. Effect of respondent characteristics on public healthcare utilization over 6
months .......................................................................................................................................... 26
Table 4. Effect of household characteristics on public healthcare utilization over 6
months .......................................................................................................................................... 28
Table 5. Effect of household characteristics on private healthcare utilization over 6
months .......................................................................................................................................... 31
Table 6. Household private healthcare expenditures over 6 months by health status* .... 32
Table 7. Household private healthcare expenditures over 6 months by citizenship status*
....................................................................................................................................................... 33
Table 8. Household private healthcare expenditures over 6 months by monthly
household income* ..................................................................................................................... 34
ix
List of Figures
Figure 1. Map of Brunei Districts (Fitzgerald, 2009) ................................................................ 3
Figure 2. Map of healthcare facilities in Brunei Darussalam (Ministry of Health 2013) ..... 5
Figure 3. Government health expenditures (2006-2011) (Ministry of Health 2013) ............ 6
x
Acknowledgements
I would like to express my sincere thanks to Dr. Charles Lau and Myles Elledge
at RTI International for providing the opportunity to work on this unique project. I
would also like to thank Dr. Shenglan Tang for sharing his expertise, patience, and
guidance as my thesis committee chair. Sincere thanks to Dr. Truls Ostbye for serving on
my thesis committee and to Dr. Joe Egger and Dr. Julianne Payne for their valuable
statistical support. Finally, many thanks to my husband, Brian Blackmon, for his
patience, encouragement, and dedication throughout this process; I couldn’t have done
it without you.

1
1. Introduction
Health system strengthening and universal healthcare coverage have been
promoted in recent years by international organizations including the World Health
Organization (WHO) and United Nations as a means of ensuring healthcare access for
vulnerable populations (WHO, 2010a) (United Nations, 2012) (Swanson et al., 2010)
(Lagomarsino, Garabrant, Adyas, Muga, & Otoo, 2012). Political and economic
organizations, including the Association of Southeast Asian Nations (ASEAN), have also
identified universal healthcare coverage as a regional priority (Tangcharoensathien et
al., 2011). Despite increased momentum towards universal healthcare, little research has
been conducted to understand how universal healthcare impacts healthcare access and
equity (Mills, Ally, Goudge, Guapong, & Mtei, 2012) (Stuckler, Feigl, Basu, & McKee,
2010). Therefore, analyzing healthcare equity and access in nations with well-established
universal healthcare systems, such as Brunei Darussalam, is essential as more nations
move toward universal coverage.
Universal healthcare coverage can be implemented in a variety of ways, but most
experts agreed on a standard definition (Lagomarsino et al., 2012). According to the
WHO, universal healthcare includes the following components: 1) a health system that
meets priority health needs through people-centered integrated care, 2) affordability, 3)
access to essential medicines and technologies to diagnose and treat medical problems,

2
and 4) sufficient capacity of well-trained, motivated health workers to provide the
services to meet patients’ needs based on the best available evidence (WHO, 2012).
National healthcare schemes that aim to provide universal coverage may still be
lacking in one or more of the WHO-defined priorities, despite being designed to provide
healthcare for all (WHO, 2010b). It is within this context that Brunei Darussalam
initiated a Master Plan for Health System and Healthcare Infrastructure aimed to
comprehensively assess the nation’s universal healthcare system following the WHO
Health Sector Building Block methodology (Ministry of Health, 2013). This research
paper will examine results of the Brunei Darussalam Health System Survey (HSS),
which is one component of the Brunei Darussalam Master Plan project.
1.1 Background
Brunei Darussalam is a Sultanate located on the island of Borneo in Southeast
Asia (CIA, 2014) (Australian Government, 2013). The population of Brunei is
approximately 415,717 comprised mostly of Malay (66.3%), Chinese (11.2%), and
Indigenous (3.4%) peoples (CIA, 2014). Brunei is rich in natural resources, mainly oil and
natural gas, which results in its high per-capita gross domestic product (GDP) that was
estimated by the World Bank to be USD$50,506 in 2010 (Ministry of Health, 2013) (CIA,
2014). Oil and gas make up 90 percent of government revenues and 95 percent of export
revenues (Ministry of Health, 2013). Brunei is the second-wealthiest nation in Asia based
on GDP per-capita (Ministry of Health, 2013).
3
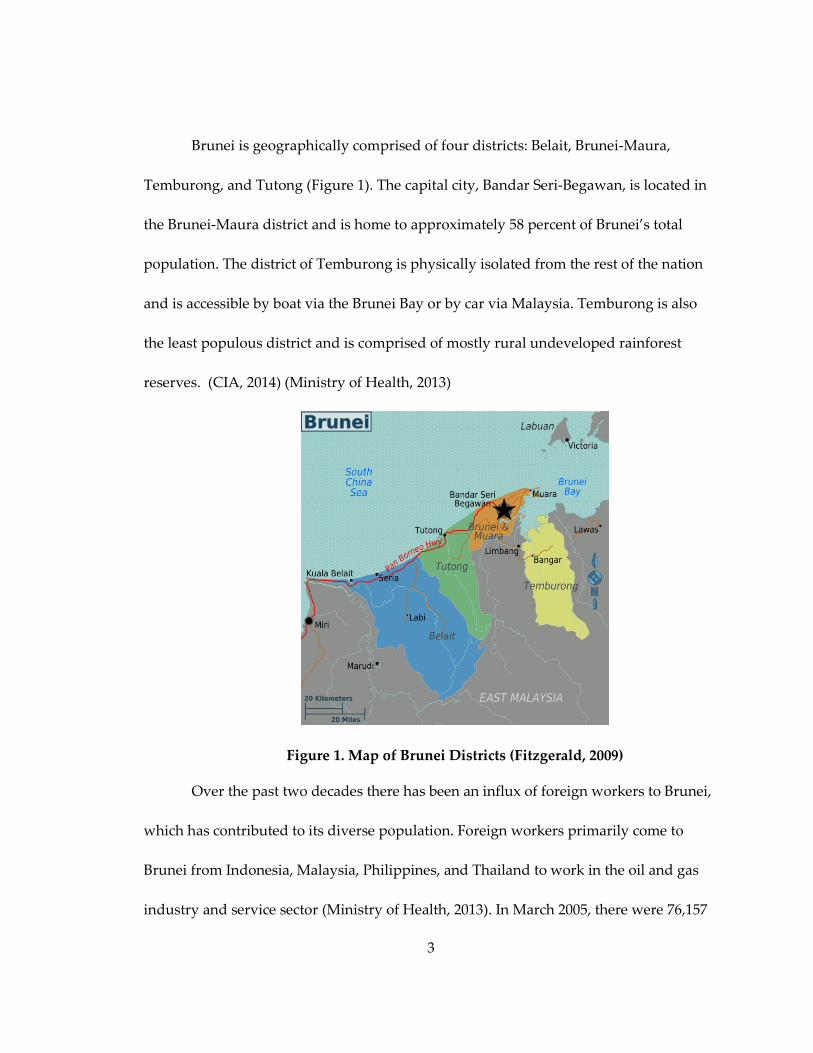
Brunei is geographically comprised of four districts: Belait, Brunei-Maura,
Temburong, and Tutong (Figure 1). The capital city, Bandar Seri-Begawan, is located in
the Brunei-Maura district and is home to approximately 58 percent of Brunei’s total
population. The district of Temburong is physically isolated from the rest of the nation
and is accessible by boat via the Brunei Bay or by car via Malaysia. Temburong is also
the least populous district and is comprised of mostly rural undeveloped rainforest
reserves. (CIA, 2014) (Ministry of Health, 2013)
Figure 1. Map of Brunei Districts (Fitzgerald, 2009)
Over the past two decades there has been an influx of foreign workers to Brunei,
which has contributed to its diverse population. Foreign workers primarily come to
Brunei from Indonesia, Malaysia, Philippines, and Thailand to work in the oil and gas
industry and service sector (Ministry of Health, 2013). In March 2005, there were 76,157

4
documented foreign workers living in Brunei compared to 44,971 documented foreign
workers in 1981. (Australian Government, 2013) (Azim, 2002)
Citizenship is determined according to the Brunei Nationality Law that defines a
citizen as anyone born to parents who are Brunei citizens rather than birth within the
country. Stateless permanent residents are given an International Certificate of Identity
(ICI) and are not entitled access to services, including healthcare, education, housing
support, and food subsidies. The majority of the Chinese population in Brunei are
permanent residents as opposed to citizens and many are stateless (Gunn, 2000)
(Minority Rights Group International, no date). Many Indigenous groups, including the
Dusan and Iban, residing in Temburong District are neither citizens nor ICI registered
due to high rates of illiteracy among these groups. (Ministry of Health, 2013)
1.2 Healthcare System Overview
Brunei Darussalam instituted single-payer universal healthcare for its citizens in
1958 and is one of 30 Asian nations currently providing universal healthcare coverage
(New York State, 2011). According to the Ministry of Health, all medical and health
related services are provided free-of-charge to the citizens of Brunei. Remote areas such
as Temburong District are serviced by four Flying Medical Services (FMS) teams that
provide primary care. Brunei’s public healthcare network is comprised of 15 health
centers, 10 health clinics, and 22 maternal and child health clinics. Brunei also has two
private hospitals, Jerudong Park Medical Centre and Gleneagles JPMC, located in the

5
capital district of Brunei Maura. Brunei also has one private healthcare center, Panaga
Health Centre, which is located in the Belait district. Jerudong Park Medical Centre and
Gleneagles JPMC are specialty hospitals specializing in rehabilitation and cancer, and
cardiac care, respectively. Care at both of these private hospitals is covered under the
national health system for Brunei citizens if they are referred to the private hospital
through a public healthcare facility. The majority of healthcare facilities are located
along the coastal region (Figure 2). (Ministry of Health, 2013)
Figure 2. Map of healthcare facilities in Brunei Darussalam (Ministry of
Health 2013)
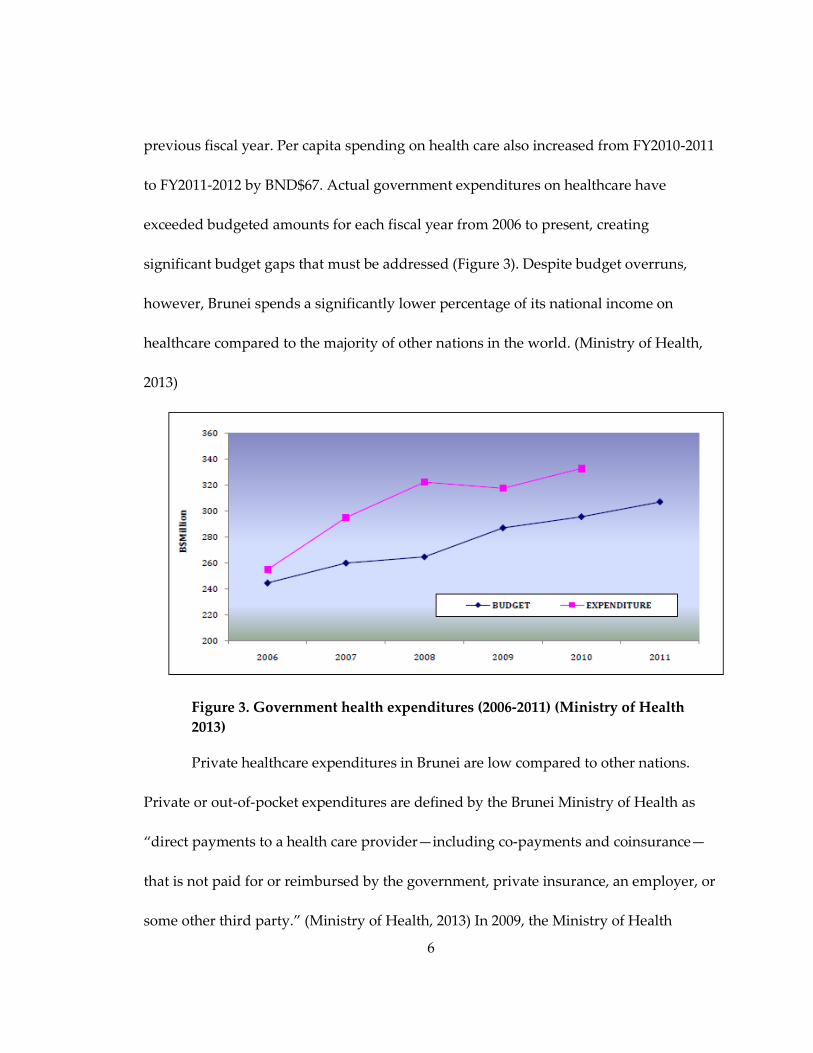
In FY2011-2012 approximately 7.5 percent (BND$306.85 million) of Brunei’s national
budget was allocated for health services, representing a 3.9 percent increase from the
6
previous fiscal year. Per capita spending on health care also increased from FY2010-2011
to FY2011-2012 by BND$67. Actual government expenditures on healthcare have
exceeded budgeted amounts for each fiscal year from 2006 to present, creating
significant budget gaps that must be addressed (Figure 3). Despite budget overruns,
however, Brunei spends a significantly lower percentage of its national income on
healthcare compared to the majority of other nations in the world. (Ministry of Health,
2013)
Figure 3. Government health expenditures (2006-2011) (Ministry of Health
2013)
Private healthcare expenditures in Brunei are low compared to other nations.
Private or out-of-pocket expenditures are defined by the Brunei Ministry of Health as
“direct payments to a health care provider—including co-payments and coinsurance—
that is not paid for or reimbursed by the government, private insurance, an employer, or
some other third party.” (Ministry of Health, 2013) In 2009, the Ministry of Health

7
reported that private expenditures were equivalent to 0.37 percent of GDP or USD$185
per person annually. Although private spending is currently low, private healthcare is a
growing sector in Brunei’s economy. (Ministry of Health, 2013)
Overall, Brunei’s health indicators are favorable. Life expectancy is the second
highest in Southeast Asia and continues to rise. In 2011 life expectancy at birth was 78.1
years compared to 62.3 years in 1960. Furthermore, the Infant Mortality Rate (IMR) was
5.6 deaths per 1,000 live births in 2012 compared to 42.3 deaths per 1,000 live births in
1966. (Ministry of Health, 2013) (Oxford Business Group, 2013)
Like many developed nations, Brunei has made significant strides in eliminating
infectious diseases, such as malaria, but has recently experienced an epidemiologic
transition toward chronic disease that must be addressed through health system
planning and resource allocation. Diabetes, obesity, heart disease, and cancers are
occurring at higher rates among adults and children in Brunei and changes in lifestyle
factors, including higher caloric intake, sedentary lifestyle, and smoking, suggest that
the trend will continue to increase. (McKeown, 2009) (Ministry of Health, 2013) (Oxford
Business Group, 2013)
1.3 Healthcare Equity and Access
Healthcare equity and access is determined by how a nation’s healthcare system is
structured and Southeast Asian countries have enacted diverse healthcare reforms in
recent years. Four Southeast Asian nations, including Brunei, Malaysia, Singapore and
8
Thailand, have already achieved universal coverage, and other nations, including
Indonesia, the Philippines, and Vietnam, are making progress towards universal
healthcare (Tangcharoensathien et al., 2011).
Milton et al. discuss the importance of examining health inequities within universal
healthcare schemes, like the one in Brunei, because despite their aim to provide
healthcare coverage inclusive of all populations, these plans do not always achieve that
goal (WHO, 2010b). In fact, equal access for all citizens depends on factors that cannot
always be ensured through legislation, including gaining entry into the healthcare
system, accessing a healthcare location where needed services are provided, and finding
a health care provider with whom the patient can communicate and trust (Healthy
People 2020, 2013).
Access to locations that provide essential healthcare services depends on several
factors, including geographic proximity to healthcare providers (Healthy People 2020,
2013). Because Brunei’s population is not equally distributed across its four districts,
healthcare facilities are unevenly distributed as well. For example, the rural district of
Temburong is primarily serviced by the flying medical service and has only one hospital
(Ministry of Health, 2013). Therefore, Bruneian citizens residing in this district may have
unequal access to healthcare services when compared to citizens residing in the capital
district where numerous healthcare facilities are located. Furthermore, Temburong is an
9
exclave meaning that citizens must travel through Malaysia to reach healthcare facilities
in mainland Brunei.
The World Health Organization defines health inequity as “avoidable inequalities in
health between groups of people within countries or between countries”(World Health
Organization, 2008). Health inequities can affect an individual’s health status, their
ability to access healthcare, and the quality of healthcare that they receive (Health
Knowledge, 2009). Healthcare equity is sometimes referred to as vertical or horizontal
equity. Vertical equity is defined as “the unequal treatment of unequals on the basis of
morally relevant factors” such as need, ability to benefit, autonomy, and deservingness
(Health Knowledge, 2009). Allocating healthcare services based on factors such as age,
sex, ethnicity, income, class, and disability violates principles of healthcare equity.
(Health Knowledge, 2009)
Horizontal healthcare equity implies that individuals should receive equal care for
equal need regardless of socioeconomic status (SES) (R.J., E., M.S., & A.F., 2009). Korda
et al. (2009) suggest that horizontal equity in universal healthcare schemes most often
fails for ambulatory services. Furthermore, the authors purport that this is the case for
Australia’s universal healthcare system in which women of higher SES are more likely
than women of lower SES to utilize ambulatory healthcare services. The WHO also notes
that the Thai universal healthcare system does not have adequate funding to cover
essential ambulatory medical procedures resulting in significant health disparities
10
(World Health Organization, 2010). When assessing Brunei’s health system, it is
important to understand how access to ambulatory services in public healthcare
facilities differs from similar services in private facilities. Because ambulatory services
may be elective and preventive in nature, lack of access to these services in public
facilities may result in higher utilization among members of higher SES groups resulting
in decreased access for individuals of lower SES. (R.J. et al., 2009)
One rationale for universal healthcare is improved population health (WHO, 2010a).
Given Brunei’s exceptional population health indicators, it is reasonable to assume that
universal coverage has positively impacted health outcomes. Moreno-Serra and Smith
conducted an evidence review to determine if expanded healthcare coverage, such as
universal healthcare schemes, actually improved population health (Moreno-Serra &
Smith, 2012). The authors conclude that the effects are context dependent, meaning that
the poorest populations in the poorest countries benefit the most from expanded
coverage. Furthermore, high-income countries that tend to have better healthcare
systems and governance structures also benefit from expanded coverage; however the
benefits are predominantly seen among the lowest SES segments of the population
(Moreno-Serra & Smith, 2012).
UHC Forward recognizes four types of universal healthcare coverage, including the
Beveridge Model, the Bismark Model, the National Health Insurance Model (NHIM),
and the Out-of-Pocket Model (UHC Forward, 2013). The major difference among each of
11
these plans lies in how they are financed. The Beveridge Model is funded through
government tax revenue and the government employs all medical personnel and
determines reimbursement rates. Brunei’s health system is classified as a Beveridge
Model, although funding comes from alternative government revenue sources and not
citizen taxation. The Bismark Model has been implemented in some Asian countries,
including Japan, and mirrors an insurance scheme, however, insurers do not make a
profit and it is funded through employer and employee contributions. The National
Health Insurance Model blends characteristics of both the Beveridge and Bismark
models and relies on private healthcare providers who are paid by the government.
Examples of the NHIM include Canada, South Korea, and Taiwan. (UHC Forward,
2013) (The Commonwealth Fund, 2010)
Some countries have established universal healthcare systems using an out-of-pocket
payment model, which raises concerns regarding healthcare equity and access (UHC
Forward, 2013). Moreno-Serra and Smith note that high dependence on out-of-pocket
payments frequently precludes individuals from receiving needed healthcare services
(Moreno-Serra & Smith, 2012). Kenya is one example of a universal health program that
relies on out-of-pocket payments which has proven to further inequity and prevent
access for vulnerable populations who cannot afford fees for services (Mulupi, Kirigia, &
Chuma, 2013). Similarly, Ensor and San note that rural populations in Vietnam were
12
more likely to delay or avoid utilizing essential healthcare services after user fees were
introduced (Ensor & San, 1996).
Furthermore, households in countries that rely on out-of-pocket payment schemes
are more likely to experience catastrophic health spending, which is defined as spending
more than 10 percent of annual household income on healthcare (Tangcharoensathien et
al., 2011). Tangcharoensathien et al. specifically note that pre-paid health insurance
schemes have not proven to completely eliminate the risk of catastrophic spending for
households in Asian nations (Tangcharoensathien et al., 2011). Because only Brunei
citizens are eligible to receive national healthcare benefits, permanent residents, foreign
workers, and Indigenous groups may be precluded from accessing healthcare services
due to inability to afford out-of-pocket payments. In addition, the prevalence of
catastrophic spending should be examined in Brunei among both citizens and non-
citizens to determine if the universal healthcare system adequately protects individuals
from burdensome costs and decreased access.
A literature search of PubMed yielded only two publications focused on the Brunei
national healthcare system. The two publications by Anshari, et al. and Alumnawar et
al. are related to e-health services in Brunei Darussalam and are not focused on overall
health system outcomes (Almunawar, Wint, Low, & Anshari, 2012) (Anshari,
Almunawar, Low, & Al-Mudimigh, 2012). Furthermore, Brunei is frequently excluded
from studies of universal healthcare systems due to its high GDP and developed
13
economy (Tangcharoensathien et al., 2011) (The World Bank, 2014) (Lagomarsino et al.,
2012). The same factors that often preclude researchers from including Brunei in their
analyses, however, make Brunei a great case example of how universal healthcare affects
access in a context with sufficient financial resources.
1.4 Study Purpose
The government of Brunei Darussalam has invested significant resources into the
development of its healthcare system; however, prior to the Master Plan project no
comprehensive national assessment of the healthcare system has been undertaken to
determine if these government funds and initiatives are effective in improving the
health of citizens and adequately addressing health needs.
This paper will focus on how healthcare access and equity in Brunei differ by
individual respondent and household characteristics, as well as how respondents’
perceived healthcare needs impact utilization of healthcare services. Specifically, the
objectives of this research are:
1. To analyze how perceived healthcare need affects healthcare utilization and
expenditures.
2. To identify key factors that affect healthcare utilization, including socioeconomic
and demographic factors.
14
2. Methods
2.1 Study Design
The Brunei Darussalam Health System Survey (HSS) was conducted in 2013 and
aimed to measure the general public’s expectations and utilization related to the
healthcare system in Brunei Darussalam (Appendix A.). Ethical approval was granted
by the RTI International Institutional Review Board and the Brunei Darussalam Ministry
of Health Ethics Board. This research was conducted by RTI International through a
contract with The Innova Group and the Brunei Darussalam Ministry of Health.
2.2 Instrument Development
Content for the HSS questionnaire was developed by RTI International, Innova
Corporation, and the Brunei Darussalam Ministry of Health through a series of planning
and development meetings. The final HSS questionnaire was developed in English and
translated into Malay by Bruneian native speakers of Malay. Translators adhered to best
practice and translated the survey independently, after which two Ministry of Health
staff members reviewed the two translations side-by-side (University of Michigan, 2011).
The final translation was completed in conjunction with both translators and the
Ministry of Health.
The HSS questionnaire was pilot-tested through 16 one-on-one interviews with
members of the target population. Pilot-test respondents were recruited through
personal networks and represented a variety of income, age, and social groups. The

15
pilot-test was conducted in two kampongs (villages) including one urban kampong and
one rural kampong. Fourteen pilot-tests were conducted in Malay and two were
conducted in English to test the English version of the questionnaire. The HSS
questionnaire was revised based on pilot-test feedback to clarify question wording and
structure.
2.3 Sampling Methodology
The HSS was conducted at the household level using a multi-stage stratified random
sampling design. The sample represented adults age 18 years and older who speak
either Malay or English and live in households in Brunei Darussalam. The sampling
frame was based on 2011 census data provided by the government.
In order to examine heterogeneity across the four districts in Brunei, the sample was
stratified by district and smaller districts such as Temburong were oversampled.
Sampling weights were applied in the analysis to account for oversampling.
A multi-stage clustered design was used to improve the efficiency of survey
implementation. Kampongs (villages) were sampled across the four districts (stage 1)
and then households were selected within the sampled kampongs (stage 2). We selected
eight kampongs in Belait, 28 kampongs in Brunei-Maura, seven kampongs in
Temburong, and 10 kampongs in Tutong. Kampongs were randomly selected
proportional to size, meaning that larger clusters within each district had a higher

16
probability of being selected due to their higher population. Finally, households within
kampongs were randomly selected from the master census file.
2.4 Survey Implementation
A local Bruneian organization, the Centre for Strategic and Policy Studies (CSPS),
recruited interviewers. A two-day interviewer training was conducted at CSPS on
March 18 and 19, 2013. Fifty interviewers participated in the training and 41 were
selected to participate in HSS data collection. Interviewers had completed a university
education and were proficient in reading and speaking English and Malay. Many of the
interviewers also had previous experience with survey implementation, including prior
surveys conducted by CSPS and the University of Brunei Darussalam. The interviewer
training consisted of a mix of participatory group sessions during which interviewers
practiced administering the HSS instrument, and didactic sessions that taught field
procedures. Training was conducted in English but interviewers practiced administering
the survey in Malay.
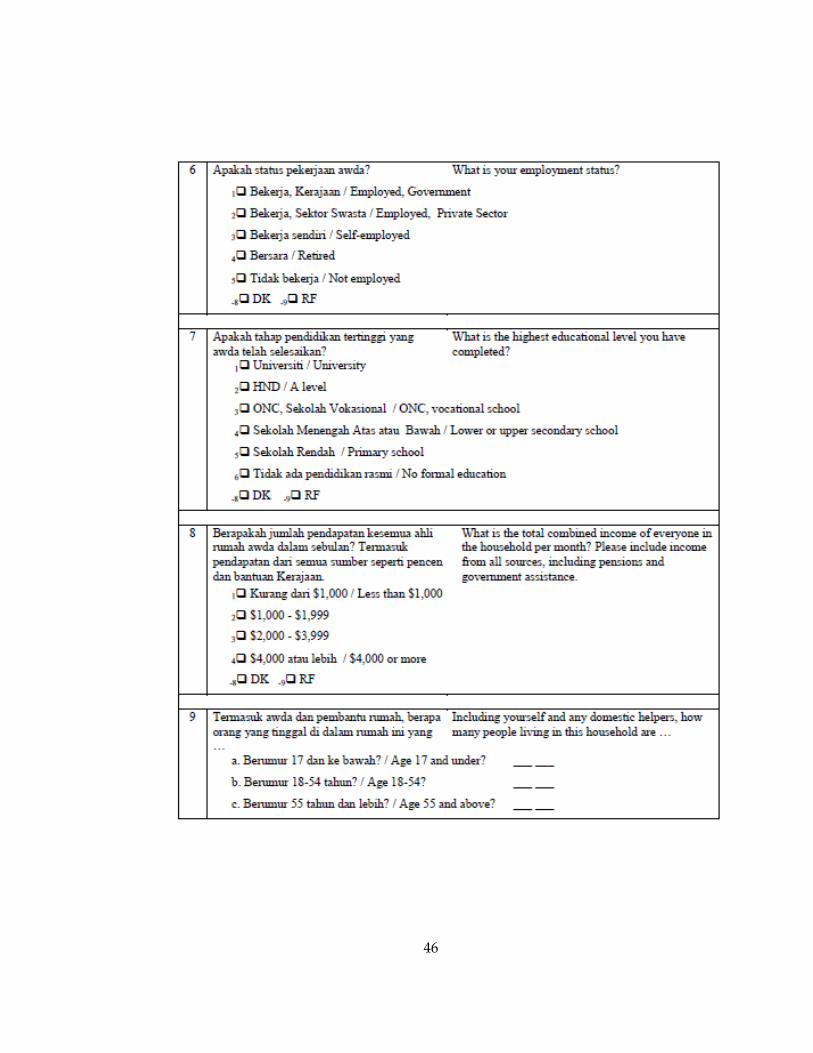
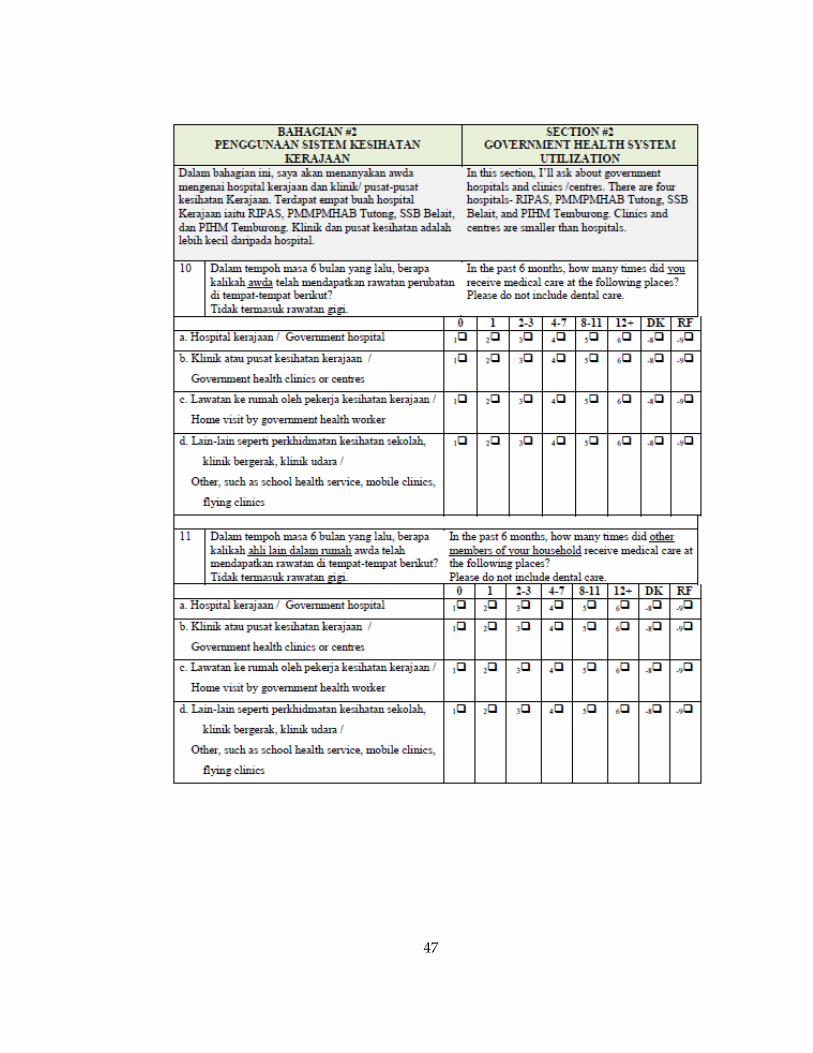
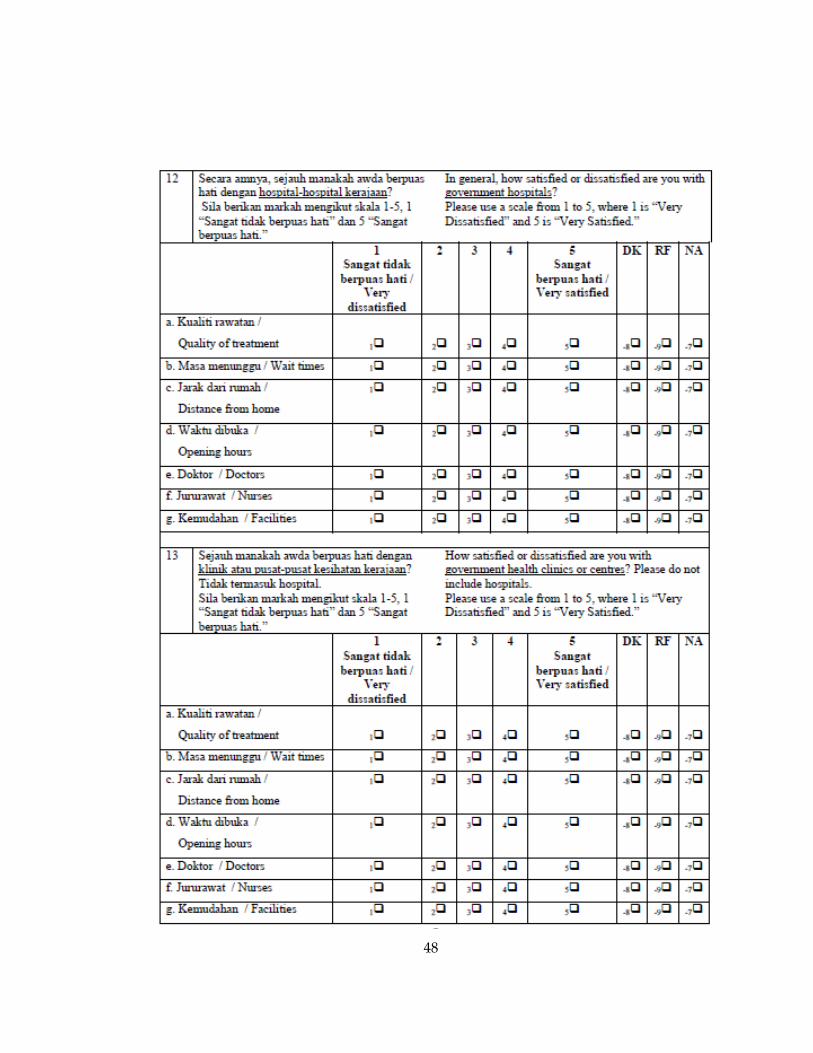
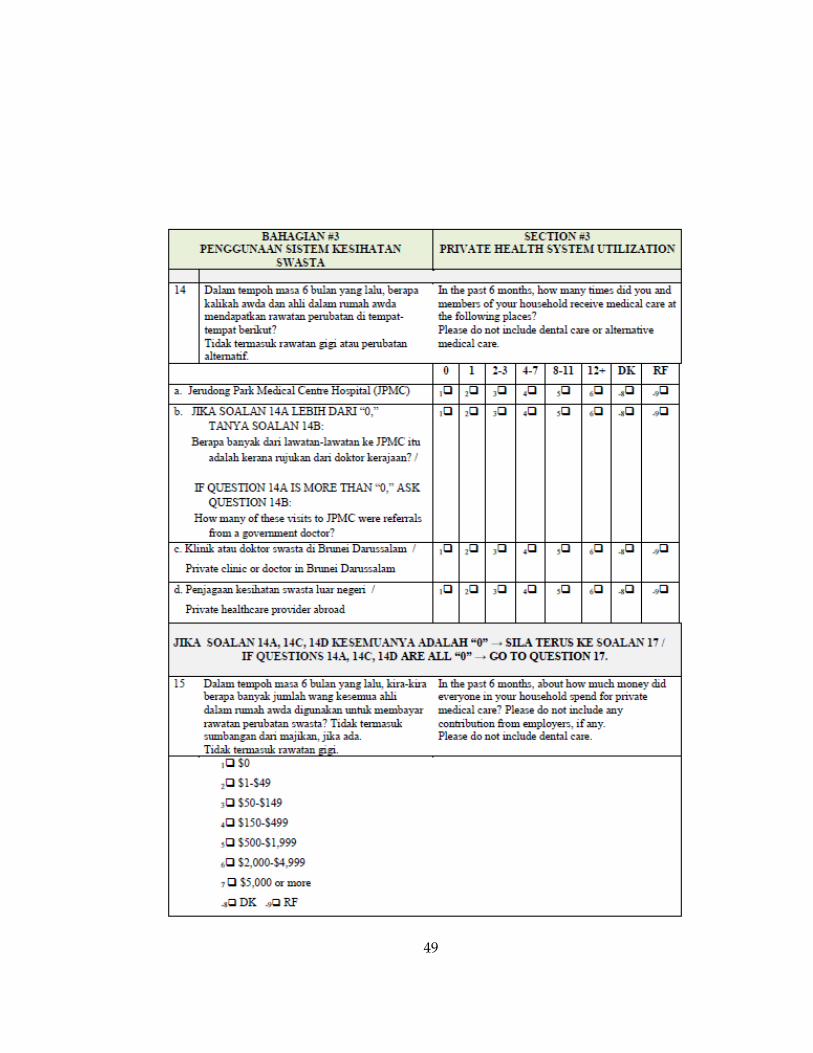
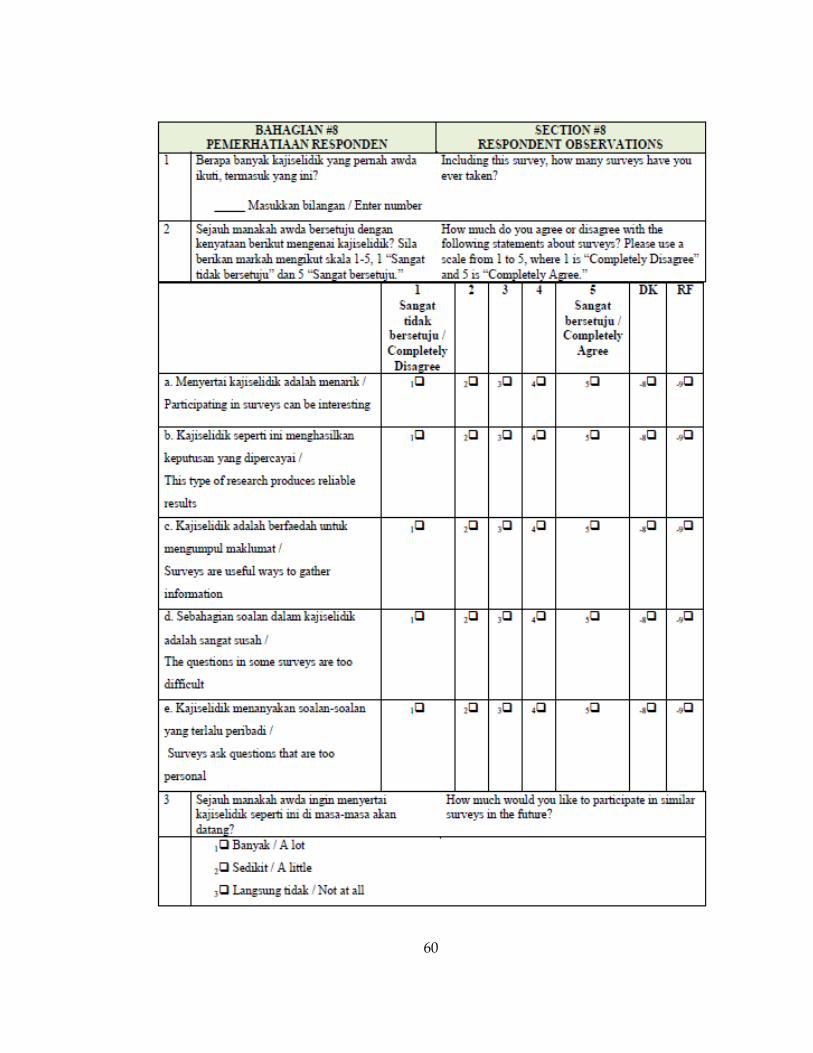
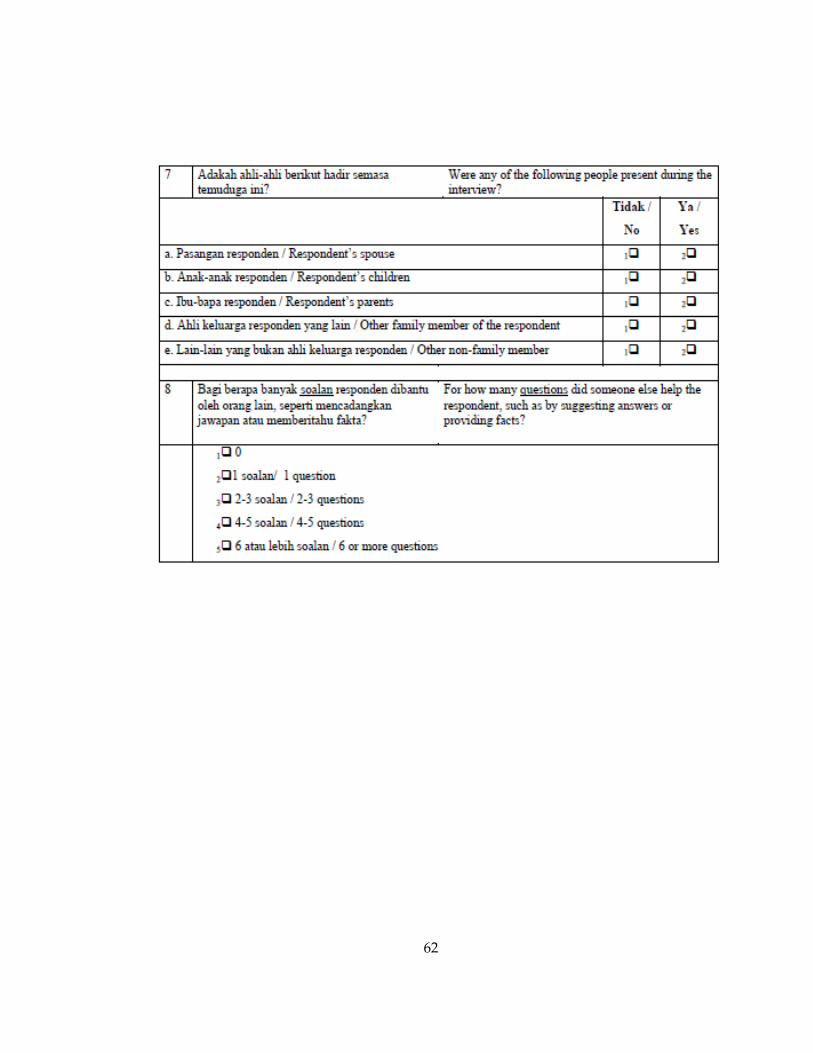
The survey instrument (Appendix A) was read aloud and responses were recorded
by the interviewer. The survey included 36 questions followed by a short respondent
debriefing section that allowed respondents to share opinions about participating in the
survey. On average the survey took half an hour to complete. Respondents were given a
tin of healthy biscuits as an incentive for participating.

17
Interviewers visited sampled households and conducted interviews in teams of two
following the protocol outlined in the interviewer manual. Teams were assigned
supervisors from CSPS staff to monitor interview progress and ensure that proper
procedures were being followed.
The sampling frame contained 1,723 households and 226 households were excluded
because they no longer exist or did not speak Malay or English. Surveys were completed
for 80 percent of the 1,497 eligible households resulting in a total of 1,197 completed
surveys. Response rates varied by district and are presented in Table 1. The most
common reasons for non-response were inability to find the household and no one at
home despite repeated contact attempts.
Table 1. Survey response rate by district
District N %
Belait 205 75
Brunei Maura 568 77
Temburong 179 93
Tutong 245 80
2.4 Data Analysis
Data were entered and stored in Microsoft Excel 2007 (Microsoft, 2009) and analyzed
using Stata v.13 (StataCorp, 2013). Sampling weights were applied to all analyses to
account for oversampling in smaller districts.

18
Healthcare utilization was measured across public and private healthcare services
using ordinal and dichotomous variables. Public healthcare was defined as government
hospitals, government clinics, home visits, and other services. Private healthcare services
included Jerudong Park Medical Centre Hospital, private clinics or doctors in Brunei,
and private clinics or doctors abroad. Use of herbal and traditional medicine was
captured separately and is excluded from this analysis. All healthcare utilization data
were based on a recall period of six months.
The HSS contained questions pertaining to respondent and household-level
healthcare utilization. Because these data were captured at different levels, analyses for
respondent- and household-level utilization were analyzed separately. The survey asked
respondents how many times in the previous six months they and members of their
household utilized different types of public and private healthcare based on six
categories of utilization ranging from zero times to twelve or more times. This range of
healthcare utilization was analyzed using ordinal variables.
Dichotomous variables were created to differentiate between households who
reported using healthcare services zero times in the previous six months versus one or
more times. Because individual and household utilization were measured using separate
survey questions, new variables were created to combine individual and household
utilization resulting in a dichotomous comprehensive measure of household healthcare
use. If neither the individual nor any members of the household utilized any type of
19
public healthcare in the past six months they were coded as “0” for the new variable
“usedpublic.” If the individual or any member of the household used any type of public
healthcare in the past six months they were coded as “1” for “usedpublic.” The same
coding logic was used for private healthcare utilization using the variable
“usedprivate.” This dichotomous measure allowed trends in utilization to be observed
and then further investigated using ordinal variables and multinomial logistic
regression modeling. Furthermore, modeling this dichotomous variable was preferable
in instances where variables contained too few observations to run a proper logistic
model with the ordinal variables.
Perceived healthcare need was defined as respondents’ self-reported health status
using ordinal variables ranging from excellent to poor. Expenditure data was derived
from an ordinal measure of total household spending on private healthcare in the six-
month recall period and served as a proxy measure for total out-of-pocket healthcare
spending given that all other healthcare expenses are covered through the national
healthcare program. Expenditures were measured using an ordinal scale ranging from
BND$0 to BND$5,000 or more.
Demographic and socioeconomic characteristics were gathered using a series of
respondent background questions. Age and household income were coded as ordinal
variables. Citizenship, ethnicity, district of residence and employment status were coded
as categorical variables. These variables were then compared to public and private

20
healthcare utilization and expenditures using descriptive statistics and multinomial
logistic regression. Multinomial logistic regression was chosen because a proportional
odds assumption test yielded significant results (p >0.05), indicating that ordinal logistic
regression was not a good fit for the data.
2.5 Limitations
One possible limitation of these results is that the HSS collected self-reported health
status, utilization, and expenditure data. Respondents may have inaccurately recalled
healthcare utilization and expenditures over the 6-month recall period. Similarly,
respondents were asked to recall healthcare utilization and expenditures for the entire
household which may have resulted in recall errors. For the purposes of this research,
healthcare need was derived from a survey question that asked respondents to rate their
general health status on a scale ranging from excellent to poor. This definition is limited
and reliant on subjective self-ratings.
The sampling frame was based on 2011 census data but may not have adequately
captured foreign workers or temporary residents; therefore, inferences about healthcare
equity for these populations are limited. Furthermore, benchmark data used to interpret
results of the HSS are limited to documents provided by the Ministry of Health and
therefore data validity and accuracy are contingent upon the validity and accuracy of
government data sources. This survey assessed many perceptions and expectations of

21
the Brunei healthcare system that may influence healthcare utilization; however, these
factors were not included in the analysis due to the limited scope of this paper.

22
3. Results
3.1 Respondent Characteristics
Respondent characteristics by district are displayed in Table 2. Forty percent of
respondents were between 18-39 years of age, and 45 percent were between 40-59 years
of age. Only 15 percent of respondents were older than 60 years of age. Eighty-two
percent of respondents were Brunei citizens, and percentages of permanent residents in
Belait and Temburong were much higher than the percentages of permanent residents in
other districts. The higher percentages represent higher numbers of foreign workers in
Belait where the majority of the oil and gas industry is located, and higher numbers of
stateless Indigenous groups in Temburong. Overall respondent characteristics reflect
national population statistics, thus indicating that the HSS sample accurately represents
the total population of Brunei.

23
Table 2. Demographic and socioeconomic characteristics of adult respondents by
district
Belait
Brunei
Muara Temburong Tutong Total
Age (in years) n % n % n % n % n %
< 30 33 17 113 20 30 17 44 19 220 19
30–39 44 22 118 20 60 31 48 20 270 21
40–59 102 48 255 45 59 33 119 49 535 45
60+ 26 13 82 15 30 19 33 12 171 15
Citizenship
Brunei citizen 151 71 475 83 141 77 223 92 990 82
Permanent resident 29 19 35 7 31 19 10 4 105 9
Temporary resident 21 8 36 7 5 4 6 3 68 6
Others 3 2 22 4 2 1 5 1 32 3
Ethnicity
Brunei Malay 121 63 405 78 89 74 150 84 765 76
Indigenous 13 2 47 1 79 20 56 3 195 2
Chinese 44 23 72 14 4 2 27 8 147 14
Other 27 12 44 8 7 4 12 5 90 8
Highest educational attainment
University 24 9 100 18 9 4 38 14 171 16
A level 46 23 102 18 14 8 32 13 194 18
ONC, vocational school 25 12 28 5 11 5 12 5 76 6
Lower or upper secondary
school
88 45 275 49 96 54 118 48 577 49
Primary school 17 8 40 7 33 19 26 11 116 8
Other* 4 2 16 3 15 10 18 8 53 4
Household income (monthly)**
Less than $1,000 30 16 100 18 46 30 54 24 230 19
$1,000–$1,999 38 22 116 21 69 39 52 22 275 22
$2,000–$3,999 63 31 158 29 47 24 71 30 339 29
$4,000 or more 67 31 181 32 13 7 62 24 323 31
*Less than primary school
**All currency reported in BND
24
3.2 Healthcare Utilization by Respondent Characteristics
To explore how public healthcare utilization differed by respondent characteristics,
multinomial logistic regression was used to analyze how independent variables
including respondents’ age, citizenship status, ethnicity, employment status, income,
and district of residence affected public healthcare utilization (Table 3).
Respondents between ages 40 and 59 years reported significantly lower rates of
public healthcare utilization in the past six months when compared with all other age
groups. Specifically, 40-59 year olds were 1.67 times less likely to utilize public
healthcare when compared to respondents between 19 and 29 years old. Respondents
over age 60 were not significantly more likely to utilize public healthcare compared to
respondents in other age groups.
Brunei citizenship was compared to other citizenship categories, including
permanent resident, temporary resident, and other. Respondents who identified as
temporary residents or other were significantly less likely to utilize public healthcare
compared to Brunei citizens. Specifically, temporary residents were 7.90 times less likely
to utilize public healthcare compared to citizens, and respondents who classified
themselves as “other” were 5.80 times less likely to utilize public healthcare compared to
citizens.
Ethnicity did not have a significant impact on public healthcare utilization when
looking at respondent-level data, and no ethnic groups were significantly more likely

25
than Brunei Malay to utilize public healthcare. Similarly, income was not a significant
predictor of public healthcare utilization at the respondent level.
When compared to employment in the government sector, respondents who were
employed in the private sector were 2.18 times less likely to utilize public healthcare.
Similarly, respondents who were retired were 2.72 times less likely to utilize public
healthcare compared to government sector employees. Unemployed respondents did
not demonstrate significantly lower rates of public healthcare utilization when
compared to government sector employees.
Respondents who were residents of Temburong reported significantly lower rates of
public healthcare utilization when compared to all other districts in Brunei. Specifically,
Temburong residents were 3.17 times less likely to utilize public healthcare when
compared to residents of other districts.
Overall, the majority of respondents rated their health as good (43%) and few people
reported excellent or poor health (9% and 1%, respectively). Among all respondents,
those who reported fair health were significantly more likely to utilize public healthcare
when compared to respondents in excellent health. Respondents in poor health did not
demonstrate significantly higher rates of public healthcare utilization.
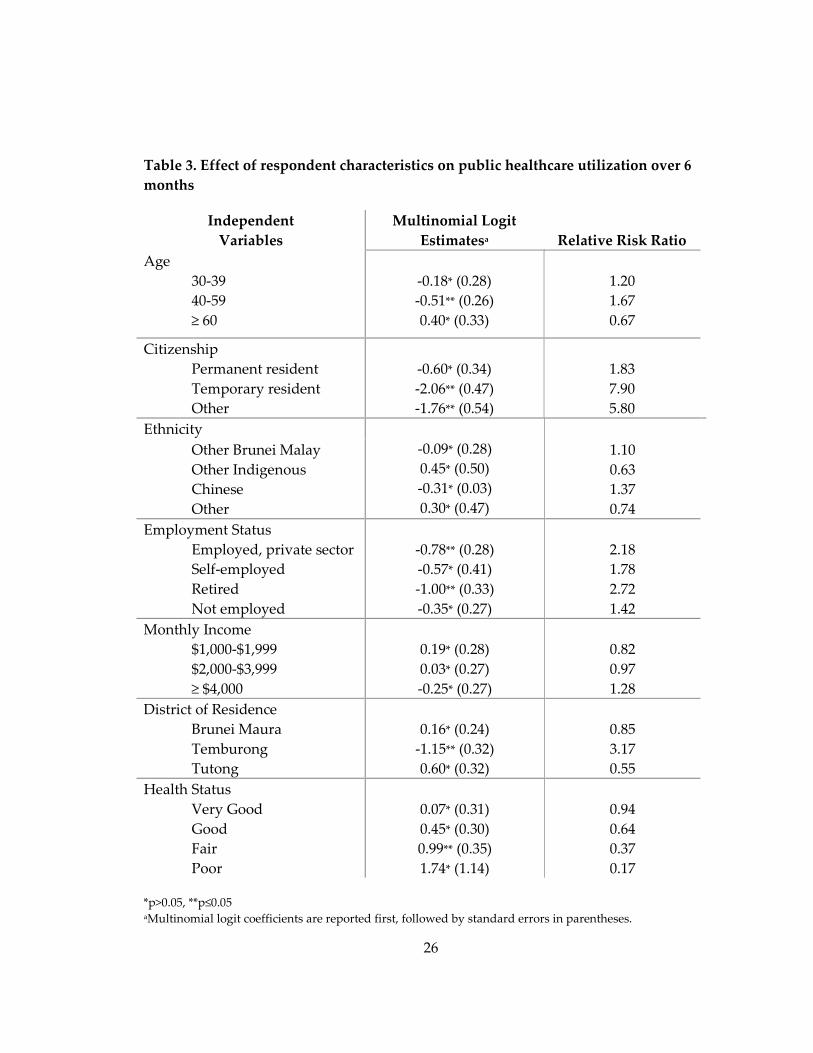
26
Table 3. Effect of respondent characteristics on public healthcare utilization over 6
months
Independent
Variables
Multinomial Logit
Estimatesa Relative Risk Ratio
Age
30-39
40-59
≥ 60
-0.18* (0.28)
-0.51** (0.26)
0.40* (0.33)
1.20
1.67
0.67
Citizenship
Permanent resident
Temporary resident
Other
-0.60* (0.34)
-2.06** (0.47)
-1.76** (0.54)
1.83
7.90
5.80
Ethnicity
-0.09* (0.28)
0.45* (0.50)
-0.31* (0.03)
0.30* (0.47)
Other Brunei Malay
Other Indigenous
Chinese
Other
1.10
0.63
1.37
0.74
Employment Status
Employed, private sector
Self-employed
Retired
Not employed
-0.78** (0.28)
-0.57* (0.41)
-1.00** (0.33)
-0.35* (0.27)
2.18
1.78
2.72
1.42
Monthly Income
$1,000-$1,999
$2,000-$3,999
≥ $4,000
0.19* (0.28)
0.03* (0.27)
-0.25* (0.27)
0.82
0.97
1.28
District of Residence
Brunei Maura
Temburong
Tutong
0.16* (0.24)
-1.15** (0.32)
0.60* (0.32)
0.85
3.17
0.55
Health Status
Very Good
Good
Fair
Poor
0.07* (0.31)
0.45* (0.30)
0.99** (0.35)
1.74* (1.14)
0.94
0.64
0.37
0.17
*p>0.05, **p≤0.05 aMultinomial logit coefficients are reported first, followed by standard errors in parentheses.

27
3.3 Healthcare Utilization and Expenditures by Household Characteristics
3.3.1 Public Healthcare Utilization
Household public healthcare utilization was stratified by household
characteristics, including citizenship status, ethnicity, income, and district of residence
(Table 4). Multinomial logistic regression indicated that public healthcare utilization was
significantly lower among temporary residents and households who characterized their
citizenship as “other.” When compared to Brunei citizens, temporary residents were 8.00
times less likely to utilize public healthcare, and “other” households were 5.55 times less
likely to utilize public healthcare. Permanent residents were not significantly less likely
to utilize public healthcare compared to citizens.
Among all ethnic groups only Chinese households demonstrated significantly
lower public healthcare utilization compared to Brunei Malay households. Specifically,
Chinese households were 2.06 times less likely to utilize public healthcare in the past six
months.
Monthly household income was not a significant predictor of household public
healthcare utilization. Households in the highest income group (≥$4,000 per month)
were less likely to utilize public healthcare; however, the difference was not significant
when compared to other income groups.

28
Data indicate significant differences in public healthcare utilization based on
district of residence. Residents of Temburong were 2.67 times less likely to utilize public
healthcare compared to residents of other districts. Tutong residents, however, were 38
percent more likely to utilize public healthcare compared to residents of other districts.
Table 4. Effect of household characteristics on public healthcare utilization over 6
months
Independent
Variables
Multinomial Logit
Estimatesa Relative Risk Ratio
Citizenship
Permanent resident
Temporary resident
Other
-0.59* (0.36)
-2.08** (0.48)
-1.71** (0.54)
1.80
8.00
5.55
Ethnicity
-0.10* (0.33)
0.40* (0.54)
-0.72** (0.33)
-0.30* (0.48)
1.10
0.67
2.06
1.34
Other Brunei Malay
Other Indigenous
Chinese
Other
Monthly Income
$1,000-$1,999
$2,000-$3,999
≥ $4,000
0.30* (0.31)
0.12* (0.30)
-0.20* (0.30)
0.74
0.89
1.22
District of Residence
Brunei Maura
Temburong
Tutong
0.26* (0.27)
-0.98** (0.34)
0.97** (0.38)
0.77
2.67
0.38 *p>0.05, **p≤0.05 aMultinomial logit coefficients are reported first, followed by standard errors in parentheses.

29
3.3.2 Private Healthcare Utilization
Household private healthcare utilization was stratified by household
characteristics, including citizenship status, ethnicity, income, and district of residence
(Table 5). Citizenship was not a significant predictor of private healthcare utilization.
Ethnicity was significant, however, for households who reported being Other
Indigenous or Chinese. Other Indigenous households were 28 percent less likely to
utilize private healthcare when compared to Brunei Malay households. Conversely,
Chinese households were 1.71 times more likely to utilize private healthcare when
compared to Brunei Malay households.
Household income was a significant predictor of private healthcare utilization.
When compared to the lowest income group (≤$1,000 monthly), all income categories
utilized significantly more private healthcare. Furthermore, monthly household income
was positively associated with higher private healthcare utilization. Households in the
highest income group (≥$4,000) were 3.46 times more likely to utilize private healthcare
compared to households in the lowest income group (≤$1,000). Households who
reported monthly income of $2,000-3,999 were 2.25 times more likely to utilize private
healthcare and households who reported $1,000-$1,999 were 1.70 times more likely to
utilize private healthcare compared to the lowest income group.
District was also strongly correlated with private healthcare use. The highest
private utilization was reported in Brunei Maura (58%) and the lowest was in
30
Temburong (8%). Tutong (39%) and Belait (45%) reported moderate rates of private
healthcare utilization. Multinomial logistic regression also indicates that district of
residence is a significant predictor of private healthcare utilization for both Brunei
Maura and Temburong. A positive relationship was observed between residence in
Brunei Maura and increased private healthcare utilization. Residents of Brunei Maura
were 1.85 times more likely to use private healthcare compared to other districts.
Residents of Temburong, however, were 22 percent less likely to utilize private
healthcare services compared to other districts.

31
Table 5. Effect of household characteristics on private healthcare utilization over 6
months
Independent
Variables
Multinomial Logit
Estimatesa Relative Risk Ratio
Citizenship
Permanent resident
Temporary resident
Other
-0.13* (0.30)
-0.02* (0.42)
0.24* (0.48)
0.88
0.98
1.27
Ethnicity
-0.25* (0.22)
-1.27** (0.64)
0.54** (0.24)
-0.01* (0.39)
0.78
0.28
1.71
1.00
Other Brunei Malay
Other Indigenous
Chinese
Other
Monthly Income
$1,000-$1,999
$2,000-$3,999
≥ $4,000
0.53** (0.21)
0.81** (0.20)
1.24** (0.20)
1.70
2.25
3.46
District of Residence
Brunei Maura
Temburong
Tutong
0.61** (0.18)
-1.52** (0.31)
-0.06* (0.21)
1.85
0.22
0.94 *p>0.05, **p≤0.05 aMultinomial logit coefficients are reported first, followed by standard errors in parentheses.
3.3.3 Private Healthcare Expenditures
To determine if healthcare expenditures correspond to perceived health need in the
six-month recall period, household private healthcare expenditures were analyzed by
self-reported health status (Table 6). Respondents with poor health reported spending a
moderate amount on private healthcare in the prior six months. The highest rates of
healthcare spending occurred amongst individuals who reported good health.

32
Table 6. Household private healthcare expenditures over 6 months by health status*
Health
Status $0 $1-$149
$150-
$499
$500 or
more Total
N % N % N % N % N
Excellent 9 15 25 8 9 10 5 20 48
Very Good 17 29 85 27 21 22 6 24 129
Good 18 31 133 42 40 43 14 56 205
Fair 15 25 65 21 21 22 12 48 113
Poor 0 0 5 2 3 3 0 0 8
Total (N) 59 313 94 37 503**
*All currency reported in BND
**Total N includes only inviduals who reported private healthcare utilization in past 6 months
Healthcare expenditures among households that utilized private healthcare did not
vary significantly based on citizenship status (Table 7). Expenditures in this group were
nearly equal for citizens and non-citizens, with 89 percent of non-citizens and 88 percent
of citizens spending any money on private healthcare in the previous six months. The
majority of households that utlized private healthcare reported spending between
BND$1-$149 on private healthcare in the past six months, regardless of citizenship
status. A small percentage reported spending more than BND$2,000; however, 11
percent of permanent residents spent BND$2,000 or more compared to two percent of
Brunei citizens and three percent of temporary residents.
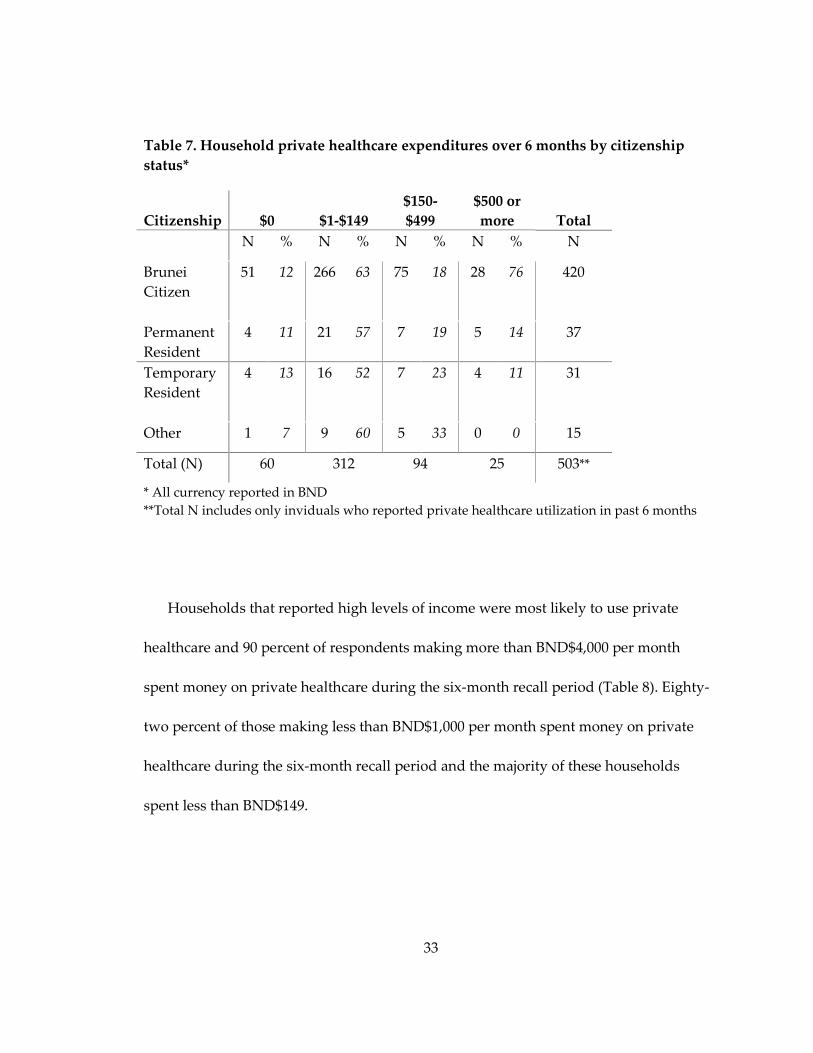
33
Table 7. Household private healthcare expenditures over 6 months by citizenship
status*
Citizenship $0 $1-$149
$150-
$499
$500 or
more Total
N % N % N % N % N
Brunei
Citizen
51 12 266 63 75 18 28 76 420
Permanent
Resident
4 11 21 57 7 19 5 14 37
Temporary
Resident
4 13 16 52 7 23 4 11 31
Other 1 7 9 60 5 33 0 0 15
Total (N) 60 312 94 25 503**
* All currency reported in BND
**Total N includes only inviduals who reported private healthcare utilization in past 6 months
Households that reported high levels of income were most likely to use private
healthcare and 90 percent of respondents making more than BND$4,000 per month
spent money on private healthcare during the six-month recall period (Table 8). Eighty-
two percent of those making less than BND$1,000 per month spent money on private
healthcare during the six-month recall period and the majority of these households
spent less than BND$149.

34
Table 8. Household private healthcare expenditures over 6 months by monthly
household income*
Expenditures
Monthly
Household
Income $0 $1-$149 $150-$499
$500-
$1,999
$2,000 or
more Total
N % N % N % N % N % N
Less than
$1,000
10 18 34 61 9 16 2 4 1 2 56
$1,000-
$1,999
11 12 60 67 14 16 3 3 2 2 90
$2,000-
$3,999
18 12 94 62 31 21 7 5 1 1 151
$4,000 or
more
19 10 116 60 40 21 12 6 8 4 195
Total (N) 58 304 94 24 12 492**
*All currency reported in BND
**Total N includes only inviduals who reported private healthcare utilization in past 6 months
35
4. Discussion
4.1 Key Findings
The HSS gathered input from the general public in Brunei about expectations and
patterns of utilization related to the national healthcare system. The aim of this research
paper is to use HSS data to determine if the Brunei national healthcare system provides
equitable access to healthcare across varying health needs and consumer characteristics.
Perceived health status was found to be a significant indicator of healthcare
utilization for both public and private care. As expected, those with poor health used
healthcare services more often than those reporting excellent health. This finding may
indicate that utilization is proportional to health need, which would be ideal for a
properly functioning health system. This survey, however, did not adequately assess
whether or not respondents in poor health received sufficient healthcare.
Respondents with higher income were more likely to report better health status and
higher private healthcare utilization. Survey results suggest that wealthier individuals
are healthier and are able to spend money on additional healthcare services not covered
under the national healthcare system. The association between socioeconomic status and
health has been well documented in academic literature, and Roos and Mustard (1997)
explored differences in healthcare access among SES groups under the Canadian
universal healthcare system. The authors determined that lower SES groups utilized
acute hospital care and primary care services more frequently than higher SES groups;
36
however, similar rates were observed for ambulatory services because higher SES
groups were better able to navigate the healthcare system and receive care for less
critical medical conditions (Roos & Mustard, 1997). Lower-income households and
unemployed respondents in Brunei reported utilizing healthcare at a comparable rate to
more average income levels suggesting that low income does not result in significantly
decreased healthcare access. Per the findings of Roos and Mustard, however, this may
indicate that higher SES groups are more likely to utilize healthcare due to minor
complaints, whereas, lower SES groups may avoid healthcare until more severe health
conditions develop (Roos & Mustard, 1997).
Significant differences in healthcare utilization were observed among rural and
Indigenous populations. Temburong district was associated with the lowest rates of
healthcare utilization for both public and private services. As previously described,
Temburong is the most rural district in Brunei and is geographically isolated from
mainland Brunei. Temburong also contains the fewest healthcare facilities and the
largest proportion of Indigenous groups compared to other districts. Based on these
factors, it is not surprising that residents of Temburong experience decreased access to
healthcare services. The government of Brunei established services such as the flying
medical service to increase healthcare access for residents of remote areas like
Temburong, however, HSS data suggest that these services are not widely utilized and
that Temburong residents and Indigenous populations continue to utilize healthcare
37
services less than other populations in Brunei. Voeks and Sercombe describe healthcare
seeking behavior among a small Indigenous group in Temburong district and suggest
that their hunter-gatherer lifestyle results in greater reliance on plant medicine and
spiritual healing and reduced healthcare utilization, although their use of government
health services has increased in recent years. Ethnographic research suggests that
Indigenous groups in Brunei are transitioning toward traditional employment and
mainstream religious beliefs, and therefore will play an increasing role in Bruneian
society in the coming years, including increased utilization of the national healthcare
system. (Voeks & Sercombe, 2000)
Findings also indicate that temporary residents and minority groups utilize the
public healthcare system significantly less than citizens. This trend may be explained by
alternative healthcare utilization, including temporary residents delaying healthcare
utilization until they return to their home country, or minority groups being more likely
to seek alternative forms of medical care (Voeks & Sercombe, 2000). Private healthcare
expenditures and utilization did not differ significantly for citizens and non-citizens;
however, this is not an accurate measure of the equity of healthcare access. Non-citizens
may be underutilizing both public and private healthcare services due to out-of-pocket
costs. Furthermore, non-citizens may be more likely to utilize private health services
because they perceive it to be better quality than public healthcare.
38
4.2 Conclusion and Implications for Future Research
The Brunei Darussalam Health System Survey provides insight into citizens’
perspectives of a universal healthcare system in Southeast Asia. The context for this
study was unique in that Brunei Darussalam’s country profile and GDP are inimitable
compared to most other nations in the world; however, this does not preclude making
inferences about the utility of similar healthcare systems in other contexts. Despite
reduced financial barriers and the presence of remote medical services like the flying
medical service, rural populations are still less likely to utilize the healthcare system
when compared to populations residing in more urban areas. This finding demonstrates
the challenges associated with ensuring equal access for rural populations, especially
when populations are geographically isolated from the mainland, which is common in
many Southeast Asian nations. Universal healthcare planning should prioritize rural
populations to ensure that equal access is achieved and follow-up studies should be
conducted to understand population-specific barriers to healthcare.
Non-citizens are also less likely to utilize government healthcare in Brunei, however
the reasons for this were not adequately captured in the HSS because it was primarily
targeted towards Brunei citizens. Future research should investigate how non-citizens
interact with the national healthcare system and assess whether or not healthcare needs
are going unmet in this population. Furthermore, as the population of foreign domestic
workers increases in Brunei non-citizen healthcare utilization should be included in

39
national healthcare planning efforts in order to adequately forecast future healthcare
demand and ensure that adequate resources are available.
Qualitative data collection would enhance further studies of the Brunei national
healthcare system by exploring citizens’ expectations of and experiences with the
healthcare system. Healthcare access and equity is one way to assess the effectiveness of
the national healthcare system, however, healthcare quality and outcomes must also be
analyzed to determine if healthcare is both accessible and effective. Furthermore, the
HSS provides a baseline understanding of citizens’ attitudes and perceptions and would
be enhanced by implementing the HSS again at regular intervals to understand how
attitudes and behaviors change over time.
Brunei ranks low on international measures of civil liberties and human rights,
meaning that the HSS is a symbolic effort to gather feedback from the general
population (Ministry of Health, 2013). The government’s interest in the opinions of its
citizens will give voice to individuals who previously had no outlet to share opinions
regarding the national healthcare system; however, this exercise will only have utility if
the government implements operational and policy changes based on citizens’ feedback.
Additional evaluation efforts should be conducted to determine how or if HSS data
impacts government planning and allocation for healthcare services.
Overall, universal healthcare programs show promise for increasing equity in access
to healthcare. Brunei does have many advantages, however, such as high GDP that have

40
accelerated its success. Other Southeast Asian nations will face greater challenges
ensuring adequate resources to fund healthcare services and reach vulnerable
populations. Findings of the HSS do indicate that well-funded universal healthcare can
reduce significant utilization disparities. Substantial financial resources do not, however,
guarantee equity among rural and minority populations and universal healthcare efforts
should incorporate measures to understand and address barriers to healthcare among
these groups.
41
Author Acknowledgments
The Brunei Health System Survey was one component of the Brunei Darussalam
Master Plan for Health System and Healthcare Infrastructure. The survey was led by RTI
International through a contract with The Innova Group and the Brunei Darussalam
Ministry of Health. The author received funding from the Duke University Global
Health Institute to complete this research study. The author spent ten weeks in Brunei
during which she assisted with survey instrument development and translation, co-led
interviewer training, supervised interviewers in the field, supervised data entry, and
conducted quality checks of completed survey instruments and data entry.

42
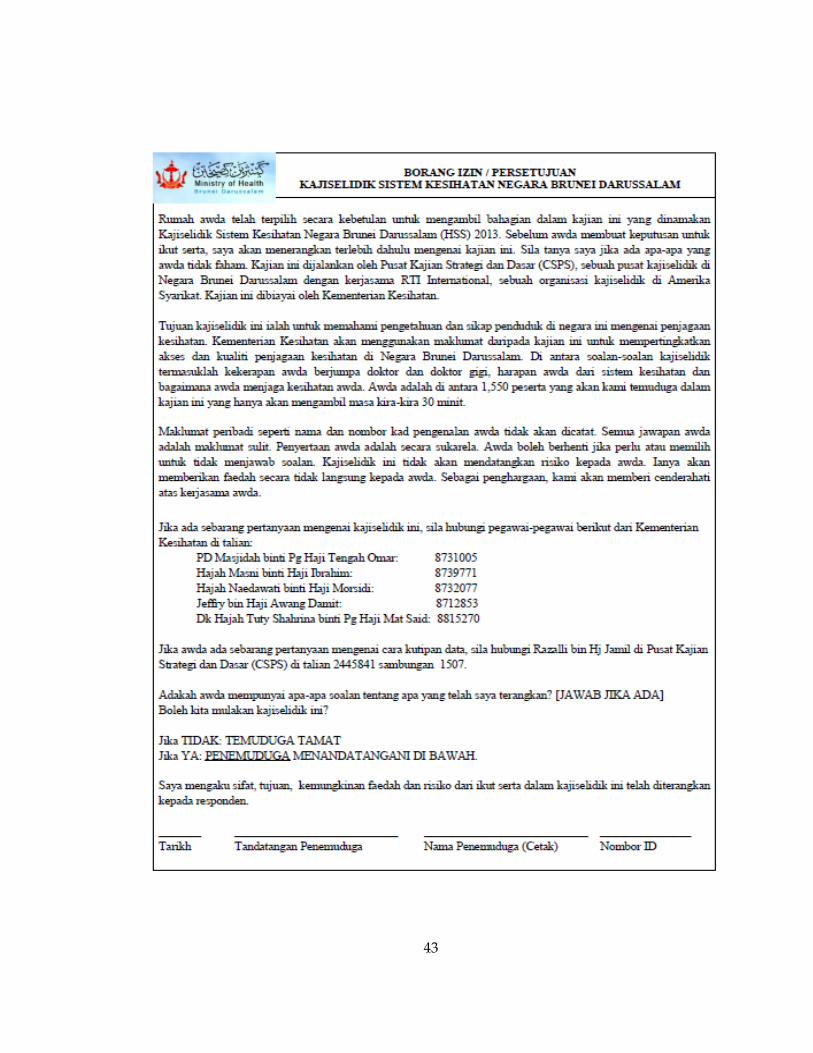
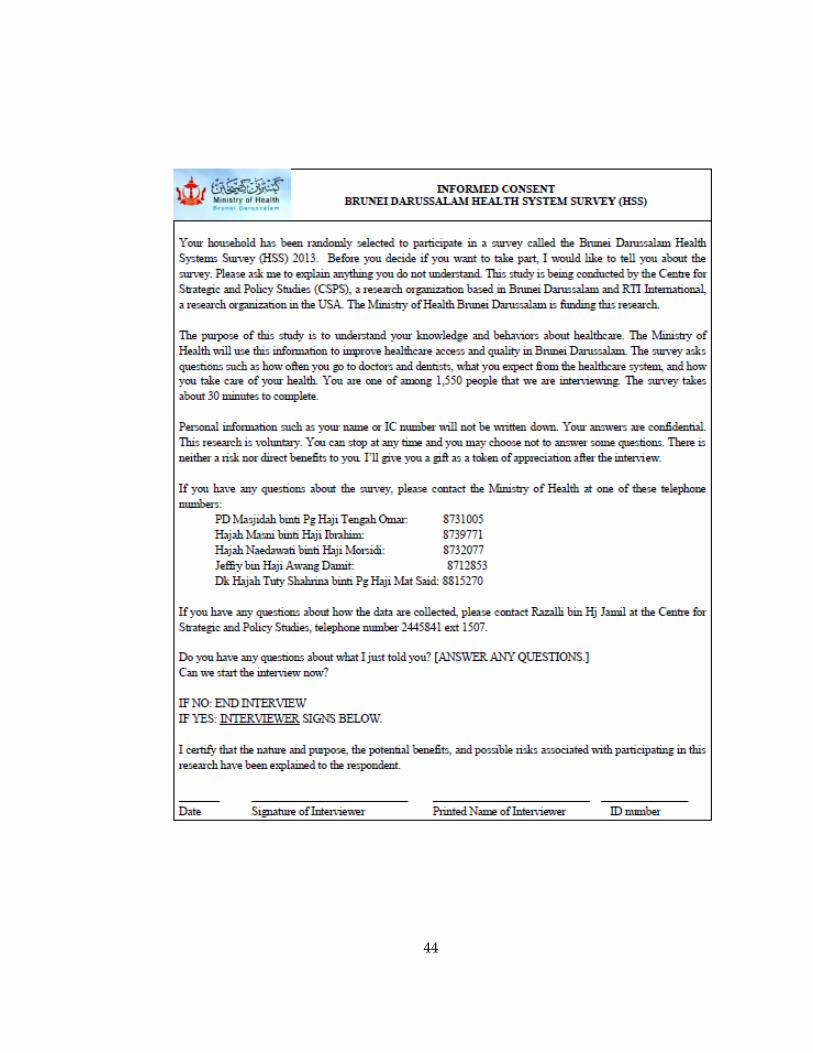
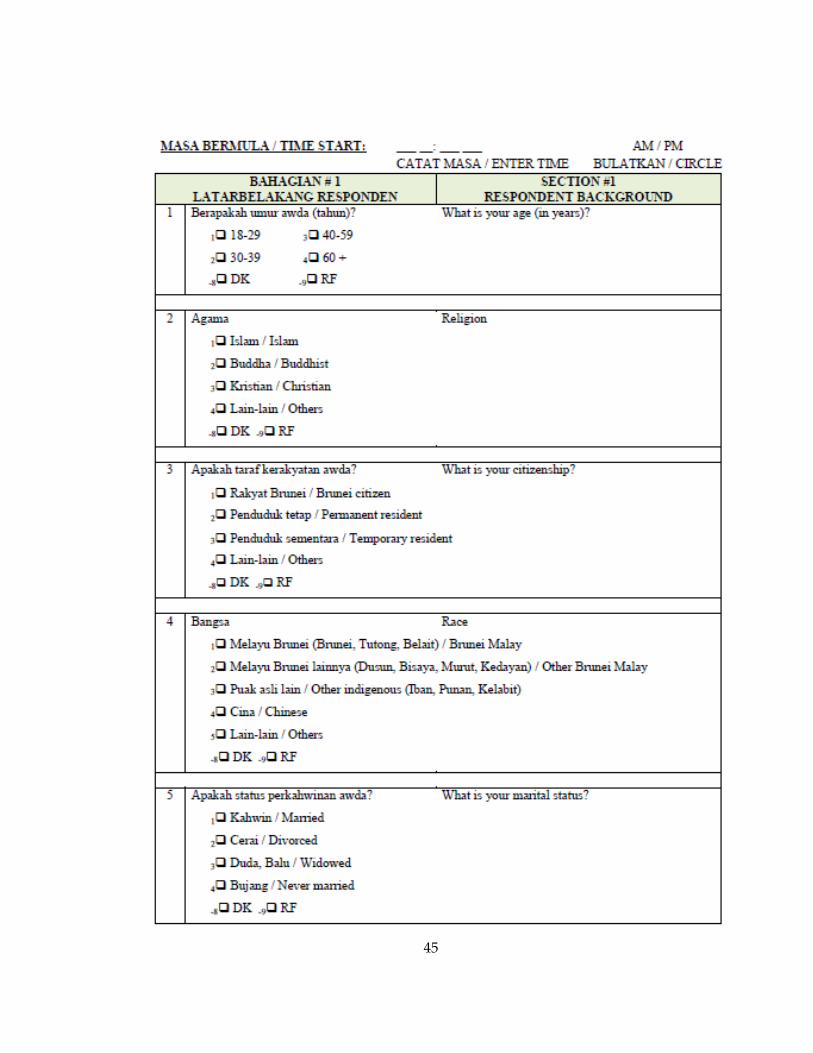
Appendix. Survey Instrument
43
44
45
46
47
48
49
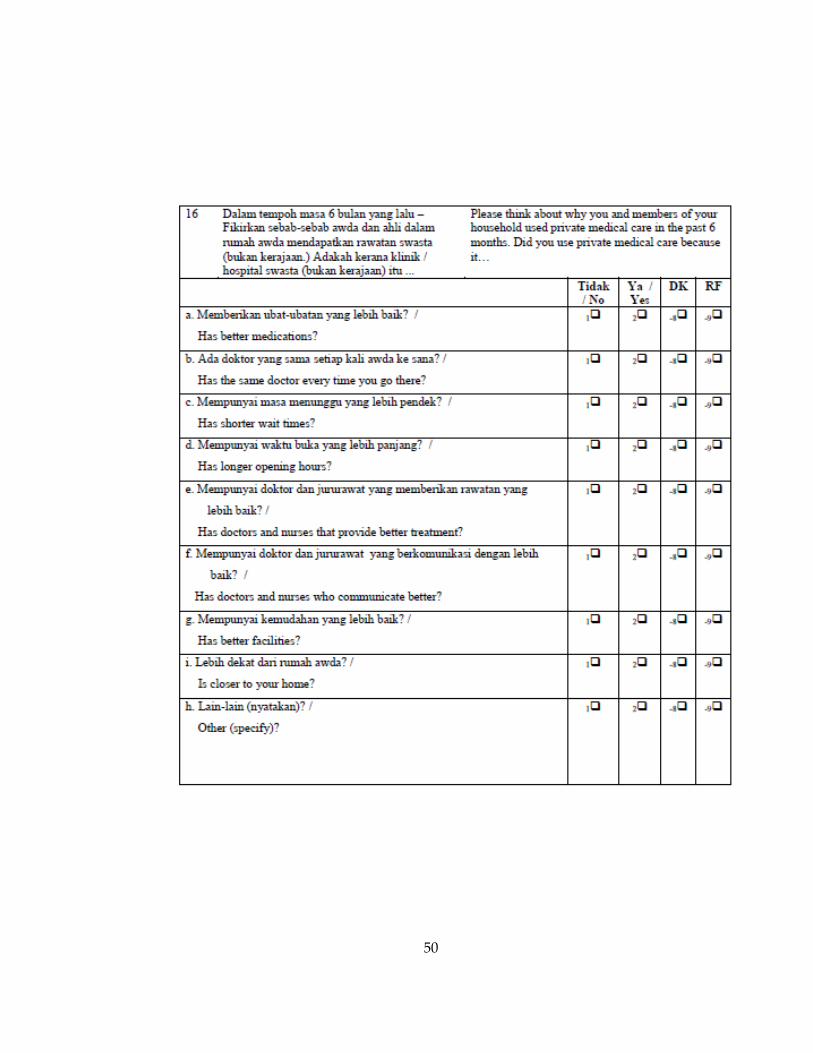
50
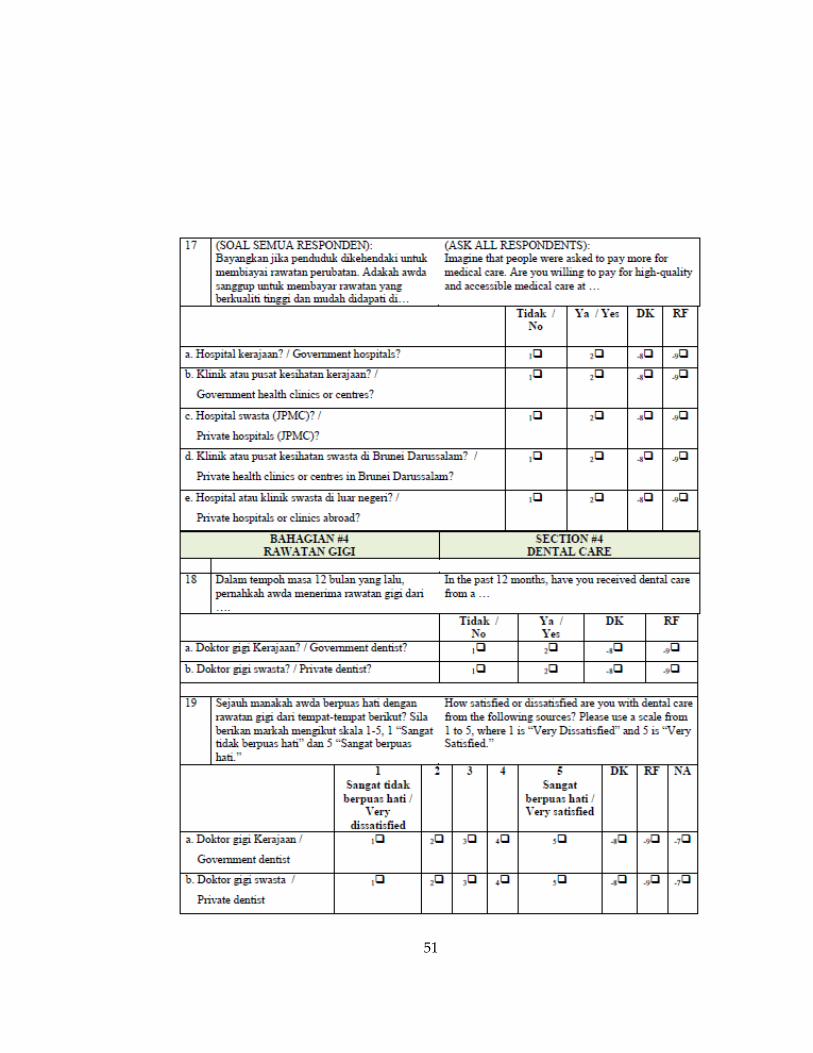
51
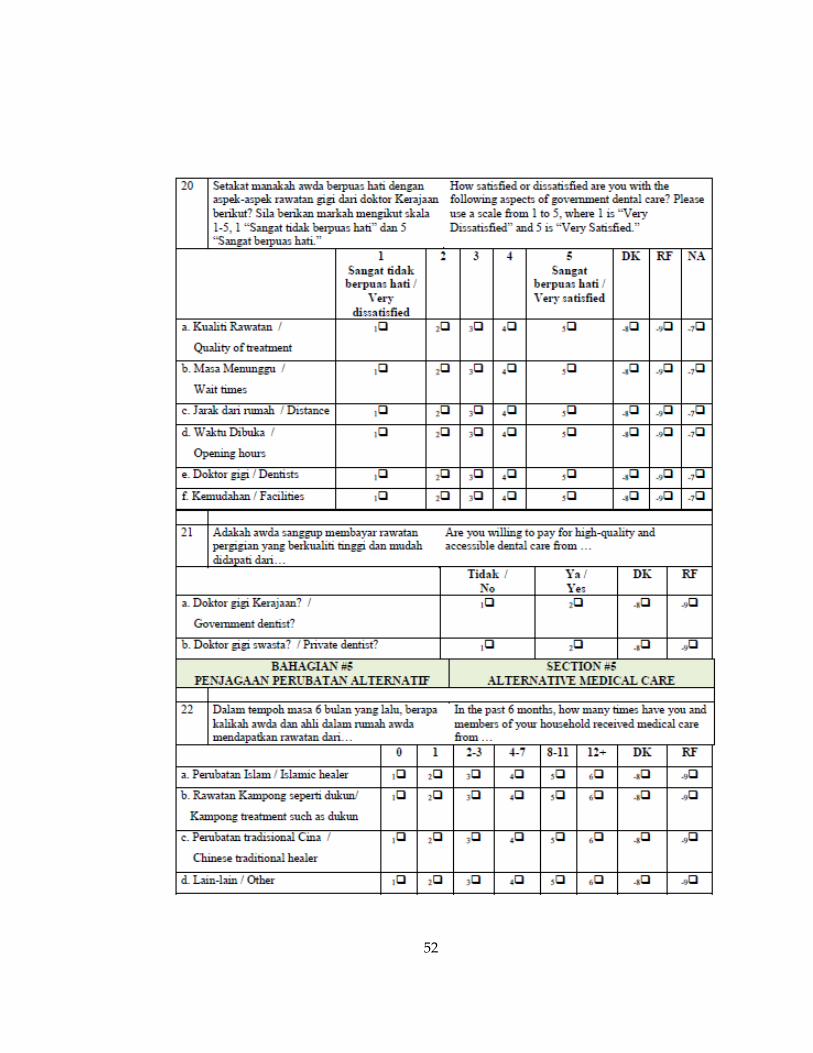
52

53
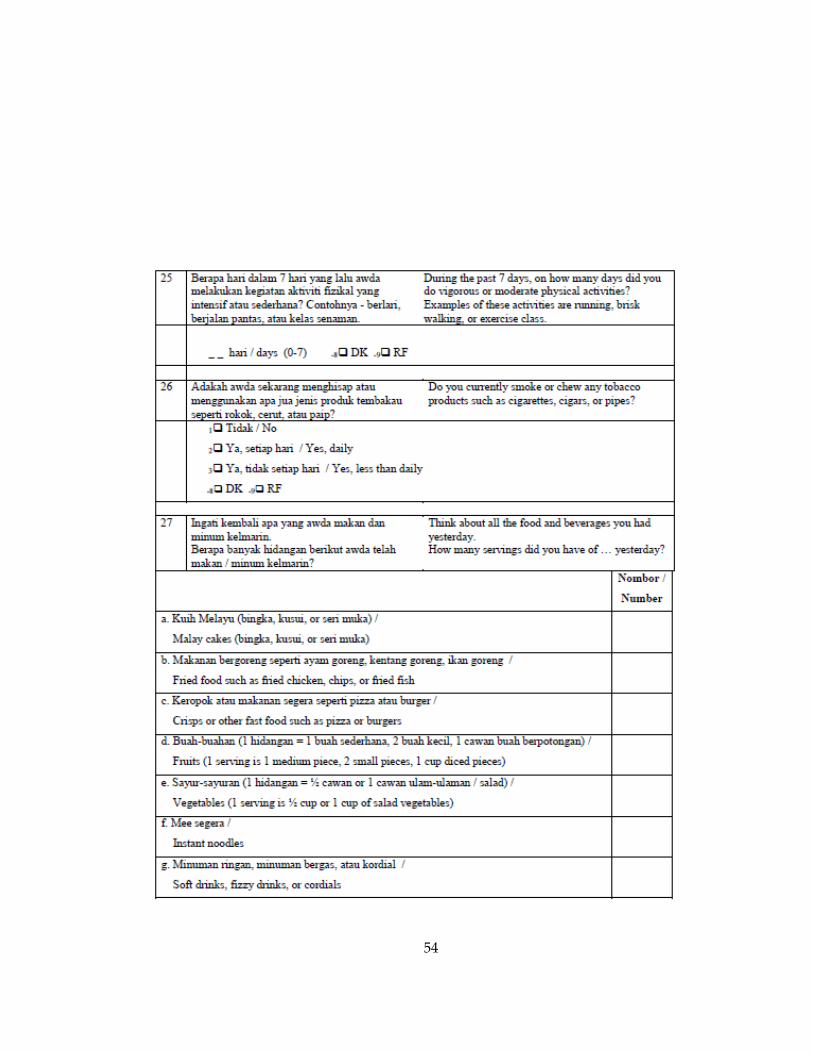
54
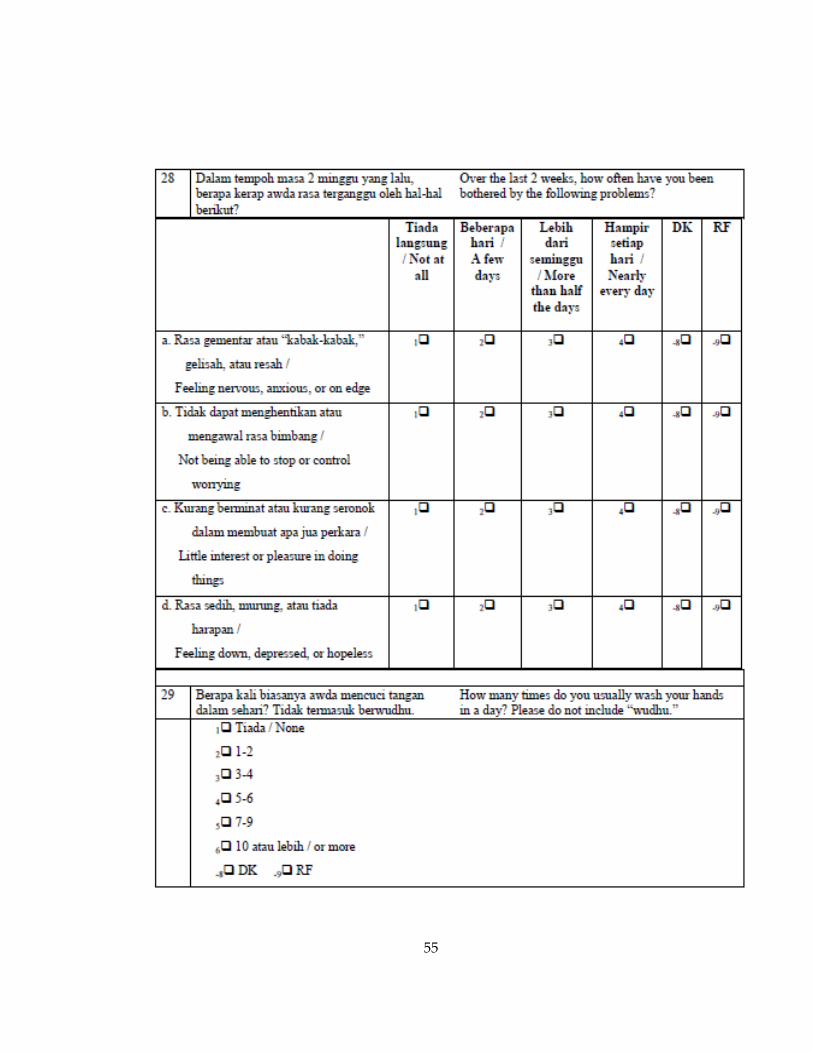
55
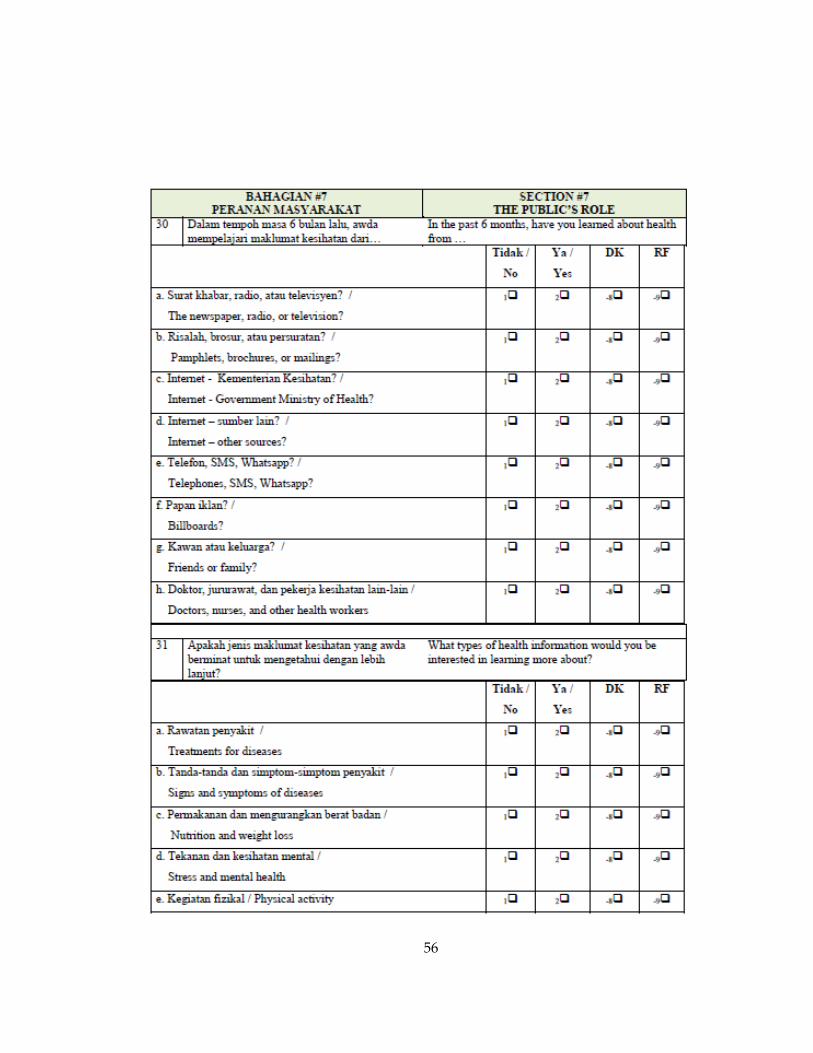
56
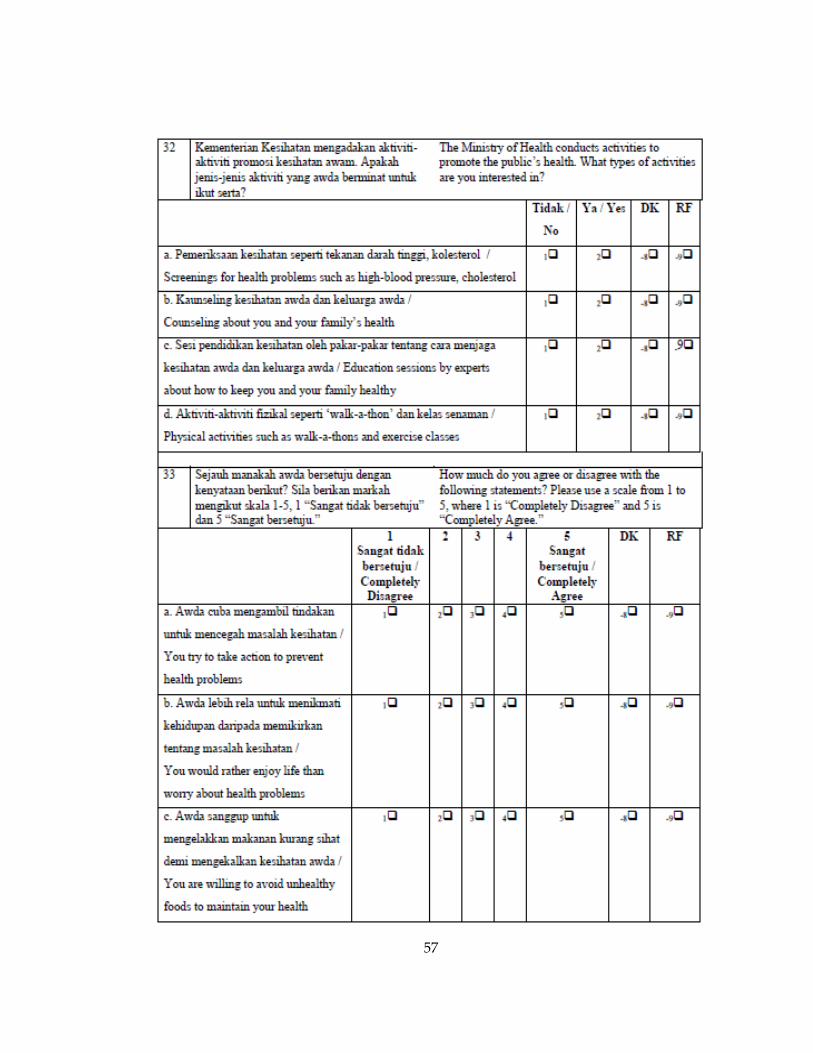
57

58
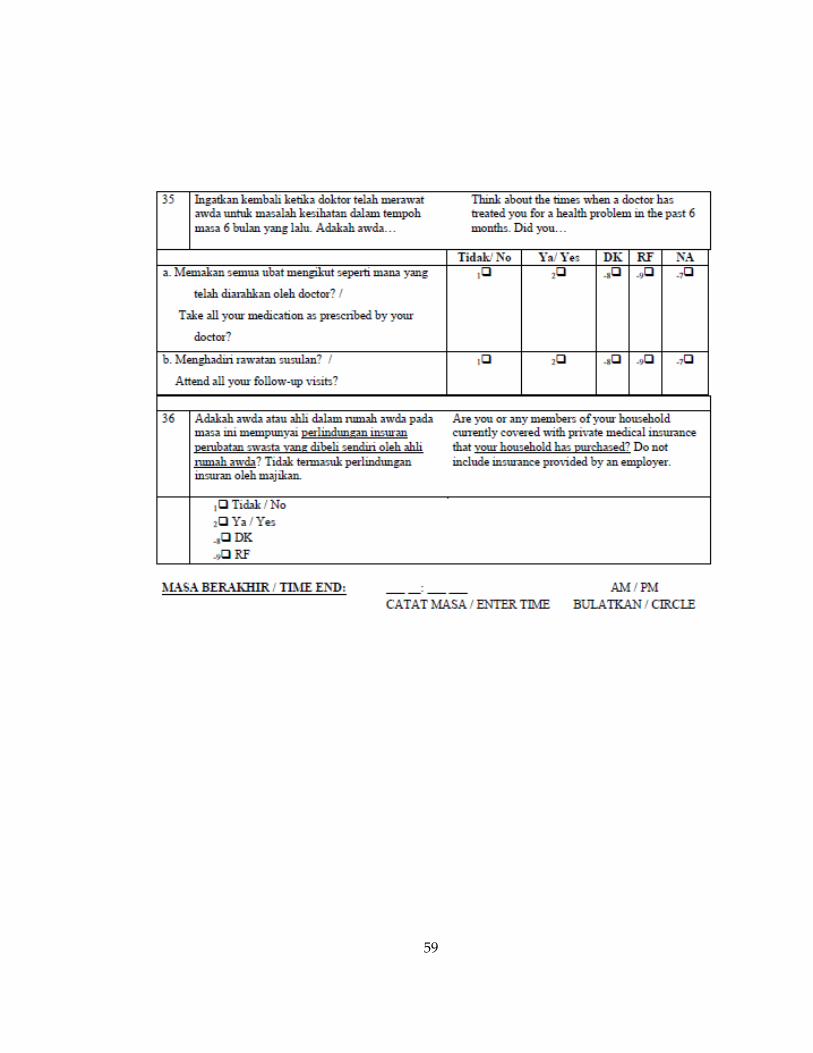
59
60

61
62

63
References
Almunawar, M. N., Wint, Z., Low, K. C., & Anshari, M. (2012). Customer expectation of
e-health systems in Brunei Darussalam. Journal of Health Care Finance, 38(4), 36-49.
Anshari, M., Almunawar, M. N., Low, P. K., & Al-Mudimigh, A. S. (2012). Empowering
clients through e-Health in healthcare services: case Brunei. International
Quarterly of Community Health Education, 33(2), 189-219.
Australian Government. (2013). Brunei Darussalam Country Brief. Retrieved from
http://www.dfat.gov.au/geo/brunei/brunei_brief.html.
Azim, P. (2002). The Ageing Population of Brunei Darussalam: Trends and Economic
Consequences. Asian-Pacific Population Journal, 17(1).
United States Central Intelligence Agency. (2014). The World Factbook: Brunei.
Retrieved from https://www.cia.gov/library/publications/the-world-
factbook/geos/bx.html
Ensor, T., & San, P. B. (1996). Access and Payment for Health Care: The Poor of Northern
Vietnam. International Journal of Health Planning and Management, 11, 69-83.
Fitzgerald, P. (2009). Brunei Regions Map. Retrieved from
http://commons.wikimedia.org/wiki/File:Brunei_regions_map.png.
Gunn, G. C. (2000). New World Hegemony in the Malay World. Red Sea Press.
Health Knowledge. (2009). Health Care Evaluation: Equity in health care. Rosalind
Blackwood.
Healthy People 2020. (2013). Access to Health Services. Retrieved from
http://www.healthypeople.gov/2020/topicsobjectives2020/overview.aspx?topicid
=1.
Lagomarsino, G., Garabrant, A., Adyas, A., Muga, R., & Otoo, N. (2012). Moving
towards universal health coverage: health insurance reforms in nine developing
countries in Africa and Asia. The Lancet, 380.
McKeown, R. E. (2009). The Epidemiologic Transition: Changing Patterns of Mortality
and Population Dynamics. Am J Lifestyle Med, 3(1 Suppl 1), 19S–26S.
64
Microsoft. (2009). Excel 2007: Version 12.
Mills, A., Ally, M., Goudge, J., Guapong, J., & Mtei, G. (2012). Progress towards
universal coverage: the health systems of Ghana, South Africa, and Tanzania.
Health Policy and Planning, 27, i4-i12.
Brunei Darussalam Ministry of Health (2013). Master Plan for the Health System and
Healthcare Infrastructures, Brunei: Core Systems Review.
Minority Rights Group International. (no date). Asia and Oceania MRG Directory,
Chinese in Brunei Darussalam. Retrieved from
http://www.minorityrights.org/?lid=3903&tmpl=printpage
Moreno-Serra, R., & Smith, P. C. (2012). Does progress towards universal health
coverage improve population health? . The Lancet, 380, 917-923.
Mulupi, S., Kirigia, D., & Chuma, J. (2013). Community perceptions of health insurance
and their preferred design features: implications for the design of universal
health coverage reforms in Kenya. BMC Health Services Research, 13.
New York State. (2011). Foreign Countries with Universal Healthcare. Retrieved from
http://www.health.ny.gov/regulations/hcra/univ_hlth_care.htm.
Oxford Business Group. (2013). The Report: Brunei Darussalam 2013.
Korda, R.J., Banks, E., Clements, M.S., & Young, A.F. (2009). Is inequity undermining
Australia’s ‘universal’ health care system? Socio-economic inequalities in the use
of specialist medical and non-medical ambulatory health care. Australian and New
Zealand Journal of Public Health, 33(5).
Roos, N. P., & Mustard, C. A. (1997). Variation in Health and Health Care Use by
Socioeconomic Status in Winnipeg, Canada: Does the System Work Well? Yes
and No. The Milbank Quarterly, 75(1).
StataCorp. (2013). Stata Statistical Software: Release 13. College Station, TX: StataCorp
LP.
65
Stuckler, D., Feigl, A. B., Basu, S., & McKee, M. (2010). The political economy of unversal
health coverage. Global Symposium on Health Systems Research. Montreux,
Switzerland.
Swanson, R. C., Bongiovanni, A., Bradley, E., Murugan, V., Sundewall, J., Betigeri, A., &
Labonte, R. (2010). Toward a Consensus on Guiding Principles for Health
Systems Strengthening. PLoS Medicine, 7(12).
Tangcharoensathien, V., Patcharanarumol, W., Ir, P., Aljunid, S. M., Mukti, A. G.,
Akkhavong, K.,& Mills, A. (2011). Health-financing reforms in southeast Asia:
challenges in achieving universal coverage. The Lancet, 377, 863-873.
The Commonwealth Fund. (2010). International Profiles of Health Care Systems. Retrieved
from
http://www.commonwealthfund.org/~/media/Files/Publications/Fund%20Report
/2010/Jun/1417_Squires_Intl_Profiles_622.pdf.
The World Bank. (2014). Universal Health Coverage Study Series.
Universal Health Care Forward (Producer). (2013). Four Basic Models for Health Care
Systems. Retrieved from http://uhcforward.org/about/universal-health-
coverage/basic-models
United Nations. (2012). Draft Resolution A/67/L.36, Global Health and Foreign Policy.
University of Michigan. (2011). Guidelines for Best Practice in Cross-Cultural Surveys.
Voeks, R. A., & Sercombe, P. (2000). The scope of hunter-gatherer ethnomedicine. Social
Science & Medicine, 51(5), 679-690.
World Health Organization. (2010). Health Systems Financing: The Path to Universal
Coverage. Geneva, Switzerland.
World Health Organization. (2010). How can the health equity impact of universal
policies be evaluated? Insights into approaches and next steps. In B. Milton, M.
May, D. Taylor-Robinson & M. Whitehead (Eds.).
World Health Organization. (2012). What is universal health coverage? Retrieved from
http://www.who.int/features/qa/universal_health_coverage/en/index.html
66
World Health Organization. (2008). Social determinants of health. Retrieved from
http://www.who.int/social_determinants/thecommission/finalreport/key_concept
s/en/.
World Health Organization. (2010). Thailand: health care for all, at a price. Bulletin of the
World Health Organization. 88. Retrieved from
http://www.who.int/bulletin/volumes/88/2/10-010210/en/