equity and the willingness to pay for green ... - rwi-essen… · university of duisburg-essen, ......
TRANSCRIPT
RUHRECONOMIC PAPERS
Equity and the Willingness to Payfor Green Electricity in Germany
#759
Mark AndorManuel Frondel
Stephan Sommer

Imprint
Ruhr Economic Papers
Published by
RWI – Leibniz-Institut für Wirtschaftsforschung Hohenzollernstr. 1-3, 45128 Essen, Germany
Ruhr-Universität Bochum (RUB), Department of Economics Universitätsstr. 150, 44801 Bochum, Germany
Technische Universität Dortmund, Department of Economic and Social Sciences Vogelpothsweg 87, 44227 Dortmund, Germany
Universität Duisburg-Essen, Department of Economics Universitätsstr. 12, 45117 Essen, Germany
Editors
Prof. Dr. Thomas K. Bauer RUB, Department of Economics, Empirical Economics Phone: +49 (0) 234/3 22 83 41, e-mail: [email protected]
Prof. Dr. Wolfgang Leininger Technische Universität Dortmund, Department of Economic and Social Sciences Economics – Microeconomics Phone: +49 (0) 231/7 55-3297, e-mail: [email protected]
Prof. Dr. Volker Clausen University of Duisburg-Essen, Department of Economics International Economics Phone: +49 (0) 201/1 83-3655, e-mail: [email protected]
Prof. Dr. Roland Döhrn, Prof. Dr. Manuel Frondel, Prof. Dr. Jochen Kluve RWI, Phone: +49 (0) 201/81 49-213, e-mail: [email protected]
Editorial Office
Sabine Weiler RWI, Phone: +49 (0) 201/81 49-213, e-mail: [email protected]
Ruhr Economic Papers #759
Responsible Editor: Manuel Frondel
All rights reserved. Essen, Germany, 2018
ISSN 1864-4872 (online) – ISBN 978-3-86788-884-4The working papers published in the series constitute work in progress circulated to stimulate discussion and critical comments. Views expressed represent exclusively the authors’ own opinions and do not necessarily reflect those of the editors.

Ruhr Economic Papers #759
Mark Andor, Manuel Frondel, and Stephan Sommer
Equity and the Willingness to Pay for Green Electricity in Germany

Bibliografische Informationen der Deutschen Nationalbibliothek
The Deutsche Nationalbibliothek lists this publication in the Deutsche National-bibliografie; detailed bibliographic data are available on the Internet at http://dnb.dnb.de
RWI is funded by the Federal Government and the federal state of North Rhine-Westphalia.
http://dx.doi.org/10.4419/86788884ISSN 1864-4872 (online)ISBN 978-3-86788-884-4
Mark Andor, Manuel Frondel, and Stephan Sommer1
Equity and the Willingness to Pay for Green Electricity in Germany AbstractThe production of electricity on the basis of renewable energy technologies is a classic example of an impure public good. It is often discriminatively financed by industrial and household consumers, such as in Germany, where the energy-intensive sector benefits from a far-reaching exemption rule, while all other electricity consumers are forced to bear a higher burden. Based on randomized information treatments in a stated-choice experiment among about 11,000 German households, we explore whether this coercive payment rule affects households’ willingness-to-pay (WTP) for green electricity. Our central result is that reducing inequity by abolishing the exemption for the energy-intensive industry raises households’ WTP substantially.
JEL Classification: D03, D12, H41, Q20, Q50
Keywords: Stated-choice experiment; behavioral economics; fairness
June 2018
1 Mark Andor, RWI; Manuel Frondel, RWI and RUB; Stephan Sommer, RWI. – We are grateful for invaluable comments and suggestions by Andreas Gerster, Lorenz Götte, Colin Vance, as well as for feedback from the audiences at the IAEE (International Association for Energy Economics) conference 2017 at Vienna and the EnInnov2018 symposium at Graz. We gratefully acknowledge financial support by the Collaborative Research Center “Statistical Modeling of Nonlinear Dynamic Processes” (SFB 823) of the German Research Foundation (DFG), within Project A3, “Dynamic Technology Modeling”, and by the Federal Ministry of Education and Research (BMBF) within Kopernikus Project ENavi (grant 03SFK4B0). – All correspondence to: Manuel Frondel, RWI, Hohenzollernstr. 1-3, 45128 Essen. Germany, e-mail: [email protected]

1 Introduction
Ample empirical evidence suggests that equity motives play a key role in many areas,
such as international climate negotiations (Lange and Vogt, 2003; Kesternich et al., 2014;
Vogt, 2016), as well as taxation (Esarey et al., 2012; Hochtl et al., 2012; Kallbekken et al.,
2010). Another important field is the price setting of private goods (Kahneman et al.,
1986), for which there is evidence that people are more likely to be willing to pay for
a good when its price is perceived as fair, which crucially depends on whether other
customers pay the same price or whether there is price discrimination. In response to the
bulk of empirical evidence, economists have developed theoretical models to account for
fairness motives (Bolton and Ockenfels, 2000; Fehr and Schmidt, 1999; Rabin, 1993). Thus
far, though, only few studies have analyzed the effect of fairness on the willingness-to-
pay (WTP) for public goods.
This paper contributes to this line of inquiry by empirically investigating whether
inequity affects households’ WTP for green electricity based on randomized informa-
tion treatments implemented in a stated-choice experiment among about 11,000 German
households. Participants were randomly split into three experimental groups and asked
for their WTP for increasing the share of green electricity in Germany, using the single-
binary-choice format.
One third of the sample households were explicitly informed about the existence of
an exemption rule for the energy-intensive industry in bearing the burden of dissemi-
nating renewable energy technologies and were then asked about their WTP for green
electricity. Another third of the sample households received the same information, but
was requested to state their WTP if the exemption was to be abolished. The remaining
third of households did not receive any further information before they were asked about
their WTP.
Using this study design, we test two hypotheses. First, we hypothesize that abolishing
the exemption rule for the energy-intensive industry increases households’ WTP for green
2

electricity (equity hypothesis). Second, providing information on the industry exemption
should decrease households’ WTP for green electricity (salience hypothesis).
Eliciting the WTP for goods is ideally based on revealed, rather than hypothetical
choices, because the former involve a real economic consequence, such as signing a con-
tract (Carson, 2012; Harrison, 2006). Often, however, revealed preferences are not observ-
able. Instead, stated-preference methods relying on hypothetical responses are frequently
employed to estimate the WTP for public goods. A caveat of hypothetical elicitation for-
mats is that they likely suffer from hypothetical bias, i.e. respondents may exaggerate
their WTP or affirm a WTP question, although this decision does not necessarily reflect
their true preferences (e. g. List and Gallet, 2001, Blumenschein et al., 2008, and the re-
views by Harrison, 2006 and Harrison and Rutstrom, 2008).
Moreover, hypothetical choices might suffer from anchoring effects (Green et al., 1998)
and protest bids (Jorgensen et al., 1999). These findings stimulated research on contingent
valuation methods and various techniques have been proposed to elicit the true WTP,
for instance, ex-ante correctives, such as the cheap-talk protocol (Cummings and Taylor,
1999) and the consequential-script (Bulte et al., 2005), and ex-post calibrations, such as the
certainty approach (Johannesson et al., 1998). More recent theoretical and empirical work
demonstrates the importance of “consequentiality” for incentive compatibility, according
to which the incentive to truthfully reveal preferences is predicated on the respondent
deeming the stated WTP as consequential (Carson and Groves, 2007; Carson et al., 2014;
Vossler et al., 2012; Vossler and Holladay, 2016).
While there exists a bulk of research on the WTP for green electricity (e. g. Andor
et al., 2017c; Ethier et al., 2000; Rose et al., 2002; Whitehead and Cherry, 2007), empirical
evidence on the impact of fairness aspects on the WTP for public goods is scarce. Notably,
we are not aware of any empirical study that analyzes the impact of fairness on the WTP
for green electricity, whereas there are a few empirical articles that evolve around the no-
tion of fairness and responsibility. Bulte et al. (2005), for instance, demonstrate that the
3

WTP for an environmental public good is substantially higher if an environmental prob-
lem is caused by human action, rather than having natural causes. A few other studies an-
alyze the relationship between WTP and distributional preferences. For example, based
on a student population, Ajzen et al. (2000) find that perceived fairness of a requested
contribution to a local public good affects individual WTP. Using alternative polluter-pay
specifications and a random telephone sample of Washington State’s electorate, Johnson
(2006) finds that individual support for a proposed environmental regulation increases if
polluters bear higher shares in total costs. Exploring the relationship between the WTP for
climate change mitigation and distributional preferences, Cai et al. (2010) argue that the
WTP increases when parties that are expected to take a greater responsibility for mitiga-
tion bear larger cost shares in mitigation and when respondents think that climate change
disproportionately affects the world’s poor.
We complement this strand of the literature by employing a single-binary-choice ques-
tion on the WTP for green electricity, a format recommended by both the National Oceanic
and Atmospheric Administration (NOAA) panel on contingent valuation (Arrow et al.,
1993) and the recent literature (e. g. Carson and Groves, 2007). In addition, we correct
for potential hypothetical bias by applying state-of-the-art approaches, such as an ex-
ante consequential script, and account for the political consequentiality of the survey as
perceived by the respondents. Conducting a large-scale experiment among about 11,000
individuals, our analysis strongly contrasts with all those studies that are based on small
samples, student populations, and telephone surveys with low participation rates. A
further strength of our study is that it refers to a real, rather than a hypothetical policy
measure: the promotion of green electricity, for which the exemption rule enjoyed by the
energy-intensive industry implies a higher burden for other electricity consumers. This is
all the more relevant as Germany’s renewable promotion scheme causes substantial costs
of around 25 billion Euros per year, equaling almost 1% of GDP.
Our central result is that abolishing the exemption for the energy-intensive indus-
4

try raises households’ WTP for green electricity. Most striking is the size of the effects:
abolishing the exemption in contributing to this impure public good almost doubles the
acceptance rate for a given burden. Our empirical finding that reducing inequity in the
distribution of the cost burden increases the acceptance of bearing these costs may have
far-reaching implications for policy-making in other fields where exemption rules exist
as well, for instance in carbon tax schemes (Bjørner and Jensen, 2002; Martin et al., 2014;
Rivers and Schaufele, 2015; Yamazaki, 2017).
In the following section, we explain Germany’s promotion system, followed by a con-
cise description of our experimental setting and the database in Sections 3 and 4. Section
5 presents the empirical results. The last section summarizes and concludes.
2 Renewable Promotion in Germany
Producing green electricity on the basis of renewable energy technologies is a classic
example of an impure public good, whose consumption simultaneously generates a pri-
vate and a public utility (see e. g. Kotchen, 2006): While consumers pay a price premium
for being provided with green electricity, thereby enjoying a warm glow, greenhouse gas
emissions that otherwise originate from fossil-based generation will be reduced by in-
creasing green electricity production.
Yet, these advantages come at substantial costs: In many countries, green electricity is
highly subsidized, with electricity consumers bearing the costs (IEA and IRENA, 2018).
Energy-intensive companies, however, are frequently eligible for rebates to not endan-
ger their international competitiveness. This holds for instance in Denmark, France, and
the UK (CEER, 2017), as well as in Germany, where the share of green electricity in total
consumption has been quintupled since 2000, to around one third today (BMWi, 2017).
Energy-intensive facilities are, by law, eligible for rebates if the following pre-conditions
are fulfilled: (1) a facility’s electricity consumption level exceeds 1 million Kilowatthours
5

(kWh), (2) its electricity cost intensity exceeds a sector-specific percentage, ranging be-
tween 14 and 20%, and (3) the facility implemented an energy management system. In
2016, about 2,800 facilities of around 2,100 companies were exempted from paying the full
levy. These comprise about 4% of all companies of the industrial sector and accounted for
about 40% of the industrial electricity consumption in Germany (BDEW, 2016).
Germany promotes electricity generation based on renewable energy technologies via
a feed-in-tariff (FIT) system whereby green electricity has preferential access to the grid
and is remunerated at technology-specific, above-market rates that are commonly guar-
anteed over a 20-year time period. Such FIT systems have been adopted in more than
100 countries throughout the world (REN21, 2017). Germany’s FIT system, introduced
in 2000 on the legal basis of the Renewable Energy Act (EEG), undoubtedly caused the
tremendous increase in the capacity of renewable energy technologies from 12 to 104 Gi-
gawatt between 2000 and 2016 (BMWi, 2017). To reach Germany’s ambitious renewable
goals of a share of 35% of green electricity in consumption in 2020, 50% in 2030, and 80%
in 2050, these capacities must be expanded much further, to a multiple of today’s renew-
able capacities.
The costs for the promotion of green electricity are borne by consumers via a fixed sur-
charge on the net price of electricity, the so-called EEG levy. Since its introduction in 2000,
the EEG levy rose from zero to 6.79 cents per kWh in 2018 (Figure 1), today accounting for
about a quarter of the end-use electricity price (BDEW, 2018). In 2017, annual promotion
costs amounted to about 25 billion Euros, equaling almost 1% of Germany’s GDP.
3 Experimental Design
We conducted a stated-choice experiment in which we inquired about participants’
hypothetical willingness to pay for further increases in the costs of the promotion of re-
newable technologies. In detail, participants were asked whether they are willing to ad-
6

02
46
8Le
vy i
n C
t/ kW
h
2000 2005 2010 2015 2020
Figure 1: Levy for the Promotion of Renewable Energies in Germany. Source: BDEW (2018).
ditionally pay x ct/kWh for increasing the share of green electricity to 35% by 2020 (see
Appendix A.1 for the exact questions). The amount x ∈ {1, 2, 4} was randomly assigned
and framed as a rise in the EEG levy. Given that this levy has increased by more than
4 ct/kWh since 2009 (see Figure 1) and a multiple of today’s renewable capacity has to
be deployed in oder to reach Germany’s renewable goals, the amounts of 1 to 4 ct/kWh
reflect a plausible range of future cost increases.
Participants were randomly split into three experimental groups: First, one third of
the participants, belonging to what is called here the Retain Group, were informed about
the exemption of the energy-intensive industry and were subsequently asked whether
they would accept a further rise of x ct/kWh in the EEG levy. Second, subjects who were
randomly assigned to the group termed Abolish Group received the same information as
those of the Retain Group, but were asked about their willingness to accept a given rise
in the EEG levy if the exemption for energy-intensive companies was to be abolished. Fi-
nally, subjects of the so-called Uninformed Group did not receive any further information
before they were asked about whether they would accept a given levy increase.
Based on this study design, we test two hypotheses. First, we hypothesize that abol-
ishing the exemption for energy-intensive firms increases households’ WTP for green
7

electricity (equity hypothesis). Second, providing information on the industry exemption
decreases households’ WTP for green electricity (salience hypothesis). In principle, the eq-
uity hypothesis can be tested by comparing the share of households of the Abolish Group
that are willing to accept the randomly given increase in the EEG levy with the respective
share of the Retain Group. Likewise, the salience hypothesis can be tested by contrasting
the respective shares of the Retain and Uninformed Group.
While hypothetical choices are frequently employed to analyze the WTP for renewable
energy technologies (e. g. Andor et al., 2017b), a potential shortcoming of this approach
is that its stylized decision environment may induce participants to misreport their WTP,
commonly referred to as hypothetical bias (e. g. Harrison, 2006 and List and Gallet, 2001).
To mitigate this bias, we opted for using a single-binary-choice format, as it is argued to
be incentive-compatible for public goods with coercive payments (Carson and Groves,
2007).1 Furthermore, to increase the respondent’s perception that their choice has real
consequences, we a priori provided a consequential script, which emphasizes that the
survey results will be made available to policy-makers and will be used for future deci-
sions on the level of the EEG levy. Not least, we employ the so-called consequentiality
approach, assuming that respondents reveal their true preferences only if they perceive
their answers as consequential in terms of policy-making (Carson and Groves, 2007; Her-
riges et al., 2010; Vossler and Watson, 2013).
1To explain why single-binary-choice formats are incentive-compatible, we briefly recap the argumenta-tion of Carson and Groves (2007). Gibbard (1973) and Satterthwaite (1975) showed that no response formatthat allows for more than two alternatives can be incentive compatible unless substantive additional re-strictions are placed on peoples’ preferences. While the Gibbard-Satterthwaite theorem does not mean thatall binary discrete choice formats are incentive-compatible, it implies that all other formats are usually notincentive-compatible. For a standard public good, two assumptions have to hold so that single-binary-choice formats are incentive-compatible. First, the agency can actually compel payment for the good if itprovides it. Second, the format considers only one public good. For an impure public good, such as greenelectricity, a third assumption must hold, i. e. only potential users are interviewed. All three assumptionsare fulfilled for our empirical example.
8

4 Data
To elicit people’s WTP for green electricity, we commissioned the survey institute forsa
to carry out data collection. forsa maintains a household panel that is representative of the
German-speaking population and employs a state-of-the-art tool that allows panelists to
fill out the questionnaire using either a television or the internet – for more information,
see http://www.forsa.com. Respondents – here the household heads – retrieve and re-
turn questionnaires from home and can interrupt and continue the survey at any time.
Household heads are defined as those individuals who are responsible for the financial
decisions at the household level. While some socio-economic characteristics of our sam-
ple closely match the characteristics of the population of German household heads (see
Table A1 in the Appendix), sample household heads tend to be younger and better edu-
cated, suggesting that the empirical results are not representative for Germany. Notably,
about one third of the respondents holds a college degree, which is higher than the na-
tional average of 21.1%. Furthermore, with 38.2%, the share of women in our sample is
rather low, above all due to our decision to request household heads to participate in the
survey.
The survey took place between December 23, 2015, and February 19, 2016, a period
during which 11,375 individuals were recruited to fill out the questionnaire. 814 respon-
dents abandoned the survey prior to the experiment, which corresponds to a dropout
rate of 7.2%. This rate is in line with other studies that are based on this household panel,
see e. g. Andor et al. (2017a). The descriptive statistics reported in Table 1 indicate that
randomization was successful and that selection bias is not an issue: with a few excep-
tions, socio-economic characteristics are very similar across experimental groups, as is
reflected by t-test statistics for the mean differences in the covariates that are statistically
not significantly different from zero.
One exception is the indicator for pro-environmental attitudes, proxied here by the
statement to be in favor of voting for Germany’s Green Party, for which the share of 11.3%
9

Table 1: Descriptive Statistics
Variable Explanation Retain Abolish Uninformed WholeGroup Group Group Sample
Age Age of respondent 55.08 54.80 54.87 54.92(-0.934) (-0.689)
Female Dummy: 1 if respondent is female 0.382 0.373 0.382 0.379(-0.790) (0.024)
East Germany Dummy: 1 if household resides in East Germany 0.194 0.189 0.185 0.190(-0.548) (-0.975)
College degree Dummy: 1 if respondent has a college degree 0.338 0.320 0.332 0.330(-1.522) (-0.476)
Children Dummy: 1 if respondent has children 0.608 0.617 0.612 0.612(0.786) (0.338)
Homeowner Dummy: 1 if household owns property 0.607 0.618 0.598 0.608(0.984) (-0.846)
Income Monthly household net income in e 2,881 2,921 2,901 2,901(1.172) (0.604)
Green party Dummy: 1 if respondent is inclined to green party 0.095 0.096 0.113 0.101(0.091) (2.327)**
Green electricity Dummy: 1 if household is supplied by green power 0.294 0.282 0.273 0.283(-1.100) (-2.011)**
RES plant Dummy: 1 if household owns RES plant 0.122 0.129 0.122 0.124(0.935) (0.090)
Environmental group Dummy: 1 if respondent is a member of an 0.153 0.136 0.137 0.142environmentally active group (-1.990) (-1.891)
Exemption Dummy: 1 if respondent agrees with the justification 0.191 0.170 0.150 0.170for the exemption for the energy-intensive industry (-2.104)** (-4.352)**
Consequential Dummy: 1 if respondent believes that the survey 0.761 0.768 0.768 0.766has political consequences (0.643) (0.624)
Early quit Dummy: 1 if respondent quit the survey 0.076 0.072 0.066 0.072before the experiment (-0.686) (-1.774)
Number of observations: 3,739 3,774 3,862 11,375
Note: t-test statistics for mean differences between the control group and the treatment groups are in parentheses. * and ** denote
statistical significance at the 5% and the 1% level, respectively.
is somewhat higher in the Uniformed Group than in the other experimental groups. Over-
all, the share of respondents who tend to vote for the Green Party amounts to about 10%,
which is in line with the results of the most recent federal election of 2017. It also bears
highlighting that about three quarters of the respondents perceive the survey as conse-
quential, that is, they believe that the survey results may have political consequences.
This large share hardly varies across experimental groups. For comparison purposes, Ta-
ble A2 presented in Appendix A.3, displays the summary statistics for those respondents
who believe in political consequences of the survey.
10

5 Empirical Results
The focus of our empirical analysis is a binary indicator that equals unity if a respon-
dent is willing to accept a hypothetical increase of either 1, 2, or 4 ct/kWh in the levy
raised for the promotion of green electricity and zero otherwise. The descriptive results,
presented in Table 2, reveal that the acceptance rates decrease substantially with the size
of the levy increase, indicating internal validity of the responses. For example, across
experimental groups, the share of respondents who accept an extra 4 ct/kWh is between
about 13 and 18 percentage points lower than for an increase of 1 ct/kWh.
Table 2: Share of Respondents Who Accept an Increase of 1, 2, or 4 Cents/kWh in the EEG Levyto Reach Germany’s Goal of a Share of Green Electricity of 35% in 2020
Retain Group Abolish Group Uninformed Group
Levy Increase # Obs. Share # Obs. Share # Obs. Share
1 Cent/kWh 1,098 38.16% 1,121 73.60% 1,131 58.62%– – – (16.82**) – (9.66**)
2 Cents/kWh 1,104 29.17% 1,048 67.56% 1,090 49.36%– – – (17.82**) – (9.69**)
4 Cents/kWh 1,061 22.53% 1,069 60.90% 1,186 40.81%– – – (17.95**) – (9.26**)
Note: z-test statistics for the equality in proportions with respect to the control group are in parentheses. ** denotes statistical signifi-
cance at the 1% level.
As hypothesized, the acceptance rates differ substantially across experimental groups.
For instance, the share of respondents in the Abolish Group who accept a randomly given
increase in the EEG levy is about 35-40 percentage points higher than in the Retain Group,
indicating that abolishing the exemption for energy-intensive firms raises the WTP for
green electricity dramatically relative to the situation in which the exemption is retained.
This outcome supports the equity hypothesis, according to which fairness considerations
play an important role with respect to the WTP for green electricity. The randomized ex-
perimental design allows us to test this hypothesis on the basis of proportion tests (see
Appendix A.2). Actually, the z-test statistics presented in Table 2 indicate that the dif-
ferences in the average acceptance rates between the Abolish and the Retain Group are
11

statistically significant throughout.
Furthermore, as the salience hypothesis suggests, when respondents are explicitly in-
formed about the existence of the industry exemption, as is done for those of the Retain
Group, the acceptance rates are some 20 percentage points lower compared to that of the
Uninformed Group. Most striking is the size of the effects: abolishing the exemption in
contributing to this impure public good more than doubles the acceptance rates for given
increases of 2 and 4 ct/kWh, a larger effect than when quartering this burden.
To check the robustness of our results, we follow Carson and Groves (2007), Carson
et al. (2014), Vossler et al. (2012), and Vossler and Holladay (2016), who recently high-
lighted the importance of “consequentiality” to ensure the incentive compatibility of hy-
pothetical responses. To this end, we asked the survey participants whether they believe
that the results obtained from the survey may have political consequences. Exploiting this
binary information and only taking account of the answers of respondents who perceive
the survey as consequential, we find similar results, reported in Table A3 in Appendix
A.3, as for the entire sample (Table 2). Most notably, the propensity of accepting higher
EEG levies is higher among respondents who perceive the survey as consequential than
for the entire sample. Yet, the differences in mean acceptance rates across experimental
groups are similar in magnitude.
In addition to the robustness check based on consequentiality, we now estimate three
linear probability models to confirm the results reported in Table 2. In Specification
(1), presented in Appendix A.2, only the indicators for the Abolish and the Uninformed
Group and the dummy variables for the levy increases of 2 and 4 ct/kWh, as well as the
corresponding interaction terms, are included as regressors. In Specification (2), socio-
economic characteristics are added as controls. In a third model specification, Specifica-
tion (2) is completed by adding the full set of interaction terms where the experimental
group indicators are interacted with all socio-economic characteristics.
Focusing first on the coefficient estimates resulting from Specification (1) (left-hand
12

panel of Table 3), we again find strong treatment effects that exactly mimic the differences
in mean acceptances across experimental groups (Table 2). For instance, with 0.354, the
estimate of the coefficient on the Abolish Group indicator yields a treatment effect of
abolishing the industry exemption relative to the Retain Group that is identical to the
difference of 35.4 percentage points between the average acceptance rates of both groups
for an EEG levy increase of 1 ct/kWh.
Table 3: Linear Probability Model Regression Results for the Share of Respondents Who Acceptan Increase of 1, 2, or 4 Cents/kWh in the EEG Levy to Reach Germany’s Goal of a Share of GreenElectricity of 35% in 2020
Socio-economic CharacteristicsExcluded Included
Coeff. Std. Err. Coeff. Std. Err.
Abolish 0.354** (0.020) 0.364** (0.021)Uninformed 0.205** (0.021) 0.208** (0.022)2 Cents -0.090** (0.020) -0.085** (0.022)4 Cents -0.156** (0.019) -0.158** (0.021)Abolish × 2 Cents 0.030 (0.028) 0.024 (0.030)Abolish × 4 Cents 0.029 (0.028) 0.020 (0.030)Uninformed × 2 Cents -0.003 (0.029) -0.012 (0.031)Uninformed × 4 Cents -0.022 (0.028) -0.025 (0.030)Female – – 0.075** (0.011)East Germany – – -0.060** (0.013)College degree – – 0.037** (0.011)Children – – -0.020 (0.012)Green party – – 0.149** (0.016)Homeowner – – -0.040** (0.012)Green electricity – – 0.077** (0.011)Renewable system – – 0.043** (0.016)Environmental group – – 0.058** (0.014)Age – – 0.002** (0.000)ln(Income) – – 0.052** (0.011)Constant 0.382** (0.015) -0.191* (0.089)
No. of observations 9,908 8,372
Note: Robust standard errors are reported in parentheses. **,* denote statistical significance at the 1 % and 5 %level, respectively.
Estimating Specification (2), where socio-economic characteristics are included as re-
gressors, hardly varies the magnitude of the treatment effects (right-hand panel of Table
3). This outcome is to be expected if randomization into the experimental groups is suc-
13

cessful. The coefficient estimates for the socio-economic characteristics are all unsurpris-
ing and indicate that women, college graduates, and participants with green attitudes are
more likely to accept an increase in the EEG levy than the reference person, who inter alia
is male and in the Retain Group. Moreover, the propensity to be willing to pay more for
green electricity increases with age and income, while it is lower for households residing
in East Germany and for homeowners. It also bears noting that these results turn out to be
robust when we focus only on those respondents who believe that the survey results may
have political consequences. The estimates reported in Table A4 in Appendix A.3 recon-
firm the very large treatment effects, particularly with respect to the difference between
the Abolish and the Retain Group, which amounts to some 37 percentage points.
Investigating the heterogeneity of the treatment effects with respect to socio-economic
characteristics in our third model specification, in which the experimental group dum-
mies are interacted with all socio-economic characteristics, we find that both female re-
spondents and respondents who are inclined to vote the green party have particularly
strong preferences for fairness. In fact, Figure 2 illustrates that the difference between
the acceptance rates in the Abolish and the Retain Group is particularly pronounced for
voters of the green party.
Finally, while we tacitly assume in our analysis that respondents perceive the exemp-
tion rule for the energy-intensive industry as unfair, we admit that we have no empirical
information on this issue. Yet, as an indication for the perceived unfairness of the industry
exemption, we exploit information that we obtained in the aftermath of the experiment by
asking participants whether they agree or disagree with the justification of the industry
exemption. On average, only 17% of the respondents think that the industry exemption
is justified (Table 1), which points to the notion that the exemption is widely perceived
as unfair. It bears noting, however, that the randomized assignment to an experimental
group across which the provision of information on the exemption is varied, has a bear-
ing on the responses: Figure 3 illustrates that the percentage of respondents agreeing with
14

0.1
.2.3
.4.5
.6.7
.8.9
1A
ccep
tanc
e R
ate
of a
Hig
her L
evy
Retain Uninformed Abolish
Male Female
(a) Variation in Treatment Effects across Gender
0.1
.2.3
.4.5
.6.7
.8.9
1A
ccep
tanc
e R
ate
of a
Hig
her L
evy
Retain Uninformed Abolish
No green party Green party
(b) Treatment Effects across Green Attitudes
Note: Robust standard errors on the means are used for the error bars (n=8,372).
Figure 2: Heterogeneous Treatment Effects
the justification of the exemption rule is higher among those individuals who received in-
formation on the exemption in the experiment than for those who did not obtain this
information. These differences across experimental groups are statistically significantly
different from zero, as can be seen from the test statistics reported in Table 1. From Figure
3, we also learn that with about 15% the share of respondents who think that the industry
exemption is justified is lower for the Uninformed Group than for the other groups.
6 Summary and Conclusion
The perceived fairness of a price is widely recognized to be a critical determinant for
people’s WTP for a good (Ajzen et al., 2000; Kahneman et al., 1986). In this paper, we
have explored how equity motives, particularly the inequality in the coercive payments
for green electricity, affect the willingness-to-pay (WTP) for this impure public good.
Based on randomized information treatments implemented in a stated-choice experiment
among nearly 11,000 German households, we find that, on the one hand, abolishing the
exemption for the energy-intensive industry substantially raises households’ WTP for
green electricity. On the other hand, when households learn about the prevalence of un-
15

0.14
0.16
0.18
0.20
Agr
eein
g w
ith th
e Ju
stifi
catio
n of
the
Exe
mpt
ion
Rul
e (%
)
Retain Abolish Uninformed
Note: Robust standard errors on the means are used for the error bars (n=9,552).
Figure 3: Treatment Effect on the Agreement of the Exemption Rule
even contributions, our results indicate that this knowledge considerably decreases their
WTP.
A caveat of our stated-preference approach is the potential emergence of hypothetical
bias. To mitigate this bias, we have employed a consequential script as ex-ante corrective
and the consequentiality approach, assuming that respondents reveal their true prefer-
ences if they perceive their answers as consequential in terms of policy-making (Carson
and Groves, 2007; Herriges et al., 2010; Vossler and Watson, 2013). On the basis of the lat-
ter approach, we conclude that our key results of large treatment effects is robust. While
we are optimistic to have reduced hypothetical bias by pursuing these approaches, we ar-
gue that even if there was any hypothetical bias, it seems unlikely that hypothetical bias
renders our conclusions invalid given the large treatment effects.
The empirical outcome that the distribution of the cost burden highly matters for the
acceptance of bearing these costs may be a general principle that may have strong im-
plications for policy-making in other fields, such as carbon taxation. For instance, Rivers
and Schaufele (2015) suggest that the introduction of a carbon tax in British Columbia
was only publicly accepted because the government reduced the tax rate for low-income
16

households and companies. Apparently, as the acceptance of policies crucially hinges
on the distribution of the associated costs, conceiving appropriate payment rules is key
for the public acceptance of any policy instrument, not least greenhouse gas abatement
measures.
17
A Appendix
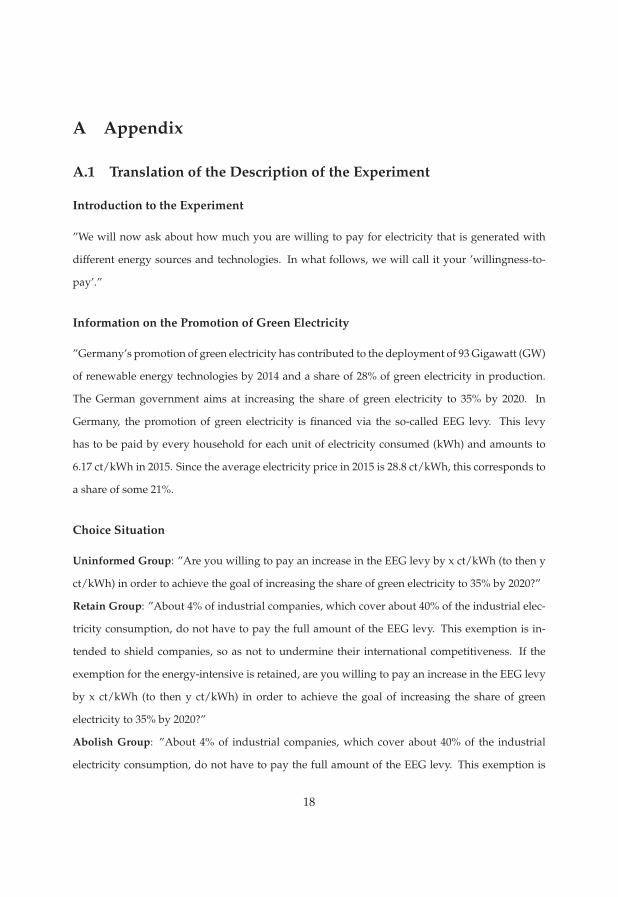
A.1 Translation of the Description of the Experiment
Introduction to the Experiment
”We will now ask about how much you are willing to pay for electricity that is generated with
different energy sources and technologies. In what follows, we will call it your ’willingness-to-
pay’.”
Information on the Promotion of Green Electricity
”Germany’s promotion of green electricity has contributed to the deployment of 93 Gigawatt (GW)
of renewable energy technologies by 2014 and a share of 28% of green electricity in production.
The German government aims at increasing the share of green electricity to 35% by 2020. In
Germany, the promotion of green electricity is financed via the so-called EEG levy. This levy
has to be paid by every household for each unit of electricity consumed (kWh) and amounts to
6.17 ct/kWh in 2015. Since the average electricity price in 2015 is 28.8 ct/kWh, this corresponds to
a share of some 21%.
Choice Situation
Uninformed Group: ”Are you willing to pay an increase in the EEG levy by x ct/kWh (to then y
ct/kWh) in order to achieve the goal of increasing the share of green electricity to 35% by 2020?”
Retain Group: ”About 4% of industrial companies, which cover about 40% of the industrial elec-
tricity consumption, do not have to pay the full amount of the EEG levy. This exemption is in-
tended to shield companies, so as not to undermine their international competitiveness. If the
exemption for the energy-intensive is retained, are you willing to pay an increase in the EEG levy
by x ct/kWh (to then y ct/kWh) in order to achieve the goal of increasing the share of green
electricity to 35% by 2020?”
Abolish Group: ”About 4% of industrial companies, which cover about 40% of the industrial
electricity consumption, do not have to pay the full amount of the EEG levy. This exemption is
18

intended to shield companies, so as not to undermine their international competitiveness. If the
exemption was to be abolished, are you willing to pay an increase in the EEG levy by x ct/kWh
(to then y ct/kWh) in order to achieve the goal of increasing the share of green electricity to 35%
by 2020?”
Consequentiality
“How likely do you believe that results of surveys, such as the present one, influence policy de-
cisions on the amount of the surcharge for the promotion of renewable energy technologies (EEG
Levy)?” The answers to this question are measured on a 5-point Likert scale, where 1 stands for
“Very unlikely” and 5 indicates “Very likely”.
Opinion about the Exemption
“Currently energy-intensive companies do not have to pay the full amount of the EEG levy. What
is your opinion about this rule?” The possible answers to this question are “I think they are
appropriate” and “I think they are inappropriate”.
19
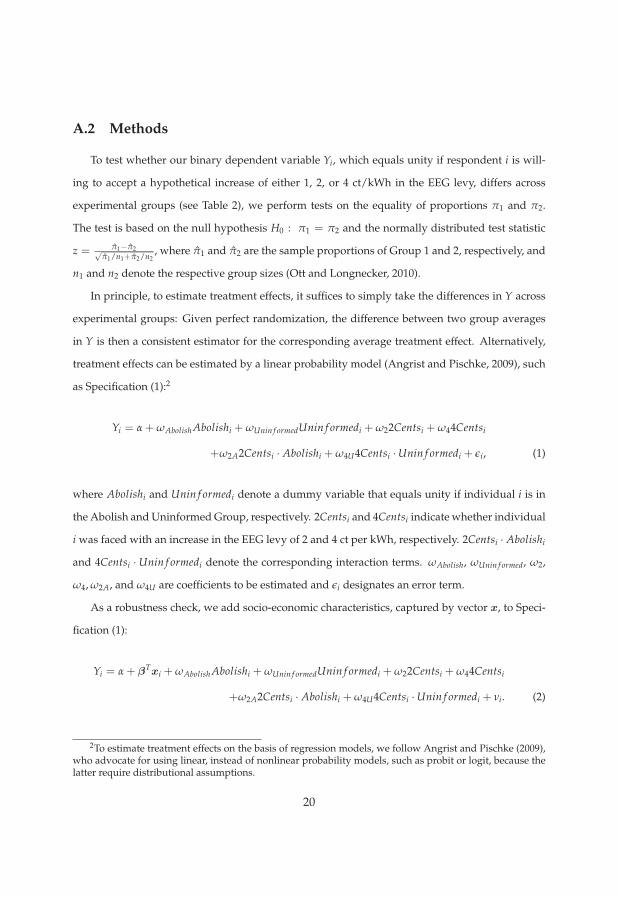
A.2 Methods
To test whether our binary dependent variable Yi, which equals unity if respondent i is will-
ing to accept a hypothetical increase of either 1, 2, or 4 ct/kWh in the EEG levy, differs across
experimental groups (see Table 2), we perform tests on the equality of proportions π1 and π2.
The test is based on the null hypothesis H0 : π1 = π2 and the normally distributed test statistic
z = π1−π2√π1/n1+π2/n2
, where π1 and π2 are the sample proportions of Group 1 and 2, respectively, and
n1 and n2 denote the respective group sizes (Ott and Longnecker, 2010).
In principle, to estimate treatment effects, it suffices to simply take the differences in Y across
experimental groups: Given perfect randomization, the difference between two group averages
in Y is then a consistent estimator for the corresponding average treatment effect. Alternatively,
treatment effects can be estimated by a linear probability model (Angrist and Pischke, 2009), such
as Specification (1):2
Yi = α + ωAbolish Abolishi + ωUnin f ormedUnin f ormedi + ω22Centsi + ω44Centsi
+ω2A2Centsi · Abolishi + ω4U4Centsi · Unin f ormedi + εi, (1)
where Abolishi and Unin f ormedi denote a dummy variable that equals unity if individual i is in
the Abolish and Uninformed Group, respectively. 2Centsi and 4Centsi indicate whether individual
i was faced with an increase in the EEG levy of 2 and 4 ct per kWh, respectively. 2Centsi · Abolishi
and 4Centsi · Unin f ormedi denote the corresponding interaction terms. ωAbolish, ωUnin f ormed, ω2,
ω4, ω2A, and ω4U are coefficients to be estimated and εi designates an error term.
As a robustness check, we add socio-economic characteristics, captured by vector x, to Speci-
fication (1):
Yi = α + βTxi + ωAbolish Abolishi + ωUnin f ormedUnin f ormedi + ω22Centsi + ω44Centsi
+ω2A2Centsi · Abolishi + ω4U4Centsi · Unin f ormedi + νi. (2)
2To estimate treatment effects on the basis of regression models, we follow Angrist and Pischke (2009),who advocate for using linear, instead of nonlinear probability models, such as probit or logit, because thelatter require distributional assumptions.
20

Finally, to investigate heterogeneity across experimental groups with respect to socio-economic
characteristics, we add interaction terms of the treatment groups with these characteristics to Spec-
ification (2) and estimate this third specification.
A.3 Tables
Table A1: Comparison of the Sample Household Heads with the Population of German House-hold Heads
Variable Sample Germany (2016)
1 Person household 0.245 0.4112 Person household 0.483 0.3403 Person household 0.139 0.123Household with 4 or more members 0.133 0.127East Germany 0.190 0.208Household income > e4,700 0.119 0.128Age between 18 and 34 0.091 0.200Age between 35 and 64 0.640 0.524Age 65 and above 0.269 0.276Female 0.379 0.352College degree 0.330 0.211
Data for the population of German household heads is drawn from Destatis (2017). This data source asks the main earner to complete
the questionnaire, whereas we ask the household member who usually makes financial decisions at the household level. Furthermore,
the variable high income is top-coded at 4,500 EUR, while in our sample the upper threshold is at 4,700 EUR.
21

Table A2: Descriptive Statistics for Respondents who Believe that the Survey has Political Conse-quences
Variable Explanation Retain Abolish Uninformed WholeGroup Group Group Sample
Age Age of respondent 55.13 55.04 55.12 55.09(-0.236) (-0.017)
Female Dummy: 1 if respondent is female 0.364 0.368 0.384 0.372(0.285) (1.480)
East Germany Dummy: 1 if household resides in East Germany 0.176 0.186 0.176 0.179(0.979) (0.054)
College degree Dummy: 1 if respondent has a college degree 0.354 0.340 0.353 0.349(-1.046) (-0.098)
Children Dummy: 1 if respondent has children 0.655 0.665 0.656 0.659(0.756) (0.089)
Homeowner Dummy: 1 if household owns property 0.617 0.624 0.606 0.616(0.517) (-0.814)
Income Monthly household net income in e 2,942 2,979 2,965 2,962(0.902) (0.565)
Green party Dummy: 1 if respondent is inclined to green party 0.106 0.109 0.127 0.114(0.331) (2.275)**
Green electricity Dummy: 1 if household is supplied by green power 0.317 0.293 0.282 0.297(-1.881) (-2.735)**
RES plant Dummy: 1 if household owns RES plant 0.131 0.137 0.126 0.131(0.647) (-0.522)
Environmental group Dummy: 1 if respondent is member of an 0.166 0.143 0.145 0.151environmentally active group (-2.259)** (-2.078)**
Exemption Dummy: 1 if respondent agrees with the justification 0.211 0.179 0.160 0.183of the exemption for the energy-intensive industry (-2.780)** (-4.536)**
Number of observations: 2,546 2,612 2,691 7,849
Note: t-test statistics for mean differences between the control group and the treatment groups are in parentheses. * and ** denote
statistical significance at the 5% and the 1% level, respectively.
Table A3: Share of Respondents Who Accept an Increase of 1, 2, or 4 Cents/kWh in the EEG Levyto Reach Germany’s Goal of a Share of Green Electricity of 35% in 2020
Retain Group Abolish Group Uninformed Group
Levy Increase # Obs. Share # Obs. Share # Obs. Share
1 Cent/kWh 814 44.96% 866 78.06% 834 67.03%– – – (13.97**) – (9.02**)
2 Cents/kWh 810 34.44% 784 71.17% 803 56.79%– – – (14.68**) – (9.01**)
4 Cents/kWh 793 27.11% 805 65.59% 918 47.39%– – – (15.41**) – (8.62**)
Note: z-test statistics for the equality in proportions with respect to the control group are in parentheses. ** denotes statistical signifi-
cance at the 1% level.
22

Table A4: Linear Probability Model Regression Results for those Respondents who Believe inPolitical Consequences
Socio-Economic CharacteristicsExcluded Included
Coeff. Std. Err. Coeff. Std. Err.
Abolish 0.331** (0.022) 0.346** (0.024)Uninformed 0.221** (0.024) 0.230** (0.026)2 Cents -0.105** (0.024) -0.095** (0.026)4 Cents -0.179** (0.024) -0.181** (0.025)Abolish × 2 Cents 0.036 (0.032) 0.019 (0.035)Abolish × 4 Cents 0.054 (0.032) 0.044 (0.034)Uninformed × 2 Cents 0.003 (0.034) -0.011 (0.037)Uninformed × 4 Cents -0.018 (0.033) -0.026 (0.035)Female – – 0.070** (0.012)East Germany – – -0.053** (0.016)College degree – – 0.033** (0.013)Children – – -0.014 (0.014)Green party – – 0.128** (0.017)Homeowner – – -0.043** (0.014)Green electricity – – 0.057** (0.013)Renewable system – – 0.037* (0.017)Environmental group – – 0.063** (0.016)Age – – 0.002** (0.000)ln(Income) – – 0.049** (0.013)Constant 0.450** (0.017) -0.098 (0.103)
No. of observations 7,427 6,314
Note: Robust standard errors are reported in parentheses. **,* denote statistical significance at the 1 % and 5 %level, respectively.
23

References
Ajzen, I., Rosenthal, L. H., and Brown, T. C. (2000). Effects of Perceived Fairness on Willingness
To Pay. Journal of Applied Social Psychology, 30(12):2439–2450.
Andor, M., Gerster, A., and Sommer, S. (2017a). Consumer Inattention, Heuristic Thinking and
the Role of Energy Labels. Ruhr Economic Papers # 671.
Andor, M. A., Frondel, M., and Vance, C. (2017b). Germany’s Energiewende: A Tale of Increasing
Costs and Decreasing Willingness-To-Pay. Energy Jornal, 38(SI 1):211–228.
Andor, M. A., Frondel, M., and Vance, C. (2017c). Mitigating Hypothetical Bias: Evidence on the
Effects of Correctives from a Large Field Study. Environmental and Resource Economics, 68(3):777–
796.
Angrist, J. D. and Pischke, J.-S. (2009). Mostly Harmless Econometrics: An Empiricist’s Companion.
Princeton and Oxford: Princeton University Press.
Arrow, K., Solow, R., Portney, P. R., Leamer, E. E., Radner, R., Schuman, H., et al. (1993). Report of
the NOAA panel on Contingent Valuation. Federal Register, 58(10):4601–4614.
BDEW (2016). Erneuerbare Energien und das EEG: Zahlen, Fakten, Grafiken (2016). Bundesver-
band der Energie- und Wasserwirtschaft, Berlin.
BDEW (2018). BDEW-Strompreisanalyse Januar 2018. Bundesverband der Energie- und Wasser-
wirtschaft, Berlin.
Bjørner, T. B. and Jensen, H. H. (2002). Energy Taxes, Voluntary Agreements and Investment
Subsidies–A Micro-Panel Analysis of the Effect on Danish Industrial Companies’ Energy De-
mand. Resource and Energy Economics, 24(3):229–249.
Blumenschein, K., Blomquist, G. C., Johannesson, M., Horn, N., and Freeman, P. (2008). Elic-
iting Willingness To Pay Without Bias: Evidence from a Field Experiment. Economic Journal,
118(525):114–137.
24

BMWi (2017). Erneuerbare Energien in Zahlen. Bundesministerium fur Wirtschaft und Energie,
Berlin.
Bolton, G. E. and Ockenfels, A. (2000). ERC: A Theory of Equity, Reciprocity, and Competition.
American Economic Review, pages 166–193.
Bulte, E., Gerking, S., List, J. A., and De Zeeuw, A. (2005). The Effect of Varying the Causes
of Environmental Problems on Stated WTP Values: Evidence from a Field Study. Journal of
Environmental Economics and Management, 49(2):330–342.
Cai, B., Cameron, T. A., and Gerdes, G. R. (2010). Distributional Preferences and the Incidence of
Costs and Benefits in Climate Change Policy. Environmental and Resource Economics, 46(4):429–
458.
Carson, R. T. (2012). Contingent Valuation: A Practical Alternative when Prices Aren’t Available.
Journal of Economic Perspectives, 26(4):27–42.
Carson, R. T. and Groves, T. (2007). Incentive and Informational Properties of Preference Ques-
tions. Environmental and Resource Economics, 37(1):181–210.
Carson, R. T., Groves, T., and List, J. A. (2014). Consequentiality: A Theoretical and Experimental
Exploration of a Single Binary Choice. Journal of the Association of Environmental and Resource
Economists, 1(1/2):171–207.
CEER (2017). Status Review of Renewable Support Schemes in Europe. Council of European
Regulators, Brussels.
Cummings, R. G. and Taylor, L. O. (1999). Unbiased Value Estimates for Environmental Goods: A
Cheap Talk Design for the Contingent Valuation Method. American Economic Review, 89(3):649–
665.
Destatis (2017). Bevolkerung und Erwerbstatigkeit. Report ID: 2010300167004. Statistisches Bun-
desamt, Wiesbaden.
25

Esarey, J., Salmon, T. C., and Barrilleaux, C. (2012). What Motivates Political Preferences? Self-
Interest, Ideology, and Fairness in a Laboratory Democracy. Economic Inquiry, 50(3):604–624.
Ethier, R. G., Poe, G. L., Schulze, W. D., and Clark, J. (2000). A Comparison of Hypothetical
Phone and Mail Contingent Valuation Responses for Green-Pricing Electricity Programs. Land
Economics, 76(1):54–67.
Fehr, E. and Schmidt, K. M. (1999). A Theory of Fairness, Competition, and Cooperation. Quarterly
Journal of Economics, 114(3):817–868.
Gibbard, A. (1973). Manipulation of Voting Schemes: A General Result. Econometrica: Journal of
the Econometric Society, pages 587–601.
Green, D., Jacowitz, K. E., Kahneman, D., and McFadden, D. (1998). Referendum Contingent
Valuation, Anchoring, and Willingness to Pay for Public Goods. Resource and Energy Economics,
20(2):85–116.
Harrison, G. W. (2006). Experimental Evidence on Alternative Environmental Valuation Methods.
Environmental and Resource Economics, 34(1):125–162.
Harrison, G. W. and Rutstrom, E. E. (2008). Experimental Evidence on the Existence of Hypothet-
ical Bias in Value Elicitation Methods. Handbook of Experimental Economics Results, 1:752–767.
Herriges, J., Kling, C., Liu, C.-C., and Tobias, J. (2010). What are the Consequences of Consequen-
tiality? Journal of Environmental Economics and Management, 59(1):67–81.
Hochtl, W., Sausgruber, R., and Tyran, J.-R. (2012). Inequality Aversion and Voting on Redistribu-
tion. European Economic Review, 56(7):1406–1421.
IEA and IRENA (2018). IEA / IRENA Joint Policies and Measures Database. International Energy
Agency and International Renewable Energy Agency, Paris and Masdar City.
Johannesson, M., Liljas, B., and Johansson, P.-O. (1998). An Experimental Comparison of Dichoto-
mous Choice Contingent Valuation Questions and Real Purchase Decisions. Applied Economics,
30(5):643–647.
26

Johnson, L. T. (2006). Distributional Preferences in Contingent Valuation Surveys. Ecological Eco-
nomics, 56(4):475–487.
Jorgensen, B. S., Syme, G. J., Bishop, B. J., and Nancarrow, B. E. (1999). Protest Responses in
Contingent Valuation. Environmental and resource economics, 14(1):131–150.
Kahneman, D., Knetsch, J. L., and Thaler, R. H. (1986). Fairness and the Assumptions of Eco-
nomics. Journal of Business, 59(2):285–300.
Kallbekken, S., Kroll, S., Cherry, T. L., et al. (2010). Pigouvian Tax Aversion and Inequity Aversion
in the Lab. Economics Bulletin, 30(3):1914–1921.
Kesternich, M., Lange, A., and Sturm, B. (2014). The Impact of Burden Sharing Rules on the
Voluntary Provision of Public Goods. Journal of Economic Behavior & Organization, 105:107–123.
Kotchen, M. J. (2006). Green Markets and Private Provision of Public Goods. Journal of Political
Economy, 114(4):816–834.
Lange, A. and Vogt, C. (2003). Cooperation in International Environmental Negotiations due to a
Preference for Equity. Journal of Public Economics, 87(9):2049–2067.
List, J. A. and Gallet, C. A. (2001). What Experimental Protocol Influence Disparities Between
Actual and Hypothetical Stated Values? Environmental and Resource Economics, 20(3):241–254.
Martin, R., De Preux, L. B., and Wagner, U. J. (2014). The Impact of a Carbon Tax on Manufacturing:
Evidence from Microdata. Journal of Public Economics, 117:1–14.
Ott, R. L. and Longnecker, M. T. (2010). An Introduction to Statistical Methods and Data Analysis.
Belmont, CA, USA: Brooks/Cole, Cengage Learning.
Rabin, M. (1993). Incorporating Fairness into Game Theory and Economics. American Economic
Review, 83(5):1281–1302.
REN21 (2017). Renewables 2017. Global Status Report. Renewable Energy Policy Network for the
21st Century, Paris.
27

Rivers, N. and Schaufele, B. (2015). Salience of Carbon Taxes in the Gasoline Market. Journal of
Environmental Economics and Management, 74:23–36.
Rose, S. K., Clark, J., Poe, G. L., Rondeau, D., and Schulze, W. D. (2002). The Private Provision
of Public Goods: Tests of a Provision Point Mechanism for Funding Green Power Programs.
Resource and Energy Economics, 24(1):131 – 155.
Satterthwaite, M. A. (1975). Strategy-Proofness and Arrow’s Conditions: Existence and Corre-
spondence Theorems for Voting Procedures and Social Welfare Functions. Journal of Economic
Theory, 10(2):187–217.
Vogt, C. (2016). Climate Coalition Formation when Players Are Heterogeneous and Inequality
Averse. Environmental and Resource Economics, 65(1):33–59.
Vossler, C. A., Doyon, M., and Rondeau, D. (2012). Truth in Consequentiality: Theory and Field
Evidence on Discrete Choice Experiments. American Economic Journal: Microeconomics, 4(4):145–
171.
Vossler, C. A. and Holladay, J. S. (2016). Alternative Value Elicitation Formats in Contingent Val-
uation: A New Hope. Working Papers 2016-02, University of Tennessee, Department of Eco-
nomics.
Vossler, C. A. and Watson, S. B. (2013). Understanding the Consequences of Consequentiality:
Testing the Validity of Stated Preferences in the Field. Journal of Economic Behavior & Organiza-
tion, 86:137–147.
Whitehead, J. C. and Cherry, T. L. (2007). Willingness to Pay for a Green Energy Program: A
Comparison of ex-ante and ex-post Hypothetical Bias Mitigation Approaches. Resource and
Energy Economics, 29(4):247–261.
Yamazaki, A. (2017). Jobs and Climate Policy: Evidence from British Columbia’s Revenue-Neutral
Carbon Tax. Journal of Environmental Economics and Management, 83:197–216.
28