equilibrium considerations in the … archive/files/19...118 equilibrium considerations in the...
TRANSCRIPT

117
Equilibrium Considerations in the Methane Synthesis System
Gerald Gruber
FMC Corporation, Princeton, N. J.
Summary
An investigation was made into the equilibria of the methanation reaction, coupled with the shift reaction and the carbon deposition reaction. Of particular interest ig the exploration of regions where carbon deposition is possible according to thermodynamic criterion, assuming that carbon is deposited as graphite or "Dent" carbon.
The carbon laydown curves are plotted on a unique coordinate system which corresponds to starting composition variables that are commonly used. The effects of pressure, temperature and starting composition on carbon laydown are investigated over a wide range of practical interest, and beyond. All possible starting compositions are considered over a temperature range of 600°K (625OF) to 2000'K (3140"FJ and a pressure range of 30 atm (426.psig) to 300 atm (4395 psig). In addition, the effects of pressure, temperature and starting composition on equilibrium composition and product gas heating value are examined. The figures presented provide a useful tool for the rapid scanning of the effect of possible starting gas composition, pressure and temperature on product gas quality and useful operating regions. The utility of the graphs are not limited to a single stage reaction, but can be used for multiple stage reactors with arbitrary amounts of diluents (H,O, CO,, CH,) and recycle gas, which may change from stage to stage. Additionally, the pressure and temperature of each stage may be considered independently.

118
Equil ibr ium Cons ide ra t ions i n t h e Methane Syn thes i s System
Gerald Gruber
FMC Corp. , Pr ince ton , N . J.
I n t r o d u c t i o n
Considering t h e s y n t h e s i s of methane from carbon monoxide and hydrogen, i t is d e s i r e d t o o p e r a t e a r e a c t o r , o r r e a c t o r s , i n such a way as t o avo id t h e depos i t i on of carbon on c a t a l y s t s u r f a c e s and t o produce a high q u a l i t y product gas . gas compositions e n t e r i n g t h e r e a c t o r may vary considerably because of t h e use of d i l u e n t s and r e c y c l e gas i n a t e c h n i c a l ope ra t ion , it i s d e s i r a b l e t o e s t i m a t e t h e e f f e c t s o f i n i t i a l gas composition on t h e subsequent ope ra t ion . P res su re and temperature a r e a d d i t i o n a l parameters .
composition f o r any g iven s t a r t i n g composition, p re s su re and temperature . It is no more d i f f i c u l t t o do it f o r a range o f s t a r t i n g compositions, p r e s s u r e s and temperatures , except t h a t it t a k e s longe r . S ince t h e c a l c u l a t i o n s a r e done on a computer, many parameters can be c l o s e l y examined. However, faced wi th t h e g r e a t mass of c a l c u l a t e d r e s u l t s , it i s important t o have them p resen ted i n a conc i se , i n fo rma t ive manner.
Since
I t is a simple enough matter t o c a l c u l a t e t h e equ i l ib r ium
By using a p a r t i c u l a r t y p e of t r i a n g u l a r diagram, it i s p o s s i b l e t o r e p r e s e n t a l l p o s s i b l e s t a r t i n g compositions of CO, CO,, H , , H 2 0 and CH, on a s i n g l e coord ina te system which is easy t o use.
Chemistry
Consider t h e fo l lowing r e a c t i o n s which a r e s u f f i c i e n t t o d e s c r i b e t h e system:
CO + 3H, z CH, t H,O 1)
CO t H,O , z H, + CO, 2 )
2co 2 co, + c 3 )
I n a d d i t i o n , it w i l l be convenient to make r e f e r e n c e t o another r e a c t ion :
Y CH, C t ZH, 4 )
which is n o t independent of r e a c t i o n s 1-3.
11
! '1 h
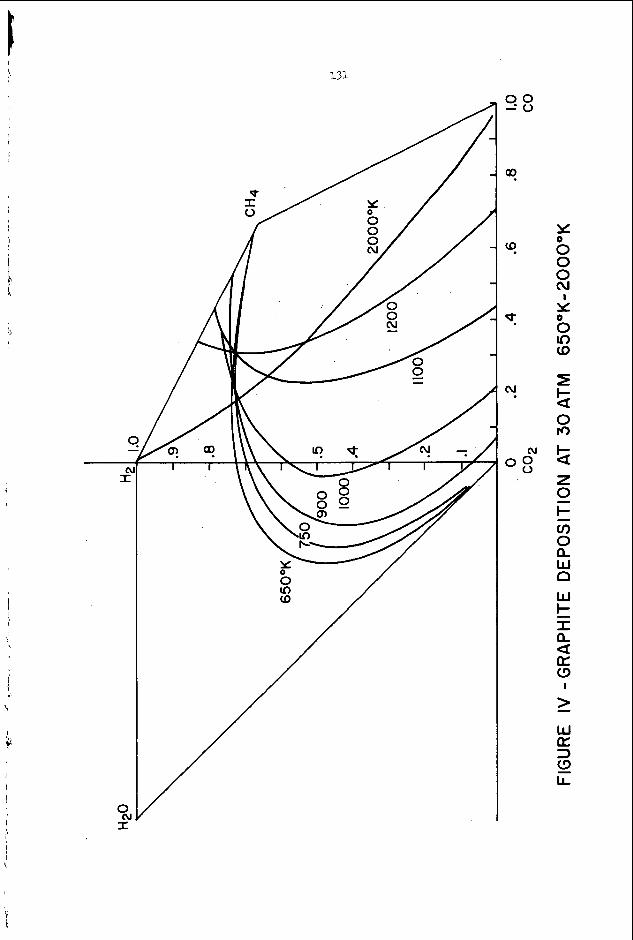
Reactions 1 and 3 a r e h i g h l y exothermic and t h e r e f o r e have equ i l ib r ium cons tan t s t h a t dec rease r a p i d l y w i t h temperature. Reaction 2 i s moderately exothermic, and consequently i t s equ i l ib r ium cons tan t shows a moderate dec rease wi th temperature . Reactions 4 i s moderately endothermic and i t s equ i l ib r ium cons tan t i n c r e a s e s wi th i n c r e a s i n g temperature.
cons t an t f o r t h e s e f o u r r e a c t i o n s i s i n d i c a t e d i n Figure I , where carbon is assumed t o be g r a p h i t e . Thermodynamic d a t a were t aken from JANEF (1) and Rossini ( 2 ) .
The r e l a t i o n s h i p between temperature and equ i l ib r ium
I f w e a l low f o r t h e f a c t t h a t carbon may be depos i t ed i n a form o t h e r t h a n g r a p h i t e , t h e e q u i l i b r i u m c o n s t a n t s of r e a c t i o n s 3 and 4 must r e f l e c t t h e d i f f e r e n t s t a t e . Th i s behavior has i n f a c t been observed by Dent ( 3 ) .
Dent and h i s coworkers found t h a t t h e observed e q u i l i b - rium cons tan t f o r r e a c t i o n 3 was less than t h e t h e o r e t i c a l equ i l ib r ium cons tan t f o r d e p o s i t i o n of g r a p h i t e based on measurements made between 6 0 O o K and 1 2 0 0 O K . The d e p a r t u r e w a s g r e a t e s t a t 600°K, and t h e observed and t h e o r e t i c a l equ i l ib r ium c o n s t a n t s approached each o t h e r a s t h e tempera- t u r e inc reased , becoming equa l a t about 1 1 0 0 ° K t o 1200OK. The d i f f e r e n c e i n f r e e energy between g r a p h i t e and t h e a c t u a l form of carbon depos i t ed w a s a l s o determined by decomposing pure CH, and by d e p o s i t i n g carbon from a CO and H, mixture . These r e s u l t s confirmed t h e measurements made by decomposing pure CO. These experiments w e r e performed ove r a n i c k e l c a t a l y s t and it i s specu la t ed t h a t t h e anomolous f r e e energy of t h e depos i t ed carbon may be due t o t h e f a c t t h a t it forms a ca rb ide o r a s o l i d s o l u t i o n .
Whatever t h e exac t form of t h e carbon d e p o s i t i o n is , it must be recognized and t aken i n t o account i n f u t u r e c a l c u l a - t i o n s . The depos i t ed m a t e r i a l is c a l l e d "Dent" carbon, and equ i l ib r ium c o n s t a n t s based on i t s f r e e energy a r e a l s o i n d i c a t e d i n Figure I. The f a c t t h a t carbon d e p o s i t s a s "Dent" carbon has been q u a l i t a t i v e l y confirmed by Pur s l ey ( 4 ) .
Other r e c e n t equ i l ib r ium c a l c u l a t i o n s ( 5 , 6 , 7) found i n t h e l i t e r a t u r e assume carbon d e p o s i t i o n t o be i n t h e form of g r a p h i t e . I n t h i s paper , c a l c u l a t i o n s a r e based on both c a s e s , g r a p h i t e and "Dent" carbon.
Ca lcu la t ion of Carbon Deposit ion
I f w e cons ide r t h e s stem c o n s i s t i n g of t h e s i x s p e c i e s , CO, H, , H,O, CO, , CH, , an% C , t o g e t h e r w i t h t h e t h r e e indepen- den t r e a c t i o n s 1 through 3 , t h e system can be uniquely de f ined by s p e c i f y i n g t h r e e s p e c i e s . As a matter of convenience, w e

120
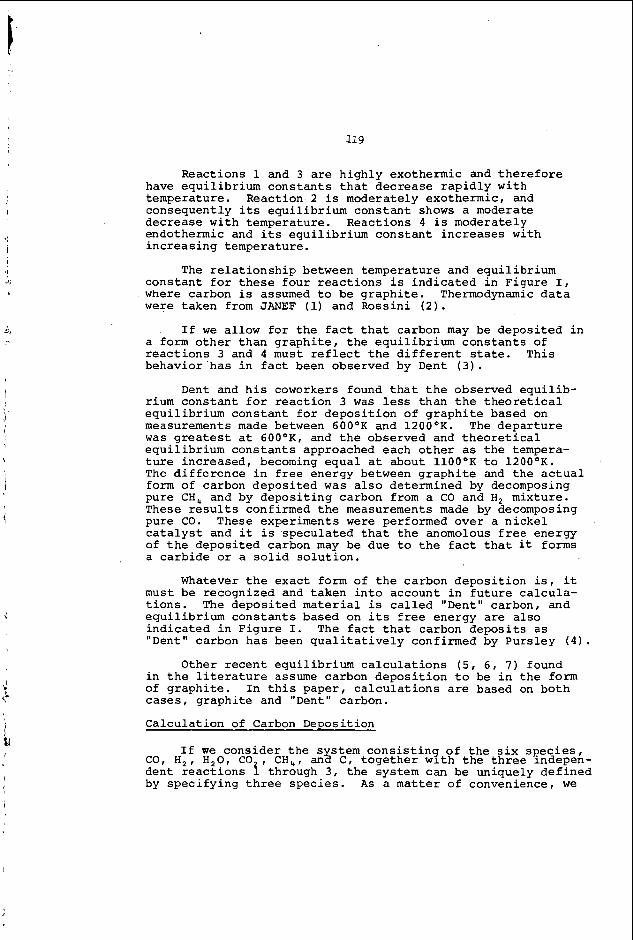
select t h e t h r e e s p e c i e s t o be H, , CO, and CO,, and f u r t h e r - more, by normalizing t h e composition such t h a t t h e number of moles o f t h e s p e c i e s sums t o u n i t y w e on ly have t o s p e c i f y two s p e c i e s e x p l i c i t l y , which a r e chosen t o be H, and CO. Then, t h e composition of CO, i s implied. In o r d e r t o c a l c u l a t e carbon d e p o s i t i o n , f o r any given s t a r t i n g temperature t h e procedure i s t o so lve equa t ions 1 and 2 f o r t h e equ i l ib r ium cornposition, i g n o r i n g carbon depos i t i on . A f t e r t h e e q u i l i b r i u m composition i s ob ta ined , a check is made t o see if t h e r a t i o ( C O ) 2 / C 0 , according t o equa t ion 3 would l e a d t o carbon depos i t i on . If no carbon depos i t i on is ind ica t ed , then t h e e n t i r e c a l c u l a t i o n is repeated us ing equa t ions 1 to 3 i f it i s des i r ed t o c a l c u l a t e t h e amount of carbon depos i t ed . By using t h e above procedure, a l i n e i s def ined which d e f i n e s t h e coord ina te r eg ion i n t o two a r e a s ; one where g r a p h i t e may d e p o s i t , and one where g r a p h i t e may n o t d e p o s i t - based on e q u i l i b r i u m c a l c u l a t i o n s . A sample o f t h i s t ype of graph is shown i n Figure 11.
Coordinate S y s t e m s
Before w e d i s c u s s the curves i n F igu re 11, a s h o r t d i s c u s s i o n of t h e c o o r d i n a t e system w i l l be presented. A s i n d i c a t e d above, any p o s s i b l e composition o f CO, CO, , H , , H,O, and CH, ( s o l i d carbon a l s o ) may be dep ic t ed on t h e coord ina te s y s t e m shown i f t h e independent s p e c i e s a r e s e l e c t e d t o b e H , , CO and CO,. Fu r the r , t h e sum of t h e s p e c i e s is s e t t o u n i t y and only H, ( Y coord ina te ) and CO (X coord ina te ) are e x p l i c i t l y p l o t t e d . Pure H, i s ind ica t ed a s t h e p o i n t ( 0 , 1 . 0 ) and pure CO is i n d i c a t e d a t t he po in t (1.0,O). S i m i l a r l y , pure CO, i s a t t h e p o i n t (O,O), and compositions corresponding t o pure H,O (-1, 1) and pure CH, ( 2 / 3 , 2 / 3 ) a r e a l s o i n d i c a t e d . Water, f o r example, i n terms o f t h e independent s p e c i e s i s expressed a s
H,O = H, + CO, - CO
a s t h e p o i n t on t h e graph corresponds t o X = 1 and Y = 1. S i m i l a r l y , CH, may be expressed a s
CH, = 2H, + 2CO - CO,
The t o t a l number of moles i s 3 so t h a t upon normalizing Y = 2 /3 and X = 2 / 3 . I n g e n e r a l , f o r a mixture of a r b i t r a r y composition, t h e c o o r d i n a t e s a r e given by
5) n,o + H, + 2CH4 Y = H,O + H, + CO, + CO + 3CH,
6) CO - H,O + 2CH, x = H,O + H, + CO, + CO + 3CH,

i'
I
121
I , I
h b
i
i
I I,
I
Furthermore, compositions may be found g r a p h i c a l l y by a l e v e r r u l e . A l l mixtures of pure CO, and pure H2 f a l l along t h e Y a x i s , t h e d i s t a n c e from pure CO, being i n v e r s e l y p r o p o r t i o n a l t o t h e amount of pure CO, i n t h e mixture. S i m i l a r r u l e s hold f o r any p a i r o f pure components o r , i n f a c t , f o r any p a i r of mixtures , w i th t h e excep t ion of methane, o r mLxtures con ta in ing methane. Since one mole o f methane i s equ iva len t t o 3 moles of independent s p e c i e s , methane concen t r a t ions must be weighed by a f a c t o r of t h r e e .
corresponds t o t h e region bounded by t h e s t r a i g h t l i n e s connecting t h e pure components on Figure 11. The region formed t o t h e r i g h t of CH, - CO l i n e and below t h e extension of t h e H,O - CH, l i n e corresponds t o mix tu res of CH,, CO and s o l i d C , and, a l though p h y s i c a l l y r e a l i z a b l e , i s n o t con- s i d e r e d here.
Generally speaking, t h e a r e a of p h y s i c a l r e a l i t y
The two curves shown i n Figure I1 d i v i d e t h e graph i n t o g r a p h i t e forming and non-graphite forming r eq ions . These curves a r e f o r 30 atm p r e s s u r e and f o r 650°K and 750°K, cond i t ions which a r e t y p i c a l o f many proposed methanation processes ( 4 , 8 , 9 , 1 0 ) . The r eg ion below and t o t h e r i g h t of t h e curve is where g r a p h i t e might be depos i t ed .
Consider t h e p o i n t A on Figure I1 corresponding t o a s t o i c h i o m e t r i c mixture of H, and CO. I f pure CO, i s added t o t h e mixture , t h e po in t C may be reached by moving along t h e l i n e connecting t h e po in t and pure CO,. S i m i l a r l y , i f pure H,O i s added, t h e composition moves along t h e l i n e connecting po in t C and pure H,O u n t i l t h e p o i n t D is reached. Point E can be reached by adding H, and removing H,O, which po in t i n c i d e n t l y corresponds t o a s t o i c h i o m e t r i c mixture of H, and CO,, o r it may be viewed a s a s t o i c h i o m e t r i c mixture o f H, and CO with an excess o f water .
allowed t o r e a c t according t o equat ion 1 to produce some CH, and H,O. r ep resen ted by p o i n t A . I f water is now removed from t h e mixture , t h e composition moves along t h e l i n e connecting p o i n t A and pure H,O t o a p o i n t E . The ex tens ion of t h i s l i n e i n t e r s e c t s t h e po in t f o r pure CH,. I f t h e mixture , whose composition is rep resen ted by E , is allowed t o r e a c t f u r t h e r , and i f t h e water produced i s subsequent ly removed, t h e p o i n t r ep resen t ing t h e composition w i l l move along t h e l i n e A - E g e t t i n g c l o s e r t o pure CH,.
One o b j e c t i v e i s t o approach pure methane without caus ing t h e depos i t i on of carbon or g r a p h i t e , and t h e s e curves provide a r a p i d p i c t u r e of how t h i s may be done by o p e r a t i n g a t d i f f e r e n t s t a r t i n g compositions and t empera tu res , even w i t h m u l t i p l e s t a g e s .
Suppose a s t a r t i n g mixture corresponding t o po in t A, i s
The composition o f t h i s new mixture i s s t i l l

L e t us now focus a t t e n t i o n on t h e curves i n Figure 11. E i t h e r one w i l l s e r v e a s a b a s i s f o r a q u a l i t a t i v e d i scuss ion . Consider f i r s t mix tu res of pure CO and CO,, a l l p o i n t s o f which l i e on t h e X axis. The equ i l ib r ium i n t h i s system i s f u l l y descr ibed by equa t ion 3 . A s t h e temperature i n c r e a s e s , t h e equ i l ib r ium c o n s t a n t dec reases , and CO becomes s t a b l e . A t t h e temperature cons ide red he re , t h e mixture w i l l d e p o s i t g r a p h i t e u n t i l almost pure CO, is reached. Thus t h e g r a p h i t e depos i t i on curve w i l l i n t e r s e c t t h e X a x i s a t a p o i n t which i s very c l o s e t o X = 0 ( a t 750'K it i s approximately X = . 0 1 ) . Pure CO, i s s t a b l e wi th r e s p e c t t o carbon d e p o s i t i o n , a s i s pure H, , b u t t h e r e is a l a r g e composition range where mixtures of H, and CO, w i l l d e p o s i t g raph i t e . Thus t h e carbon depos i t i on curve i n t e r s e c t s t h e Y a x i s a t two p o i n t s , a s i n d i c a t e d on Figure 11. equ i l ib r ium i s governed by equat ion 4 . For t h i s r e a c t i o n , t h e equ i l ib r ium c o n s t a n t i n c r e a s e s with temperature so t h a t a t h igh enough t empera tu res t h e r e w i l l be a p p r e c i a b l e d i s s o c i a t i o n CH, t o H, and g r a p h i t e . I n t h e temperature range considered he re , t h e thermodynamic equ i l ib r ium i n d i c a t e s only a very small amount of d i s s o c i a t i o n so t h e i n t e r s e c t i o n of t h e g raph i t e d e p o s i t i o n curve and t h e H, - CH, l i n e occur s a t almost pure CH,. As t h e temperature i n c r e a s e s , t h e p o i n t o f i n t e r s e c t i o n w i l l move towards pure H, on t h e H, - CH, l i n e .
I n t h e region of pure CH,, t h e
So f a r , w e have d i scussed g r a p h i t e depos i t i on only i n terms of t h e t w o r e a c t i o n s 3 and 4 . A s t h e temperature i n c r e a s e s , g r a p h i t e d e p o s i t i o n by r e a c t i o n 4 is favored, and i s r e t a rded by r e a c t i o n 3 . The n e t r e s u l t i s t h a t t h e g r a p h i t e d e p o s i t i o n curves f o r two temperatures w i l l i n t e r s e c t a t some po in t . Th i s w i l l become clearer when w e cons ide r cu rves a t d i f f e r e n t temperatures than i n d i c a t e d he re .
Carbon and Graphi te Deposi t ion
A . Pressu re
In Figure 11, curves f o r two temperatures have been p resen ted t h a t i n d i c a t e t h e a r e a s of g r a p h i t e depos i t i on . Before w e cons ide r t h e e f f e c t s o f h ighe r temperatures , t h e e f f e c t of p re s su re w i l l be examined.
p r e s s u r e s a t 700'K. This graph uses t h e same coord ina te system, b u t i s p l o t t e d on a l a r g e r s c a l e . Again w e s t a r t by consider ing the e f f e c t s o f p re s su re on t h e two, 2-component systems r ep resen ted by r e a c t i o n 3 i n one c a s e , and by r e a c t i o n 4 i n t he o t h e r c a s e .
Figure I11 shows t h e g r a p h i t e d e p o s i t i o n curves f o r 3
il
I

123
I
,I' I
An i n c r e a s e i n p r e s s u r e f avor s t h e r e v e r s e of r e a c t i o n 4 which has t h e e f f e c t of dec reas ing t h e g r a p h i t e formation a r e a i n t h e v i c i n i t y of pure methane. Thus t h e i n t e r s e c t i o n of t h e g r a p h i t e d e p o s i t i o n curve and t h e pure H, - CH, l i n e moves toward pure CH,. I n cons ide r ing r e a c t i o n 3 , an i n c r e a s e i n p re s su re enhances t h e d e p o s i t i o n of g r a p h i t e and t h e i n t e r s e c t i o n o f t h e g r a p h i t e d e p o s i t i o n curve and t h e X a x i s w i l l move c l o s e r t o pure CO,. an i n t e r s e c t i o n of t h e g r a p h i t e d e p o s i t i o n curve f o r t w o d i f f e r e n t p r e s s u r e s . For t h e temperature i n d i c a t e d (700°K), t h e e f f e c t o f p r e s s u r e on t h e l o c a t i o n of t h e g r a p h i t e d e p o s i t i o n curve is n o t l a r g e , a l though t h e e f f e c t i s more pronounced a t higher temperatures .
This behavior aga in l e a d s t o
B. Temperature
At t en t ion w i l l now be focused on t h e e f f e c t of temperature on t h e g r a p h i t e d e p o s i t i o n cu rve , consider ing a l a r g e r temperature range and t h e depos i t i on of "Dent" carbon.
t h e temperature range of 650°K t o 2000OK. The upper temper- a t u r e i s f a r above t h e maximum c a p a b i l i t y of c a t a l y s t s which a r e being proposed t o c a r r y o u t t h e methanation r e a c t i o n on a l a r g e s c a l e ( 6 ) ; however, it is i n t e r e s t i n g t o c a r r y o u t t h e c a l c u l a t i o n s t o t h e s e high temperatures , assuming t h a t no o t h e r r e a c t i o n s w i l l t a k e p l ace .
Along t h e X a x i s , a s t h e temperature i n c r e a s e s , t h e i n t e r - s e c t i o n o f t h e g r a p h i t e d e p o s i t i o n curve moves towards pure CO, while a long t h e H, - CH, l i n e t h e i n t e r s e c t i o n moves towards pure H, . temperature i n c r e a s e s , g r a p h i t e d e p o s i t i o n i s less l i k e l y f o r s t a r t i n g mixtures which a r e nea r s t o i c h i o m e t r i c , b u t i t i s more d i f f i c u l t t o produce pure methane by removing water and r e a c t i n g t h e mixture f u r t h e r . Due t o equ i l ib r ium c o n s i d e r a t i o n s , t h e f i n a l approach t o pure methane must be done a t a r e l a t i v e l y low temperature .
b u t has t h e thermodynamic p r o p e r t i e s o f "Dent" carbon, t h e s i t u a t i o n i s q u i t e a b i t d i f f e r e n t . A t lower temperatures considered, "Dent" carbon i s much less l i k e l y t o be deposi ted than g r a p h i t e , a s i n d i c a t e d by t h e curve f o r 600°K i n Figure V. A s t h e temperature i n c r e a s e s , t h e behavior of "Dent" carbon approaches t h a t o f g r a p h i t e , and t h e carbon depos i t i on region becomes g r e a t e r . A t approximately l l O O ° K , t h e curves f o r "Dent" carbon and g r a p h i t e a r e t h e same. A t h ighe r temper- a t u r e s , it i s assumed t h a t "Dent" carbon and g r a p h i t e a l s o behave i d e n t i c a l l y i n r ega rds t o depos i t i on .
Figure I V shows t h e g r a p h i t e d e p o s i t i o n curves f o r
The behavior p rev ious ly d i scussed i s now more ev iden t .
Thus, t h e odd r e s u l t appears t h a t a s t h e
I f it i s assumed t h a t t h e s o l i d d e p o s i t is no t g r a p h i t e ,

\
Since t h e e f f e c t s o f temperature on r e a c t i o n s 3 and 4 a r e i n oppos i t e d i r e c t i o n s , t h e d i f f e r e n t temperature curves a l s o i n t e r s e c t , a s is t h e case f o r g r a p h i t e .
governed by t h e thermochemistry of "Dent" carbon, r a t h e r than g r a p h i t e , it is obvious t h a t t h e r e i s a much g r e a t e r region where d e p o s i t i o n w i l l no t t a k e p l ace .
I f it is assumed t h a t t h e d e p o s i t i o n of carbon is
Equil ibr ium Compositions and Heating Value
The preceeding d i s c u s s i o n has been most ly confined t o t h e carbon depos i t i on curves as a func t ion o f temperature , p re s su re and i n i t i a l composition. Also o f i n t e r e s t , e s p e c i a l l y f o r methane s y n t h e s i s , i s t h e composition and h e a t i n g va lue of t h e equ i l ib r ium gas mixture . It i s d e s i r a b l e t o produce a gas wi th a high h e a t i n g v a l u e , which impl i e s a high concen- t r a t i o n o f CH,, and a l o w concen t r a t ion of t h e o t h e r spec ie s . Of p a r t i c u l a r i n t e r e s t are t h e concen t r a t ions of H, and CO a s t h e s e gene ra l ly are t h e va luab le raw m a t e r i a l s . Also, by custom it is d e s i r a b l e t o maintain a CO concen t r a t ion o f less than 1 percent . The c a l c u l a t e d hea t ing va lues a r e r epor t ed according to t h e custom i n t h e gas i n d u s t r y , which is based on a cubic foo t a t 30" Hg and 60°F, s a t u r a t e d wi th water vapor (11). Furthermore, it i s c a l c u l a t e d and r e p o r t e d f o r a CO, and H,O f r e e gas as t h e s e components may be removed from t h e mixture a f t e r t h e f i n a l chemical r e a c t i o n . Concentrat ions of CH,, CO and H, a r e also repor t ed on a CO, - H,O f r e e b a s i s .
The higher h e a t i n g va lue is p l o t t e d on t h e composition coord ina te i n Figure V I . These curves a r e f o r 50 atm and 700OK. The con tour s of c o n s t a n t h e a t i n g va lue i n c r e a s e uniformly i n t h e d i r e c t i o n of pure methane. These con tour s , of course, a r e ve ry s i m i l a r t o t h e contours of CH, concen t r a t ion , which are i n d i c a t e d i n Figure V I I , f o r t h e same c o n d i t i o n s , 5 0 a t m and 700OK.
Hydrogen concen t r a t ion contours f o r 50 atm and 700°K a r e shown i n F igu re V I I I . These contours i n d i c a t e t h a t t h e r e is apprec iab le unreacted hydrogen a f t e r e q u i l i b r i u m i s ob ta ined , a n d it i s clear t h a t m u l t i p l e r e a c t i o n s t a g e s a r e r equ i r ed t o approach pure methane.
Figure I X f o r 50 a t m and 700OK. These curves i n d i c a t e t h a t the CO leakage w i l l n o t be high if e q u i l i b r i u m i s ob ta ined i f t h e i n i t i a l composition is nea r t h e s t o i c h i o m e t r i c l i n e .
Carbon monoxide concen t r a t ion contours are shown i n

125
h ?
Figure X shows t h e e f f e c t of temperature on higher hea t ing va lue , CH,, H, and CO c o n c e n t r a t i o n s f o r f o u r d i f f e r e n t s t a r t i n g compositions, which a r e a l s o i n d i c a t e d on Figure 11. The four s t a r t i n g compositions are :
Y X
1 .75 . 2 5 s t o i c h i o m e t r i c
2 .8 . o s t o i c h i o m e t r i c
3 .7 .1 hydrogen d e f i c i e n t
4 .8 . 0 5 hydrogen r i c h
In t h i s con tex t , " s to i ch iomet r i c " imp l i e s any composition po in t on t h e l i n e connecting pure w a t e r and pure methane. These mixtures have an H,/CO r a t i o of 3.0 and c o n t a i n e i t h e r excess w a t e r o r methane. Thus, t hey are s t o i c h i o m e t r i c w i th r e s p e c t t o hydrogen and carbon monoxide according t o r e a c t i o n 1. Po in t s f a l l i n g below t h e l i n e a r e d e f i c i e n t i n hydrogen, and p o i n t s above t h e l i n e are hydrogen r i c h .
In Figure X-A and B , t h e h e a t i n g va lue and methane concen t r a t ion dec rease a s a f u n c t i o n of temperature f o r a l l fou r s t a r t i n g compositions. Conversely, t h e hydrogen and carbon monoxide c o n c e n t r a t i o n s i n c r e a s e , a s seen on Figures X-C and D. The CO leakage i s about t h e same f o r t h e t w o s t o i c h i o m e t r i c p o i n t s , bu t i s cons ide rab ly l a r g e r f o r t h e hydrogen d e f i c i e n t s t a r t i n g composition.
Figure X I shows t h e e f f e c t of p r e s s u r e on h ighe r h e a t i n g value and equ i l ib r ium composition f o r t h e same f o u r s t a r t i n g compositions i n d i c a t e d on Figure X, a l l f o r a temperature of 7OOOK. General ly , t h e e f f e c t o f p r e s s u r e dec reases a s t h e p re s su re i n c r e a s e s , most o f t h e change o c c u r r i n g i n t h e r eg ion up t o 2 0 0 a t m . For a l l of t h e compositions, a s w e l l a s t h e higher h e a t i n g v a l u e s , t h e curves f o r two s t o i c h i o m e t r i c and f o r t h e hydrogen d e f i c i e n t s t a r t i n g p o i n t s are s i m i l a r . A d i f f e r e n c e i s noted f o r t h e s t a r t i n g composition which i s hydrogen r i c h . Th i s is more apparent on Figure X I because it i s p l o t t e d on a l a r g e r s c a l e than on F igu re X.
General Discussion
Various schemes have been proposed i n t h e l i t e r a t u r e f o r c a r r y i n g o u t t h e methane s y n t h e s i s r e a c t i o n , some of which a r e i n use ( 6 , 12 , 1 3 , 1 4 ) .

126
A major eng inee r ing problem i s removing t h e l a r g e amount of h e a t generated du r ing t h e s y n t h e s i s and numerous ways of doing t h i s have been cons ide red . The r e a c t o r temperature may be c o n t r o l l e d by r e c y c l i n g product g a s , w i th o r without t h e wa te r being condensed, or by otherwise d i l u t i n g t h e r e a c t i n g mixture wi th an excess of any o f t h e products o r r e a c t a n t s . This e f f e c t i v e l y changes t h e o v e r a l l mixture composition. In a d d i t i o n , t h e f r e s h feed composition is widely v a r i a b l e depending upon t h e source of t h e feed gas . However, t h e c h a r t s p r e s e n t e d he re a r e a p p l i c a b l e t o a g a s o f any composition and a l low one t o see immediately i f t h e p o s s i b i l i t y of carbon d e p o s i t i o n e x i s t s f o r any given temperature wi th in t h e range o f i n t e r e s t . On Figure V f o r example, it i n d i c a t e s t h a t it i s no t p o s s i b l e t o approach pure CH, a t a high temperature without d e p o s i t i n g carbon, ana i n f a c t , t h a t a c a t a l y s t with a high temperature c a p a b i l i t y is n o t u n i v e r s a l l y u s e f u l , b u t depends on t h e s t a r t i n g composition o f t h e mixture . I n any e v e n t , t h e f i n a l s t a g e of t h e r e a c t i o n t o approach pure CH, must be c a r r i e d o u t a t a low temperature .
m b

I
127 i
References
I, 3
4
i
3 L
J o i n t Army-Navy-Air Force Thermochemical Table, 2nd E d . , June 1971.
Ross in i , F. D . , e t . a l . , "Se lec ted Values of P r o p e r t i e s of Hydrocarbons, N a t . Bur. S tandards , C i r c u l a r C 4 6 1 , 1947.
Dent, J. F . , Moignard, L. A. , Blackbraun, W. H . , Herbden, D. , "An I n v e s t i g a t i o n i n t o t h e C a t a l y t i c Syn thes i s of Methane by Town G a s Manufacture", 49 th Report o f t h e J o i n t Research C o m m i t t e e of t h e Gas Research Board and t h e Un ive r s i ty of Leeds, GRB20, 1945.
Pu r s l ey , J. A . , R. R. White and C. S l i epcev ich , Chem. Eng. Piog. Symposium S e r i e s , Vol. 48, N o . 4 , Reaction Kine t i c s , pp. 51-58, 1958.
Lunde, P. J. and F. L. Kester, Ind. Eng. D e s . Develop., 12, No. 1, 1974.
M i l l s , G. A. and F. W. S t e f fgen , Ca ta lys
Greyson, M. , i n C a t a l y s i s , (P. H . Emmet, Chapter 6 , 1956, Reinhold, N. Y.
NO. 2 , 159-210 (1973) .
Chem., Proc.
s Reviews, E,
Lee, A. L. , H. L. Fe ldki rchner and D. G. T a j b l , "Methanation of Coal Hydrogas i f ica t ion" , ACS D i v . Fue l Chem. P r e p r i n t s , 14, No. 4 , P a r t I , 126-142, September, 1970.
Wen, C. Y. , P. W. Chen, K. Kato and A. F. G a l l i , "Optimizat ion of Fixed B e d Methanation Processes" , ACS D i v . Fue l Chemistry P r e p r i n t s , 14, No. 3 , 104-163, September, 1970.
(10) Forney, A. J. and J. P. M c G e e , "The Synthane Process" , Fourth AGA P i p e l i n e G a s Symposium, Chicago, 1972.
(11) McClahahan, D. N . , O i l & G a s J o u r n a l , Feb. 20, 1967, pp. 84-90.
( 1 2 ) Greyson, M . , e t . a l . , U. S . Bureau of Mines, Rept. o f Inves t . , 6609 (1965) .
( 1 3 ) Forney, A. J. and W. P . Haynes, "The Synthane Coal t o Gas Process: A Progres s Report" , ACS Div. Fue l Chem. P r e p r i n t s , September, 1971.
( 1 4 ) Schoubye, P. J. , C a t a l y s i s , e, (1) , 118 (1970) .

24
22
20
18
16
14
12
10
8
2 - 6
5 4
2
0
-2
-4
-6
-8
-10
REACT1 ON @ CO+3H2 CH4+H20 @ C O + H 2 0 m H2+C02
@ CH4 C+2H2 @ 2co = c 0 2 + c
GRAPHITE ----- " DENT" CAR B 0 N
200 600 i 000 1400 1800 2200 TEMPERATURE O K
FIGURE I -EQUILIBRIUM CONSTANTS AS A FUNCTION OF TEMPE RAT UR E

i
i I
129
t x
* I'

d- M
W I- I - a a a c3
z 0 z I- v) 0 a z 0 0
Q -
w U 3 (3 LI
(u. 1 -
M 1-
(r I
I
b

132
C - (v I
E
0 m z 0 U 0
I- z W
s
m a - -
n - LL 0 z 0 I- v) 0 a W n
> W U 3 (3
LL
- -
I
-

133


'4
d-
N

- 9 - (u I
.
0 * Y
6 0 W I n

l A
3 :
200 I------
\
I
D
600 800 1000 1200 . 800 1000 1200 TEMPERATURE O K
FIGURE X-EFFECT OF TEMPERATURE ON CONCENTRATION AT 5 0 ATM
Y X 0 .75 .25 0 .8 0 0 .7 .I + .8 .05

1000 1 1
950
goo-,
-0 /: -0 A
-
.3
.2 I
I I I I I I
C
- H2
-+-+-+-+
CONCENTRATION
8
LT+-+ CONCENTRATION
+
I I I I 1 1 I I I I I I I
PRESSURE ATM
FiGCjRE Xi-EFFECT OF PRESSURE ON CONCENTRATION AT 700°K
Y X O .75 .25 A .8 0 0 .7 . I + .8 .05
1.0
.9 5
090
.85
.80
.7 5
3 ~ 1 0 ' ~
Z ~ I O - ~
I ~ 1 0 ' ~
0