equilibrium and kinetic constants for the thiol-disulfide interchange
TRANSCRIPT
Proc. Natl. Acad. Sci. USAVol. 89, pp. 7944-7948, September 1992Biochemistry
Equilibrium and kinetic constants for the thiol-disulfideinterchange reaction between glutathione and dithiothreitol
(disulfide reduction/thiol oxidation/redox potential)
DAVID M. ROTHWARF AND HAROLD A. SCHERAGA*Baker Laboratory of Chemistry, Cornell University, Ithaca, NY 14853-1301
Contributed by Harold A. Scheraga, June 15, 1992
ABSTRACT The equilibrium and rate constants for thereaction between oxidized and reduced glutathione and oxi-dized and reduced dithiothreitol have been determined atseveral pH values and temperatures. The measurements in-volve approach to equilibrium from both directions, quenchingof the reaction by lowering the pH or by addition of methylmethanethiosulfonate, separation of reactants and products byreverse-phase HPLC, and determination of their concentra-tions. Analysis of reaction mixtures was carried out at varioustimes to assure that equilibrium had been reached and todetermine kinetic constants prior to the attainment of equilib-rium.
The thiol-disulfide interchange reaction is important in avariety of biological systems (1-3) and, in particular, instudies of the regeneration of disuffide-containing proteinsfrom their reduced forms (4-6). The thiol/disulfide reagentsin widest use in studies of the regeneration of proteins areoxidized glutathione (GSSG) and reduced glutathione (GSH),primarily because they are known to occur at significantconcentrations in biological systems (7) and because theyexhibit a suitable redox potential.The oxidation of monothiols such as GSH is a bimolecular
process and is entropically different from the unimolecularprocess of disulfide formation that occurs in proteins. Incontrast, the formation of cyclic disulfides such as oxidizeddithiothreitol (DTToX) results from a unimolecular process.Glutathione forms stable mixed disulfides with protein thiols,which greatly complicates studies of regeneration pathways.On the other hand, while DTTOX is a much weaker oxidizingagent, it does not form stable mixed disulfides (because thecyclization reaction is very fast), making it a useful reagentfor studies of protein regeneration (5, 8). It has been argued,though incorrectly, that, while these reagents differ in theirentropies of disulfide formation, they are similar in theirabilities to regenerate protein when concentrations areadjusted to give similar redox potentials (9).The role that these different types (mono- and cyclic thiol)
of reagents play is a key feature of the detailed regenerationprocesses of proteins. Any attempt to distinguish thesedifferent roles requires a quantitative determination of theirrelative redox potentials. In order to make comparisonsbetween the results of regeneration experiments using dithio-threitol and those using glutathione, it is necessary to knowthe equilibrium constant for the reaction between glutathioneand dithiothreitol. The equations describing this equilibriumare
KObs [DTToX] [GSH]2eq [Drrred] [GSSG]' [2]
where the brackets indicate concentrations at equilibrium.Unfortunately, a wide range of values has been reported
for this thiol-disulfide exchange equilibrium constant. Valuesof 8800M at pH 7 and 300C (10) and 13,000 M at pH 7 and anunspecified temperature (11) have been reported, based on anindirect technique involving a lipoamide dehydrogenase-mediated reaction between NAD+ and lipoamide. Use ofintermediates populated during the regeneration of bovinepancreatic trypsin inhibitor (BPTI) led to a value of 1200 Mat pH 8.7 and 250C (12). A direct HPLC method, very similarto the technique to be reported here, gave values of -200 Mat pH 7 and 8, 250C, and 380 M at pH 8.7, 250C (13). In thedirect method (13), the equilibrium was approached fromonly one direction and insufficient experimental details wereprovided to resolve the controversy. Our own indirect mea-surements (unpublished results), obtained while studying theregeneration of ribonuclease A, resulted in a value of 260 Mat pH 8, 25°C, and are in agreement with those of Chau andNelson (13).While it will not be discussed in detail here, the value ofthis
equilibrium constant and the rate of reduction of GSSG bydithiothreitol (DTTmd) are essential for explaining the path-ways ofregeneration ofribonuclease A and for understandingthe general problem of how native protein structures regen-erate. The purpose of this paper is to present experimentaldetails of the direct method, sufficient to confirm the accu-racy of the results of Chau and Nelson (13) at pH 8 and 25°C,which are consistent with our data from the regeneration ofribonuclease A, and to determine the values of the equilib-rium constants and rate constants under the solution condi-tions that are directly relevant to our work on the regener-ation of ribonuclease A (8). We have also carried out equil-ibrations under other conditions (pH 7, 30°C) to permit directcomparison with the values for the equilibrium and kineticconstants determined by Szajewski and Whitesides (10).
MATERIALS AND METHODSMaterials. Ultrapure DTTred was obtained from Boeh-
ringer Mannheim and recrystallized from absolute ether.DTTOX (Sigma) was purified by the method of Creighton (14).GSH and GSSG were obtained from Boehringer Mannheimand were purified by reverse-phase HPLC on a 5-pm C18Dynamax column (Rainin, Woburn, MA) with 0.09%o tri-fluoroacetic acid (TFA) in water isocratically as the mobile
GSSG + DTTred ; 2GSH + DTfoX [1]Abbreviations: DTTOX, oxidized dithiothreitol; DTTed, dithiothrei-tol; GSH, reduced glutathione; GSSG, oxidized glutathione; BPTI,bovine pancreatic trypsin inhibitor; DDS, disulfide detection system;MMTS, methyl methanethiosulfonate; TFA, trifluoroacetic acid.*To whom reprint requests should be addressed.
7944
The publication costs of this article were defrayed in part by page chargepayment. This article must therefore be hereby marked "advertisement"in accordance with 18 U.S.C. §1734 solely to indicate this fact.
Proc. Natl. Acad. Sci. USA 89 (1992) 7945
phase. All other reagents were of the highest grade commer-cially available.
Purity. Because the equilibrium constant of Eq. 2 isexpected to be large and has a molar concentration depen-dence, the concentrations of GSH and DTTYX at equilibriumwill be as much as 4 orders of magnitude greater than thoseof GSSG and DTTmd under the conditions used here. There-fore, even a small level of impurity could lead to erroneousresults if it were coeluted with DTTr"d or GSSG. All reagentswere, therefore, purified to >99.9% purity as judged byHPLC at 210 nm. In addition, the GSSG and GSH werechecked by NMR on a Varian XL-400 instrument prior topurification, because we have observed that glutathionesobtained from some suppliers contained significant amounts(in some cases >20%) of a-glutamylcysteinylglycine (M.Adler, D.M.R., and H.A.S., unpublished results) as well ascysteinylglycine (T. W. Thannhauser and H.A.S., unpub-lished results). Significant heterogeneity in the GSSG andGSH may be the origin of the wide range of values reportedfor the dithiothreitol-glutathione equilibrium constant. NMRspectra of the materials used in these studies revealed onlythe presence of GSSG and GSH.The high purity of the starting materials, however, is an
inadequate control to exclude experimental errors due tocontamination, since the formation of small amounts ofdegraded starting material could also complicate the inter-pretation of the data if they were coeluted with DTTred orGSSG. Therefore, we measured the equilibrium constantover a >10-fold range of the starting thiol and disulfideconcentrations. Since the equilibrium constant has a molarconcentration dependence, a 10-fold increase in the concen-trations of both GSH and DTTYX will lead to an -1000-foldincrease in the product of the concentrations of GSSG andDTTred. Since it is the concentrations of GSSG and DTTredthat are sensitive to the level of impurities, and since theyincrease nonlinearly with increases in the total concentrationof material added, the consistency of K~bS serves as anindicator for the absence of impurities. We have exploitedthis nonlinear relationship further by varying the concentra-tions of reagents such that either [DTTred] >> [GSSG] or[GSSG] >> [DTTred] at equilibrium. We also carried outequilibrations over a range of times from 10 to 3300 min.While some small uncharacterized peaks were observable inthe chromatograms from the longer-time equilibrations, themeasured equilibrium constant was unaffected by their for-mation. This indicates that no significant population of deg-radation products was coeluted with DTTred or GSSG. Itshould be noted that any small level of impurities that arecoeluted with DTTIX or GSH will not have any significanteffect on the measured equilibrium constant.
Equilibration. Equilibrations were carried out in PierceReactivials or in screw-cap tubes with septum tops. Theywere placed in a jacketed bath connected to a Haake F-1circulating bath with tap water cooling or to a Fisher Isotemprefrigerated circulator. Temperature regulation was betterthan +0.20C. Samples were kept under a constant stream ofhumidified argon. Buffer containing 100 mM Tris and 2 mMEDTA, which had been sparged with argon, was used for theequilibrations at pH 7.5, 8.0, and 8.7, and the pH wasadjusted at the temperature used. Equilibrations at pH 7.0were carried out in 100 mM phosphate for consistency withthe solution conditions used in earlier studies (10, 11). The pHof each sample was checked on a Radiometer PHM64 re-search pH meter with an Ingold microelectrode and adjustedby the addition ofNaOH and/or HCO to maintain the desiredpH.
Quenching. Since it was crucial to ascertain that theequilibrium was not perturbed when the reaction wasstopped, several different quenching methods were em-ployed. Acid quenching was carried out by adding an equiv-
alent volume of a TFA solution sufficient to lower the pH to2. The concentration of TFA used was in the range 150-300mM. In other experiments, a 25-fold volume of 25 mM TFAwas used to lower the pH to 2. There was no difference withinexperimental error between the two techniques. While it isunlikely that different acid concentrations during quenchingcould yield the same equilibrium constant if shuffling oc-curred during the quenching, it is not a definitive control.Therefore, an additional method was used to quench some ofthe samples. A 15-fold molar excess of methyl methanethio-sulfonate (MMTS) over free thiol was added in a 3:1 volumeratio at pH 8.0. After 5 min, the blocking reaction wasquenched with 0.5 M TFA to pH 2 prior to HPLC analysis.Within experimental error, there was no difference betweenthe results from any of the quenching procedures. In controlexperiments on mixtures of DTTJX and DTTred, the MMTSquenching conditions blocked >95% of the DTTred com-pletely (the remainder presumably cyclized to DTTOX beforethe second thiol of DTTred was blocked).
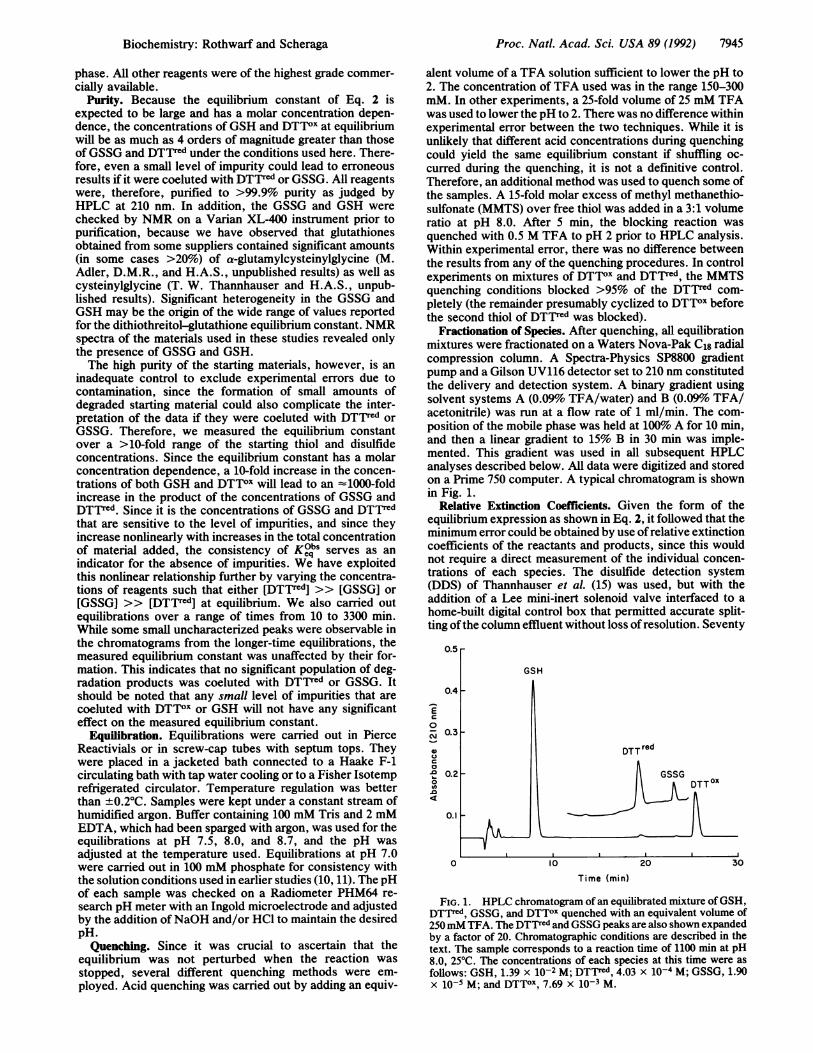
Fractionation of Species. After quenching, all equilibrationmixtures were fractionated on a Waters Nova-Pak C18 radialcompression column. A Spectra-Physics SP8800 gradientpump and a Gilson UV116 detector set to 210 nm constitutedthe delivery and detection system. A binary gradient usingsolvent systems A (0.09% TFA/water) and B (0.09%o TFA/acetonitrile) was run at a flow rate of 1 ml/min. The com-position of the mobile phase was held at 100% A for 10 min,and then a linear gradient to 15% B in 30 min was imple-mented. This gradient was used in all subsequent HPLCanalyses described below. All data were digitized and storedon a Prime 750 computer. A typical chromatogram is shownin Fig. 1.
Relative Extinction Coefficients. Given the form of theequilibrium expression as shown in Eq. 2, it followed that theminimum error could be obtained by use ofrelative extinctioncoefficients of the reactants and products, since this wouldnot require a direct measurement of the individual concen-trations of each species. The disulfide detection system(DDS) of Thannhauser et al. (15) was used, but with theaddition of a Lee mini-inert solenoid valve interfaced to ahome-built digital control box that permitted accurate split-ting of the column effluent without loss of resolution. Seventy
0.5
GSH
0.4
E0
0.3
DTT red
0.2 GSSG0 ~~~~~~~~~~~DTTO
0.1
0 10 20 30
Time (min)
FIG. 1. HPLC chromatogram of an equilibrated mixture ofGSH,DTTred, GSSG, and DTTOX quenched with an equivalent volume of250mM TFA. The DTTred and GSSG peaks are also shown expandedby a factor of 20. Chromatographic conditions are described in thetext. The sample corresponds to a reaction time of 1100 min at pH8.0, 250C. The concentrations of each species at this time were as
follows: GSH, 1.39 x 10⁻² M; DTTred, 4.03 x 10⁻⁴ M; GSSG, 1.90x 10-s M; and DTTOX, 7.69 x 1O-3 M.
Biochemistry: Rothwarf and Scheraga

7946 Biochemistry: Rothwarf and Scheraga
percent of the column effluent was directed toward a GilsonUV116 detector set to 210 nm (to provide a measure of soluteconcentrations), and the remaining 30%o was directed to theDDS (operating at 412 nm to provide a measure of thiol anddisulfide concentrations) at a switching speed of 2 cycles persecond. The DDS has been shown to be quantitative with alinear response over the range of 10-10 to 10-12 mol of thiolor disulfide (15), and our experiments were carried out withinthe linear range. All the data were digitized and stored on aPrime 750 computer. Peak areas were determined from thedigitized data, and relative concentrations were determinedfor GSSG, DTTred, and GSH from the DDS areas. Therelative extinction coefficients, expressed with respect toGSH, were calculated from the measured peak areas at 210nm.
Unfortunately, DTTOX is not reduced by the sulfite com-ponent of the DDS under the conditions used and, therefore,does not react with 2-nitro-5-thiosulfobenzoic acid. Therelative extinction coefficient of DTTX with respect toDTTrd was, therefore, determined in a different manner.DTTrd was dissolved in 100 mM Tris (pH 8.0), and anamount of phenylalanine, an internal standard, was addedsufficient to give an integrated area relative to DTTred at 210nm of between 0.2 and 0.6. Air was not excluded, so thatoxidation could take place. At various times over a period of24 hr, aliquots were removed, the pH was lowered to 2 by theaddition of 0.5 M TFA, and the solution was analyzed byreverse-phase HPLC using detection at 210 nm. The ratio ofthe gain in peak area ofDTTOX divided by the loss in peak areaof DTTred gave the relative extinction coefficient for DTPTXwith respect to DTTed. The ratio of the areas of the phenyl-alanine peaks at zero time and at subsequent times was usedto normalize the results. To check the validity of this methodand to show the consistency of the two methods used todetermine relative extinction coefficients, the same processwas carried out by using GSH instead ofDTTred and allowingit to oxidize slowly in air. There was no difference withinexperimental error between the values obtained by the twotechniques. The standard deviation of the mean (95% confi-dence limit) for the relative extinction coefficients was <2%in all cases. The DDS technique was used to determine therelative extinction coefficients for GSH and DTTred that hadbeen blocked with MMTS, because they have differentextinction coefficients than the unblocked forms.The linear response of the UV detection system was
checked by running a series of calibration curves for each ofthe five components, GSSG, GSH, DTTJX, DTTred, andphenylalanine, over 4 orders of magnitude. While somenonlinearity was observed for some species at the extremesof concentration, the response for all components was linear(correlation coefficient, >0.999) over a range of -3 orders ofmagnitude of the integrated area. Equilibration experimentsin which all four ofthe components fell within the linear rangewere the only ones used. This placed restrictions on the rangeof concentrations that could be used in these experiments.Starting concentrations were selected so as to increase thelikelihood that the concentration of each species would fall inthe desired range. In some cases, it was necessary to run twochromatograms with very different injection volumes so thatall species were in the linear range in at least one chromato-gram. In these cases, at least one component was kept in thelinear range in both chromatograms to serve as a standard forscaling.Equilibrium Constant. As the first step in determining the
equilibrium constant, the total thiol concentration was ob-tained in separate quadruplicate measurements using Ell-man s reagent, 5,5'-dithiobis(2-nitrobenzoic acid). All vol-ume measurements in this investigation were made withHamilton 1000 series Gas-Tite syringes or Finnpipette mi-cropipettors, which were calibrated before use. Ellman mea-
surements were made at 412 nm and 220C on a modified Cary14 spectrophotometer (16). The standard deviation of themeasurements was less than the 3% uncertainty in theextinction coefficient of 2-nitro-5-thiobenzoic acid (17). Wehave used a value of 13,900 M'1cm-1 for the extinctioncoefficient ofthe dianion of 2-nitro-5-thiobenzoic acid, whichwas determined in our laboratory from studies of the 2-nitro-5-thiosulfobenzoic acid reagent (17). Other values reported inthe literature, 13,600 M~-1cm-1 (18, 19), 13,700 M-1 cm-1(20), and 14,150 M-1 cm'1 (13, 21), are well within the stated3% standard deviation (at 99% confidence) of our value (17).The concentrations of the four species in the equilibrium
mixture were determined from the total thiol concentrationand the relative extinction coefficients. The minimum uncer-tainty in the equilibrium constants at 95% confidence is 8.5%,which arises from the uncertainties in the relative extinctioncoefficients and the extinction coefficient of 2-nitro-5-thiobenzoic acid.
Kinetics. By taking aliquots ofthe reaction mixtures prior tothe attainment of equilibrium, and taking account of theforward and reverse reactions (by expressing kr as kftIK2b),we have been able to determine the apparent forward rateconstant, kf) S, for the dithiothreitol-glutathione equilibriumprocess shown in Eq. 1. Since no starting mixture containedboth DTT"' and GSH, the starting concentration of the otherthree species could be determined. The data were then fit withthe aid of a simple Runge-Kutta program to integrate the rateequations numerically (22), using the experimentally deter-mined mass quotient, ([GSH2 [DTTOx])/([GSSG] [DTTId]),as the target function. The program was run on a Prime 750computer.
RESULTSData obtained at pH 8.0, 250C, are shown in Table 1. Theagreement ofthe experimentally determined equilibrium con-stant over a 30-fold range of concentration when approachedfrom either direction, as well as the consistency ofthe resultswith different blocking methods, indicates the absence ofanysignificant experimental artifacts. In addition, the consistentvalue determined for the observed rate constant for thereduction ofGSSG by DTTrd, when the reaction was startedfrom either direction, as shown in Table 1, further supportsthe accuracy of the experimental techniques used. The com-plete set of data under all the solution conditions used issummarized in Table 2. All rate constants and equilibriumconstants presented were derived from data obtained byapproaching equilibrium from both directions. Comparison
Table 1. Glutathione-dithiothreitol data at pH 8.0, 25°CInitial concentration, mM Kobs ks
GSH DTTOx DTTred GSSG M minM0 0 1.06 1.28 1860 0 1.44 1.32 1900 0.03 8.15 8.42 231 2020 0.26 3.77 4.23 2370 0.30 4.04 5.21 1700 0.73 7.37 13.9 1940 -1.11 1.81 0 0 2359.89 8.85 0 0.04 225 180
13.1 31.0 0 0.21 235 -14.3 28.1 0 0.04 23514.7 29.9 0 0.23 243t
All reaction mixtures were quenched with acid except thoseindicated otherwise.*Observed rate constant for the reduction of GSSG by DTTrd.t213 M with MMTS blocking.*249 M with MMTS blocking.
Proc. Nad. Acad. Sci. USA 89 (1992)
Proc. Natl. Acad. Sci. USA 89 (1992) 7947
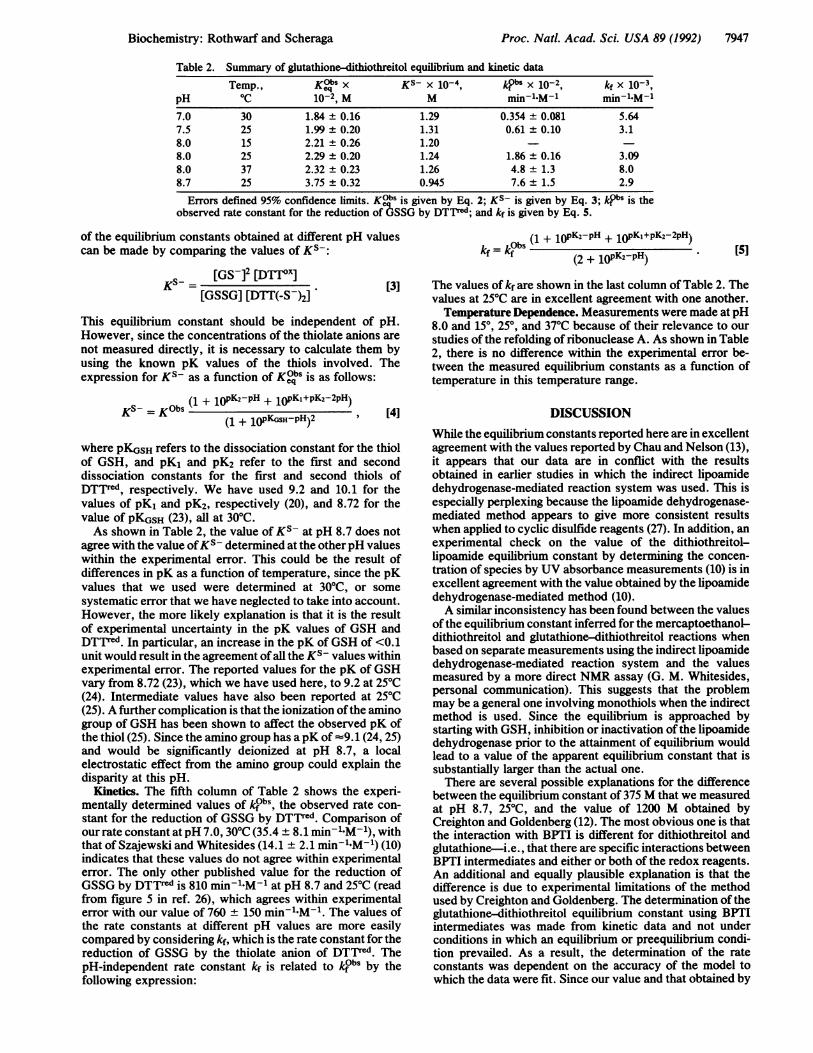
Table 2. Summary of glutathione-dithiothreitol equilibrium and kinetic data
Temp., KebS x KS- x 10-4 kA~bs X 10-2, kf X 10-3,pH C 10-2, M M min-1 M-l min-'.M-17.0 30 1.84 + 0.16 1.29 0.354 + 0.081 5.647.5 25 1.99 ± 0.20 1.31 0.61 ± 0.10 3.18.0 15 2.21 ± 0.26 1.208.0 25 2.29 ± 0.20 1.24 1.86 ± 0.16 3.098.0 37 2.32 ± 0.23 1.26 4.8 ± 1.3 8.08.7 25 3.75 ± 0.32 0.945 7.6 + 1.5 2.9
Errors defined 95% confidence limits. K~bS is given by Eq. 2; Ks- is given by Eq. 3; k4bs is theobserved rate constant for the reduction of GSSG by DTTred; and kf is given by Eq. 5.
of the equilibrium constants obtained at different pH valuescan be made by comparing the values of KS-:
[GS ]2 [DTTOx][GSSG] [DTT(-S )2]
This equilibrium constant should be independent of pH.However, since the concentrations of the thiolate anions arenot measured directly, it is necessary to calculate them byusing the known pK values of the thiols involved. Theexpression for KS- as a function of KIbS is as follows:
= Obs (1 + 1opK2-pH + loPKl+pK2-2pH)kfkf
(2 + lopK2-pH) [5]
The values of kf are shown in the last column of Table 2. Thevalues at 250C are in excellent agreement with one another.Temperature Dependence. Measurements were made at pH
8.0 and 150, 250, and 37°C because of their relevance to ourstudies of the refolding of ribonuclease A. As shown in Table2, there is no difference within the experimental error be-tween the measured equilibrium constants as a function oftemperature in this temperature range.
KS-= KObS (1 + 1OpK2-pH + lOPKl+PK2-2pH)(1 + JOPKGSH-pH)2 1 [4]
where pKGSH refers to the dissociation constant for the thiolof GSH, and pK, and pK2 refer to the first and seconddissociation constants for the first and second thiols ofDTTred, respectively. We have used 9.2 and 10.1 for thevalues of pK, and pK2, respectively (20), and 8.72 for thevalue of pKGSH (23), all at 30°C.As shown in Table 2, the value of Ks- at pH 8.7 does not
agree with the value ofKS- determined at the otherpH valueswithin the experimental error. This could be the result ofdifferences in pK as a function of temperature, since the pKvalues that we used were determined at 30°C, or some
systematic error that we have neglected to take into account.However, the more likely explanation is that it is the resultof experimental uncertainty in the pK values of GSH andDTTrd. In particular, an increase in the pK of GSH of <0.1unit would result in the agreement ofall the KS- values withinexperimental error. The reported values for the pK of GSHvary from 8.72 (23), which we have used here, to 9.2 at 25°C(24). Intermediate values have also been reported at 25°C(25). A further complication is that the ionization ofthe aminogroup of GSH has been shown to affect the observed pK ofthe thiol (25). Since the amino group has apK of -9.1 (24, 25)and would be significantly deionized at pH 8.7, a localelectrostatic effect from the amino group could explain thedisparity at this pH.
Kinetics. The fifth column of Table 2 shows the experi-mentally determined values of 1fObs, the observed rate con-stant for the reduction of GSSG by DTTr,5d. Comparison ofour rate constant atpH 7.0, 30°C (35.4 ± 8.1 min- M-1), withthat of Szajewski and Whitesides (14.1 2.1 min-1 M-1) (10)indicates that these values do not agree within experimentalerror. The only other published value for the reduction ofGSSG by DTTred is 810 min-1-M-1 at pH 8.7 and 25°C (readfrom figure 5 in ref. 26), which agrees within experimentalerror with our value of 760 + 150 min-1 M-1. The values ofthe rate constants at different pH values are more easilycompared by considering kf, which is the rate constant for thereduction of GSSG by the thiolate anion of DTTred. ThepH-independent rate constant kf is related to Afbs by thefollowing expression:
DISCUSSIONWhile the equilibrium constants reported here are in excellentagreement with the values reported by Chau and Nelson (13),it appears that our data are in conflict with the resultsobtained in earlier studies in which the indirect lipoamidedehydrogenase-mediated reaction system was used. This isespecially perplexing because the lipoamide dehydrogenase-mediated method appears to give more consistent resultswhen applied to cyclic disulfide reagents (27). In addition, anexperimental check on the value of the dithiothreitol-lipoamide equilibrium constant by determining the concen-tration of species by UV absorbance measurements (10) is inexcellent agreement with the value obtained by the lipoamidedehydrogenase-mediated method (10).A similar inconsistency has been found between the values
ofthe equilibrium constant inferred for the mercaptoethanol-dithiothreitol and glutathione-dithiothreitol reactions whenbased on separate measurements using the indirect lipoamidedehydrogenase-mediated reaction system and the valuesmeasured by a more direct NMR assay (G. M. Whitesides,personal communication). This suggests that the problemmay be a general one involving monothiols when the indirectmethod is used. Since the equilibrium is approached bystarting with GSH, inhibition or inactivation of the lipoamidedehydrogenase prior to the attainment of equilibrium wouldlead to a value of the apparent equilibrium constant that issubstantially larger than the actual one.There are several possible explanations for the difference
between the equilibrium constant of 375 M that we measuredat pH 8.7, 250C, and the value of 1200 M obtained byCreighton and Goldenberg (12). The most obvious one is thatthe interaction with BPTI is different for dithiothreitol andglutathione-i.e., that there are specific interactions betweenBPTI intermediates and either or both of the redox reagents.An additional and equally plausible explanation is that thedifference is due to experimental limitations of the methodused by Creighton and Goldenberg. The determination of theglutathione-dithiothreitol equilibrium constant using BPTIintermediates was made from kinetic data and not underconditions in which an equilibrium or preequilibrium condi-tion prevailed. As a result, the determination of the rateconstants was dependent on the accuracy of the model towhich the data were fit. Since our value and that obtained by
Biochemistry: Rothwarf and Scheraga
7948 Biochemistry: Rothwarf and Scheraga
Creighton and Goldenberg differ by only a factor of 3, itwould require an error of only S5O% in their forward andreverse rate constants to reconcile the two results. Further-more, recent studies ofthe regeneration ofBPTI (28) indicatethat the quenching technique used in ref. 12 (iodoacetateblocking) was inadequate and that significant rearrangementoccurred during the blocking. Hence, the distribution ofintermediates that was measured did not represent the truedistribution before blocking.
In conclusion, the data of Table 2 indicate that DTTOX is astrong enough oxidizing agent for regenerating disulfide-containing proteins from their reduced forms. They are beingused in our analysis of regeneration data for ribonuclease A,a preliminary communication of which has already appeared(8).
This research was supported by Grant GM14312 from the NationalInstitute of General Medical Sciences of the National Institutes ofHealth. Support was also received from the National Foundation forCancer Research and from the Cornell Biotechnology Program.
1. Ziegler, D. M. (1985) Annu. Rev. Biochem. 54, 305-329.2. Gilbert, H. F. (1984) Methods Enzymol. 107, 330-351.3. Gilbert, H. F. (1990) Adv. Enzymol. 63, 69-172.4. Scheraga, H. A., Konishi, Y. & Ooi, T. (1984) Adv. Biophys.
18, 21-41.5. Creighton, T. E. (1984) Methods Enzymol. 107, 305-329.6. Kim, P. S. & Baldwin, R. L. (1990) Annu. Rev. Biochem. 59,
631-660.7. Saxena, V. P. & Wetlaufer, D. B. (1970) Biochemistry 9,,5015-
5022.8. Rothwarf, D. M. & Scheraga, H. A. (1991) J. Am. Chem. Soc.
113, 6293-6294.
9. Wearne, S. J. & Creighton, T. E. (1988) Proteins: Struct.Funct. Genet. 4, 251-261.
10. Szajewski, R. P. & Whitesides, G. M. (1980) J. Am. Chem.Soc. 102, 2011-2026.
11. Cleland, W. W. (1964) Biochemistry 3, 480-482.12. Creighton, T. E. & Goldenberg, D. P. (1984) J. Mol. Biol. 179,
497-526.13. Chau, M.-H. & Nelson, J. W. (1991) FEBS Lett. 291, 2%-298.14. Creighton, T. E. (1977) J. Mol. Biol. 113, 295-312.15. Thannhauser, T. W., McWherter, C. A. & Scheraga, H. A.
(1985) Anal. Biochem. 149, 322-330.16. Denton, J. B., Konishi, Y. & Scheraga, H. A. (1982) Biochem-
istry 21, 5155-5163.17. Thannhauser, T. W., Konishi, Y. & Scheraga, H. A. (1984)
Anal. Biochem. 138, 181-188.18. Ellman, G. L. (1959) Arch. Biochem. Biophys. 82, 70-77.19. Danehy, J. P., Elia, V. J. & Lavelle, C. J. (1971) J. Org. Chem.
36, 1003-1005.20. Whitesides, G. M., Lilburn, J. E. & Szajewski, R. P. (1977) J.
Org. Chem. 42, 332-338.21. Riddles, P. W., Blakeley, R. L. & Zerner, B. (1979) Anal.
Biochem. 94, 75-81.22. Wiberg, K. B. (1986) in Techniques ofChemistry, Investigation
ofRates and Mechanisms ofReactions, ed. Bernasconi, C. F.(Wiley, New York), Vol. 6, 4th Ed., part 1, pp. 981-1019.
23. Reuben, D. M. E. & Bruice, T. C. (1976) J. Am. Chem. Soc.98, 114-121.
24. Jung, G., Breitmaier, E. & Voelter, W. (1972) Eur. J. Biochem.24, 438-445.
25. Rabenstein, D. L. (1973) J. Am. Chem. Soc. 95, 2797-2803.26. Creighton, T. E. (1975) J. Mol. Biol. 96, 767-776.27. Houk, J. & Whitesides, G. M. (1987) J. Am. Chem. Soc. 109,
6825-6836.28. Weissman, J. S. & Kim, P. S. (1991) Science 253, 1386-1393.
Proc. Nad. Acad. Sci. USA 89 (1992)