equality and diversity - yeovil district hospital€¦ · 2.2 the overall representation of black...
TRANSCRIPT

T:\Academy\Training\Equality & Inclusion\Reports\Equality And Diversity Workforce Report 2014-15.Doc
EQUALITY AND DIVERSITY DATA ANALYSIS WORKFORCE INFORMATION SUMMARY REPORT 2014-15
1. Introduction
1.1 Yeovil District Hospital (The Trust) is committed to engaging a diverse workforce that meets the requirements of the Trust’s business and is
reflective of the wider community in which it delivers patient services. 1.2 The Trust has chosen to follow guidelines contained within the NHS’ “Equality Delivery System (EDS2)” in order to measure our performance and
prompt partnership working with patients, the public and staff. 1.3 This report has been compiled by members of the Trust’s Equality & Diversity Focus Group.
2. Demographic Information
2.1 The data in this report and the tables contained within it set out the ethnicity breakdown within our primary catchment areas of Somerset and
Dorset using data from the Office of National Statistics’ 2011 Census “Ethnic group1, local authorities in the United Kingdom”. Comparison data specifically relating to this organisation is included in the table below, showing not only the percentage of our workforce which has declared a racial group, but also the actual number of staff within our workforce to have provided that information.
2.2 The overall representation of black and minority ethnic individuals in Somerset and Dorset is on average 2.1% of the total population. The
percentage of black and minority ethnic employees in the Trust is 18% which reflects a proportionate representation of the community of Somerset and Dorset.
Ethnicity by catchment county
Dorset % Somerset % England Total %
YDH Total Staff
YDH Total %
White 97.8 97.8 85.3 1202 62
White Irish / Any Other White Background
0.1 0.1 0.1 413 21
Mixed / Multiple Ethnic Groups
0.8 0.8 2.3 13 0
Asian/ Asian British – Indian
0.2 0.2 2.6 58 3
Asian/ Asian British – Pakistani
0.0 0.0 2.1 18 1
Asian/ Asian British – Bangladeshi
0.1 0.1 0.8 - -
Asian/ Asian British – 0.2 0.2 0.7 4 0
T:\Academy\Training\Equality & Inclusion\Reports\Equality And Diversity Workforce Report 2014-15.Doc
Chinese
Other Asian 0.4 0.4 1.5 53 3 Black/African/Caribbean 0.2 0.2 3.5 11 1
Other Ethnic group 0.1 0.1 1.0 27 1
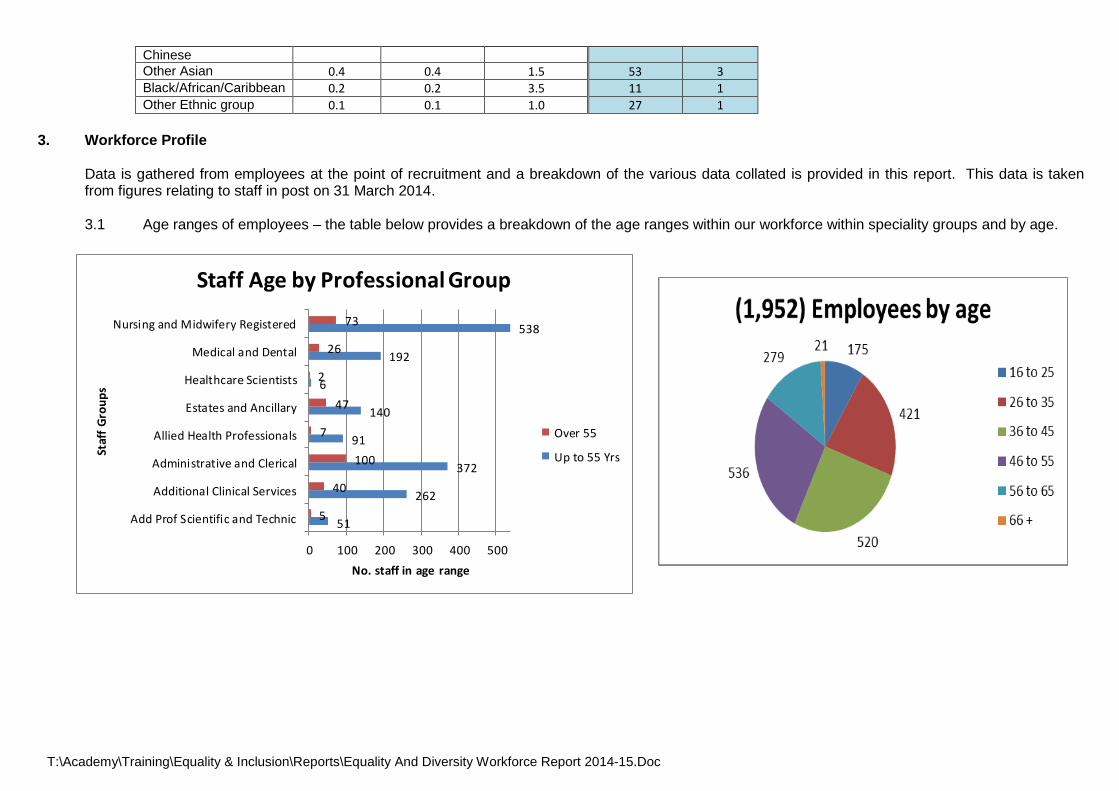
3. Workforce Profile
Data is gathered from employees at the point of recruitment and a breakdown of the various data collated is provided in this report. This data is taken from figures relating to staff in post on 31 March 2014. 3.1 Age ranges of employees – the table below provides a breakdown of the age ranges within our workforce within speciality groups and by age.
51
262
372
91
140
6
192
538
5
40
100
7
47
2
26
73
0 100 200 300 400 500
Add Prof Scientific and Technic
Additional Clinical Services
Administrative and Clerical
Allied Health Professionals
Estates and Ancillary
Healthcare Scientists
Medical and Dental
Nursing and Midwifery Registered
No. staff in age range
Staf
f G
rou
ps
Staff Age by Professional Group
Over 55
Up to 55 Yrs
T:\Academy\Training\Equality & Inclusion\Reports\Equality And Diversity Workforce Report 2014-15.Doc
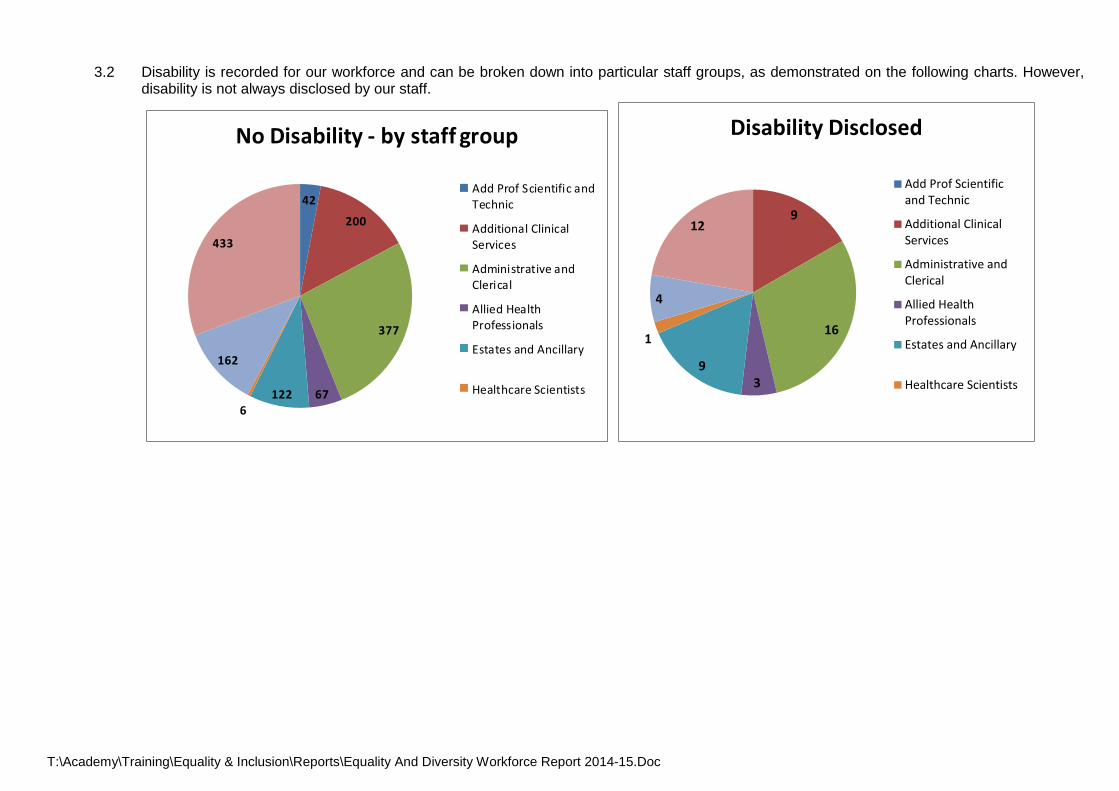
3.2 Disability is recorded for our workforce and can be broken down into particular staff groups, as demonstrated on the following charts. However,
disability is not always disclosed by our staff.
42
200
377
671226
162
433
No Disability - by staff group
Add Prof Scientific andTechnic
Additional ClinicalServices
Administrative andClerical
Allied HealthProfessionals
Estates and Ancillary
Healthcare Scientists
9
16
39
1
4
12
Disability Disclosed
Add Prof Scientificand Technic
Additional ClinicalServices
Administrative andClerical
Allied HealthProfessionals
Estates and Ancillary
Healthcare Scientists

T:\Academy\Training\Equality & Inclusion\Reports\Equality And Diversity Workforce Report 2014-15.Doc
3.3 The Trust has a guaranteed interview scheme for disabled candidates, the shortlist criteria for which is dependent on the role and its minimum
requirements. 3.4 When recording applicant information, we note requirements based on disability. However, as collating other information could be seen as
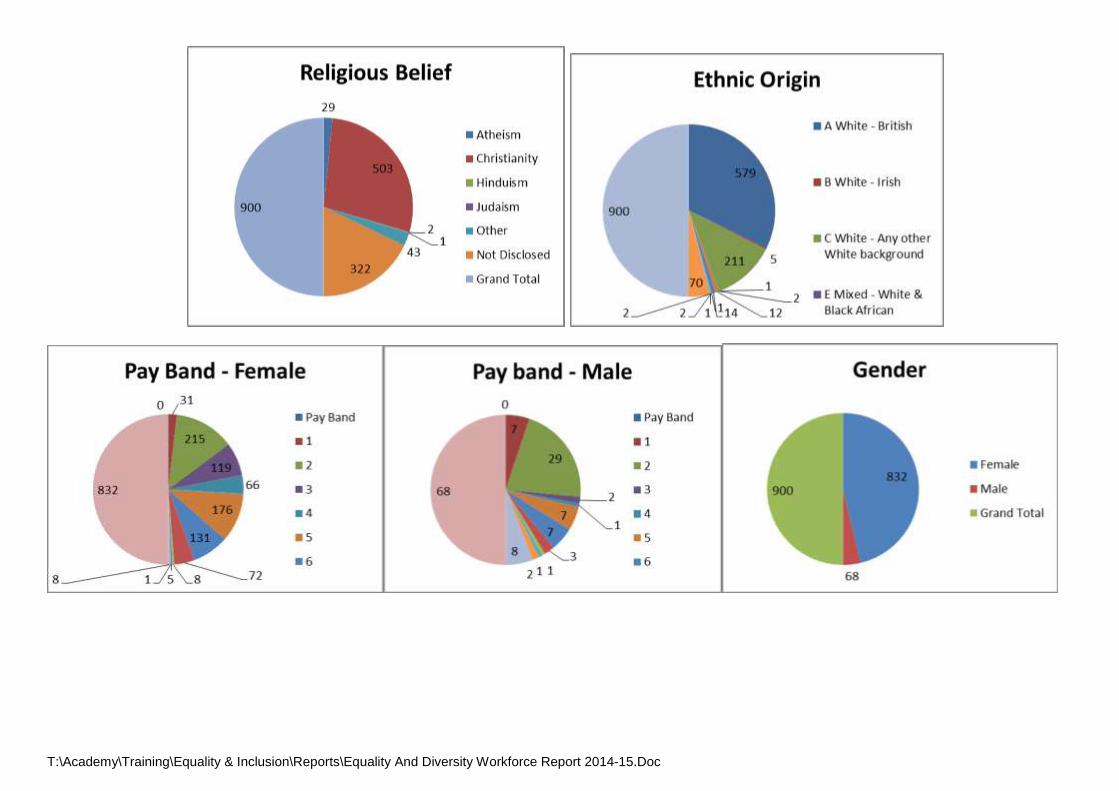
discrimination, e.g. age, we do not routinely gather personal information relating to any of the other protected characteristics. 3.5 The gender ratios of our staff can be found in the following table:
Staff Group Female Male Grand Total
Add Prof Scientific and Technic 47 9 56
Additional Clinical Services 260 42 302
Administrative & Clerical 400 72 472
Allied Health Professionals 82 16 98
Estates & Ancillary 92 95 187
Healthcare Scientists 6 2 8
Medical & Dental 76 142 218
Nursing & Midwifery Registered 573 38 611
Grand Total 1536 416 1952
79%
21%
Gender %
Male
Female
T:\Academy\Training\Equality & Inclusion\Reports\Equality And Diversity Workforce Report 2014-15.Doc
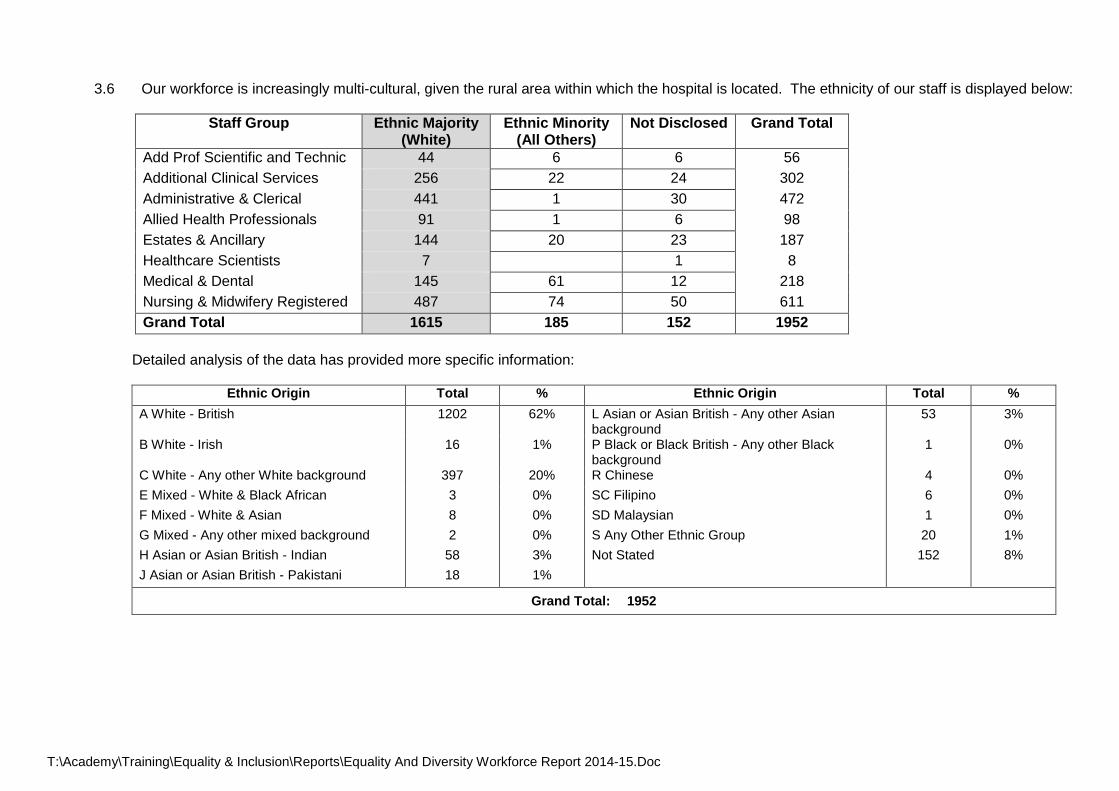
3.6 Our workforce is increasingly multi-cultural, given the rural area within which the hospital is located. The ethnicity of our staff is displayed below:
Staff Group Ethnic Majority (White)
Ethnic Minority (All Others)
Not Disclosed Grand Total
Add Prof Scientific and Technic 44 6 6 56
Additional Clinical Services 256 22 24 302
Administrative & Clerical 441 1 30 472
Allied Health Professionals 91 1 6 98
Estates & Ancillary 144 20 23 187
Healthcare Scientists 7 1 8
Medical & Dental 145 61 12 218
Nursing & Midwifery Registered 487 74 50 611
Grand Total 1615 185 152 1952
Detailed analysis of the data has provided more specific information:
Ethnic Origin Total % Ethnic Origin Total %
A White - British 1202 62% L Asian or Asian British - Any other Asian background
53 3%
B White - Irish 16 1% P Black or Black British - Any other Black background
1 0%
C White - Any other White background 397 20% R Chinese 4 0%
E Mixed - White & Black African 3 0% SC Filipino 6 0%
F Mixed - White & Asian 8 0% SD Malaysian 1 0%
G Mixed - Any other mixed background 2 0% S Any Other Ethnic Group 20 1%
H Asian or Asian British - Indian 58 3% Not Stated 152 8%
J Asian or Asian British - Pakistani 18 1%
Grand Total: 1952

T:\Academy\Training\Equality & Inclusion\Reports\Equality And Diversity Workforce Report 2014-15.Doc
3.7 The increasing diversity of cultures within our workforce can also be demonstrated by the multi faith data provided below.
Staff Group Majority
(Christianity) Minority (All
Others) Not Disclosed Grand Total
Add Prof Scientific and Technic 28 6 22 56
Additional Clinical Services 144 47 111 302
Administrative and Clerical 303 51 118 472
Allied Health Professionals 42 20 36 98
Estates and Ancillary 86 20 81 187
Healthcare Scientists 3 2 3 8
Medical and Dental 77 64 77 218
Nursing and Midwifery Registered 313 76 222 611
Grand Total 996 286 670 1952
More specifically:
Religious Belief Number %
Atheism 130 7%
Buddhism 5 0%
Christianity 997 51%
Hinduism 13 1%
Islam 23 1%
Judaism 3 0%
Sikhism 1 0%
Other 110 6%
Not Disclosed 670 34%
Grand Total 1952 100%
T:\Academy\Training\Equality & Inclusion\Reports\Equality And Diversity Workforce Report 2014-15.Doc
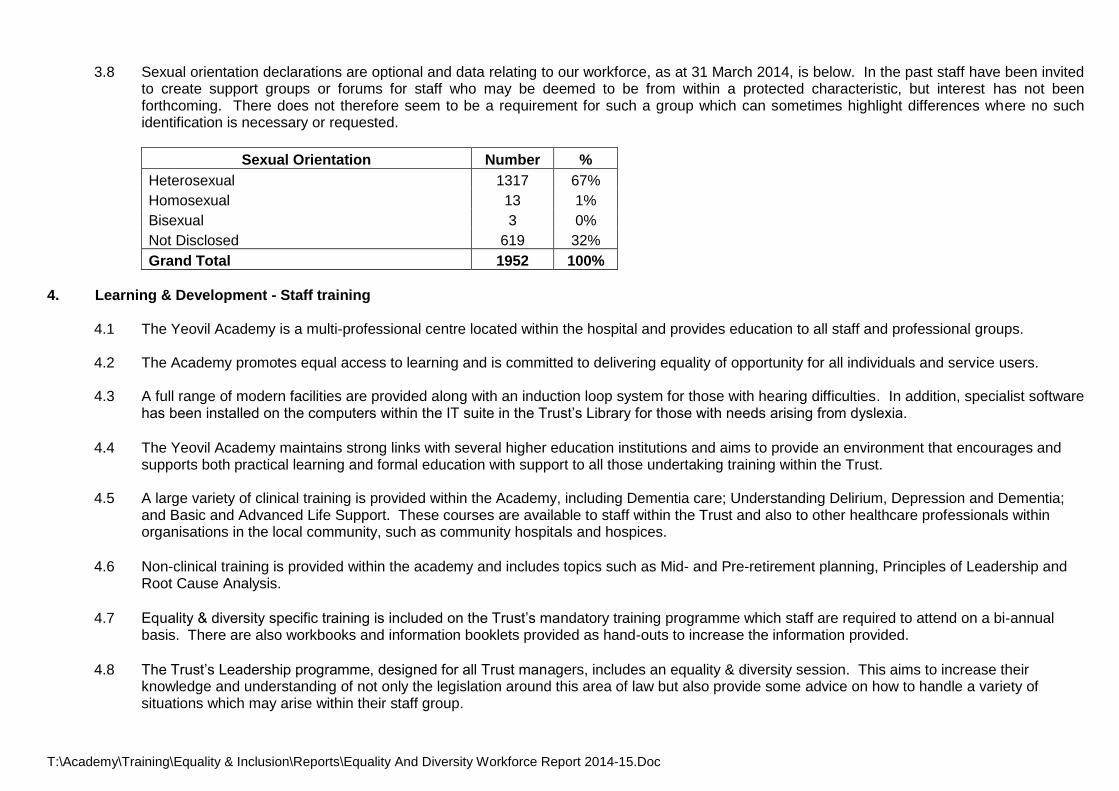
3.8 Sexual orientation declarations are optional and data relating to our workforce, as at 31 March 2014, is below. In the past staff have been invited
to create support groups or forums for staff who may be deemed to be from within a protected characteristic, but interest has not been forthcoming. There does not therefore seem to be a requirement for such a group which can sometimes highlight differences where no such identification is necessary or requested.
Sexual Orientation Number %
Heterosexual 1317 67%
Homosexual 13 1%
Bisexual 3 0%
Not Disclosed 619 32%
Grand Total 1952 100%
4. Learning & Development - Staff training
4.1 The Yeovil Academy is a multi-professional centre located within the hospital and provides education to all staff and professional groups. 4.2 The Academy promotes equal access to learning and is committed to delivering equality of opportunity for all individuals and service users. 4.3 A full range of modern facilities are provided along with an induction loop system for those with hearing difficulties. In addition, specialist software
has been installed on the computers within the IT suite in the Trust’s Library for those with needs arising from dyslexia. 4.4 The Yeovil Academy maintains strong links with several higher education institutions and aims to provide an environment that encourages and
supports both practical learning and formal education with support to all those undertaking training within the Trust. 4.5 A large variety of clinical training is provided within the Academy, including Dementia care; Understanding Delirium, Depression and Dementia;
and Basic and Advanced Life Support. These courses are available to staff within the Trust and also to other healthcare professionals within organisations in the local community, such as community hospitals and hospices.
4.6 Non-clinical training is provided within the academy and includes topics such as Mid- and Pre-retirement planning, Principles of Leadership and
Root Cause Analysis. 4.7 Equality & diversity specific training is included on the Trust’s mandatory training programme which staff are required to attend on a bi-annual
basis. There are also workbooks and information booklets provided as hand-outs to increase the information provided. 4.8 The Trust’s Leadership programme, designed for all Trust managers, includes an equality & diversity session. This aims to increase their
knowledge and understanding of not only the legislation around this area of law but also provide some advice on how to handle a variety of situations which may arise within their staff group.

T:\Academy\Training\Equality & Inclusion\Reports\Equality And Diversity Workforce Report 2014-15.Doc
4.9 In September 2013 the 11th National NHS Staff Survey was conducted: 750 questionnaires were issued to a randomised sample of staff, 409 were completed and returned, making a completion rate for this organisation of 53.5%. A summary of results is provided below, although the more detailed Report can be found on the Trust’s website.
34
53
77
57
Training Received %
Handling violence/
aggression
Providing a goodpatient experience
Personal developmenttraining
Equality & Diversity
training
5. Apprenticeships
5.1 Over the last 12 months the Trust has offered apprenticeship schemes in all areas of the Trust, both clinically and non-clinically. To date we have put 140 learners through various levels of apprenticeships. There is a variation of age and the Trust does not discriminate in any way as to who can apply and become an apprentice. We have particularly strong relationships with our local colleges providing excellent access opportunities to young people within our local community to join our workforce.
6. Board Members
6.1 The Trust Board comprises a total of 11 members, Executive and Non-Executive, summarised below. In total, 28% of our Board membership is
female.
6 Executive Directors: 4 male and 2 female
5 Non-Executive Directors: 5 male and 1 female
T:\Academy\Training\Equality & Inclusion\Reports\Equality And Diversity Workforce Report 2014-15.Doc
7. Remuneration – This section demonstrates our gender remuneration information.
7.1 All posts are graded again a job description and personal specification using the NHS Job Evaluation Tool. By analysing any potential pay gap we are able to identify whether gender bias may be an area of inequality.
7.2 Responses from the staff survey conducted in September 2013 (completion details at 3.2 above) indicated that 38% of staff were ‘very satisfied/ satisfied’ with their level of pay, with 25% being ‘neither satisfied or dissatisfied’.
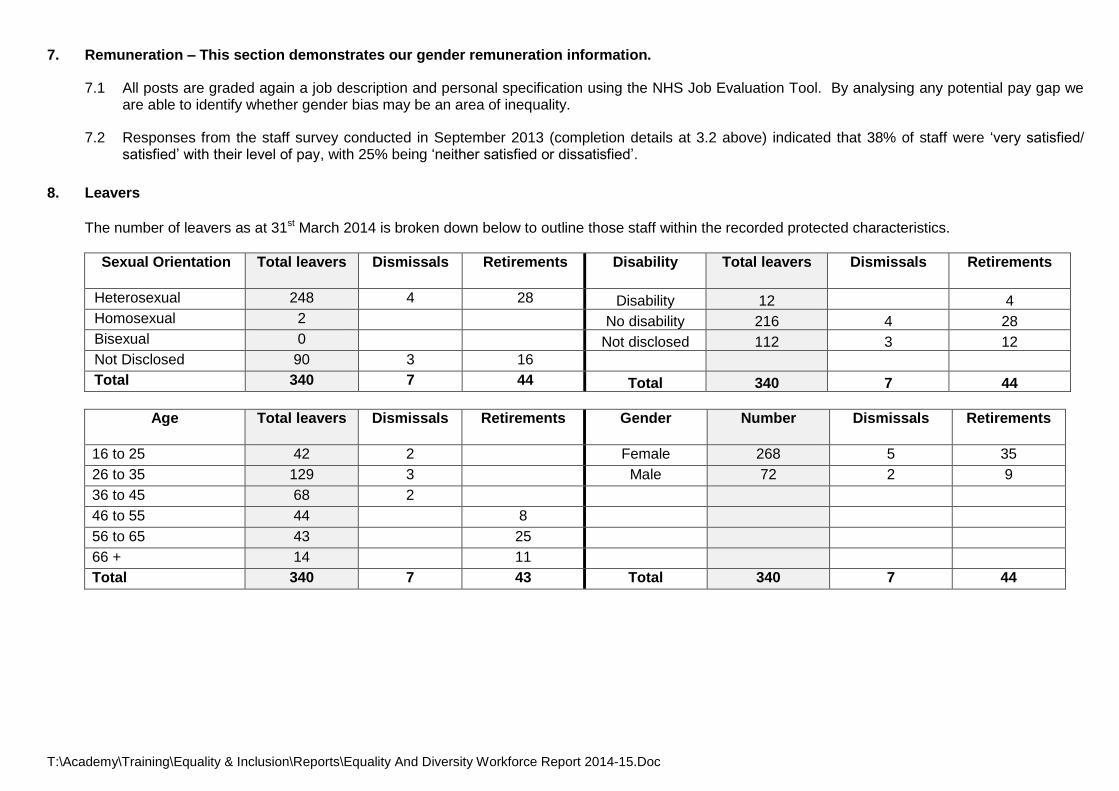
8. Leavers
The number of leavers as at 31st March 2014 is broken down below to outline those staff within the recorded protected characteristics.
Sexual Orientation Total leavers Dismissals Retirements Disability Total leavers Dismissals Retirements
Heterosexual 248 4 28 Disability 12 4
Homosexual 2 No disability 216 4 28
Bisexual 0 Not disclosed 112 3 12
Not Disclosed 90 3 16
Total 340 7 44 Total 340 7 44
Age Total leavers Dismissals Retirements Gender Number Dismissals Retirements
16 to 25 42 2 Female 268 5 35
26 to 35 129 3 Male 72 2 9
36 to 45 68 2
46 to 55 44 8
56 to 65 43 25
66 + 14 11
Total 340 7 43 Total 340 7 44

T:\Academy\Training\Equality & Inclusion\Reports\Equality And Diversity Workforce Report 2014-15.Doc
Ethnic Origin Total leavers Dismissals Retirements
A White - British 211 3 19
B White - Irish 2
C White - Any other White background 50 2 17
D Mixed - White & Black Caribbean 1
E Mixed - White & Black African 1
F Mixed - White & Asian 2 1
G Mixed - Any other mixed background 2
H Asian or Asian British - Indian 16
J Asian or Asian British - Pakistani 4
K Asian or Asian British - Bangladeshi 1
L Asian or Asian British - Any other Asian background
9 1
M Black or Black British - Caribbean 1 1
N Black or Black British - African 5 1
R Chinese 2
S Any Other Ethnic Group 2
Not Disclosed 31 1 5
Grand Total 340 7 44
Pay Band Total leavers Dismissals Retirements Religious Belief Total leavers Dismissals Retirements
1 4 1
Atheism 34 1 1
2 56 3 10 Buddhism 2
3 17 9 Christianity 179 3 30
4 17 2 Hinduism 7
5 88 1 10 Islam 8
6 27 5 Sikhism 1
7 14 3 Other 18 1
8a 7
Not Disclosed 91 3 12
8c 4
Non AFC 6
Medical & Dental 100 2 5
Total 340 7 44 Total 340 7 44

T:\Academy\Training\Equality & Inclusion\Reports\Equality And Diversity Workforce Report 2014-15.Doc
9. Part-time working
9.1 The Trust operates promotes flexible working for staff and the following data provides details of those who work part time as at 31 March 2014. For
comparison of equality data, each protected characteristic is outlined.
T:\Academy\Training\Equality & Inclusion\Reports\Equality And Diversity Workforce Report 2014-15.Doc

T:\Academy\Training\Equality & Inclusion\Reports\Equality And Diversity Workforce Report 2014-15.Doc
10. Pregnancy, Maternity and Paternity Leave 10.1 The number of staff on maternity leave, as at 31 March 2014 was 49, 25 of which worked part time.
11. Employee Relations
The following data is taken from the 2013 staff survey responses and is separated into sub-sections relating to specific goals relating to equality and diversity. 11.1 Incident reporting - Staff were asked if they had witnessed errors, near misses or incidents in the last 12 months at this organisation and only 18%
reported that they had: 85% stated that there are encouraged to report such incidents and that action is taken accordingly.
11.2 Violence at work - Although 9% of staff reported that they had experience physical violence at work at the hands of patients or service users, they felt there is a clear system of reporting in place to ensure learning and reduction of further risk. Clearly, we would prefer that no staff have any such experiences, but whilst we can control to some extent the actions of our staff, it must be recognised that we cannot guarantee the actions of our patients and visitors.
11.3 Harassment/ Bullying - 17% of staff reported harassment or bullying at the hands of patients/ service users; 15% reported incidents at the hands of
staff/colleagues. There are systems in place to enable easy reporting of such incidents and the Trust’s LSMS is in post to assist and help to reduce instances throughout the trust. Every effort is made to control behaviour by our staff to alleviate such occurrences. However, it must be recognised that this ‘target’ relates to human behaviour which we cannot control.
11.4 Discrimination - 5% at the hands of users/ patients and 7% via staff/ colleagues. It is possible to break this down further, for example 34% reported
this because of their ethnicity and 17% because of their gender. As the data below testifies, the organisation employs a cross-section of staff from a variety of ethnic groups.
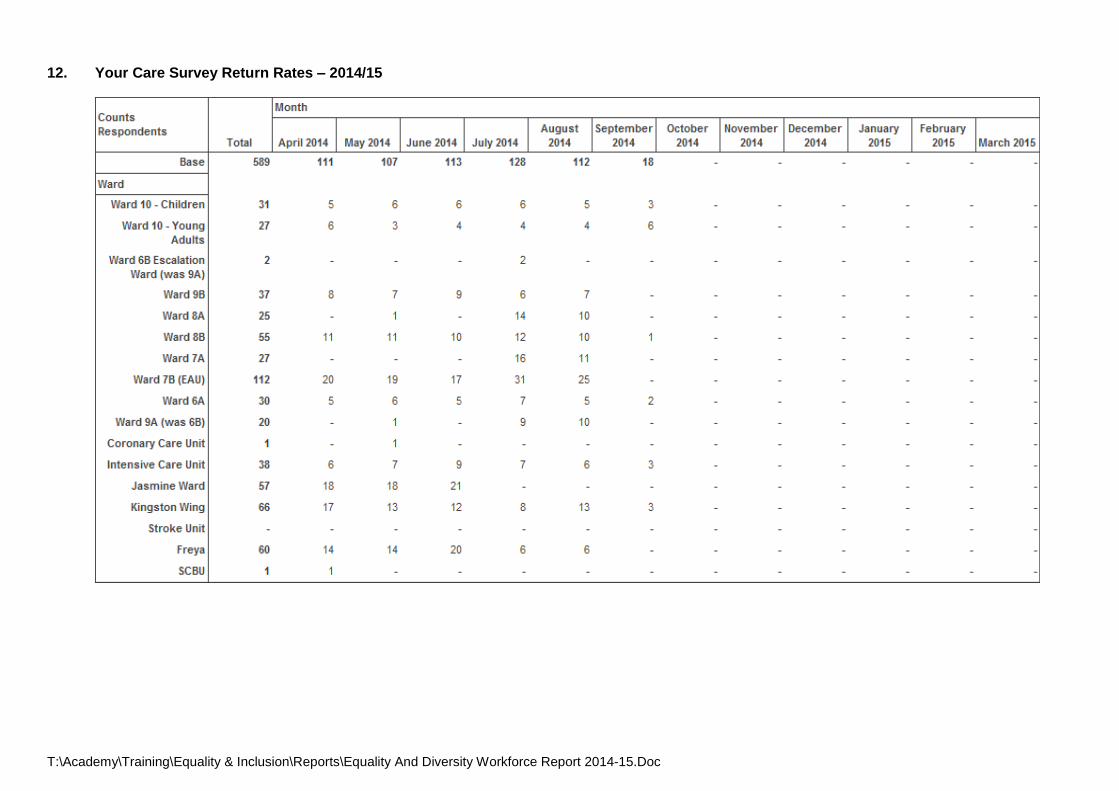
11.5 The Trust conducts ‘Your Care’ surveys on a monthly basis to evaluate staff morale. The data is collated by the Trust’s Clinical Governance
Department and a summary of the response rate for our clinical areas is in the table below.
T:\Academy\Training\Equality & Inclusion\Reports\Equality And Diversity Workforce Report 2014-15.Doc
12. Your Care Survey Return Rates – 2014/15

T:\Academy\Training\Equality & Inclusion\Reports\Equality And Diversity Workforce Report 2014-15.Doc
13. Friends & Family
13.1 April-August 2014 (monthly data collection): summary of YTD responses below. A further detailed breakdown of the responses for each area of the hospital is collated by the Clinical Governance department of the hospital.
46%
51%
42%
46%
46%
46%
26%
31%
28%
31%
29%
29%
61%
66%
45%
52%
83%
61%
44%
48%
36%
41%
56%
45%
0% 20% 40% 60% 80% 100%
Apr-14
May-14
Jun-14
Jul-14
Aug-14
YTD
Trustwide
Maternitytotal
14. CONTACTS
For further information on this Report please contact: Debbie Matthewson Elaine Cox Academy Manager & Trust’s Equality & Diversity Lead Academy Business Co-ordinator Telephone 01935 384585 Telephone 01935 348529 Email: [email protected] Email: [email protected]